

Abstract
The dynamin GTPase is known to bundle actin filaments, but the underlying molecular mechanism and physiological relevance remain unclear. Our genetic analyses revealed a function of dynamin in propelling invasive membrane protrusions during myoblast fusion in vivo. Using biochemistry, total internal reflection fluorescence microscopy, electron microscopy and cryo-electron tomography, we show that dynamin bundles actin while forming a helical structure. At its full capacity, each dynamin helix captures 12–16 actin filaments on the outer rim of the helix. GTP hydrolysis by dynamin triggers disassembly of fully assembled dynamin helices, releasing free dynamin dimers/tetramers and facilitating Arp2/3-mediated branched actin polymerization. The assembly/disassembly cycles of dynamin promote continuous actin bundling to generate mechanically stiff actin super-bundles. Super-resolution and immunogold platinum replica electron microscopy revealed dynamin along actin bundles at the fusogenic synapse. These findings implicate dynamin as a unique multifilament actin-bundling protein that regulates the dynamics and mechanical strength of the actin cytoskeletal network.
Cell-cell fusion is essential for the conception, development, regeneration and physiology of multicellular organisms1–3. A common theme underlying various cell-cell fusion events ranging from insects to mammals is the presence of actin-propelled invasive protrusions at the site of fusion, known as the fusogenic synapse4–10. Such invasive protrusions were first identified as part of an F-actin-enriched podosome-like structure (PLS) in Drosophila myoblast fusion6,11. The PLS is generated by the attacking fusion partner (fusion-competent myoblast (FCM)), which drills multiple invasive protrusions into the receiving fusion partner (muscle founder cell) to promote cell membrane juxtaposition, fusogen engagement and fusion pore formation6,12,8,13,14. Although each membrane protrusion has a diameter similar to that of a filopodium, these protrusions are mechanically stiffer than filopodia and are capable of triggering myosin II- and spectrin-mediated mechanosensitive responses in the receiving cell15,16. Interestingly, the invasive protrusions are propelled by Arp2/3-mediated branched actin polymerization. How branched actin filaments are organized to generate mechanically stiff membrane protrusions to promote cell fusion is unknown.
Dynamin is a large GTPase best known for its role in endocytosis. It also regulates the formation and/or function of F-actin-enriched cellular structures, such as podosomes17,18, invadopodia19, filopodia20, lamellipodia21, actin comet tails22,23, phagocytic cups24 and stress fibres25. Dynamin contains a G domain that catalyses GTP hydrolysis, three bundle-signalling elements mediating protein self-folding, two stalk domains critical for oligomerization, a pleckstrin homology (PH) domain that interacts with phosphatidyl-inositol-4,5-biphosphate and a proline-rich domain (PRD) for SH3 domain interaction and dynamin localization26. Dynamin catalyses membrane fission by forming rings/helices around the neck of a budding endocytic vesicle26. Within the dynamin helix, each monomer folds upon itself, resulting in its PH domain residing inside the helical turn, with the stalk regions forming the backbone, and the G domain at the outer rim27,28. Although the PRD is relatively unstructured and absent from crystal structures, it is predicted to extend outward of the dynamin helix beyond the G domain29. How dynamin interacts with actin remains a widely documented but poorly understood phenomenon. Previous studies suggest that dynamin bundles actin either directly30,31 or indirectly in a cortactin-dependent manner20,32,33. The direct binding of actin by dynamin was proposed to antagonize gelsolin-mediated filament capping, thus promoting polymerization at the barbed ends of the actin filaments30. The cortactin-mediated dynamin-actin interaction was thought to stabilize and bundle actin20,32,33. In either model, the precise mode and function of dynamin-actin interactions—in particular, how dynamin bundles actin filaments and how GTP hydrolysis by dynamin affects actin cytoskeletal dynamics—remain unclear.
Results
Dynamin is required for myoblast fusion in vivo and co-localizes with the F-actin foci at the fusogenic synapse.
The presence of a PLS at the fusogenic synapse6 prompted us to examine whether dynamin plays a role in Drosophila myoblast fusion. The single Drosophila dynamin, shibire (Shi), shares 67% protein sequence identity with human dynamins. Temperature-sensitive (ts) alleles of shi (shitsl and shits2), each containing a point mutation in the G domain, exhibited a severe myoblast fusion defect at restrictive temperature (34 °C) (Fig. 1a,b and Extended Data Fig. 1a–c). The unfused, mononucleated myoblasts in these mutant embryos expressed tropomyosin and muscle myosin heavy chain, indicating that they had properly differentiated (Fig. 1a and Extended Data Fig. 1a,b). Expressing wild-type Shi-green fluorescent protein (GFP) in all muscle cells or specifically in FCMs, but not in founder cells alone, in shits2 mutant embryos substantially rescued myoblast fusion at 34 °C (Fig. 1b and Extended Data Fig. 1d), showing that the fusion defect was caused by the loss of Shi in the FCMs. The homozygous mutant of the dynamin-interacting protein cortactin20,32,33 is viable as an adult34 and did not exhibit a fusion defect in embryos (Extended Data Fig. 1e), suggesting that cortactin does not have an essential function in Drosophila myoblast fusion.
Fig. 1 |. Shi promotes myoblast fusion by facilitating PLS invasion at the fusogenic synapse.
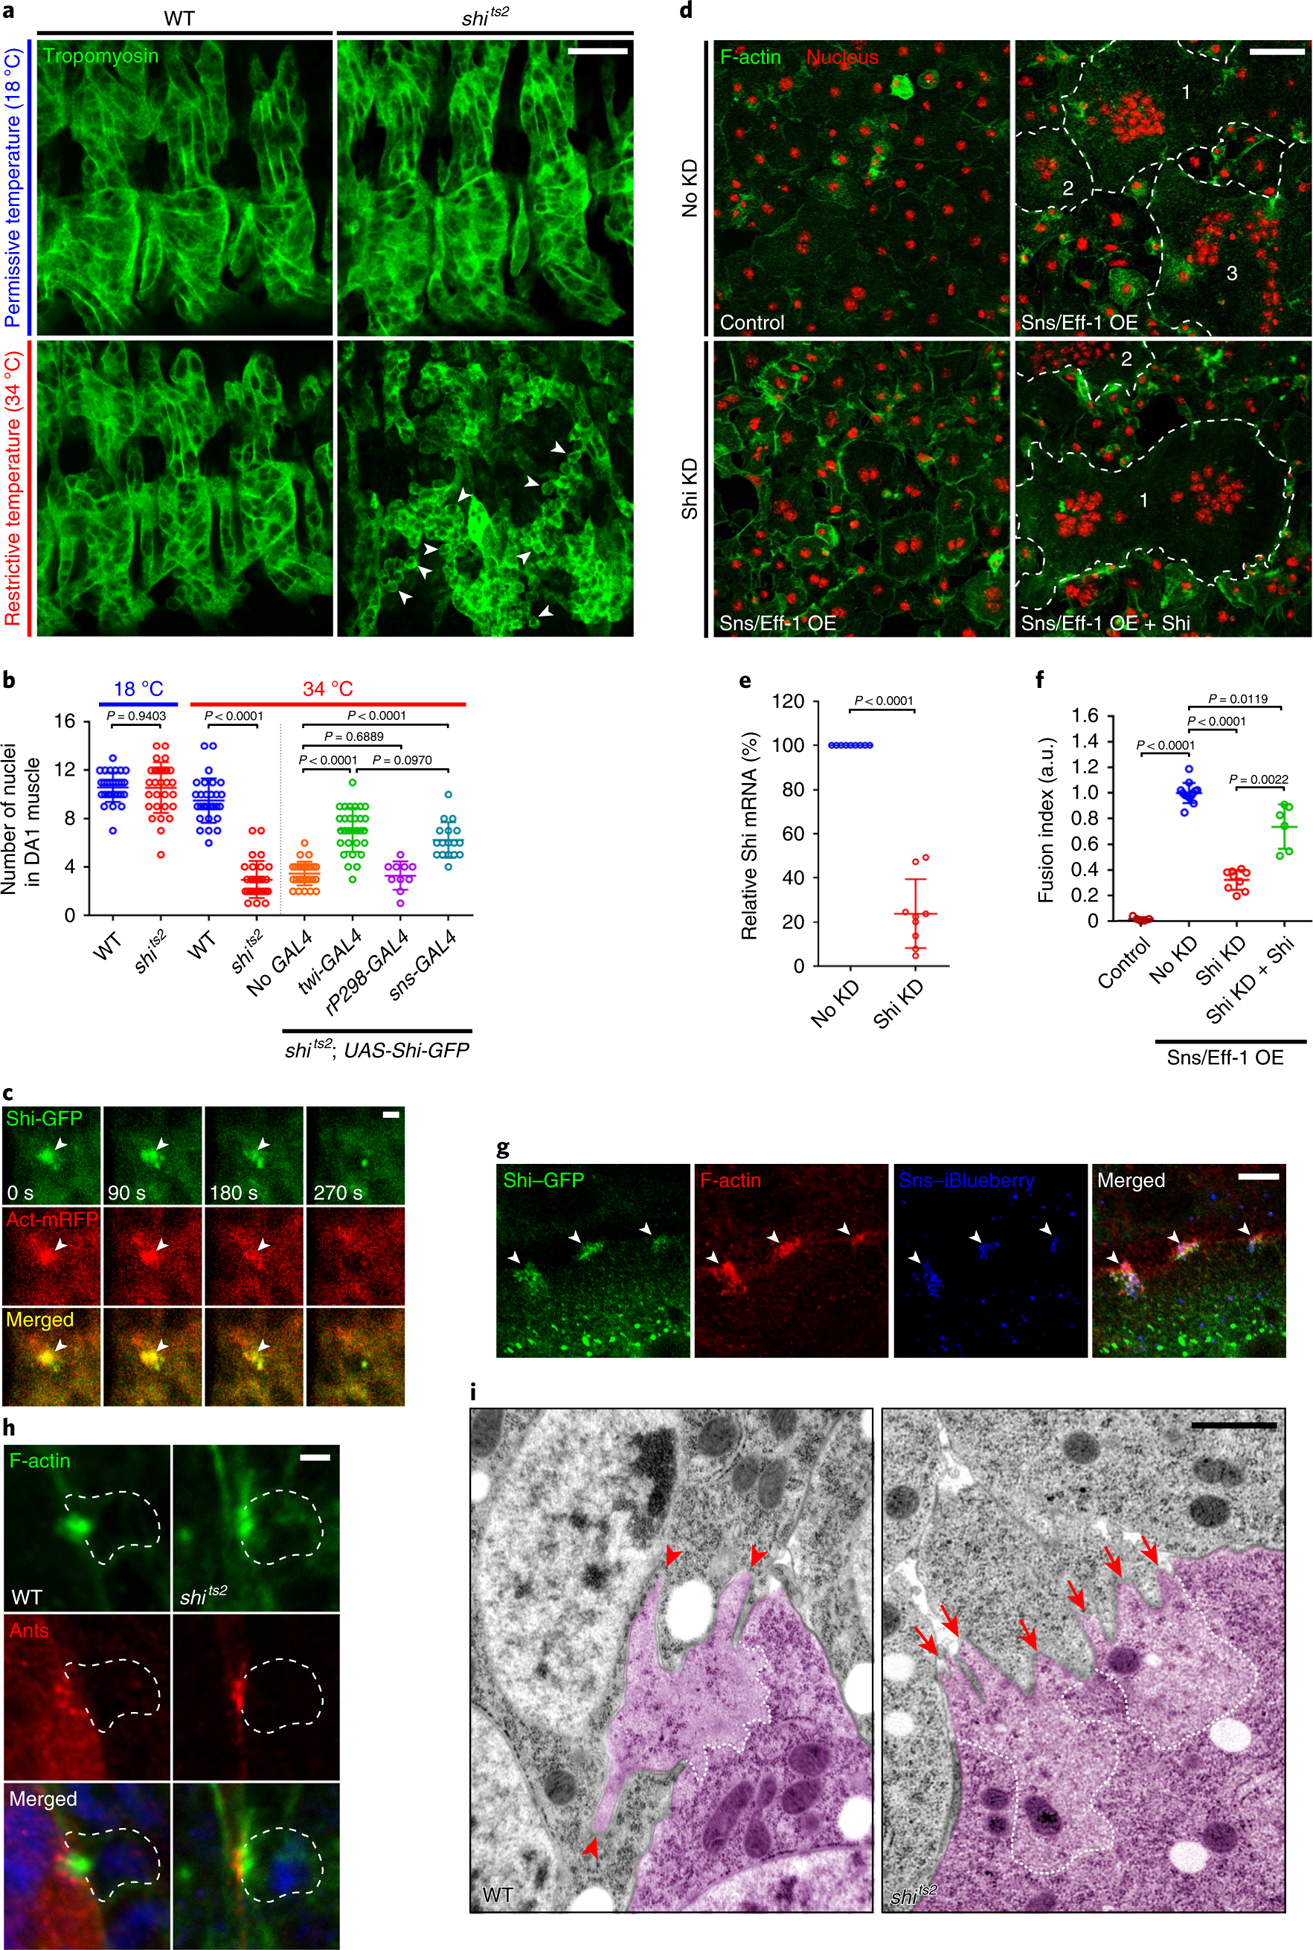
a, Defective myoblast fusion in the shi mutant embryo. Three hemisegments of somatic muscle (labelled with anti-tropomyosin) in stage 15 wild-type (WT) and shits2 mutant embryos are shown. Several mononucleated myoblasts in the shits2 mutant at the restrictive temperature are indicated by arrowheads. n = 11 (top left), 8 (bottom left), 40 (top right) and 74 (bottom right) embryos (biologically independent samples) were imaged, with similar results. b, Quantification of the fusion index. The numbers of Eve-positive nuclei in the dorsal acute 1 (DA1) muscle of stage 15 embryos were counted for each genotype in a and Extended Data Fig. 1d. n = 30, 30, 30, 30, 30, 30, 10 and 17 (left to right) DA1 muscles (biologically independent samples). Mean ± s.d. values are shown in the dot plot, and significance was determined by two-tailed Student’s t-test. c, Shi co-localizes with F-actin foci at fusogenic synapses in Drosophila embryos. Time-lapse stills of a stage 14 embryo expressing Shi–GFP and actin–mRFP are shown (see Supplementary Video 1). Shi–GFP and F-actin enrichment is indicated by the arrowheads. n = 31 fusogenic synapses (biologically independent samples) were analysed, with similar results. d, Shi promotes fusion in S2R+ cells. Snsand Eff-1-expresssing S2R+ cells fused to form multinucleated (≥3 nuclei) syncytia (outlined and numbered). Cells were labelled with phalloidin (F-actin) and Hoechst (nuclei). Shi knockdown inhibited cell fusion (bi-nucleated cells due to incomplete cytokinesis). n = 4 independent sets of experiments were performed, with similar results. KD, knockdown; OE, overexpression. e, Shi knockdown efficiency measured by quantitative PCR. n = 9 biologically independent sets of experiments. f, Quantification of the imaging results shown in d. The fusion index was determined as the percentage of the number of nuclei in multinucleated syncytia (≥3 nuclei) versus the total in transfected cells in each sample, normalized to the control. n = 5, 13, 9 and 6 (left to right) fusion indices pooled from four independent experiments. mRNA, messenger RNA. In e and f, mean ± s.d. values are shown in the dot plot, and significance was determined by two-tailed Student’s t-test. g, Shi co-localizes with F-actin foci at fusogenic synapses in S2R+ cells. Cells expressing Shi–GFP, Sns–iBlueberry and Eff-1 were labelled with phalloidin. Enrichment of Shi–GFP, Sns and F-actin is indicated by the arrowheads. n = 79 fusogenic synapses were imaged, with similar results. h, The F-actin foci at fusogenic synapses were less invasive in the shits2 mutant. Stage 14 wild-type and shits2 mutant embryos were labelled with phalloidin, anti-Antisocial/Rols49,50 (Ants; a founder cell-specific adaptor protein enriched at the fusogenic synapse) and Hoechst (blue) at the restrictive temperature. FCMs are outlined. n = 67 (wild type) and 38 (shits2) fusogenic synapses were imaged, with similar results. i, Electron micrographs of the fusogenic synapse in stage 14 wild-type and shits2 mutant embryos. FCMs are pseudo-coloured in purple. Dashed lines delineate the F-actin-enriched area of the PLS. The long invasive finger-like protrusions in the wild type are indicated by arrowheads, and short and spread out protrusions in the shits2 mutant are indicated by arrows. n = 9 (wild type) and 21 (shits2) fusogenic synapses were imaged, with similar results. Scale bars: 20 μm (a), 2 μm (c), 50 μm (d), 10 μm (g), 2 μm (h) and 1 μm (i). Numerical source data are provided with the paper.
Consistent with its role in FCMs, the Shi protein co-localized with the FCM-specific F-actin foci at the fusogenic synapse in fixed embryos (Extended Data Fig. 2a). In addition, live imaging of embryos co-expressing GFP-tagged Shi (Shi-GFP) and monomeric red fluorescent protein-tagged Actin (Actin-mRFP) in muscle cells revealed that Shi co-localized with the F-actin foci during their entire life span and dissolved together with the F-actin foci when fusion was completed (Fig. 1c and Supplementary Video 1). Recruitment of Shi to the fusogenic synapse depended on the FCM-specific cell adhesion molecule Sns, but not on the actin nucleation-promoting factors and their associated proteins, such as WASP, WASP-interacting protein/Solitary (Sltr) and Kette (in the Scar complex)5,12 (Extended Data Fig. 2a–e).
A general role for Shi in cell-cell fusion was supported by experiments in Drosophila S2R+ cells (of haemocyte origin) induced to fuse8 by co-expressing Sns and a Caenorhabditis elegans fusogen Eff-1, the latter of which resembles a type II virus fusogen required for cell fusion in C. elegans embryos and heterologous cells8,35–37. Knockdown of Shi in Sns- and Eff-1-expressing S2R+ cells using double-stranded RNA (dsRNA) against the 5’ untranslated region did not affect Eff-1 localization or concentration at the fusogenic synapse (Extended Data Fig. 2h), but resulted in a fusion defect, which was substantially rescued by Shi expression (Fig. 1d–f). As in Drosophila embryos, Shi co-localized with the F-actin foci at the fusogenic synapses in S2R+ cells (Fig. 1g and Extended Data Fig. 2i). In addition, Shi and F-actin co-localization was observed at actin-propelled protrusions in S2R+ cells expressing Sns alone, suggesting a general correlation between Shi and F-actin in these actin-enriched structures (Extended Data Fig. 2j). It is worth noting that although dynamin 2 has been implicated in the fusion of cultured mouse myoblasts and osteoclasts, as well as in viral fusogen-induced fusion of insect cells, the underlying mechanisms have remained unclear9,38–40.
Dynamin is required for generating invasive protrusions at the fusogenic synapse.
Confocal microscopy showed that founder cells were invaded by the FCM-specific PLS with an average depth of 1.1 ± 0.3 μm (n = 67) in wild-type embryos (Fig. 1h, left), compared with 0.6 ± 0.2 μm (n = 38; P< 0.0001) in shits2 mutant embryos (Fig. 1h, right). Consistent with this, transmission electron microscopy studies revealed that wild-type PLSs projected longer (384.4 ± 249.5 nm; n = 18 protrusions), albeit fewer protrusions (3.8 ± 1.3; n = 9 fusogenic synapses), compared with 139.3 ± 87.6 nm (n = 39 protrusions; P< 0.001) and 6.7 ± 2.2 (n = 21 fusogenic synapses; P < 0.001) in shits2 mutant embryos (Fig. 1i). In addition, the actin-enriched areas were devoid of ribosomes and intracellular organelles such as mitochondria in wild-type, but not in shits2 mutant, embryos. Thus, Shi is involved in organizing densely packed actin filaments and promoting the formation of long invasive protrusions at the fusogenic synapse. Despite the enrichment of dynamin at the fusogenic synapse, no endocytic pit accumulation was observed at 34 °C (Fig. 1i), as opposed to many that are found at the neuronal synapse41. In addition, neither clathrin light chain nor the a subunit of the AP-2 clathrin adaptor complex was enriched at the fusogenic synapse (Extended Data Fig. 2f,g). These data, together with the high cortical tension generated by the actin-propelled protrusions, suggest that the likelihood of plasma membrane retrieval by endocytosis at the fusogenic synapse is low and that dynamin may be involved in processes other than endocytosis at these sites. Consistent with this, it has been shown that inhibition of human dynamin 2 (hDyn2), but not endocytosis, perturbed podosome formation42.
Dynamin bundles actin filaments by forming regularly spaced rings/helices in vitro.
The co-localization of Shi with the actin structures and its role in promoting invasive protrusions prompted us to investigate the potential interaction between Shi and actin. Low-speed F-actin co-sedimentation assays revealed that purified Shi bundled F-actin in a concentration-dependent manner under low-ionic-strength conditions (50 mM KCl) known to allow the formation of higher-order structures of dynamin, such as rings and helices43,44 (Fig. 2a and Extended Data Fig. 3a). In addition, high-speed co-sedimentation assays showed that Shi bound actin (Extended Data Fig. 3b) with a Kd of 0.19 ± 0.03 μM (Extended Data Fig. 3c,d), similar to that of the hDyn1-actin interaction (~0.4 μM)30.
Fig. 2 |. Shi bundles actin filaments.
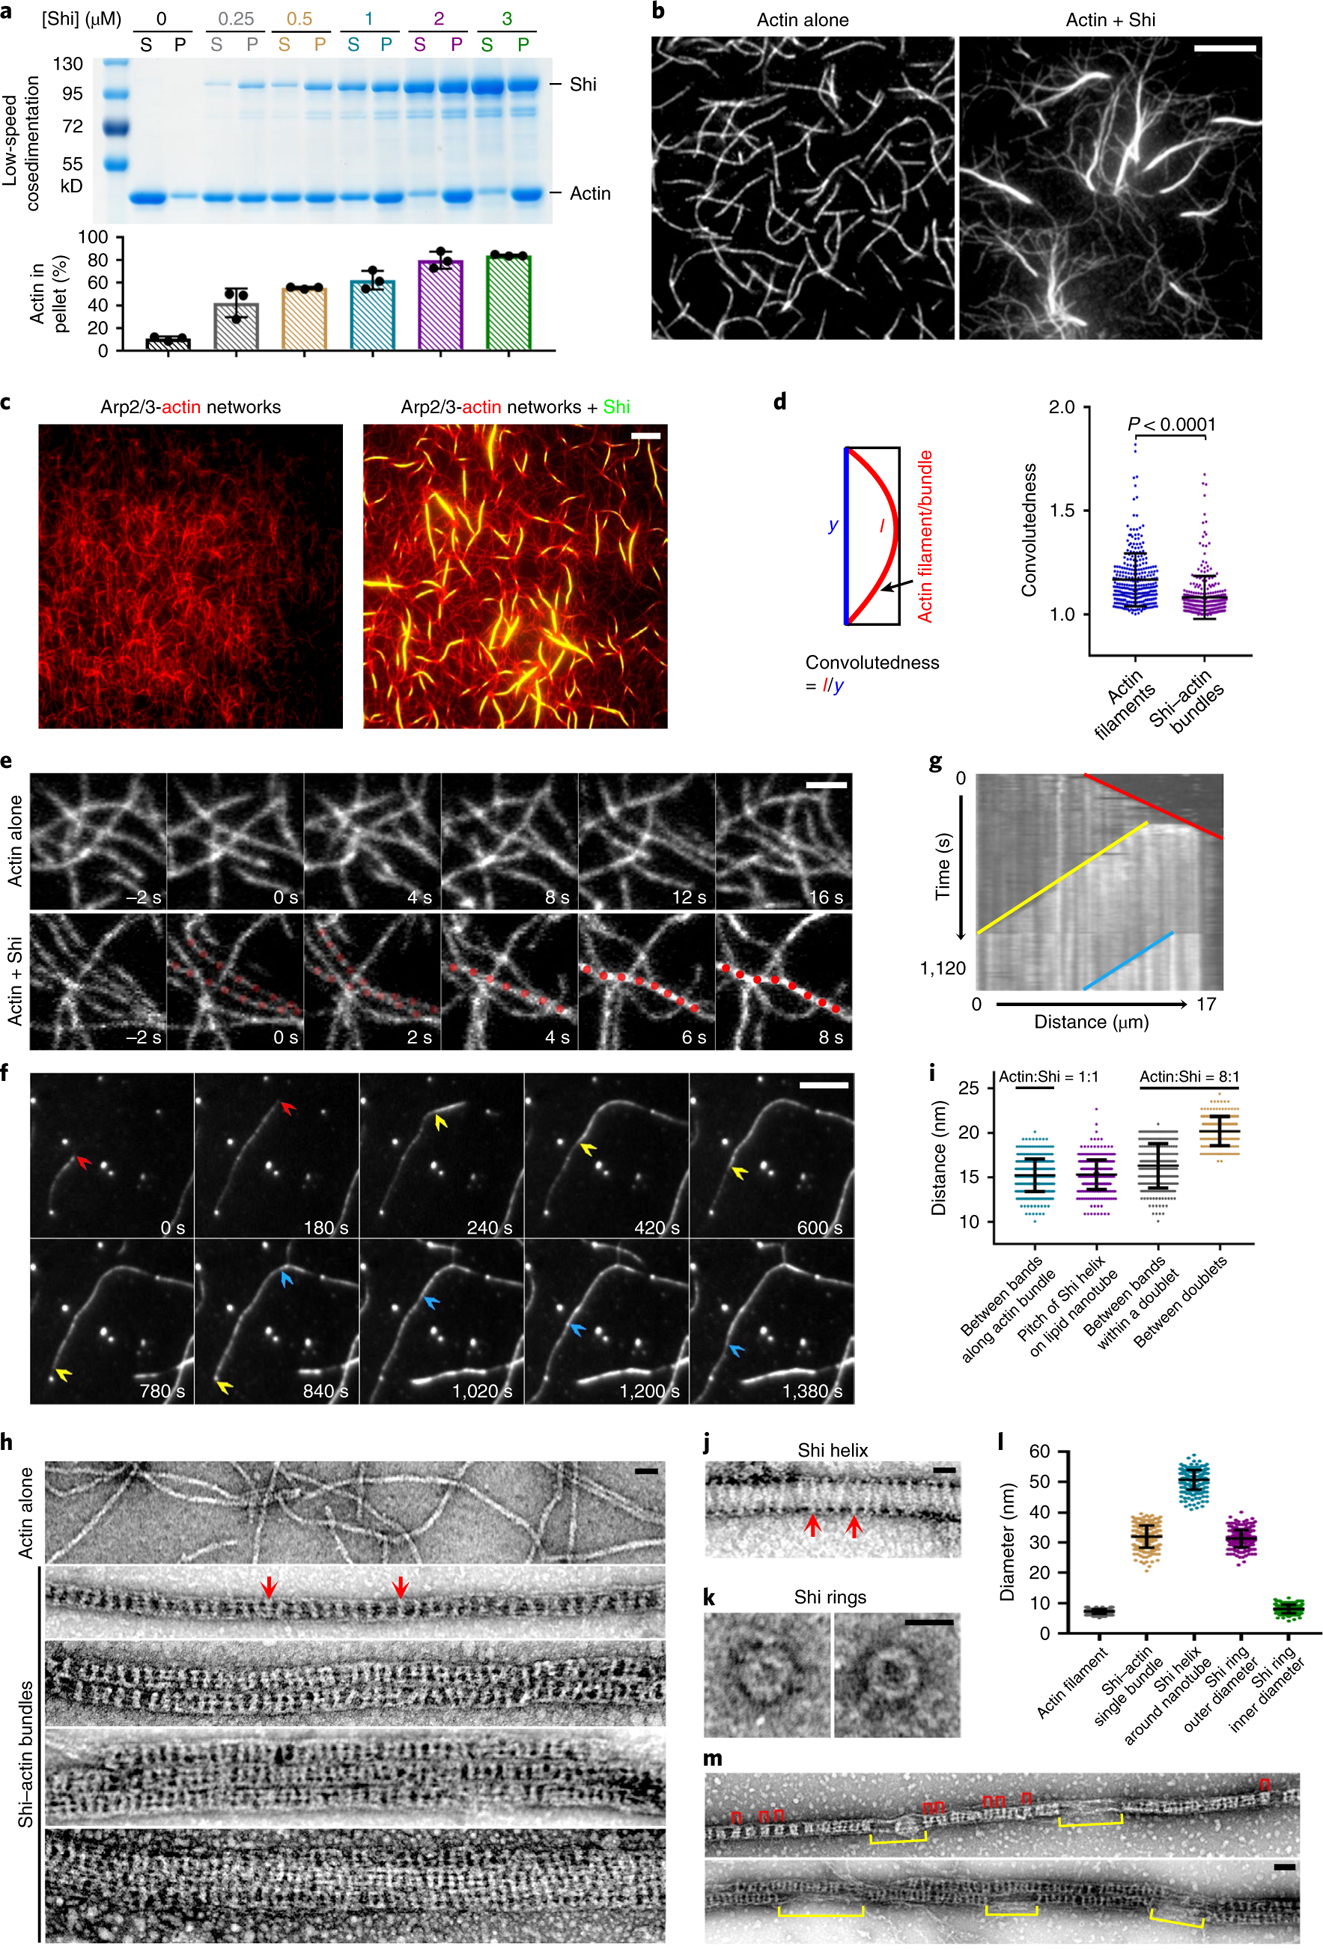
a, Shi bundles actin filaments in a dose-dependent manner. 3 μM actin was incubated with increasing concentrations of Shi. Supernatant (S) and pellet (P) were subjected to SDS-PAGE after low-speed centrifugation at 13,600g. The percentage of actin in the pellet versus total actin was quantified. Mean±s.d. values are shown in the bar graph. n = 3 independent experiments were performed. b,c, TIRF images of linear actin filaments (b, left), an Arp2/3-mediated branched actin network (c, left) and Shi-mediated actin bundles (pre-assembled actin filaments + Shi; b,c, right). n = 30 (b) and 12 (c) independent imaging experiments with similar results. d, Left: schematic of the measurement of convolutedness, defined as the ratio of traced filament length (l) to the length of the longest side of a bounding rectangle encompassing the same filament (y). Right: convolutedness of the actin filaments and Shi-mediated actin bundles from the experiments shown in b. n = 300 actin filaments or bundles. Mean±s.d. values are shown in the dot plot, and significance was determined by two-tailed Student’s t-test. e, Time-lapse stills of TIRF images showing Shi-mediated bundling of linear actin filaments (Supplementary Video 3). The bundled actin filaments are indicated by red dots. n = 10 independent imaging experiments were performed, with similar results. f, Time-lapse stills of TIRF images showing single actin filament bundling during polymerization (Supplementary Video 4). The fast-growing ends of three filaments are indicated by red, yellow and blue arrowheads, respectively. n = 22 actin bundles (biologically independent samples) were imaged, with similar results. g, Kymograph of the actin bundle formation shown in f. Three coloured lines indicate the tracks of the fast-growing ends of the first (red), second (yellow) and third (blue) filaments. n = 3 independent analyses were performed, with similar results. h, Electron micrographs of negatively stained actin filaments (top) and Shi-mediated actin bundles with an [actin]:[Shi] ratio of 1:1 (1 μM) (bottom four images). Single (second image), double (third image) and triple (fourth image) Shi-actin bundles are shown. Two light-coloured Shi bands are indicated by red arrows. The bottom image shows a multi-bundle with mostly synchronized Shi bands. From top to bottom: n = 140, 195, 30, 30 and 20 actin filaments/bundles were imaged, with similar results. i, Distances between the Shi bands shown in h, j and m. From left to right: n = 401, 418, 315 and 189 distances measured between adjacent pairs of Shi bands along actin bundles and lipid tubules, and within and between doublets along actin bundles, respectively. Mean±s.d. values are shown in the dot plot. j, Electron micrograph of a negatively stained Shi helix around a lipid nanotube. Two helical turns are indicated by arrows. n = 75 nanotubes (biologically independent samples) were imaged, with similar results. k, Electron micrographs of negatively stained Shi rings. n = 141 rings (biologically independent samples) were imaged, with similar results. l, Diameters of actin filaments, Shi-actin bundles, Shi helices around nanotubes, and the outer and inner ring of Shi alone. Left to right: n = 219, 259, 252, 282 and 198 diameters measured. Mean±s.d. values are shown in the dot plot. m, Electron micrographs of negatively stained single (top) and double Shi-actin bundles (bottom) with an [actin]:[Shi] ratio of 8:1 (1 μM actin). Shi ring doublets are indicated by red brackets, and segments of naked actin filaments not associated with stretches of Shi rings are indicated by yellow brackets. n = 212 actin bundles were imaged, with similar results. Scale bars: 5 μm (b, c and f), 2 μm (e), 30nm (h, j and k) and 50nm (m). Numerical source data and unprocessed blots are provided with the paper.
Using total internal reflection fluorescence (TIRF) microscopy, we observed that both linear actin filaments (in the absence of Arp2/3) and branched actin filaments (in the presence of Arp2/3) formed thick actin bundles when Shi or SNAP-tagged Shi (Shi-SNAP) was added to the actin polymerization reaction (Fig. 2b,c). Strikingly, Shi appeared to rapidly freeze the dynamically polymerizing branched actin network and crosslink the entire network by forming actin bundles at numerous locations (Supplementary Video 2). The Shi-actin bundles were straighter compared to single actin filaments, as measured by their convolutedness, indicating that they were mechanically stiffer (Fig. 2d). In fact, the Shi-actin bundles were sufficiently stiff to preclude measurement of mechanical properties by observing their thermally induced fluctuations. At the single-filament level, Shi-induced actin bundling could occur between two well-formed actin filaments (Fig. 2e and Supplementary Video 3) or between a founding filament and additional ones that were being polymerized alongside (Fig. 2f,g and Supplementary Video 4).
Negative-stain electron microscopy revealed that Shi formed regularly spaced, lighter coloured bands along the actin bundles when Shi and actin were mixed at equal concentrations (1 μM; Fig. 2h, top two images). The average distance between the Shi bands was 15.1 ± 1.8 nm (n = 401), comparable to the average pitch of Shi helices around lipid nanotubes (15.3 ± 1.6 nm; n = 418) (Fig. 2h–j). We temporarily refer to the Shi bands as Shi rings, although it was unclear at this resolution whether Shi formed individual rings or helices. In addition to single actin bundles, super-bundles were also observed in which two, three or more actin bundles aligned in parallel, each of which could be distinguished by the slightly out-of-sync Shi rings (Fig. 2h, third and fourth images). Occasionally, the Shi rings appeared more in sync across multiple actin bundles (Fig. 2h, bottom image). The average outer diameter of an actin bundle was 32.0 ± 3.6 nm (n = 259), similar to that of Shi rings alone (31.3 ± 2.9 nm; n = 282) (Fig. 2h,k,l), but smaller than that of Shi helices surrounding membrane nanotubes (50.7 ± 3.3 nm; n = 252) (Fig. 2j,l), suggesting that Shi rings may interact differently with actin filaments versus membrane tubules. At a lower Shi concentration (0.125 μM), Shi rings occupied isolated segments along the actin bundle and appeared to be arranged in doublets (Fig. 2m). The average distance between the two Shi rings in a doublet was 16.3 ± 2.5 nm (n = 315), and that between two doublets was 20.2 ± 1.6 nm (n = 189) (Fig. 2i,m). Interestingly, the sum of the two distances (~36.5 nm) largely coincided with a half helical pitch of actin (36 nm). Such characteristic spacing of Shi rings at a low Shi concentration suggests the existence of high-affinity binding sites for Shi on the actin filaments.
Like Drosophila Shi, hDyn1 and hDyn2 also formed regularly spaced rings that directly bundled actin, as shown by negative-stain electron microscopy (Fig. 3a, top three images for hDyn1 and top two images for hDyn2). The average distances between the hDyn1 and hDyn2 rings along the actin bundle (15.6 ± 1.4 nm (n = 307) and 15.4 ± 1.4 nm (n = 245), respectively; Fig. 3a,b) were similar to the average pitch of hDyn1 helices around nanotubes (15.4 ± 1.7 nm; n = 252; Fig. 3b,e). Moreover, the average outer diameter of the hDyn1 rings along the actin bundles (44.7 ± 3.0 nm; n = 220; Fig. 3a,c) was closer to the outer diameter of hDyn1 rings alone (40.2 ± 4.3 nm; n = 132) than that of hDyn1 around nanotubes (51.3 ± 1.8 nm; n = 226) (Fig. 3c–e).
Fig. 3 |. hDynl and hDyn2 bundle actin filaments.
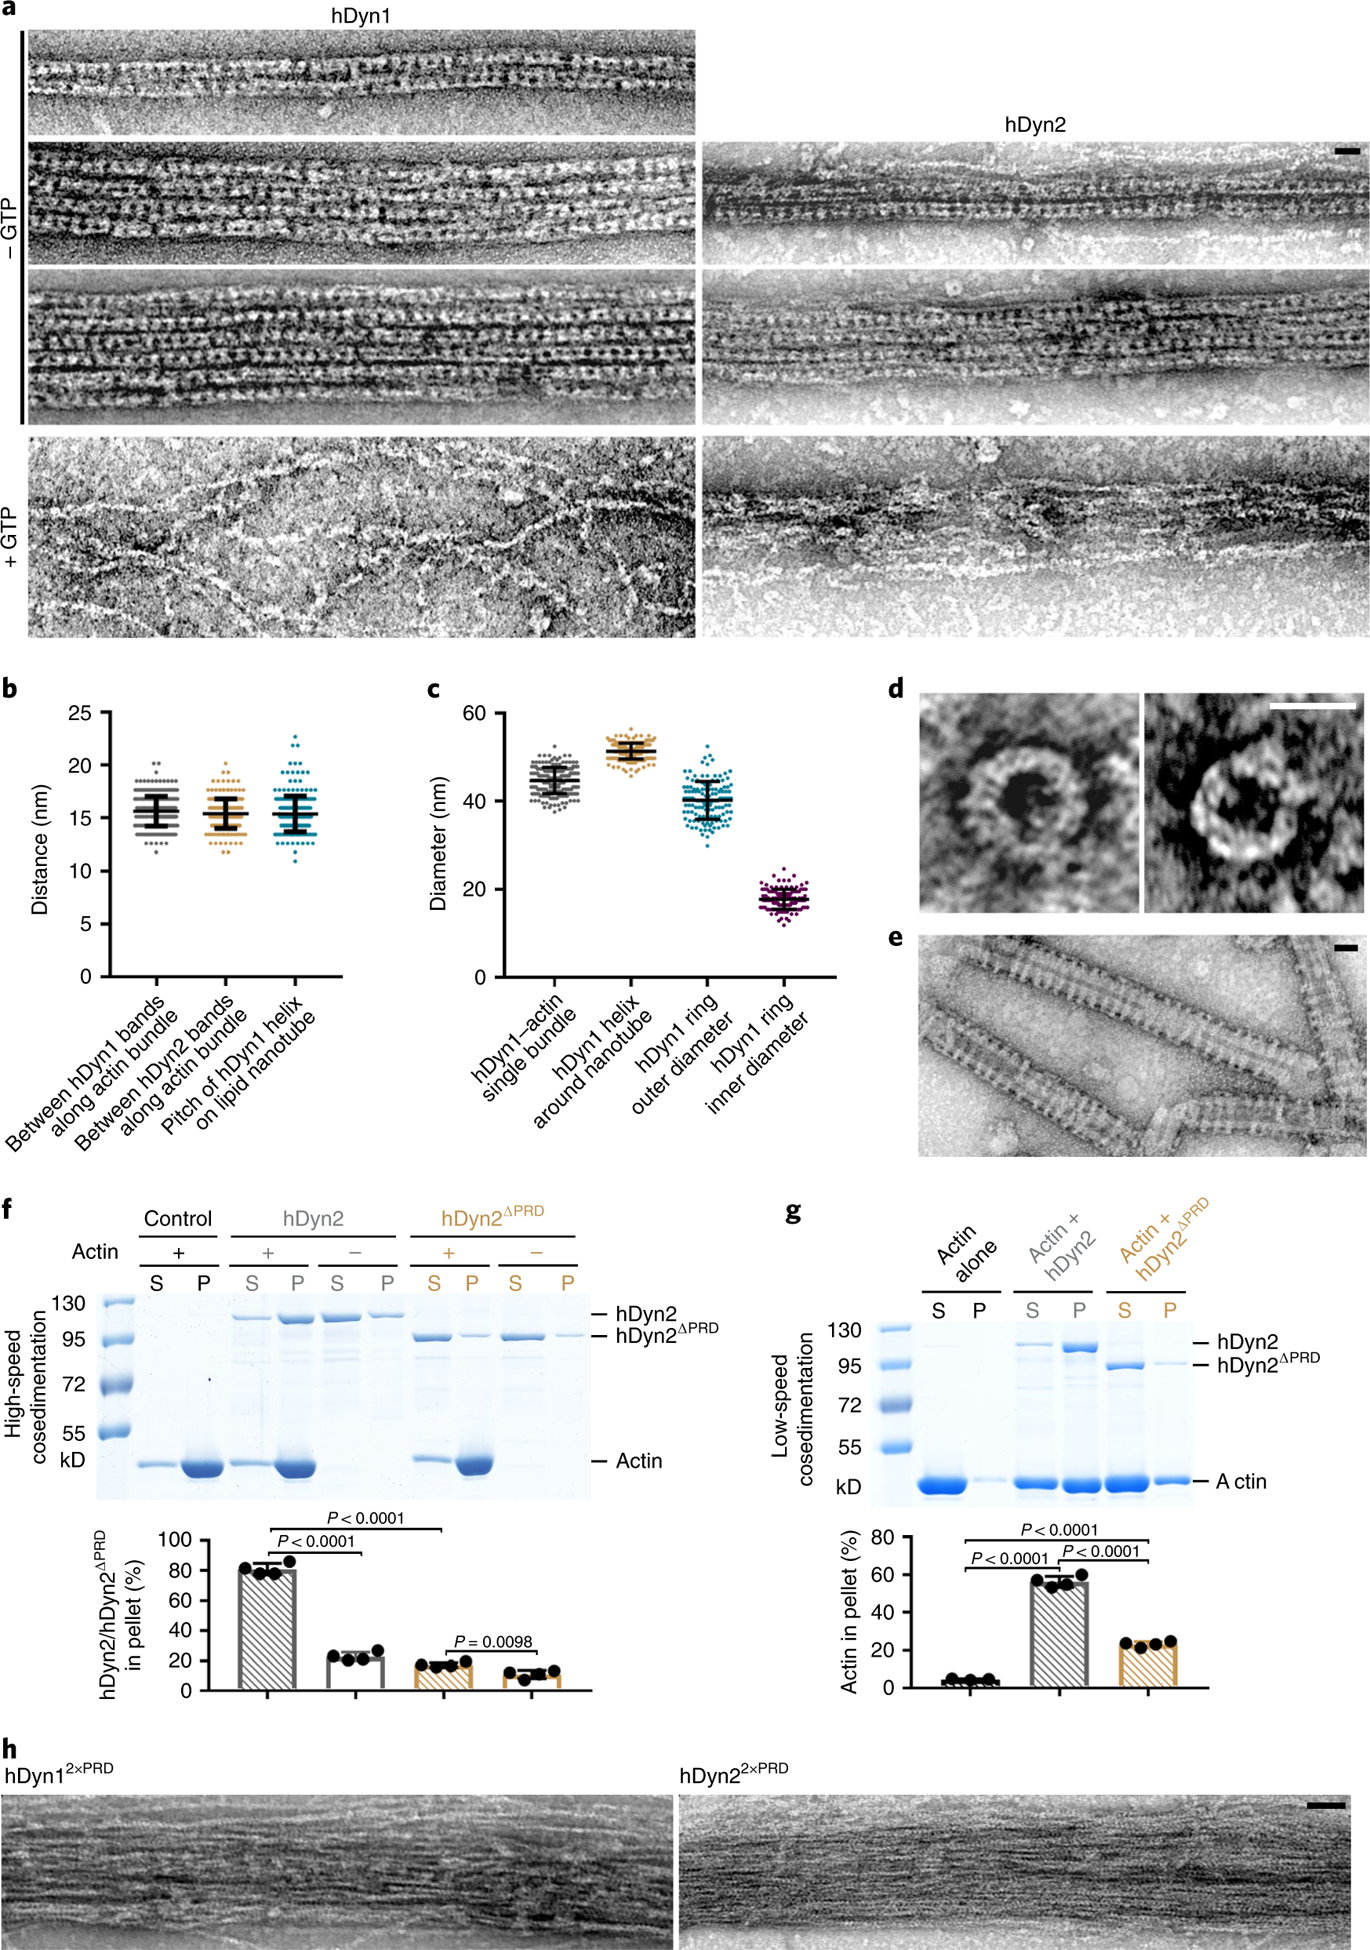
a, Electron micrographs of negatively stained actin filaments organized by hDynl (left) or hDyn2 (right) in the presence or absence of GTP. Both hDynl and hDyn2 formed regularly spaced bands along single (top images for each), double (second images for each) and triple (third image for hDynl) bundles. GTP addition disassembled the dynamin rings and the actin bundles (bottom images for both). For hDynl (top to bottom): n = 72, 54, 14 and 32 actin filaments/bundles were imaged, with similar results. For hDyn2, n = 82, 22 and 23 actin filaments/bundles were imaged. b, From left to right: distances between the hDynl bands along the actin bundle shown in the top left image in a; distances between the hDyn2 bands along the actin bundle shown in the top right image in a; and pitches of hDynl helices on the lipid nanotube shown in e. n = 307, 245 and 252 distances, respectively. Mean±s.d. values are shown in the dot plot. c, Diameters of (from left to right): hDynl-actin bundles; hDynl helices around nanotubes; and the hDynl ring alone shown in d (outer and inner diameter). n = 220, 226, 132 and 131 diameters measured, respectively. Mean±s.d. values are shown in the dot plot. d, Electron micrographs of negatively stained hDynl rings. n = 66 rings were imaged, with similar results. e, Electron micrographs of negatively stained hDynl helices around lipid nanotubes. n = 230 nanotubes were imaged, with similar results. f, High-speed co-sedimentation assay of the actin-binding activity of hDyn2 and hDyn2ΔPRD. hDyn2 (or hDyn2ΔPRD) was incubated alone or with actin, and supernatants and pellets were subjected to SDS-PAGE after centrifugation at 50,000g. The percentage of hDyn2 (or hDyn2ΔPRD) in the pellet versus total protein was quantified. n = 4 independent experiments were performed. Mean±s.d. values are shown in the dot plot, and significance was determined by two-tailed Student’s t-test. g, Low-speed co-sedimentation assay of the actin-bundling activities of hDyn2 and hDyn2ΔPRD. Actin was incubated alone or with hDyn2 (or hDyn2ΔPRD). Assays were performed and quantified as in Fig. 2a. From left to right: n = 3, 4 and 4 independent experiments. Mean±s.d. values are shown in the dot plot, and significance was determined by two-tailed Student’s t-test. h, Electron micrographs of negatively stained actin filaments in the presence of hDyn12xPRD or hDyn22xPRD. n = 21 (left) and 16 (right) actin bundles were imaged, with similar results. Scale bars: 30nm (a, d, e and h). Numerical source data and unprocessed blots are provided with the paper.
The PRD of dynamin plays a primary role in mediating dynamin-actin interactions.
To map the specific actin-binding sites in dynamin, we first mutated four positively charged residues in the stalk region of Shi, K410/417/422E and R411E (ShiAKE), corresponding to the human Dyn1K414/415/419/421/426E (Dyn1AKE) mutant that was reported to impair the dynamin 1-actin interaction30. ShiAKE was expressed at a lower level than wild-type Shi in S2R+ cells, suggesting that the mutant protein is unstable (Extended Data Fig. 3e,f). Despite this, the small amount of purified ShiAKE was able to bundle actin, albeit lacking the characteristic Shi rings along the actin bundle (Extended Data Fig. 3g). These results suggest that the AKE mutations may affect Shi’s normal assembly to form higher-order structures and that Shi interacts with actin using other domain(s). Surprisingly, a Shi mutant carrying a deletion of the PH domain (ShiΔPH) bound and bundled actin as effectively as wild-type Shi (Fig. 4a,b and Extended Data Fig. 4a,b), even though ShiΔPH failed to form helices around lipid nanotubes as predicted (Extended Data Fig. 4c). Thus, the PH domain is not required for Shi-actin interaction and Shi does not appear to wrap actin filaments in the middle of the rings.
Fig. 4 |. The PRD of Shi mediates Shi-actin interaction.
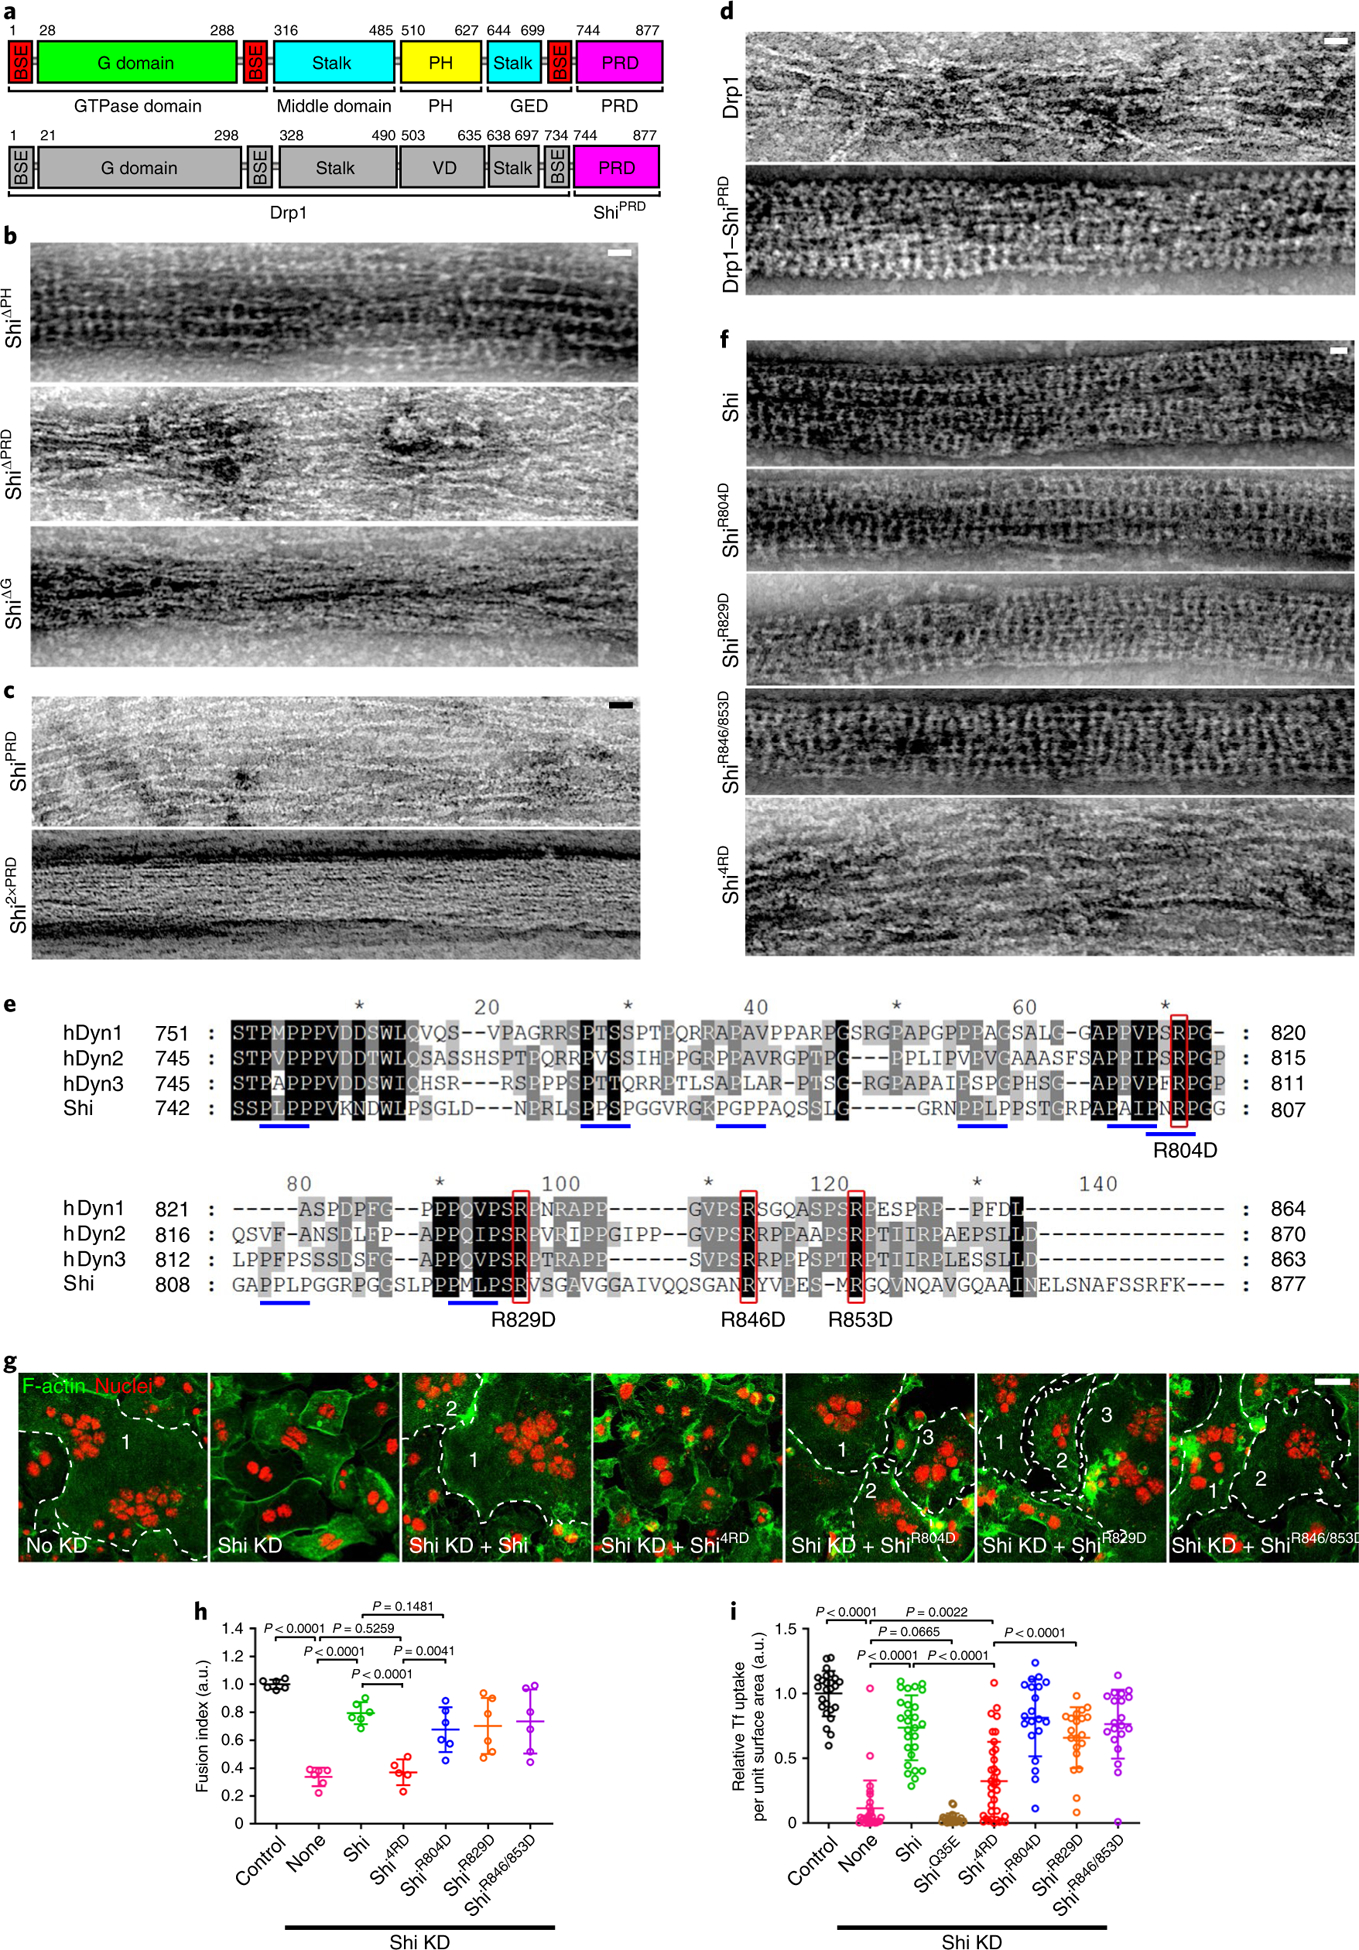
a, Schematic of the Shi domain structure (top) and the recombinant protein Drp1-ShiPRD (bottom). The amino acid numbers at the beginning and end of some of the domains are indicated. BSE, bundle-signalling element; GED, GTPase effector domain; VD, variable domain. b-d and f, Electron micrographs of negatively stained actin filaments (1 μM) in the presence of: 1 μM Shi deletion mutants (ShiΔPH, ShiΔPRD or ShiΔG) (b); 1 μM ShiPRD or Shi2xPRD (c); 2 μM Drp1 or Drp1-ShiPRD (d); and 1 μM Shi or PRD mutants (f). n = 54, 21 and 17 (b, top to bottom), 13, 27 (c, top to bottom), 5, 59 (d, top to bottom), 12, 12, 41, 16 and 24 (f, top to bottom) actin bundles were imaged, with similar results. e, Sequence alignment of the PRDs from hDyn1 (NP_004399.2), hDyn2 (NP_001005360.1), hDyn3 (NP_056384.2) and Drosophila Shi (NP_727910.1). The black, dark grey and light grey shading represents 100%, 80% and 60% sequence conservation, respectively. Red boxes indicate highly conserved arginine residues in the PRD. Blue underlines indicate PxxP motifs in Shi. Asterisks mark every 20 amino acids starting from number 10. g, Shi4RD failed to rescue the fusion defect in Shi knockdown S2R+ cells expressing Sns and Eff-1. Cells were labelled with phalloidin and Hoechst. Multinucleated (≥3 nuclei) syncytia are outlined and numbered. n = 3 independent experiments were performed, with similar results. h, Quantification of the results shown in g. From left to right: n = 6, 6, 6, 5, 6, 6 and 6 fusion indices were pooled from three independent sets of experiments. Mean± s.d. values are shown in the dot plot, and significance was determined by two-tailed Student’s t-test. i, Quantification of the transferrin (Tf) uptake assays shown in Extended Data Fig. 6b, as measured by the number of transferrin vesicles per unit surface area of the cell, normalized to the control. Left to right: n = 25, 28, 27, 22, 35, 20, 20 and 20 cells (biologically independent samples) pooled from four independent experiments. Mean±s.d. values are shown in the dot plot, and significance was determined by two-tailed Student’s t-test. Scale bars: 30 nm (b-d and f) and 20 μm (g). Numerical source data are provided with the paper.
Deleting the PRD domain (ShiΔPRD) decreased Shi’s actin-binding and -bundling activities, as shown by high-/low-speed co-sedimentation assays (Extended Data Fig. 4a,b). Consistent with this, negative-stain electron microscopy revealed that ShiΔPRD failed to organize actin filaments into tight bundles (Fig. 4b), despite forming normal helices around lipid nanotubes (Extended Data Fig. 4c). Since PRD is known for SH3 interaction, we tested whether isolated SH3 domains would interfere with the PRD-actin interaction. Although SH3 domains compromised the Shi-actin interaction, a substantial portion of Shi remained in the pellet in the high-speed sedimentation assay, suggesting that the PRD can accommodate interactions with SH3 domains and actin simultaneously (Extended Data Fig. 4d). hDyn2ΔPRD also exhibited decreased activities in actin binding and bundling, demonstrating a conserved function of PRD in the dynamin-actin interaction (Fig. 3f,g). Notably, deleting the G domain (ShiΔG) also decreased Shi’s actin-bundling activity, albeit to a lesser extent than deleting the PRD (Extended Data Fig. 4a,b). Negative-stain electron microscopy revealed that ShiΔG could bundle actin to some extent (probably due to the presence of the PRD) without forming regularly spaced rings (Fig. 4b). Taken together, these results suggest that the PRD is the primary actin-binding domain in dynamin and that the G domain may play a minor role in facilitating PRD in bundling actin and/or in enhancing ring assembly to position the PRDs for efficient actin binding.
To test whether the PRD is sufficient for actin binding/bundling, we purified the Shi PRD and a tandem repeat of PRD (2×PRD). 2×PRD exhibited higher actin-binding/-bundling activity than that of PRD (Extended Data Fig. 4e,f), and 2×PRD organized tight actin bundles despite not forming regularly spaced rings (Fig. 4c). Similarly, the 2×PRD of both hDyn1 and hDyn2 also bundled actin filaments (Fig. 3h). Therefore, PRD binds actin and the tandem PRD functions as an artificial two-filament actin crosslinker. Furthermore, fusing the Shi PRD domain to the carboxy terminus of Drosophila dynamin-related protein 1 (Drp1), which is required for mitochondrial fission45 and does not contain a PRD (Fig. 4a), converts Drp1 from a weak to a strong actin-bundling protein, as demonstrated by the tight actin bundles organized by regularly spaced Drp1-ShiPRD rings (Fig. 4d and Extended Data Fig. 5a). Consistent with this, Drp1-ShiPRD, but not Drp1, partially rescued the fusion defect in Sns- and Eff-1-expressing Shi knockdown cells (Extended Data Fig. 5b). The partial rescue may be due to the requirement of a higher concentration of Drp1-ShiPRD than that of Shi to organize tight actin bundles (Extended Data Fig. 5a). Consistent with this, overexpressing Drp1-ShiPRD, which was enriched at the fusogenic synapse (Extended Data Fig. 5c), exhibited a dominant negative effect in wild-type cell fusion, presumably by interfering with the function of endogenous Shi (Extended Data Fig. 5b). Taken together, these results demonstrate that the PRD is the primary actin-binding domain in dynamin.
Point mutations in the PRD are required for actin bundling.
To gain further insight into the PRD-actin interaction, we mutated four highly conserved, positively charged Arg residues (R804, 829, 846 and 853) to negatively charged Asp in the Shi PRD (Fig. 4e). While the single mutants (ShiR804D and ShiR829D) and the double mutant (ShiR846/853D) did not affect the Shi-actin interaction, the quadruple mutant (ShiR804/829/846/853D or Shi4RD) exhibited a substantial decrease in actin binding/bundling (Fig. 4f and Extended Data Fig. 5d,e). Furthermore, Shi4RD, but not the single or double mutants, failed to rescue the fusion defect in Sns- and Eff-1-expressing Shi knockdown cells (Fig. 4g,h), despite co-localizing with the F-actin foci at the fusogenic synapse (Extended Data Fig. 6a). The normal localization of the Shi mutants was probably mediated by PxxP-SH3 domain interactions, because most of the PxxP motifs in the PRD were not disrupted by the mutations (Fig. 4e). Although Shi4RD was unable to rescue cell fusion (Fig. 4g,h), it partially rescued the endocytosis defect in Shi knockdown cells (Fig. 4i and Extended Data Fig. 6b), supporting a potential role for dynamin-mediated actin bundling in endocytosis.
Multiple actin filaments are associated with the outer rim of the dynamin helix.
The specific PRD-actin interaction suggests that actin filaments are likely to be attached to the outer rim of the dynamin ring where the PRD resides. Indeed, negative-stain electron microscopy revealed stretches of naked actin filaments running along the outer rim of the Shi rings at a low Shi concentration (0.125 μM) (Fig. 5a, top). Occasionally, the actin filaments were not bundled by dynamin at the ends. Such split ends allowed us to discern at least eight actin filaments within a Shi-actin bundle (Fig. 5a, bottom).
Fig. 5 |. Dynamin forms a helix that captures multiple actin filaments at the outer rim.
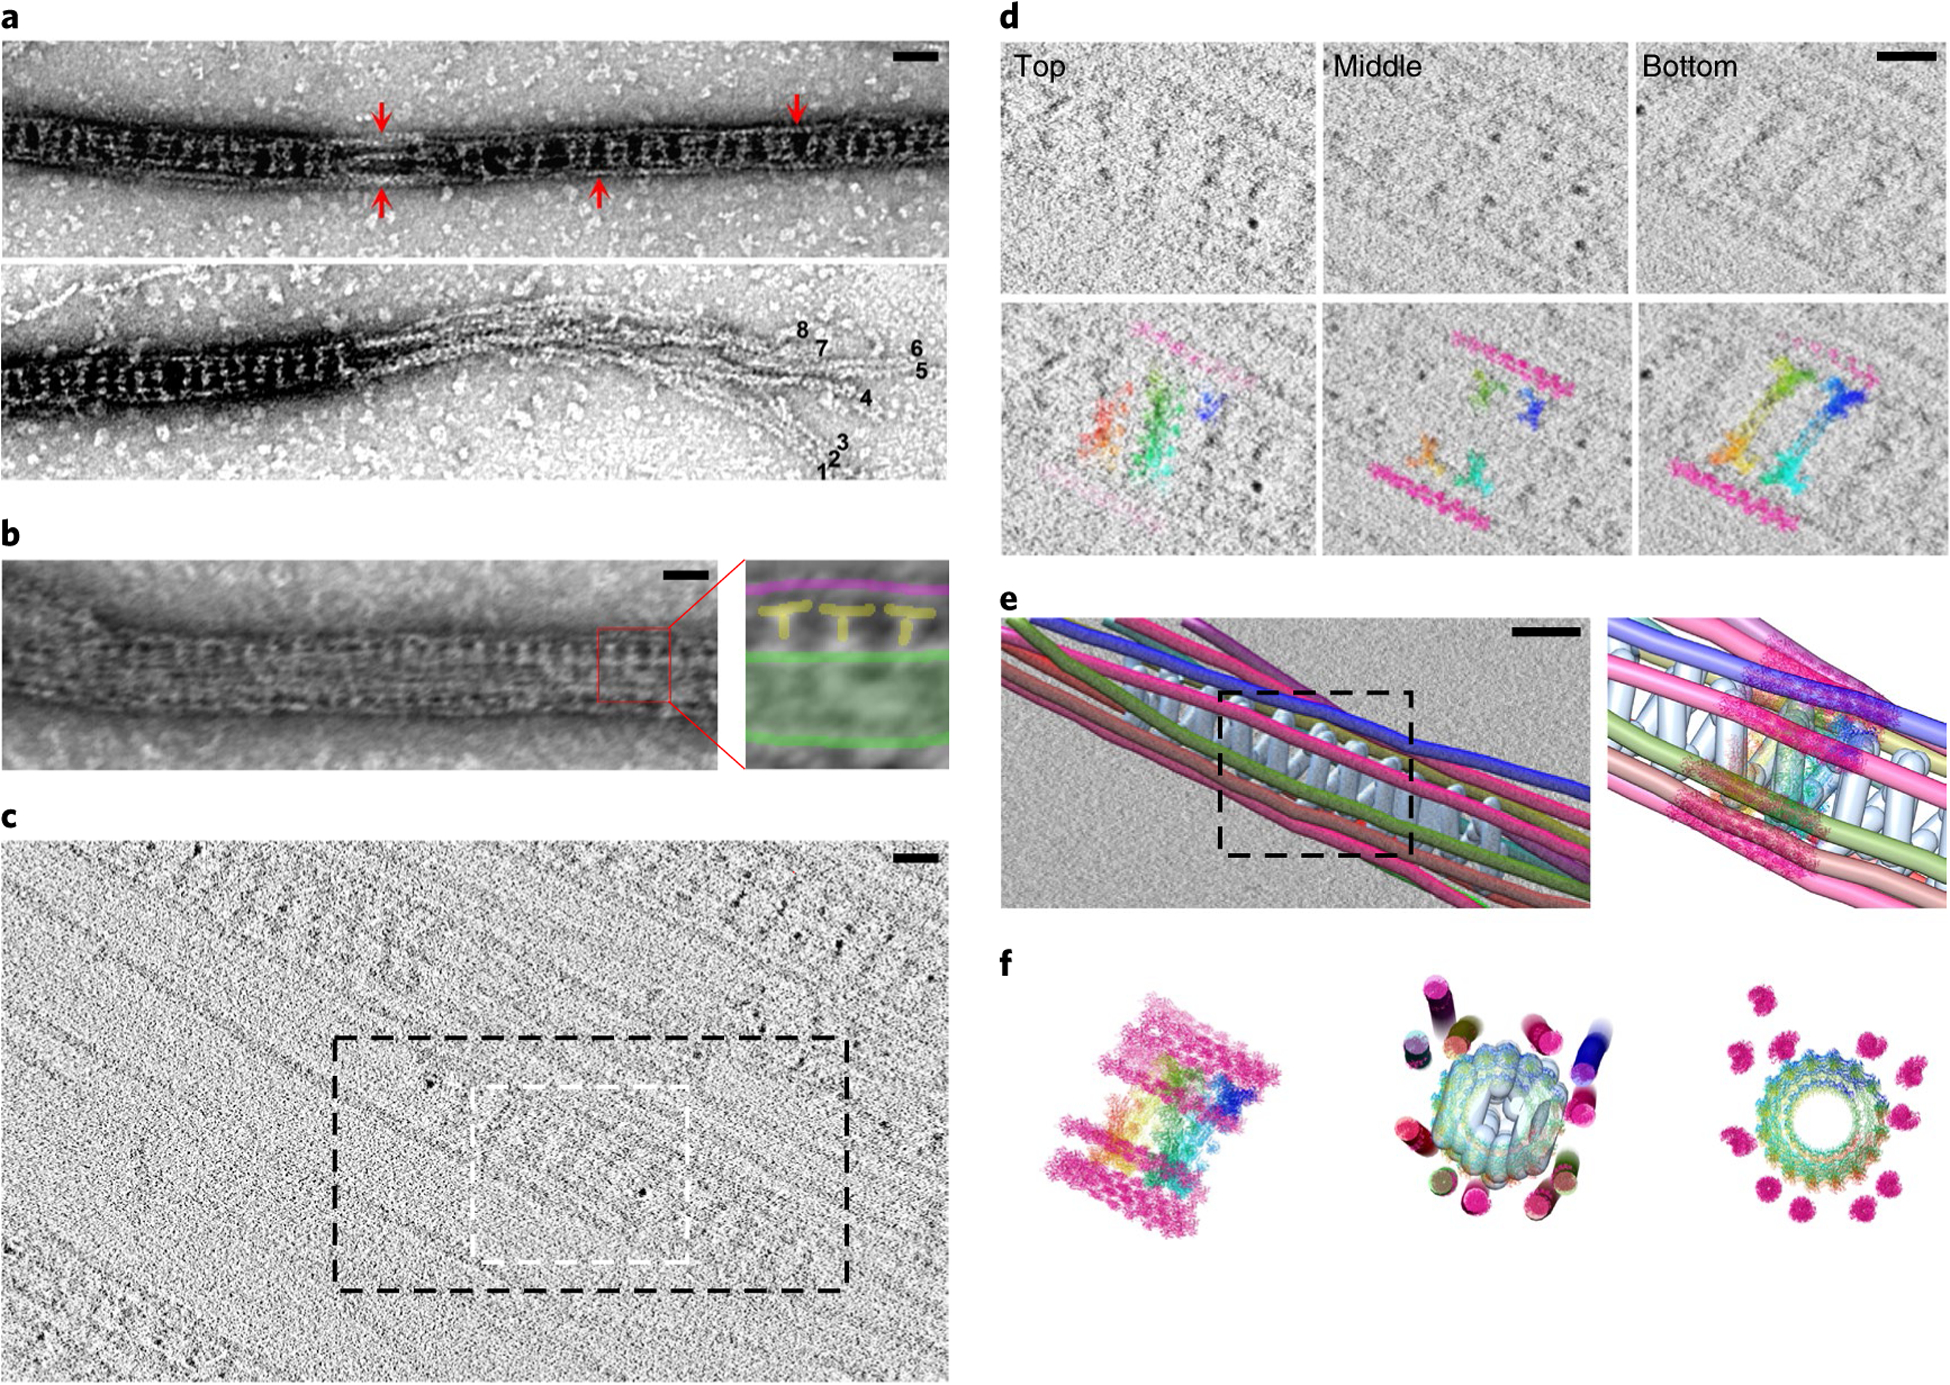
a, Electron micrographs of negatively stained Shi-actin bundles. Actin filaments located at the outer rim of the Shi rings are indicated by arrows (top). Eight actin filaments observed at the split end of the actin bundle are indicated by numbers (bottom). n = 30 (top) and 8 (bottom) actin bundles were imaged, with similar results. b, Electron micrograph of negatively stained Shi-lipid nanotube-actin bundles. The area shown by a red box in the left panel is enlarged on the right. The lipid nanotube is outlined in green, Shi is indicated by the letter T in yellow, and actin filaments are coloured magenta. n = 83 Shi-nanotube-actin bundles (biologically independent samples) were imaged, with similar results. c, Cryo-ET section illustrating several hDynl-mediated actin bundles. Sections through the white-boxed area are shown in d. The black box outlines the region selected for model building in IMOD, as shown in e and Extended Data Fig. 7a,b. n = 3 tomograms were collected, with similar results. d, Sections through the cryo-tomogram (c), with the molecular model manually docked into the tomogram. The top section reveals a right-handed tilt of hDynl; the middle section shows the T-shaped structures; and the bottom section shows a left-handed tilt of hDynl, consistent with a helical polymer. e, Model of a hDynl-mediated actin bundle manually generated in IMOD, with the hDynl helix coloured light blue and actin filaments on the outside rainbow coloured. A molecular model of hDynl and actin docked into the IMOD model is shown on the right (representing the boxed area on the left). f, Side view (left) and top views (middle and right) of a molecular model of the hDynl-mediated actin bundle. The middle panel shows the top view of the molecular model docked in the IMOD model. Note that not all of the actin filaments are closely associated with the hDynl helix in this particular segment. The images in d-f are representative of three experiments of tomograms showing the hDyn1-F-actin interaction. Scale bars: 30nm (a and b) and 20 nm (c-e). Numerical source data are provided with the paper.
To achieve a higher-resolution view of the dynamin-actin bundles, we performed cryo-electron tomography (cryo-ET) using hDyn1 (or Shi) with actin. Cryo-ET revealed that hDyn1 assembled as a helix with actin filaments attached to the outer rim (Fig. 5c–f, Extended Data Fig. 7a,b and Supplementary Video 5–8). The hDyn1 helices were evident by analysing the tomogram at different sections. The hDyn1 bands on the top section had a right-handed tilt, whereas the corresponding hDyn1 bands on the bottom section exhibited a left-handed tilt (Fig. 5d, Extended Data Fig. 7a and Supplementary Video 6). The middle section contained T-shaped structures characteristic of dynamin helices (Fig. 5d, Extended Data Fig. 7a and Supplementary Video 6). Based on the outer diameter (42 nm) and the pitch (16.8 nm) of the hDyn1 helix observed by cryo-ET, we modelled the hDyn1 helix and positioned the actin filaments based on the tomogram (Fig. 5e,f and Extended Data Fig. 7b). Since the length per turn (L) of the hDyn1 helix was 133 nm (L = (C2+H2)0.5, where C is the circumference and H is the height or pitch) and the distance between hDyn1 dimers was 8.3 nm, based on the high-resolution Cryo-ET map of hDyn146, we determined that there were ~16 hDyn1 dimers per turn (133 nm divided by 8.3 nm) of the hDyn1 helix along the actin bundle, which correlated with the helical parameters of a 22.5° twist and 10.5 Å rise between dimers. Segmentation of a particular actin bundle organized by the hDyn1 helix revealed 11 actin filaments associated with the outer rim (Fig. 5f, Extended Data Fig. 7b and Supplementary Video 6–8), corresponding to a partially occupied hDyn1 helix in which 11 of the 16 dimers per helical turn engaged with actin filaments. Similarly, Drosophila Shi was also assembled as a helix, the outer rim of which engaged actin filaments (Extended Data Fig. 7c,d and Supplementary Video 9). The Shi helix was narrower than that of hDyn1 and contained 12 Shi dimers per turn, based on the outer diameter (32 nm) and the helical pitch (15.1 nm). The eight-filament bundle shown in Fig. 5a is therefore a partially occupied Shi helix. Taken together, each dynamin-mediated actin bundle consists of a centrally localized dynamin helix and multiple actin filaments attached to its outer rim. Interestingly, when lipid nanotubes were added to the Shi/actin mix, the nanotubes were wrapped by Shi helices in the centre, with the actin filaments captured at the outer rim (Fig. 5b). This result suggests that the dynamin-mediated endocytosis and actin bundling are not mutually exclusive.
GTP hydrolysis of dynamin disassembles the dynamin helices and loosens the actin bundles.
All of the above experiments were performed in the absence of GTP, which is an energy molecule contained in every cell. To investigate how dynamin bundles actin filaments in vivo, we first examined how GTP affected dynamin-mediated actin bundling with purified proteins. Structured illumination microscopy (SIM) revealed that GTP addition decreased the amount of Shi-SNAP associated with the actin super-bundles, leaving sparselylocalized Shi-SNAP punctae (Fig. 6a). Under electron microscope, most of the Shi helices appeared to be disassembled upon GTP addition, resulting in loose actin bundles largely held together by some residual Shi helices (Fig. 6b,d). Consistent with this, low-speed co-centrifugation assay showed that Shi bundled actin in the presence of GTP (Extended Data Fig. 3h). Similar to Shi, hDyn1 and hDyn2 helices along actin bundles were disassembled upon GTP addition, resulting in loosened actin bundles (Fig. 3a, bottom images for hDyn1 and hDyn2). In contrast, point mutations in the Shi G domain that disable GTP hydrolysis, such as ShiQ35E (corresponding to hDyn1Q40E; Fig. 6b), ShiG141S (Drosophila ts2 mutant; hDyn1G146S; Fig. 6c) and ShiK137A (hDyn1K142A; Fig. 6b), completely or partially blocked GTP-induced Shi helix disassembly and actin bundle dissociation in the presence of GTP (at the restrictive temperature for ShiG141S). Similarly, both ShiΔPH and a point mutation in the PH domain (ShiI527A; hDyn1I533A) bundled actin normally but blocked GTP-dependent Shi helix disassembly and actin bundle dissociation (Fig. 6b). The GTPase activity of ShiΔPH remained similar to that of Shi (Fig. 7a–d), suggesting that the PH domain is involved in conformational changes required for Shi helix disassembly upon GTP hydrolysis.
Fig. 6 |. GTP hydrolysis disassembles Shi helices to allow branched actin polymerization and cell–cell fusion.
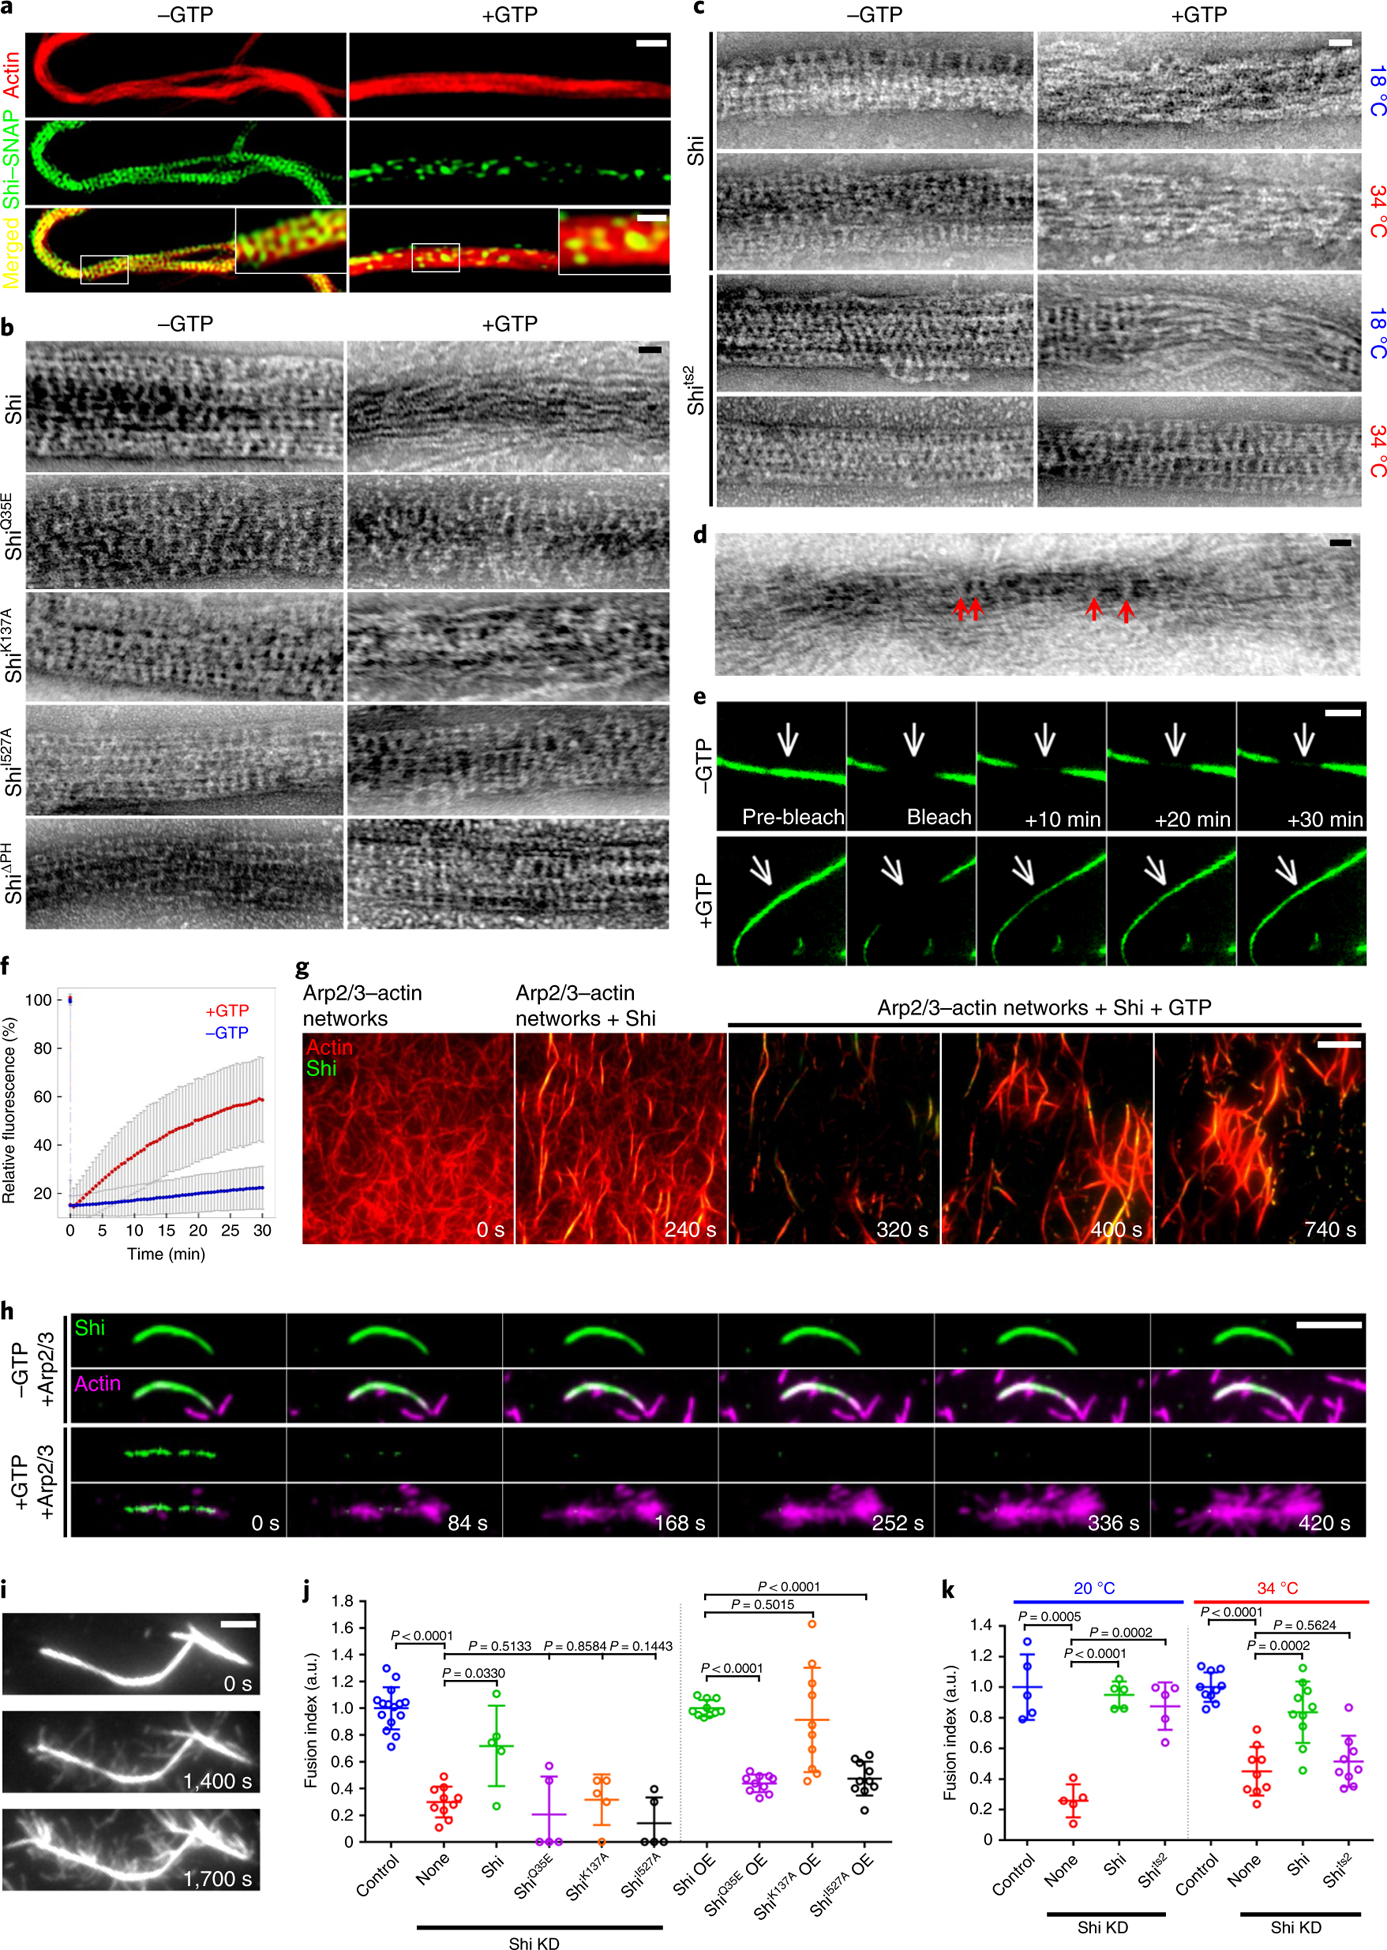
a, SIM images of Shi–actin bundles with or without GTP. Images were collected after a 2-h incubation of G-actin, Alexa Fluor 568-phalloidin (red) and Shi–SNAP-Surface 488 (green) in the absence or presence of GTP. Insets: enlarged images of the areas shown by white boxes. n = 34 (left) and 22 (right) actin bundles were imaged, with similar results. b–d, Electron micrographs of negatively stained Shi–actin bundles in the presence or absence of GTP. G-actin was incubated with wild-type and mutant Shi proteins as indicated, followed by GTP addition and negative staining. The arrows in d indicate residual Shi helices that held the loosened actin bundles together after GTP addition. n = 50, 42, 39, 19, 36, 17, 87, 36, 48 and 28 (b, from left to right and top to bottom), 19, 17, 19, 29, 12, 37, 20 and 13 (c, from left to right and top to bottom) and 42 (d) actin bundles were imaged, with similar results. e, FRAP of Shi–SNAP-Surface 488 on actin bundles in the absence (top) or presence (bottom) of GTP (Supplementary Video 10). A segment (indicated by the arrows) of a Shi–actin bundle was photobleached and the fluorescence recovery was monitored live. Stills of the actin bundle before and after photobleaching are shown. n = 9 (top) and 13 (bottom) actin bundles were imaged, with similar results. f, Recovery kinetics of the Shi–SNAP fluorescence shown in e. n = 9 (−GTP) and 13 (+GTP) actin bundles, respectively. Data points represent mean ± s.d. values. g, Time-lapse stills of TIRF images showing GTP hydrolysis-triggered dynamic disassembly/reassembly of actin bundles. Arp2/3-mediated branched actin filaments were bundled by Shi–SNAP-Surface 488, followed by GTP addition, which triggered the dynamic disassembly/reassembly of Shi helices and actin bundles (Supplementary Video 11). n = 3 independent imaging experiments were performed, with similar results. h, Time-lapse stills of TIRF images of Arp2/3-mediated branched actin polymerization from the Shi–actin bundles in the absence or presence of GTP. Shi–actin bundles were generated by incubating Shi–SNAP-Surface 488 with unlabelled actin, followed by Arp2/3, VCA and rhodamine-G-actin addition to start branched actin polymerization without (top two panels) or with (bottom two panels) GTP (Supplementary Video 12). Note the disassembly of Shi from the actin bundles upon GTP addition, and the numerous branched actin filaments emanating from the same actin bundles (bottom). See quantification in Extended Data Fig. 8a. n = 34 Shi–actin bundles with or without GTP were imaged, with similar results. i, Time-lapse stills of TIRF images of Shi-mediated branched actin filament bundling. Shi addition further bundled branched actin filaments emanating from previously formed actin bundles (Supplementary Video 14). n = 7 actin bundles were imaged, with similar results. j, Quantification of the fusion index of S2R+ cells expressing Shi and various mutants in Shi knockdown and wild-type cells, as indicated. From left to right: n = 15, 10, 5, 5, 5, 5, 10, 10, 10 and 10 fusion indices were pooled from five independent experiments. Mean ± s.d. values are shown in the dot plot, and significance was determined by two-tailed Student’s t-test. k, Quantification of the fusion index of Shi knockdown S2R+ cells expressing Shi and the Shits2 mutant. From left to right: n = 5, 5, 5, 5, 10, 9, 10 and 9 fusion indices pooled from two independent experiments. Mean ± s.d. values are shown in the dot plot, and significance was determined by two-tailed Student’s t-test. Scale bars: 1 μm (a, main panels), 0.4 μm (a, insets), 30 nm (b–d), 3 μm (e), 5 μm (g and h) and 2 μm (i). Numerical source data are provided with the paper.
Fig. 7 |. Actin bundling stimulates the GTP hydrolysis rate of Shi.
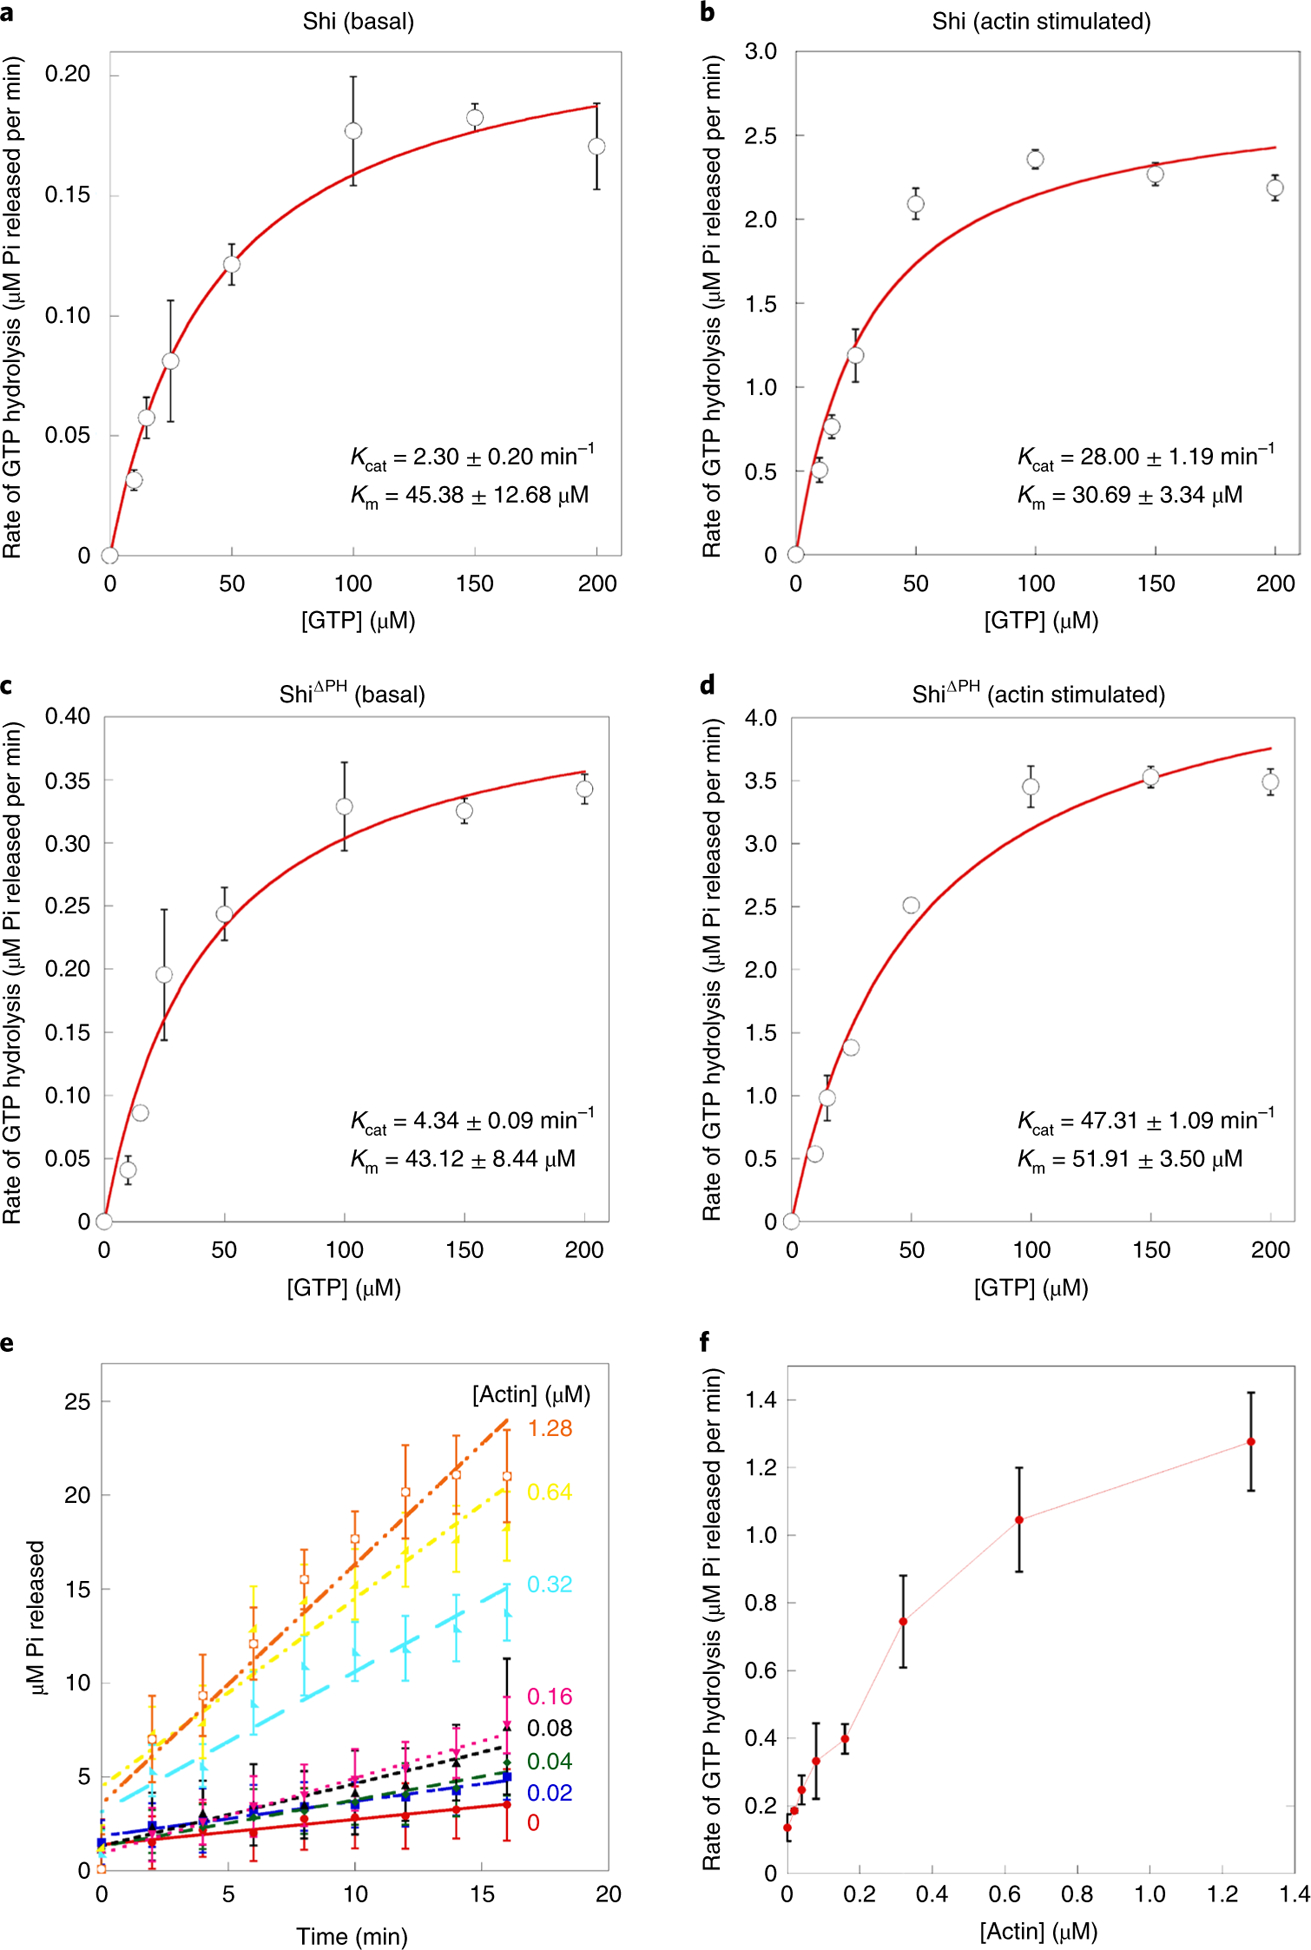
a-d, GTP hydrolysis rates of Shi (a and b) and ShiΔPH (c and d) at the basal state (a and c) and the actin-stimulated state (b and d) are plotted against the initial concentrations of GTP to calculate the Michaelis-Menten constants Kcat and Km Data points represent mean±s.d. values. n = 3 independent experiments. e, The amount of inorganic phosphate (Pi) released at different concentrations of actin is plotted against the incubation time to calculate the GTP hydrolysis rate. f, GTP hydrolysis rates calculated from e are plotted against the initial concentrations of actin. Data points represent mean±s.e. values. n = 4 independent experiments. Numerical source data are provided with the paper.
GTP hydrolysis triggers dynamic assembly/disassembly of dynamin and actin filament bundling.
To examine the dynamics of Shi helices along the actin bundles, we performed fluorescence recovery after photobleaching (FRAP) analyses. Substantial fluorescence recovery was observed after photobleaching a stretch of fluorescently labelled Shi helix in the presence of GTP (52.0 ± 16.9%), but not in the absence of GTP (7.7 ± 8.9%) (Fig. 6e,f and Supplementary Video 10), suggesting that GTP hydrolysis triggered the disassembly of photobleached Shi helices and allowed the reassembly of new helices. Thus, in the presence of GTP, Shi cycles between assembled helices along the actin bundles and disassembled dimers/tetramers in the solution. Interestingly, Shi’s GTPase activity increased ~ 12-fold when it was pre-assembled along the actin filaments (Fig. 7a,b,e,f), presumably due to the G-G domain interactions between the helical turns, as shown for hDyn1 helices around lipid nanotubes47. Therefore, once Shi assembles into a complete helix, it will be rapidly disassembled upon GTP hydrolysis.
Time-lapse imaging showed that GTP addition into a pre-incubated Shi/actin mix rapidly disassembled most, if not all, of the fully assembled Shi helices and released the actin filaments back into the solution (Fig. 6g and Supplementary Video 11). Some actin filaments in the solution were re-bundled by Shi and released again upon additional GTP hydrolysis, presumably after the dynamin helices were fully assembled (Fig. 6g and Supplementary Video 11), and such bundling/dissociation cycles continued (Fig. 6g and Supplementary Video 11). Taken together, the GTP hydrolysis-mediated cycling of Shi between helices and dimers/tetramers leads to dynamic bundling and dissociation of the actin filaments.
GTP hydrolysis facilitates branched actin polymerization.
Synchronized disassembly of Shi helices upon GTP addition can only occur in vitro when Shi helices are fully assembled along the actin bundles. However, when the amount of Shi is limited, such as in vivo, actin filaments are bundled by both fully and partially assembled Shi helices, resulting in unsynchronized disassembly of Shi helices along the actin bundles in the presence of GTP. Stretches of unprotected actin filaments, in turn, may be bound by the Arp2/3 complex to initiate new branched actin polymerization. Indeed, disassembly of the Shi helices triggered by GTP addition in vitro led to Arp2/3-mediated generation of branched actin filaments, whereas Shi-protected actin bundles in the absence of GTP failed to initiate branched actin polymerization (Fig. 6h, Extended Data Fig. 8a–c and Supplementary Videos 12 and 13). Moreover, the new short actin filaments could be further bundled by Shi (Fig. 6i and Supplementary Video 14). Similarly, disassembly of hDynl helices upon GTP addition also led to robust Arp2/3-mediated branched actin polymerization (Extended Data Fig. 8d,e and Supplementary Video 15). Thus, GTP hydrolysis by fully assembled dynamin helices exposes new sites for branched actin polymerization to maintain the dynamics of the actin cytoskeletal network.
Dynamin bundles actin filaments in vivo.
A major question regarding dynamin-actin interaction is whether dynamin bundles actin in vivo. Results from our in vitro analyses predict that only partially, but not fully, assembled dynamin helices may be observed in vivo due to the presence of GTP in the cytosol and unsynchronized GTP hydrolysis. Indeed, super-resolution microscopy (SIM and stimulated emission depletion (STED)) revealed sparse Shi punctae along the actin bundles at the fusogenic synapse in Sns- and Eff-1-expressing S2R+ cells (Fig. 8a and Extended Data Fig. 9a). In Shi knockdown cells expressing ShiQ35E, more Shi punctae were observed along the actin bundles (Fig. 8b), consistent with the inhibition of Shi helix disassembly by the GTP hydrolysis mutant (Fig. 6b,c). To ask whether dynamin exhibits a similar pattern of localization on other actin-enriched structures, we examined hDyn2 on actin comet tails, which are membraneless Arp2/3-dependent actin structures induced by the bacteria Listeria monocytogenes. Indeed, similar punctate hDyn2 localization was observed on actin comet tails in HeLa cells (Extended Data Fig. 9e,f).
Fig. 8 |. Dynamin-actin interaction in vivo.
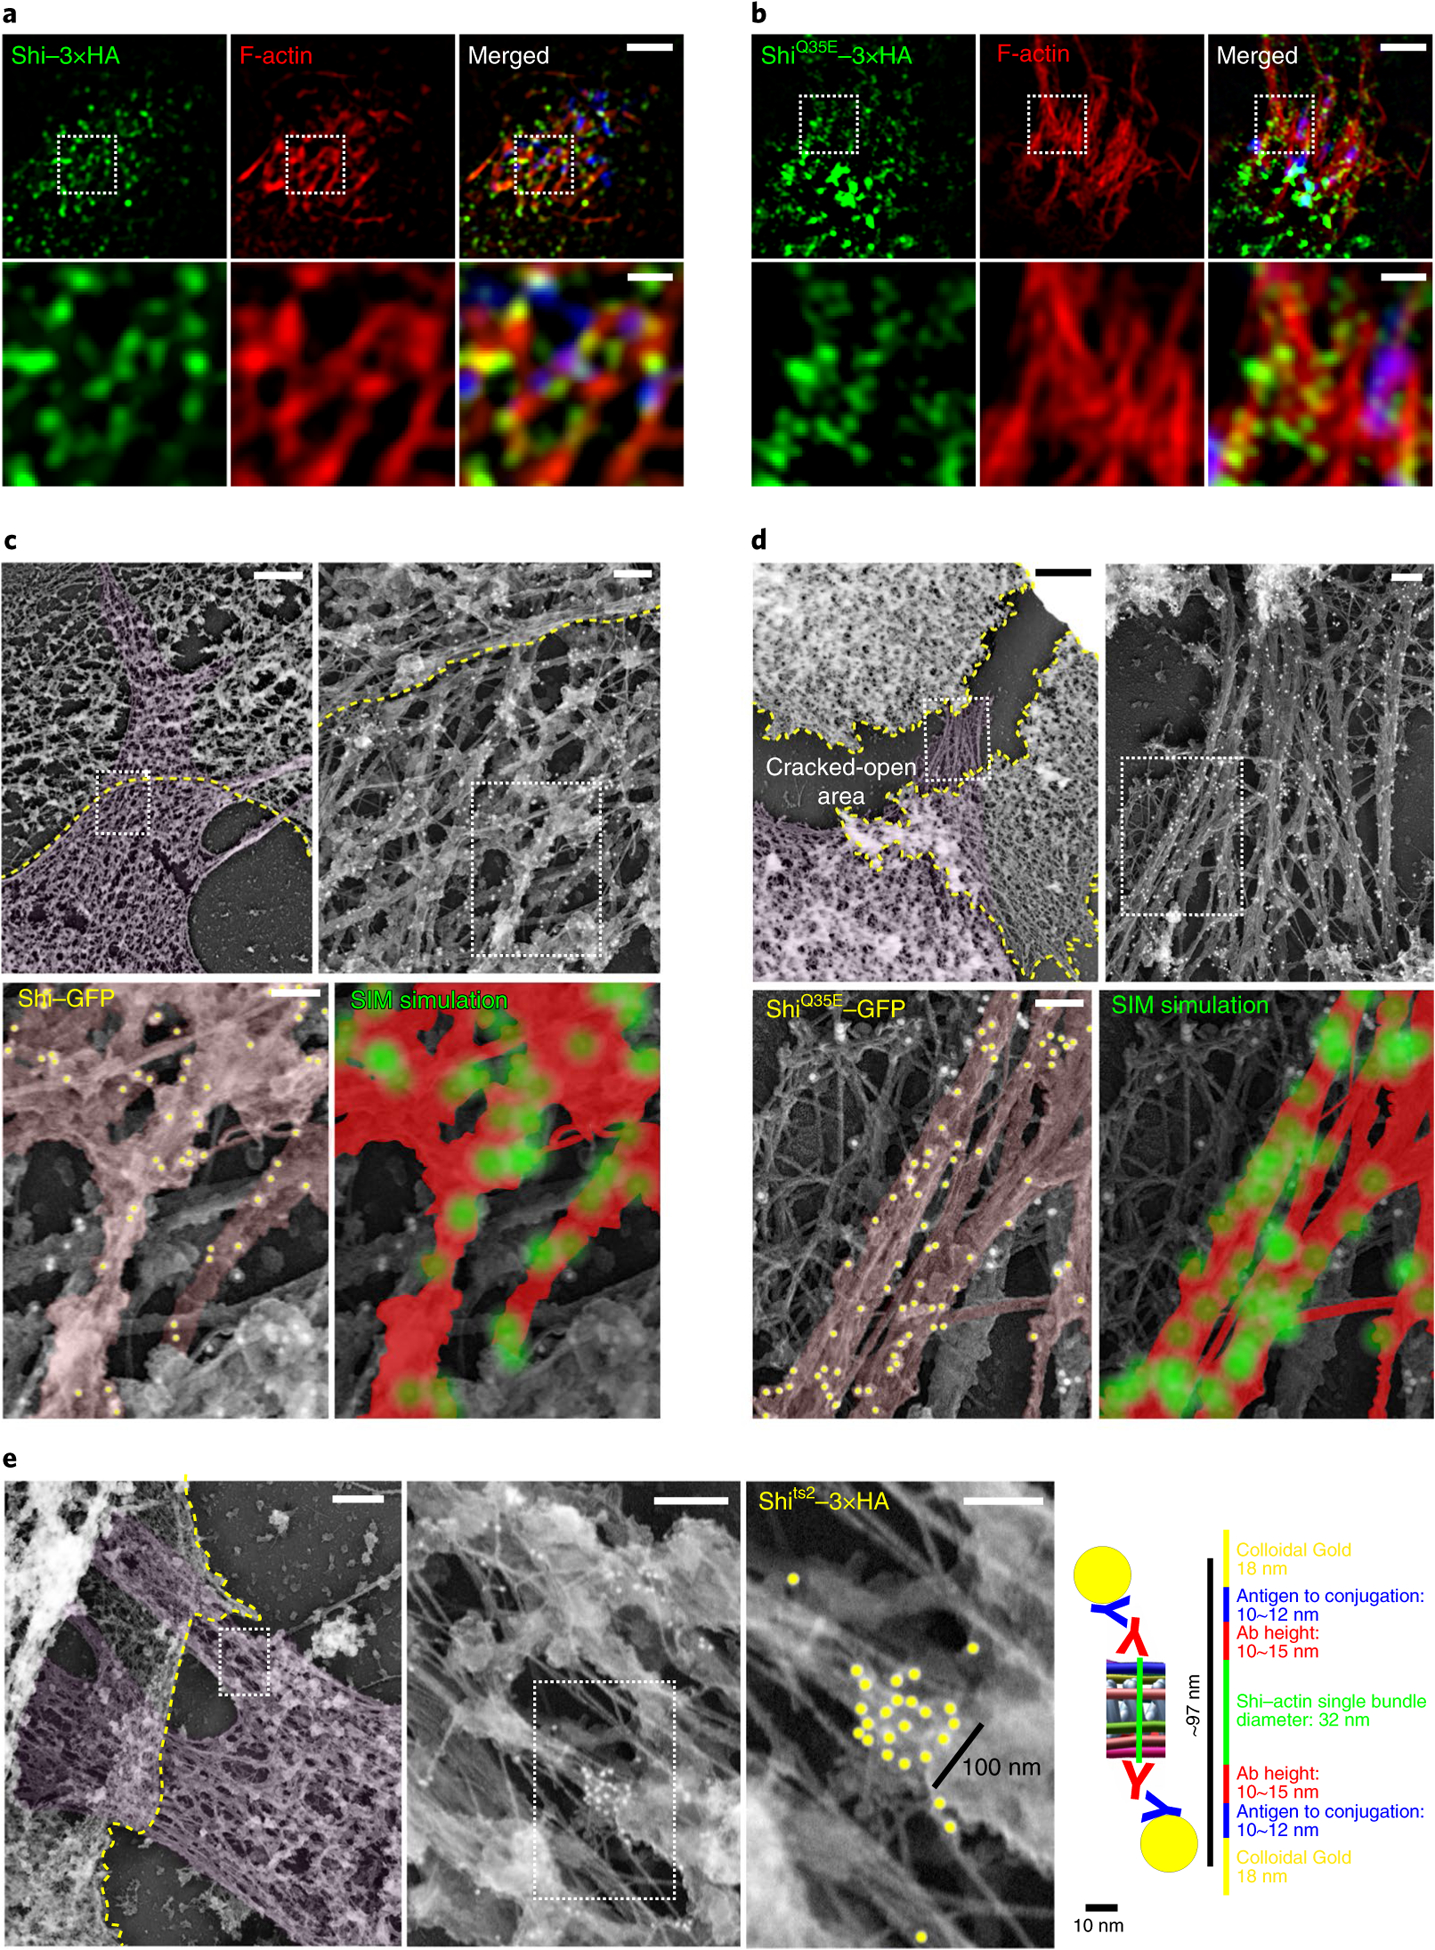
a,b, Shi localization on actin bundles at the fusogenic synapse, as revealed by SIM. S2R+ cells co-expressing Shi-3xHA (a) or ShiQ35E-3xHA (b) and Sns (blue)/Eff-1 were labelled with phalloidin and anti-HA. The bottom panels show enlarged images of the boxed areas in the panels above. n = 39 (a) and 14 (b) fusogenic synapses were imaged, with similar results. c,d, Shi localization on actin bundles at the fusogenic synapse, as revealed by immunogold PREM. Shi knockdown S2R+ cells co-expressing Shi-GFP (c) or ShiQ35E-GFP (d) and Sns/Eff-1 were stained with anti-GFP for immunogold labelling. In c and d, the second image shows the enlarged view of the boxed area in the first image, and the bottom panels show the enlarged view of the boxed area in the second image. In each first image in c-e, invading cells are pseudo-coloured purple and receiving cells are outlined by a yellow dashed line. In the bottom left images in c and d, actin bundles/filaments on the same plane are pseudo-coloured light brown and the 18-nm colloidal gold particles associated with the actin bundles are indicated by yellow dots. In the bottom right images of c and d, each gold particle on highlighted actin bundles (red) was simulated as a point spread function with 110-nm resolution (green masks). Compare the patterns of gold-labelled Shi simulation with the Shi punctae along the actin bundles visualized by SIM or STED imaging in a, b and Extended Data Fig. 9a. n = 5 (c) and 7 (d) fusogenic synapses were analysed, with similar results. e, An isolated cluster of immunogold-labelled Shits2-3xHA on an actin bundle at the fusogenic synapse. Each consecutive image is an enlargement of the boxed area shown in the image to the left. The third image shows a cluster of gold particles with a width of ~100nm along an actin bundle. The expected distance between colloidal gold particles on opposite sides of a Shi-actin single bundle is shown in the schematic to the right. n = 5 fusogenic synapses were analysed, with similar results. Ab, antibody. Scale bars: 2 μm (a and b, (top row), and c-e (first image)), 500 nm (a and b, bottom row), 200 nm (c-e, second image) and 100 nm (c-e, third image).
To visualize Shi on actin bundles at the ultrastructural level, we performed immunogold labelling of Shi with platinum replica electron microscopy (PREM). In membrane-extracted Shi knockdown S2R+ cells expressing Sns, Eff-1 and Shi-GFP, tight actin super-bundles were observed at the fusogenic synapse extending towards the fusion partner (Fig. 8c–e and Extended Data Fig. 9b). Gold-labelled Shi-GFP localized sparsely, but specifically, on the actin bundles (Fig. 8c), which could be an under-representation of Shi because of the inaccessibility of some GFP epitopes within the tight actin bundles and the residual endogenous Shi that was unlabelled. Applying a point spread function-like mask of ~110 nm on each gold particle revealed matching patterns of Shi localization (Fig. 8c,d, bottom right image in each panel) between immunogold PREM and SIM/STED imaging (Fig. 8a,b and Extended Data Fig. 9a), validating the specificity of both methods. Furthermore, immunogold labelling of ShiQ35E (or Shits2 at restrictive temperature) in Shi knockdown cells revealed more clustering of gold particles along the actin bundles than that of wild-type Shi (Fig. 8d,e and Extended Data Fig. 9c,d), consistent with the inhibition of Shi helix disassembly by these GTP hydrolysis mutants. Occasionally, large clusters of gold particles were observed on the actin bundles (Fig. 8e). A cluster with a width of ~100 nm may represent a Shi ring/helix, based on the diameter of the Shi helix and the sizes of antibodies/gold particles (Fig. 8e). Taken together, these data are consistent with the dynamic assembly/disassembly of dynamin along the actin bundles in the presence of GTP, and strongly suggest that dynamin bundles actin filaments in vivo.
Dynamic disassembly of dynamin helices is required for cell-cell fusion.
Finally, we tested whether disassembly of Shi helices is required for cell-cell fusion by performing rescue experiments in S2R+ cells co-expressing Sns, Eff-1 and Shi dsRNA. The G domain mutants ShiQ35E and ShiK137A and the ts2 allele (at restrictive temperature) failed to rescue the cell fusion defect in Shi knockdown cells (Fig. 6j,k). In addition, overexpression of ShiQ35E in Sns- and Eff-1-expresssing wild-type S2R+ cells caused a strong dominant negative effect on cell-cell fusion, whereas ShiK137A had a weaker dominant negative effect (Fig. 6j), corresponding to the partial disassembly of the ShiK137A helices in the presence of GTP (Fig. 6b). Consistent with a defect in helix disassembly, ShiI527A also failed to rescue the cell-cell fusion defect in Shi knockdown cells, and caused a dominant negative effect on cell-cell fusion when expressed in wild-type cells (Fig. 6j). These results show that the dynamic disassembly of dynamin is required for cell-cell fusion.
Discussion
In this study, we investigated how dynamin bundles actin and how GTP hydrolysis by dynamin regulates actin cytoskeletal dynamics to promote invasive protrusions in cell fusion. Our genetic, biochemical, TIRF microscopy, single-filament imaging, negative-stain electron microscopy, cryo-ET and PREM studies have led to the following model (Extended Data Fig. 10a,b). During dynamin’s assembly into a helical structure, actin filaments are bundled to the outer rim of the partially assembled dynamin helices via the PRD domain. Once a dynamin helix is fully assembled, the assembly-stimulated GTPase activity of dynamin triggers rapid GTP hydrolysis and helix disassembly, freeing dynamin dimers/tetramers to bundle new actin filaments (Extended Data Fig. 10a). Since each actin super-bundle consists of multiple dynamin helices that are being assembled, the asynchronous GTP hydrolysis results in a hybrid actin bundle that contains stretches of unprotected filaments held together at random locations by partial dynamin helices. The unprotected stretches of the actin bundle become new sites for Arp2/3-mediated branched actin polymerization, to generate short actin filaments more suitable for mechanical work13. The new actin filaments can either form new bundles de novo or join pre-existing actin bundles via actin-PRD interactions. Thus, through dynamin’s cycling between helix assembly and disassembly as a function of GTP hydrolysis, the actin bundles grow thicker and mechanically stiffer by incorporating and bundling numerous short filaments. As a consequence, the PLS at the fusogenic synapse is able to propel membrane protrusions to promote cell-cell fusion (Extended Data Fig. 10b). In contrast, the disassembly-defective dynamin mutants remain bound to actin bundles, leaving few free dynamin proteins available to bundle new actin filaments, and partially blocking Arp2/3-mediated branched actin polymerization. Both of these events reduce the mechanical strength of the actin network, resulting in stubby protrusions at the fusogenic synapses in shits2 mutant embryos. Continuous actin polymerization organized by the nucleation-promoting factors in the vicinity, in turn, generates additional stubby protrusions at the fusogenic synapse (Fig. 1h,i).
Our study establishes dynamin as a unique actin-bundling protein. Most non-motor actin-bundling proteins, such as α-actinin, fascin, fimbrin, filamin and spectrin, form linear or V-shaped structures that each crosslink two actin filaments at a time48. In contrast, dynamin is a multifilament bundling protein by forming a helical structure that can engage 16 (hDyn1) or 12 (Shi) actin filaments at its full capacity (Extended Data Fig. 10a). Due to the tilt of the dynamin dimers along the long axis of the actin bundle, each actin filament is bound by two PRDs from two different dimers in each turn of a dynamin helix. By interacting with more PRDs from additional turns along the dynamin helix, the multifilament actin bundle is further stabilized. Moreover, the multifilament single bundles can align in parallel to form super-bundles, mediated by trans-bundle PRD-actin interactions, which facilitates the crosslinking of the entire actin network. The unique mode of dynamin-actin interaction makes dynamin a powerful actin-bundling protein that enhances the mechanical strength of the actin network. We propose that the mechanisms underlying dynamin-actin interaction uncovered in this study will be generally applicable to other cellular processes involving dynamin-mediated actin cytoskeletal rearrangements, such as the formation and function of podosomes, invadopodia and comet tails, as well as the fission of endocytic vesicles.
Methods
Fly stocks and genetics.
The following stocks were obtained from the Bloomington Drosophila Stock Center: w1118 (wild type; BL#3605), shits1 (BL#7068), shits2 (BL#2248), ketteJ4–48 (BL#8753), Cortactin6A2 (BL#9367), CortactinM7 (BL#58495), twi-GAL4 (BL#914), UAS-Actin5C-mRFP (BL#24778), UAS-Clc-GFP (BL#7107) and AP-2α-GFP (AP-2αMI03502-GFSTE1; BL#59834). Other stocks used were: sntf40–49/CyO51, wasp3/TM352, sltrS1946/CyO53, rP298-GAL4 (ref.50) and sns-GAL4 (ref.54). Transgenic flies carrying UAS-Shi-GFP were generated by P-element-mediated germline transformation. To express Shi-GFP in all muscle cells, flies carrying the UAS-Shi-GFP transgene were crossed with the twi-GAL4 line. For transgenic rescue experiments, shits2; UAS-Shi-GFP flies were crossed with shits2; twi-GAL4 (all muscle cells), shits2;rP298-GAL4 (founder cells) or shit!l;sns-GAL4 flies (FCMs). For phenotypic analyses of embryos carrying shits1 or shits2 mutations, shits embryos were collected for 1 h at 20 °C, incubated at permissive temperature (18 °C) for 16 h to allow the specification and proliferation of muscle cells, shifted to the restrictive temperature (34 °C) for 4 h, and washed and dechorionated in buffers pre-warmed to 34 °C before fixation and staining. To generate Cortactin maternal zygotic null mutant embryos, homozygous CortactinM7 female flies were crossed to Cortactin6A2 males.
Cell culture.
S2R+ cells were cultured in Schneider’s medium (Gibco) supplemented with 10% foetal bovine serum (Gibco) and penicillin/streptomycin (Sigma-Aldrich). S2R+ cells were induced to fuse as previously described8. Briefly, 1.2 × 10⁶ cells were plated in each well of a 6-well plate and transfected with Sns and Eff-1 constructs (200 ng each) using Effectene (Qiagen), per the manufacturer’s instructions. Transfected cells were fixed after 48 or 72 h for phenotypic analyses. For Shi RNA RNAi knockdown experiments, cells were incubated with 3 μg ml−1 dsRNA for 4 d, transfected with the appropriate DNA constructs, then incubated again with 3 μg ml−1 dsRNA for 48–72 h. For the rescue experiments, a Shi construct (100 ng) was co-transfected with Sns and Eff-1 in the Shi knockdown cells. Between six and eight random 20× microscopic fields in each well were imaged and analysed for the fusion index. The fusion index was determined as the percentage of the number of nuclei in multinucleated syncytia (≥3 nuclei) versus in total transfected cells, normalized to the control (cells expressing Sns and Eff-1 without knockdown).
Sf9 cells were cultured in suspension medium of Sf-900 III SFM (Gibco) with L-glutamine (Gibco) and Antibiotic-Antimycotic (Gibco). The cells were grown at a density of 0.5 × 10⁶−6 × 10⁶ cells per ml at 150 r.p.m. and 27 °C. For protein expression, cells were diluted to 0.5 × 10⁶ cells per ml with fresh medium and cultured for 24 h, followed by transfection with the corresponding DNA constructs using Transfection Reagent I (Avanti), per the manufacturer’s instructions, and continued culturing for 48 h.
HeLa cells (ATCC; CCL-2) were cultured in DMEM (Gibco) supplemented with 1× non-essential amino acids (Gibco) and 10% foetal bovine serum (Gibco).
Immunofluorescence staining and confocal microscopy.
For Drosophila embryo staining, embryos were fixed in a 1:1 mix of heptane and 4% formaldehyde in phosphate-buffered saline (PBS) for 20 min, devitellinized in 1:1 heptane/methanol by vigorous shaking, washed in methanol and incubated in PBSBT (0.2% bovine serum albumin (BSA) and 0.1% Triton in PBS) for 2 h. Embryos were then incubated with primary antibodies overnight at 4 °C, followed by PBSBT washes and incubation with secondary antibodies. The following primary antibodies were used: rabbit anti-Shi (1:500)55, rabbit anti-MHC (1:2,000; a gift from B. Paterson), rat anti-Tropomyosin (1:1,000; Abcam; ab50567), guinea pig anti-Duf (1:500)6, rabbit anti-Ants (1:2,000)49, rabbit anti-Eve (1:30; Developmental Studies Hybridoma Bank; 3C10), rabbit anti-GFP (1:500; Invitrogen; A11122) and chicken anti-GFP (1:5,000; Invitrogen; A10262). The following secondary antibodies were used at 1:200: Alexa Fluor 488-, 568- and 647-conjugated (Invitrogen) and biotinylated antibodies (Vector Laboratories) made in goat. A Vectastain ABC kit (Vector Laboratories; PK-4000) and the TSA system (PerkinElmer; SAT701001EA) were used to amplify weak fluorescent signals for anti-Eve staining. Nuclei were labelled with Hoechst 33342 (1:1,000; Invitrogen; H3570). For Shi antibody staining, embryos were fixed in a 1:1 mix of heptane and 37% formaldehyde for 5 min. For F-actin labelling, embryos were fixed in formaldehyde-saturated heptane for 1 h at room temperature, hand-devitellinized and incubated with Alexa Fluor 488-, 568- or 647-conjugated phalloidin (1 mg ml−1) (Sigma-Aldrich) at 1:200 for 2 h at room temperature.
For S2R+ cell staining, cultured cells were fixed in 3.7% formaldehyde for 10 min, unless otherwise noted. Samples were incubated with primary antibodies for 1 h at room temperature, followed by PBSBT washes and incubation with secondary antibodies for 1 h at room temperature. The following primary antibodies were used: mouse anti-hTfR (1:600)56, rabbit anti-HA (1:600; Sigma-Aldrich; H6908) and hDyn2 (1:50; Santa Cruz Biotechnology; G4). Nuclei were labelled with Hoechst 33342 (1:1,000; Abcam; 27671). The following secondary antibodies were used at 1:200: Alexa Fluor 488-, 568- and 647-conjugated (Invitrogen) and biotinylated antibodies (Vector Laboratories) made in goat. F-actin was labelled with Alexa Fluor 488-, 568- or 647-conjugated phalloidin (Sigma-Aldrich) at 1:600.
Labelled samples were mounted in Vectashield (Vector Laboratories) or Aqua-Poly/Mount (Polysciences). Confocal microscopy was performed using a Zeiss LSM 700 microscope equipped with EC Plan Neofluar DIC M27 40×/1.3 and Plan-Apochromat DIC 63×/1.4 oil objectives, a Nikon A1R confocal microscope (Ti-E) equipped with CFI Plan Fluor 40×/1.3 and CFI Plan Apo VC 60×/1.4 oil objectives, or a Leica TCS SPE confocal microscope (DMi8) equipped with an HC PL APO 20×/0.8 dry objective. The images were processed using Adobe Photoshop CS6 and ImageJ (National Institutes of Health (NIH)) software.
Molecular biology.
All of the molecular reagents used in this study are described in Supplementary Table 1.
Electron microscopy.
The high-pressure freezing and freeze substitution method was used to fix the fly embryos, as described previously6,57. Briefly, fly embryos at stage 12–14 were frozen with a Bal-Tec device, followed by freeze substitution with 1% osmium tetroxide, 0.1% uranyl acetate in 98% acetone, and 2% methanol on dry ice. Embryos were then embedded in Epon (Sigma-Aldrich). Thin sections (70 nm) were cut with an ultramicrotome (Leica EM UC7), mounted on copper grids, and post-stained with 2% uranyl acetate for 10 min and with Sato’s lead solution58 for 1 min for contrast enhancement. Images were acquired on a transmission electron microscope (CM120; Philips).
Protein purification.
Most recombinant proteins generated in this study (Drosophila Shi, Shits2, ShiQ35E, ShiK137A, ShiI527A, ShiAKE, Shi-SNAP, ShiΔG, ShiΔPRD, ShiΔPH, ShiPRD, Shi2xPRD, Drp1, Drp1-ShiPRD, Shi4RD, ShiR804D, ShiR829D, ShiR846/853D, hDyn1, hDyn2, hDyn12xPRD, hDyn22xPRD and hDyn2ΔPRD) were expressed in inset Sf9 cells transiently transfected with the corresponding constructs. These amino-terminally His-tagged fusion proteins were purified with nickel-nitrilotriacetic acid resin (Thermo Fisher Scientific) according to the manufacturer’s instructions. ShiPRD, Shi2xPRD, hDyn12xPRD and hDyn22xPRD were further purified with gel filtration. All purified proteins were dialysed against 20 mM HEPES (pH 7.3), 150 mM KCl, 1 mM EGTA and 1 mM dithiothreitol (DTT), flash frozen in liquid nitrogen and stored at −80 °C.
The hDyn1 used in the Cryo-ET study was cloned into the pcDNA3.1 mammalian expression vector with an amino-terminal His tag. This construct was transiently transfected into 293-F cells (Thermo Fisher Scientific) using polyethylenimine at a DNA:polyethylenimine ratio of 1.5:1. Cells were harvested 3 d post-transfection. Proteins were purified by Ni-NTA chromatography and gel filtration using a SEC 650 column (Bio-Rad). Human Drp1 was purified using bacterial BL21 (DE3)-RIPL cells, as described previously59.
All of the SH3 domains used in this study (Drosophila Drk-SH3.1, Drk-SH3.2, Dock-SH3.2, Dock-SH3.3, SH3PX1-SH3 and amphiphysin II-SH3) were expressed in Escherichia coli BL21 (DE3). Glutathione S-transferase-tagged fusion proteins were affinity purified using Glutathione Superflow Agarose (Thermo Fisher Scientific) according to the manufacturer’s instructions. The glutathione S-transferase tags were removed by thrombin. All purified proteins were dialysed against 10 mM Tris-HCl (pH 8.0), flash frozen in liquid nitrogen and stored at −80 °C.
Co-sedimentation assay.
High- and low-speed F-actin co-sedimentation assays were performed to determine the F-actin-binding and -bundling activity of Drosophila and human dynamin (and their mutants), respectively. F-actin pre-assembled from 3 μM G-actin was incubated with the indicated concentrations of proteins in 5 mM HEPES (pH 7.3), 50 mM KCl, 2 mM MgCl2, 0.5 mM EGTA, 3 mM imidazole, 60 nM ATP, 60 nM CaCl2, 0.4 mM DTT and 0.003% NaN3 for 30 min at room temperature. The samples were then spun for 30 min at 4 °C and 50,000 g (high-speed co-sedimentation) or 13,600g (low-speed co-sedimentation). The supernatants and pellets resulting from centrifugation were resolved by 10% sodium dodecyl sulfate polyacrylamide gel electrophoresis (SDS-PAGE) and the gels were stained with InstantBlue (Expedeon).
TIRF microscopy.
To visualize Shi-actin bundles (Fig. 2b), rabbit skeletal muscle G-actin (90% unlabelled and 10% rhodamine-G-actin; cytoskeleton) and Shi were incubated at concentrations of 2 and 1 μM, respectively, in actin polymerization buffer (6.5 mM HEPES (pH 7.3), 50 mM KCl, 1 mM MgCl2, 0.3 mM EGTA, 80 nM ATP, 80 nM CaCl2, 0.3 mM DTT and 0.004% NaN3) for 2 h. Then, 10 μl of the reaction mix was mixed with 10 μl 2× TIRF buffer (1× TIRF buffer: 50 mM KCl, 1 mM MgCl2, 1 mM EGTA, 10 mM imidazole, 100 mM DTT, 0.2 mM ATP, 15 mM glucose, 20 μg ml−1 catalase, 100 μg ml−1 glucose oxidase, 0.2% BSA and 0.5% methylcellulose (pH 7.0)) and loaded onto flow chambers prepared as follows. Flow chambers were assembled and coated with 10 nM NEM-myosin in HS-TBS buffer (50 mM Tris-HCl (pH 7.5) and 600 mM NaCl) for 1 min, washed with HS-BSA (1% BSA, 50 mM Tris-HCl (pH 7.5) and 600 mM NaCl) twice, washed with LS-BSA (1% BSA, 50 mM Tris-HCl (pH 7.5) and 150 mM NaCl) twice and incubated for 5 min, and washed with the TIRF buffer. The loaded samples on the flow chambers were incubated for 5 min and subjected to TIRF imaging using a Nikon Eclipse Ti microscope equipped with an Apochromat DIC N2 TIRF 100×/1.49 oil objective lens and an Andor DU-897 X-8654 camera. Convolutedness was calculated as the ratio of traced filament length to the length of the longest side of a bounding rectangle encompassing the same filament60.
To visualize Shi-mediated bundling of the Arp2/3-mediated branched actin network (Fig. 2c), 50 nM Arp2/3 (cytoskeleton), 1 μM Verprolin, cofilin, acidic (VCA) domain of WASP (cytoskeleton), 1.5 μM G-actin and 0.5 μM Alexa Fluor 568-phalloidin were mixed in 1× TIRF buffer, loaded into the flow chambers and subjected to TIRF imaging immediately. A total of 0.2 μM Shi-SNAP-Surface 488 was loaded into the NEM-myosin-coated flow chambers ~20 min later to bundle the actin filaments. To visualize GTP hydrolysis-triggered dynamic assembly/disassembly of actin bundles (Fig. 6g), 50 nM Arp2/3, 1 μM VCA and 1.5 μM G-actin (15% rhodamine-G-actin) were mixed in 1× TIRF buffer to generate the branched actin network, followed by the addition of 0.2 μM Shi-SNAP-Surface 488 to bundle the actin filaments. Then, 1 mM GTP was loaded into flow chambers to trigger the dynamic disassembly and (re)assembly of Shi helices and actin bundles.
To monitor the process of Shi bundling of pre-assembled actin filaments at the single-filament level (Fig. 2e), experiments were performed on His-tagged ezrin-bound supported lipid bilayers (SLBs). SLBs were prepared as previously described61. Briefly, a 96-well glass-bottomed plate (Matrical) was pre-treated with Hellmanex III (Hëlma Analytics) overnight, thoroughly rinsed with Milli-Q H2O, washed with 300 μl 6 M NaOH for 30 min at 45 °C, repeated once, rinsed with 500 μl Milli-Q H2O three times, and washed with 500 μl HEPES buffer (50 mM HEPES (pH 7.3), 150 mM NaCl and 1 mM TCEP) three times to equilibrate the wells; finally, 200 μl HEPES buffer was kept in each well. Some 10 μl of small unilamellar vesicles (98% POPC, 2% DOGS-NTA and 0.1% PEG-5000PE) were added into wells and incubated for 1 h at 40 °C to form SLBs, followed by three washes with 500 μl HEPES buffer. Next, 100 μl BSA buffer (50 mM HEPES (pH 7.3), 50 mM KCl, 1 mM TCEP, 1 mM MgCl2 and 1 mg ml−1 BSA) was added into each well and incubated for 30 min at room temperature. Ultimately, His-tagged ezrin at 40 nM in BSA buffer was added into each well and incubated for 1 h at room temperature, followed by five washes with 500 μl BSA buffer to remove the unbound His-ezrin. Pre-assembled actin filaments (90% unlabelled G-actin and 10% rhodamine-G-actin) were added into wells and incubated for 5 min at room temperature followed by 100 μl image buffer addition (0.02 mg ml−1 catalase, 0.1 mg ml−1 glucose oxidase and 15 mM glucose in BSA buffer) to adjust the actin concentration to 100 nM. Immediately before imaging, Shi was added into a well to a final concentration of 10 nM and imaged using a TIRF/iLas2 TIRF/FRAP module (BioVision) mounted on a Leica DMI6000 microscope base equipped with a 100×/1.49 oil objective lens and a Hamamatsu ImagEM X2 EMCCD camera.
To monitor Shi-mediated actin bundling during actin filament growth (Fig. 2f), experiments were performed in flow chambers prepared as previously described62, except that piranha cleaning was replaced with ultraviolet-ozone treatment. Briefly, microscope slides and coverslips (#1.5; Thermo Fisher Scientific) were washed for 30 min with acetone and 10 min with 95% ethanol, sonicated for 2 h with Hellmanex III detergent (Hellma Analytics), washed extensively with Milli-Q water and treated with UVO cleaner (Jetlight Company) for 10 min. Slides were then immediately incubated for 18 h with 1 mg ml−1 mPEG-Silane (5,000 MW) in 95% ethanol (pH 2.0). Parallel strips of double-sided tape were placed on a coverslip to create multiple flow chambers. To initiate the experiment, 1.5 μM MgATP-actin (10% tetramethylrhodamine labelled) and 1 μM Shi were mixed with 2× TIRF buffer (1× TIRF buffer: 10 mM imidazole (pH 7.0), 50 mM KCl, 1 mM MgCl2, 1 mM EGTA, 50 mM DTT, 0.2 mM ATP, 50 μM CaCl2, 15 mM glucose, 20 μg ml−1 catalase, 100 μg ml−1 glucose oxidase and 0.2% (400 centipoise) methylcellulose) and transferred to a flow chamber for imaging. TIRF microscopy images were collected at 10-s intervals using a Nikon Inverted Ti-E microscope base equipped with a 100×/1.49 oil objective lens and an Evolve EMCCD camera (Photometrics) with through-the-objective TIRF illumination.
To visualize Arp2/3-mediated branched actin polymerization on the dynamin-actin bundles, both Shi-actin and hDyn1-actin (Extended Data Fig. 8b,d) bundles were examined. Shi-actin bundles were pre-assembled with 2 μM Shi, 1 μM G-actin and 1 μM Alexa Fluor 488-phalloidin. The pre-assembled samples were loaded into the NEM-myosin-coated flow chambers, incubated for 5 min and then washed and incubated with TIRF buffer with or without 1 mM GTP for an additional 5 min. Subsequently, 50 nM Arp2/3, 1 μM VCA and 250 nM rhodamine-G-actin were loaded into flow chambers with or without 1 mM GTP and subjected to TIRF imaging immediately. To visualize Shi in the actin polymerization process (Fig. 6h), Shi-SNAP was labelled fluorescently with SNAP-Surface 488 (New England Biolabs), and Shi-SNAP-Surface 488-mediated actin bundles were visualized by TIRF imaging. To visualize Shi-mediated bundling of Arp2/3-mediated branched actin filaments on Shi-actin bundles (Fig. 6i), 0.2 μM Shi was loaded into the flow chamber containing pre-formed Shi-actin bundles with branched actin filaments. hDyn1-actin bundles were pre-assembled with 2 μM hDyn1, 1 μM G-actin and 1 μM Alexa Fluor 488-phalloidin, loaded into flow chambers, incubated for 5 min, and washed and incubated with TIRF buffer with or without 0.01 mM GTP for an additional 1 min. After another brief wash with TIRF buffer, 50 nM Arp2/3, 1 μM VCA and 250 nM rhodamine-G-actin were loaded into flow chambers without GTP and subjected to TIRF imaging immediately.
Negative-stain electron microscopy.
Negative-stain electron microscopy was performed to visualize the distribution of dynamin and mutants along actin bundles. A total of 1 μM G-actin was incubated with an appropriate concentration of dynamin (or dynamin mutant) in 6.5 mM HEPES (pH 7.3), 50 mM KCl, 2 mM MgCl2, 0.3 mM EGTA, 20 nM ATP, 20 nM CaCl2, 0.3 mM DTT and 0.001% NaN3 at 4 °C overnight. The reaction mixture was loaded onto carbon-coated, glow-discharged 400 mesh copper grids and incubated for 5 min, followed by two quick washes in actin polymerization buffer (50 mM KCl, 1 mM MgCl2, 1 mM EGTA and 10 mM imidazole). The grid was stained in two drops of 0.75% uranyl formate for 20 s and air dried. Electron micrographs were collected on a JEOL 1200-EX II transmission electron microscope.
To test the effects of GTP on dynamin-actin bundles by negative-stain electron microscopy, 1 μM G-actin was incubated with an appropriate concentration of dynamin (or dynamin mutant) in the presence or absence of 1 mM GTP at room temperature for 30 min.
To visualize dynamin helices on lipid nanotubes, lipid nanotubes were generated with 40% phosphatidylcholine (1,2-dioleoyl-sn-glycero-3-phosphocholine), 40% NFA-GalCer, 10% cholesterol and 10% PtdIns(4,5)P2 (to a total lipid concentration of 1 mM) (Avanti). Then, 3 μM dynamin (or dynamin mutant) was incubated with lipid nanotubes in lipid buffer (20 mM HEPES (pH 7.3), 150 mM KCl, 2 mM MgCl2 and 1 mM DTT) at 4 °C overnight, followed by the negative stain described above, except that the washes were done in the lipid buffer.
To visualize the actin-dynamin-lipid nanotube complex, 2 μM Shi and 1 mM lipid nanotubes were mixed and incubated at 4 °C overnight. Then, 1 μM G-actin was added to the mix and incubated for another 4 h at room temperature, followed by the negative stain.
To visualize dynamin self-assembled rings, 0.2 mg ml−1 dynamin was dialysed against 20 mM HEPES (pH 7.3), 25 mM KCl, 1 mM EGTA and 1 mM DTT at 4 °C overnight. Samples were loaded onto grids and incubated for 1 min, followed by two quick washes with the same dialysis buffer and staining in two drops of 0.75% uranyl formate for 1 min.
Western blot.
Expression constructs were transfected into S2R+ cells. Cells were harvested, washed in PBS and lysed in lysis buffer (50 mM Tris (pH 7.5), 200 mM NaCl, 10 mM MgCl2, 1% NP-40 and 0.5% Triton X-100) supplemented with 1× protease inhibitor cocktail (Sigma-Aldrich). After centrifugation, cell lysates were analysed on an SDS-PAGE gel. The following antibodies were used for blotting: rabbit anti-HA (1:1,000; Thermo Fisher Scientific; 715500), mouse anti-tubulin (1:1,000; DSHB; E7), chicken anti-GFP (1:5,000; Thermo Fisher Scientific; A10262), anti-rabbit-HRP (1;10,000; Invitrogen), anti-mouse-HRP (1;10,000; Invitrogen) and anti-chicken-HRP (1:20,000; Invitrogen).
Pulse-chase transferrin uptake assay.
A total of 1.2 × 10⁶ S2R+ cells were plated in each well of a 6-well plate and transfected with 100 ng human transferrin receptor (and 100 ng of rescue construct if applicable) using Effectene (QIAGEN), according to manufacturer’s instructions. At 36 h post-transfection, cells were washed with PBS, incubated in PBS++++ (1 mM CaCl2, 1 mM MgCl2, 5 mM glucose and 0.2% BSA) for 30 min and incubated with 5 μg ml−1 Alexa Fluor 488- or 568-transferrin (Molecular Probes; T13342 and T23365) for 5 min. Subsequently, cells were placed on ice, washed three times with cold PBS and three times with acetic acid (0.2 M acetic acid and 0.2 M NaCl (pH 2.5)) for 5 min each, then three times again with cold PBS, fixed with 4% formaldehyde, and stained for human transferrin receptor and haemagglutinin (HA). Stained cells were mounted and subjected to confocal imaging.
For image analysis, transfected cells were identified and manually outlined, yielding the total surface area (TSA). Within these TSAs, fluorescent signals of interest were automatically determined using the triangular threshold method, and particles were analysed through the built-in ImageJ algorithm. Relative transferrin uptake was determined by the transferrin particle count divided by the TSA, followed by normalization to the relevant control.
Cryo-ET.
Cryo-ET was used to determine the three-dimensional organization of actin filaments bundled by dynamin. Some 5 μM G-actin was incubated with 0.625 μ.M hDyn1 (or Shi) in actin polymerization buffer (20 mM HEPES (pH 7.3), 50 mM KCl, 1 mM EGTA, 80 nM ATP, 80 nM CaCl2, 1 mM DTT and 0.004% NaN3) at 4 °C overnight. Aliquots of 3.5 μl of the overnight actin/dynamin reaction mixture with 10-nm gold fiducials were loaded onto glow-discharged gold C-flat grids (Electron Microscopy Sciences; CF-1.2/1–4Au-50) for 20 s, back-blotted on the sample-free side with filter paper for 2 s (22 °C; 90% humidity) and then plunged into liquid ethane using the EM Grid Plunger (Leica Microsystems). Electron micrographs for the cryo-ET study were collected with a 200-kV TF20 transmission electron microscope (FEI) at 29,000x magnification, with a defocus of −3.0 μm using a K2 Summit camera (Gatan). Tilt series were collected using SerialEM at angles between around −60° and +60° for each dataset. Tomograms were generated from the tilt series with the IMOD package63. Modelling of dynamin (EMDB code: EMDB-7957) and actin (provided by K. Chinthalapudi using the Protein Data Bank entry 5ONV) into tomograms was done in Chimera64, guided by segmented tomograms obtained using the EMAN2 semi-automated segmentation package65. The helical parameters of dynamin were calculated based on the diameter, pitch and known distance between dynamin subunits along the helical path.
GTPase activity assay.
The GTPase activity of Shi (or ShiΔPH) was measured according to previously published methods66. For basal GTPase assay, 0.1 μM Shi (or ShiΔPH) was incubated in the GTPase assay buffer (20 mM HEPES (pH 7.5), 50 mM KCl, 2 mM MgCl2 and 1 mM DTT) with a series of GTP concentrations (10, 15, 25, 50, 100, 150 and 200 μM) at room temperature. Samples were harvested from the reaction mixes at 2-min intervals over a 16-min period, and reactions were stopped by EDTA addition to a final concentration of 100 mM EDTA. Malachite green solution was added to each sample and the absorbance at 650 nm was determined using a microplate reader. Released inorganic phosphate detected by malachite green was fitted to a linear curve versus time course, and the GTP hydrolysis rate was calculated for each GTP concentration. Subsequently, the GTP hydrolysis rates were plotted against the initial concentrations of GTP to calculate the Michaelis-Menten constants Kcat and Km.
For actin-stimulated GTPase assay, 0.1 μM Shi (or ShiΔPH) was pre-incubated with 0.3 μM G-actin in the GTPase assay buffer for 1 h at room temperature to allow the formation of stable Shi-actin (or ShiΔPH-actin) bundles. GTP was added to the reaction mixes at a series of final concentrations of 10, 15, 25, 50, 100, 150 and 200 μM. Samples were harvested from the reaction mixes at 2-min intervals over a 12-min period and processed as described above. To further test the effect of Shi-actin bundling on the GTPase activity of Shi, 0.1 μM Shi was pre-incubated with G-actin at a series of concentrations (0, 20, 40, 80, 160, 320, 640 and 1,280 nM) in the GTPase assay buffer for 1 h at room temperature. Then, 0.5 mM GTP was added and samples were harvested from the reaction mixes at 2-min intervals over a 16-min period, and processed as described above.
FRAP.
To visualize the dynamics of Shi along actin bundles with or without GTP, actin bundles were prepared by incubating 1 μM Shi-SNAP-Surface 488 and 1 μ.M G-actin in actin polymerization buffer (6.5 mM HEPES (pH 7.3), 50 mM KCl, 1 mM MgCl2, 0.3 mM EGTA and 0.3 mM DTT) for 2 h at room temperature. Before imaging, 0.25 μM Shi-SNAP-Surface 488 in fluorescence buffer with or without 1 mM GTP was mixed with the samples. To perform the FRAP assay, two pre-photobleaching images were recorded, followed by quickly photobleaching the region of interest to ~15% of its original intensity. Subsequently, images were acquired every 30 s using a Nikon A1R confocal microscope (Ti-E) equipped with a CFI SR Apochromat TIRF 100×/1.49 oil objective lens. The mean fluorescence intensity of the photobleached region was calculated using ImageJ software, and the un-photobleached region in the vicinity was used to correct the curve.
Super-resolution microscopy.
To visualize the distribution of Shi along the actin bundles generated with purified actin and Shi in vitro (Fig. 6a), 1 μM Shi-SNAP-Surface 488 was incubated with 1 μM G-actin and 1 μM Alexa Fluor 568-phalloidin, in the presence or absence of 1 mM GTP, in actin polymerization buffer (6.5 mM HEPES (pH 7.3), 50 mM KCl, 1 mM MgCl2, 0.3 mM EGTA and 0.3 mM DTT) for 2 h at room temperature. Subsequently, the samples were diluted 20-fold in fluorescence buffer (0.5% methycellulose, 50 mM KCl, 1 mM MgCl2, mM EGTA, 10 mM imidazole, 100 mM DTT, 0.02 mg ml−1 catalase, 0.1 mg ml−1 glucose oxidase, 15 mM glucose, 0.1 mM CaCl2, 0.1 mM ATP and 0.005% NaN3). Then, 4 μl of diluted samples were mounted onto a slide, covered with a poly-L-lysine-coated coverslip and subjected to SIM imaging.
To visualize Shi localization along actin bundles at the fusogenic synapse (Fig. 8a,b and Extended Data Fig. 9a), 1.2 × 10⁶ S2R+ cells were seeded into each well of a 6-well plate and transfected with pAc-Eff-1-FLAG (200 ng), pAc-Sns-GFP (200 ng) and pAc-Shi-3×HA (or pAc-ShiQ35E-3xHA) (100 ng) for SIM imaging, or pAc-Eff-1-FLAG (150 ng), pAc-Sns-HA (150 ng), pUAST-Shi-GFP (50 ng) and pUbi-Gal4 (50 ng) for STED imaging using Effectene (Qiagen). Samples were washed twice with PBS++ (PBS plus 1 mM CaCl2 and 0.5 mM MgCl2) at 36–48 h post-transfection, fixed with 4% paraformaldehyde diluted in cytoskeleton preservation buffer (80 mM PIPES (pH 6.8), 5 mM EGTA and 2 mM MgCy for 10 min at 37 °C (ref.67), washed in PBS, permeabilized and incubated in PBSBT, and subjected to immunostaining. For SIM imaging, the following labelling reagents were used: rabbit anti-HA antibody (1:600; Thermo Fisher Scientific; 715500), Alexa Fluor 647-conjugated goat anti-rabbit antibody (1:600; Invitrogen) and Alexa Fluor 568-phalloidin (1:200; Sigma-Aldrich). For STED imaging, the following labelling reagents were used: rabbit anti-HA antibody (1:600; Thermo Fisher Scientific; 715500), mouse anti-GFP antibody (1:600; DSHB; 8H11), CF405M-conjugated goat anti-rabbit antibody (1:600; Biotium), Star580-conjugated goat anti-mouse antibody (1:600; Abberior) and StarRed-phalloidin (1:200; Abberior).
To visualize hDyn2 localization along actin bundles on comet tails (Extended Data Fig. 9e,f), 4.5 × 10⁵ HeLa cells were seeded onto 25-mm glass coverslips (Warner Instruments; 64–0715) deposited in 6-well plates the day before infection. GFP-expressing L. monocytogenes strain 10403s (provided by D. Portnoy, University of California, Berkeley) was cultured in 3 ml brain heart infusion media (Gibco) at 30 °C overnight without shaking until an optical density at an absorbance, measured at 600 nm, of 0.8 was reached. The following day, 1 ml Listeria culture was centrifuged at 16,000g for 1 min, washed with PBS, and resuspended in a final volume of 1 ml PBS. HeLa cells were infected with Listeria at a multiplicity of infection of 60, and infection was synchronized by centrifugation for 10 min at 800g. The cells were then incubated at 37 °C for 90 min and washed with PBS, followed by another incubation in fresh media containing 50 μg ml−1 gentamicin for 5 h. HeLa cells were washed twice with PBS++, then fixed with 4% paraformaldehyde diluted in cytoskeleton preservation buffer for 10 min at 37 °C (ref.67). Samples were washed in PBS, permeabilized and incubated in PBSBT, followed by immunostaining. The following labelling reagents were used: mouse anti-hDyn2 (1:50; Santa Cruz Biotechnology; G4), Star580-conjugated goat anti-mouse antibody (1:600; Abberior) and StarRed-conjugated phalloidin (1:200; Abberior).
SIM imaging was performed using a Nikon N-SIM E microscope (Ti-E) equipped with a CFI SR Apochromat TIRF 100×/1.49 oil objective lens and an ORCA-Flash 4.0 sCMOS camera (Hamamatsu Photonics K.K.). Excitation of the fluorophores was performed with three lasers (488, 561 and 640 nm).
STED imaging was performed using an Abberior Instruments Expert Line STED microscope (Abberior Instruments) equipped with an SLM-based easy3D module, an Olympus IX83 microscope body and an UPLSAPO 100×/1.4 oil objective. Excitation of the fluorophores was performed with pulsed excitation lasers at 561 and 640 nm. A pulsed 775-nm laser (pulse width: ~1.2 ns) was used for STED. Both excitation and STED lasers were synchronized and operated at 40 MHz. Time-gated detection of the fluorescence was performed at 605–625 nm for the orange channel and 650–720 nm for the far-red channel. The images were processed using Adobe Photoshop CS6 and ImageJ (NIH) software.
Immunogold PREM.
To visualize Shi localization along actin bundles at the fusogenic synapse at the ultrastructural level, 1.2 × 10⁶ Shi knockdown S2R+ cells were seeded and transfected using Effectene (Qiagen) with pAc-Eff-1-FLAG (175 ng), pAc-Sns-iBlueberry-T2A-HO1 (175 ng) and various Shi constructs: (1) pUAST-Shi-GFP (or pUAST-ShiQ35E-GFP) (100 ng) and pUbi-Gal4 (100 ng); or (2) pAc-Shits2-3×HA (200 ng).
For membrane extraction, cells on glass coverslips were rinsed twice in PBS++ and incubated in extraction solution containing 1% Triton X-100, 4% polyethylene glycol (or PEG), 2 μM unlabelled phalloidin (Sigma-Aldrich; P2141) and 2 μM taxol (Sigma-Aldrich; T7402) in PEM buffer (100 mM PIPES-KOH (pH 6.9), 1 mM MgCl2 and 1 mM EGTA) for 4 min. Membrane-extracted cells were fixed with 0.2% glutaraldehyde (Ted Pella; 18426) prepared in PEM buffer at room temperature for 30 min.
Immunogold staining and platinum replica sample processing were performed as described previously68,69. For immunogold staining, the fixed cells were quenched with 2 mg ml−1 NaBH4 in PBS twice for 10 min each and blocked with 1% BSA in PBS for 20 min. The cells were then incubated with rabbit anti-HA (Sigma-Aldrich; H6908) or anti-GFP (Invitrogen; G10362) antibody diluted 1:50 in PEM buffer for 1 h. The samples were washed in immunogold buffer containing 0.5 M NaCl, 0.05% Tween 20 and 0.05% sodium azide in 20 mM Tris-HCl (pH 8.0) and incubated with secondary antibodies conjugated with 18-nm colloidal gold (Jackson Immuno Research; 111-215-144) diluted (1:10) in immunogold buffer overnight. After washing, the samples were post-fixed with 2% glutaraldehyde. For platinum replica, the cells were post-fixed by sequential treatment with 0.1% tannic acid and 0.2% uranyl acetate in water, dehydrated through a graded ethanol series (10, 20, 40, 60 and 80% for 5 min each, 100% twice for 5 min each, 0.2% uranyl acetate in 100% ethanol for 20 min, and 100% ethanol four times for 5 min each), critical point dried, coated with platinum and carbon and transferred to electron microscopy grids for observation. PREM samples were examined using a JEM-1400Plus transmission electron microscope (JEOL USA) operated at 120 kV. Images were acquired using an AMT BioSprint 16M-ActiveVu CCD camera (AMT) and presented in inverted contrast.
To simulate super-resolution imaging of Shi from the PREM images, a green point spread function mask with a diameter of 110 nm (ref.70) was placed on each gold particle using Adobe Illustrator CC. The opacity was set to 40% for all masks to allow stacking of the green masks where they overlapped.
To analyse the frequency of Shi clusters on actin bundles at the fusogenic synapse (Extended Data Fig. 9c,d), the total number of gold particles, number of gold particles in clusters (each containing ≥3 gold particles in a 100 nm2 square box) and surface area of the actin bundle examined were measured using ImageJ (NIH) software. The density of gold particles was determined as the total number of gold particles divided by the surface area of the actin bundle examined. Actin bundles with similar Shi density were used to analyse the occurrence of Shi clusters, which was determined as the percentage of gold particles in clusters versus the total number of gold particles.
Statistics and reproducibility.
Statistical significance was assessed using two-tailed Student’s t-test. P values were obtained using Microsoft Excel 2016. The numbers of biological replicates for each experiment, independent samples for immunofluorescence images and independent experiments for western blots are indicated in the figure captions.
Reporting Summary.
Further information on research design is available in the Nature Research Reporting Summary linked to this article.
Extended Data
Extended Data Fig. 1 |. Shi is required for myoblast fusion.
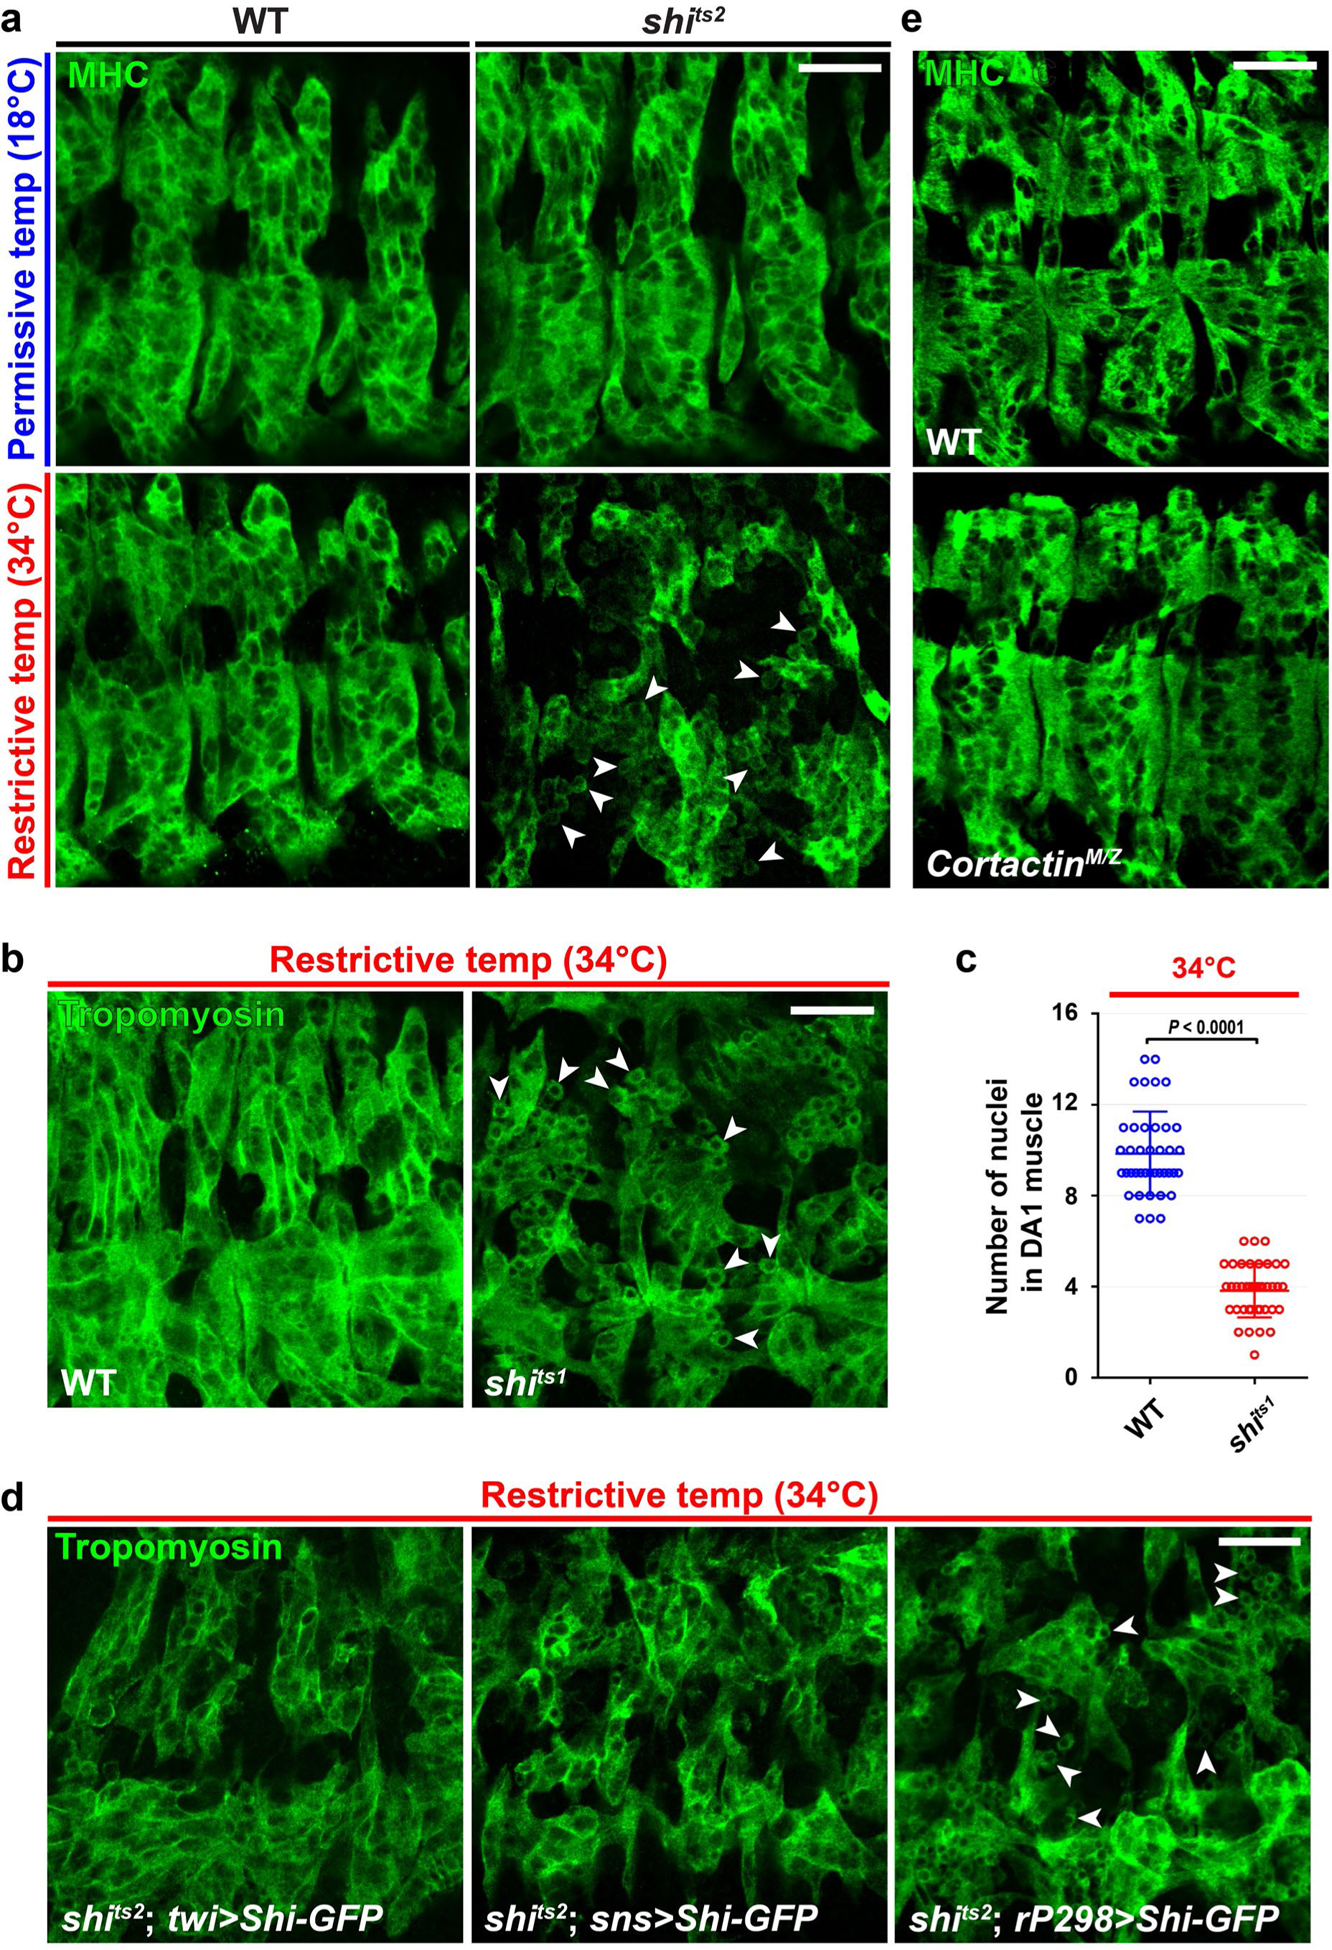
a, Myoblast fusion defect in shits2 mutant embryo. The somatic muscles in stage 15 wild-type (WT) and shits2 mutant embryos were labeled by anti-muscle myosin heavy chain (MHC) antibody. Note the presence of unfused mononucleated myoblasts in shits2 mutant embryo at the restrictive temperature (several selected unfused FCMs indicated by arrowheads). n = 11, 8, 40 and 74 (top left, bottom left, top right, bottom right) embryos were imaged, with similar results. See quantification in Fig. 1b. b, Myoblast fusion defects in shits1mutant embryo. The somatic muscles in stage 15 wild-type and shits1 mutant embryos were labeled by anti-Tropomyosin antibody. Several selected unfused FCMs in shits1mutant embryo at the restrictive temperature are indicated by arrowheads. n = 8 and 24 (left to right) embryos were imaged, with similar results. See quantification in (c). c, Quantification of the fusion index of genotypes shown in (b). n = 40 DA1 muscles analyzed for wild type and shits1, respectively. Mean±s.d. values are shown in the dot plot, and significance was determined by the two-tailed Student’s t-test. d, Phenotypic rescue of myoblast fusion in shits2 mutant embryos. Note that expression of Shi-GFP in all muscles (twi-GAL4) or FCMs (sns-GAL4), but not in founder cells (rP298-GAL4), restored myoblast fusion in shits2embryos at the restrictive temperature. Several selected unfused FCMs indicated by arrowheads. n = 22, 7 and 8 (left to right) embryos were imaged, with similar results. See quantification in Fig. 1b. e, Myoblast fusion is normal in CorfacfinM/Z mutant embryos. The somatic muscles in late stage 15 wild type and CorfacfinM/Z mutant embryos were labeled by anti-MHC antibody. n = 20 and 15 (top to bottom) embryos were imaged, with similar results. Scale bars: 20 μm (a, b, d and e). Numerical source data are provided with the paper.
Extended Data Fig. 2 |. Localization of Shibire at the fusogenic synapse in Drosophila embryos and S2R+ cells.
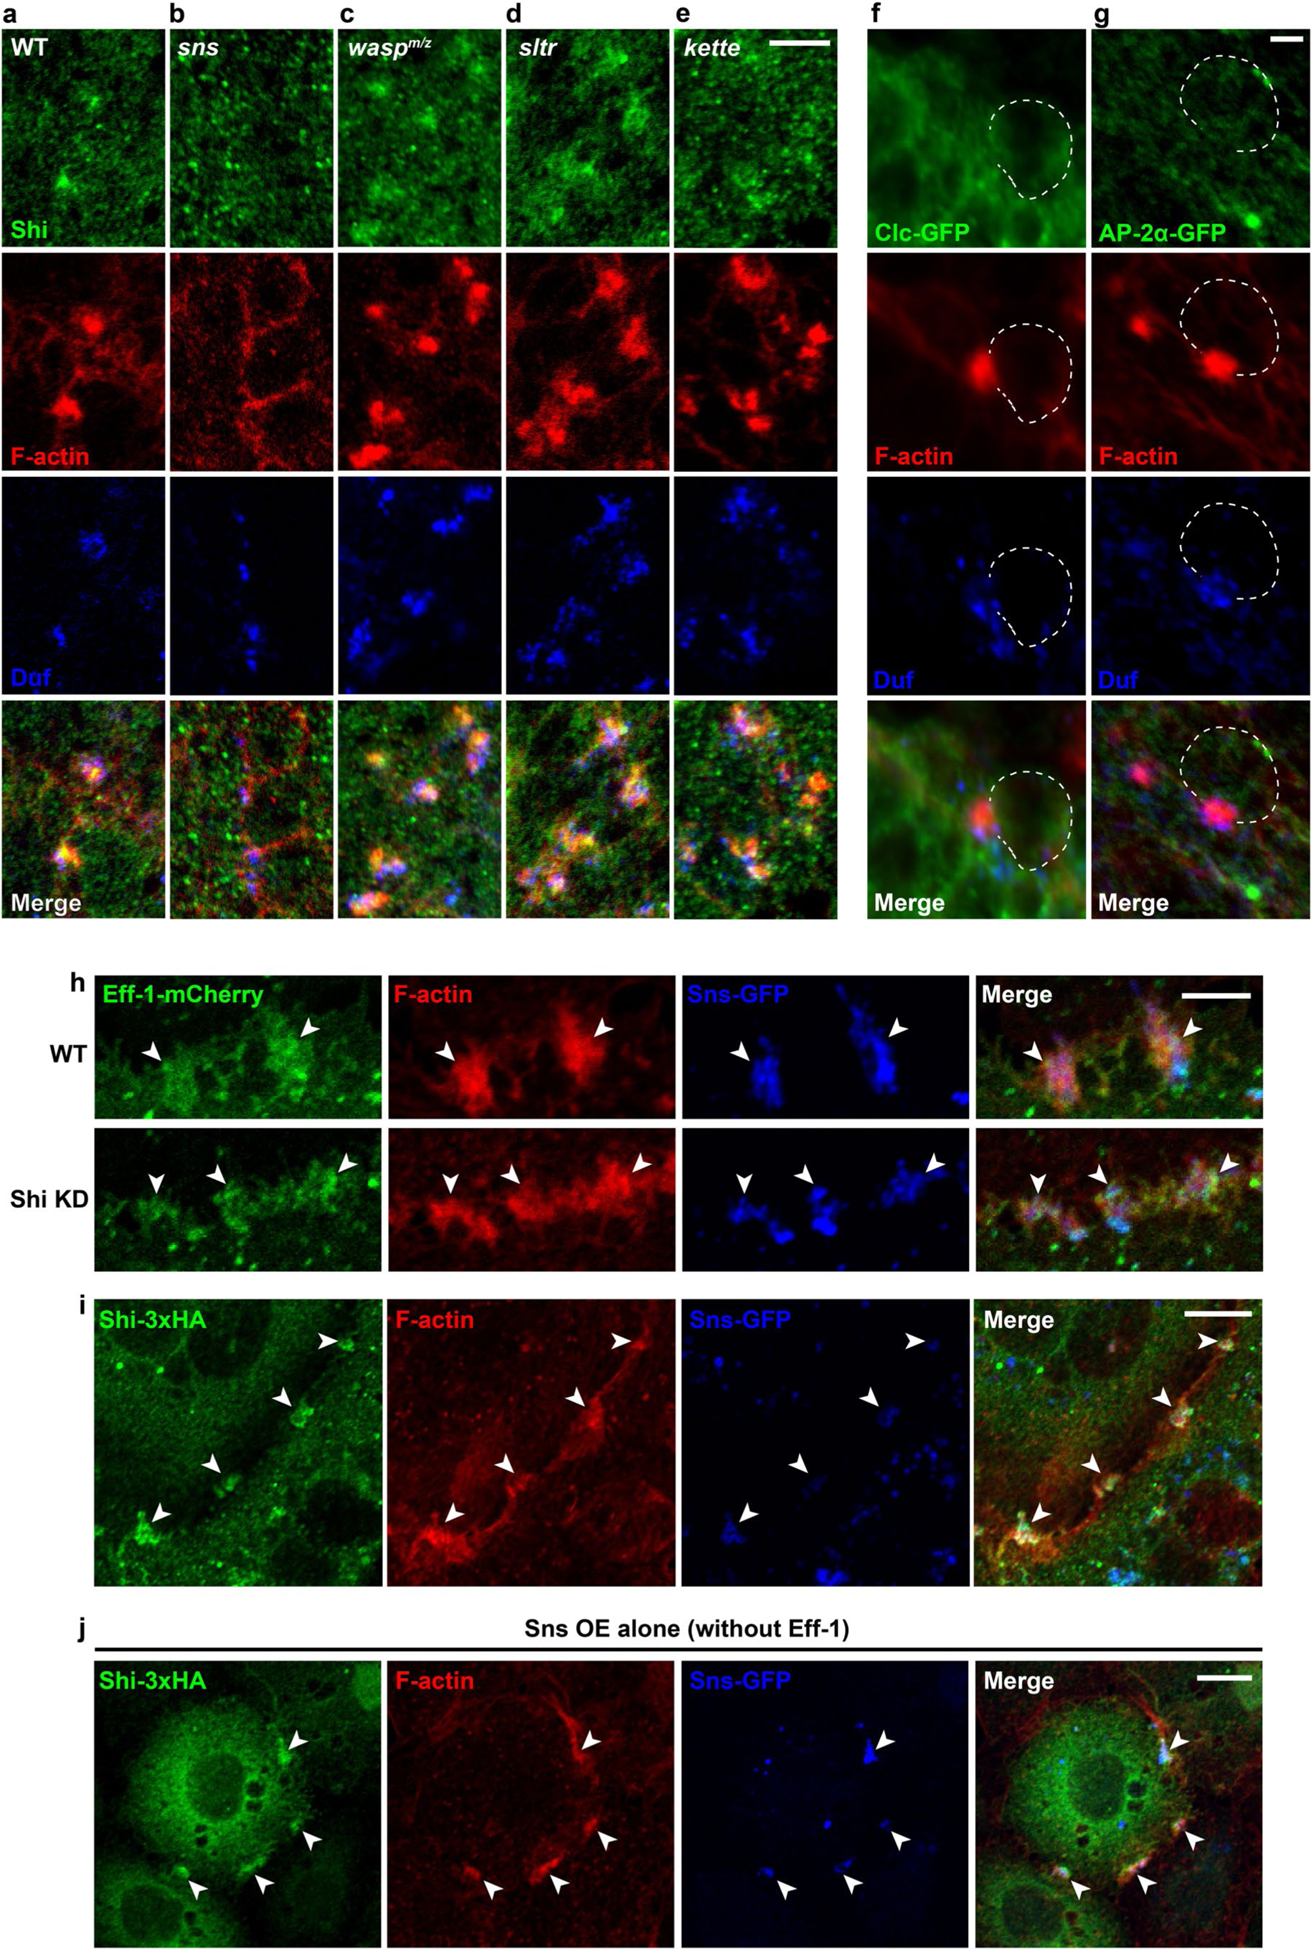
a-e, The recruitment of Shi to the fusogenic synapse depends on the FCM-specific cell adhesion molecule (CAM) Sns, but not on actin polymerization regulators. Stage 14 embryos of various genotypes were labeled with anti-Shi (endogenous Shi; green), phalloidin (F-actin; red), and anti-Duf (founder cell-specific CAM enriched at the fusogenic synapse; blue). Shi and F-actin were enriched at the fusogenic synapse in wild type (a), waspm/z (c), slfr (d), and keffe (e) mutant embryos, but not in the sns mutant embryo (b). n = 72, 60, 92, 96, 65 fusogenic synapses (left to right) were imaged, with similar results. f-g, Two endocytosis-related proteins, Clc and AP-2a, are not enriched at the fusogenic synapse. Stage 14 embryos expressing Clc-GFP (f) or AP-2α-GFP (g) were labeled with phalloidin (red) and anti-Duf (blue). The FCM is outlined. n = 55 and 54 fusogenic synapses (left to right) were imaged, with similar results. h, Eff-1-mCherry localization in wild type and Shi knockdown S2R+ cells. Cells expressing Eff-1-mCherry (green) and Sns-GFP (blue) were labeled with phalloidin (red). Note the indistinguishable Eff-1-mCherry enrichment (arrowheads) at the fusogenic synapse in wild type and Shi knockdown cells. n = 65 (wild type) and 70 (Shi knockdown) fusogenic synapses were imaged, with similar results. i,j, Shi colocalizes with F-actin-enriched structures in S2R+ cells. Cells expressing Shi- 3xHA (green) and Sns-GFP (blue) with (i) or without (j) Eff-1 were labeled with phalloidin (red). Note that Shi-3xHA colocalized with the F-actin and Sns enriched areas (arrowheads) regardless of Eff-1 expression. n = 92 (i) or 65 (j) fusogenic synapses were imaged, with similar results. Scale bars: 5 μm (a-e and h), 2 μm (f and g), 10 μm (i and j).
Extended Data Fig. 3 |. Shibire and ShibireAKE mutant bundle actin filaments.
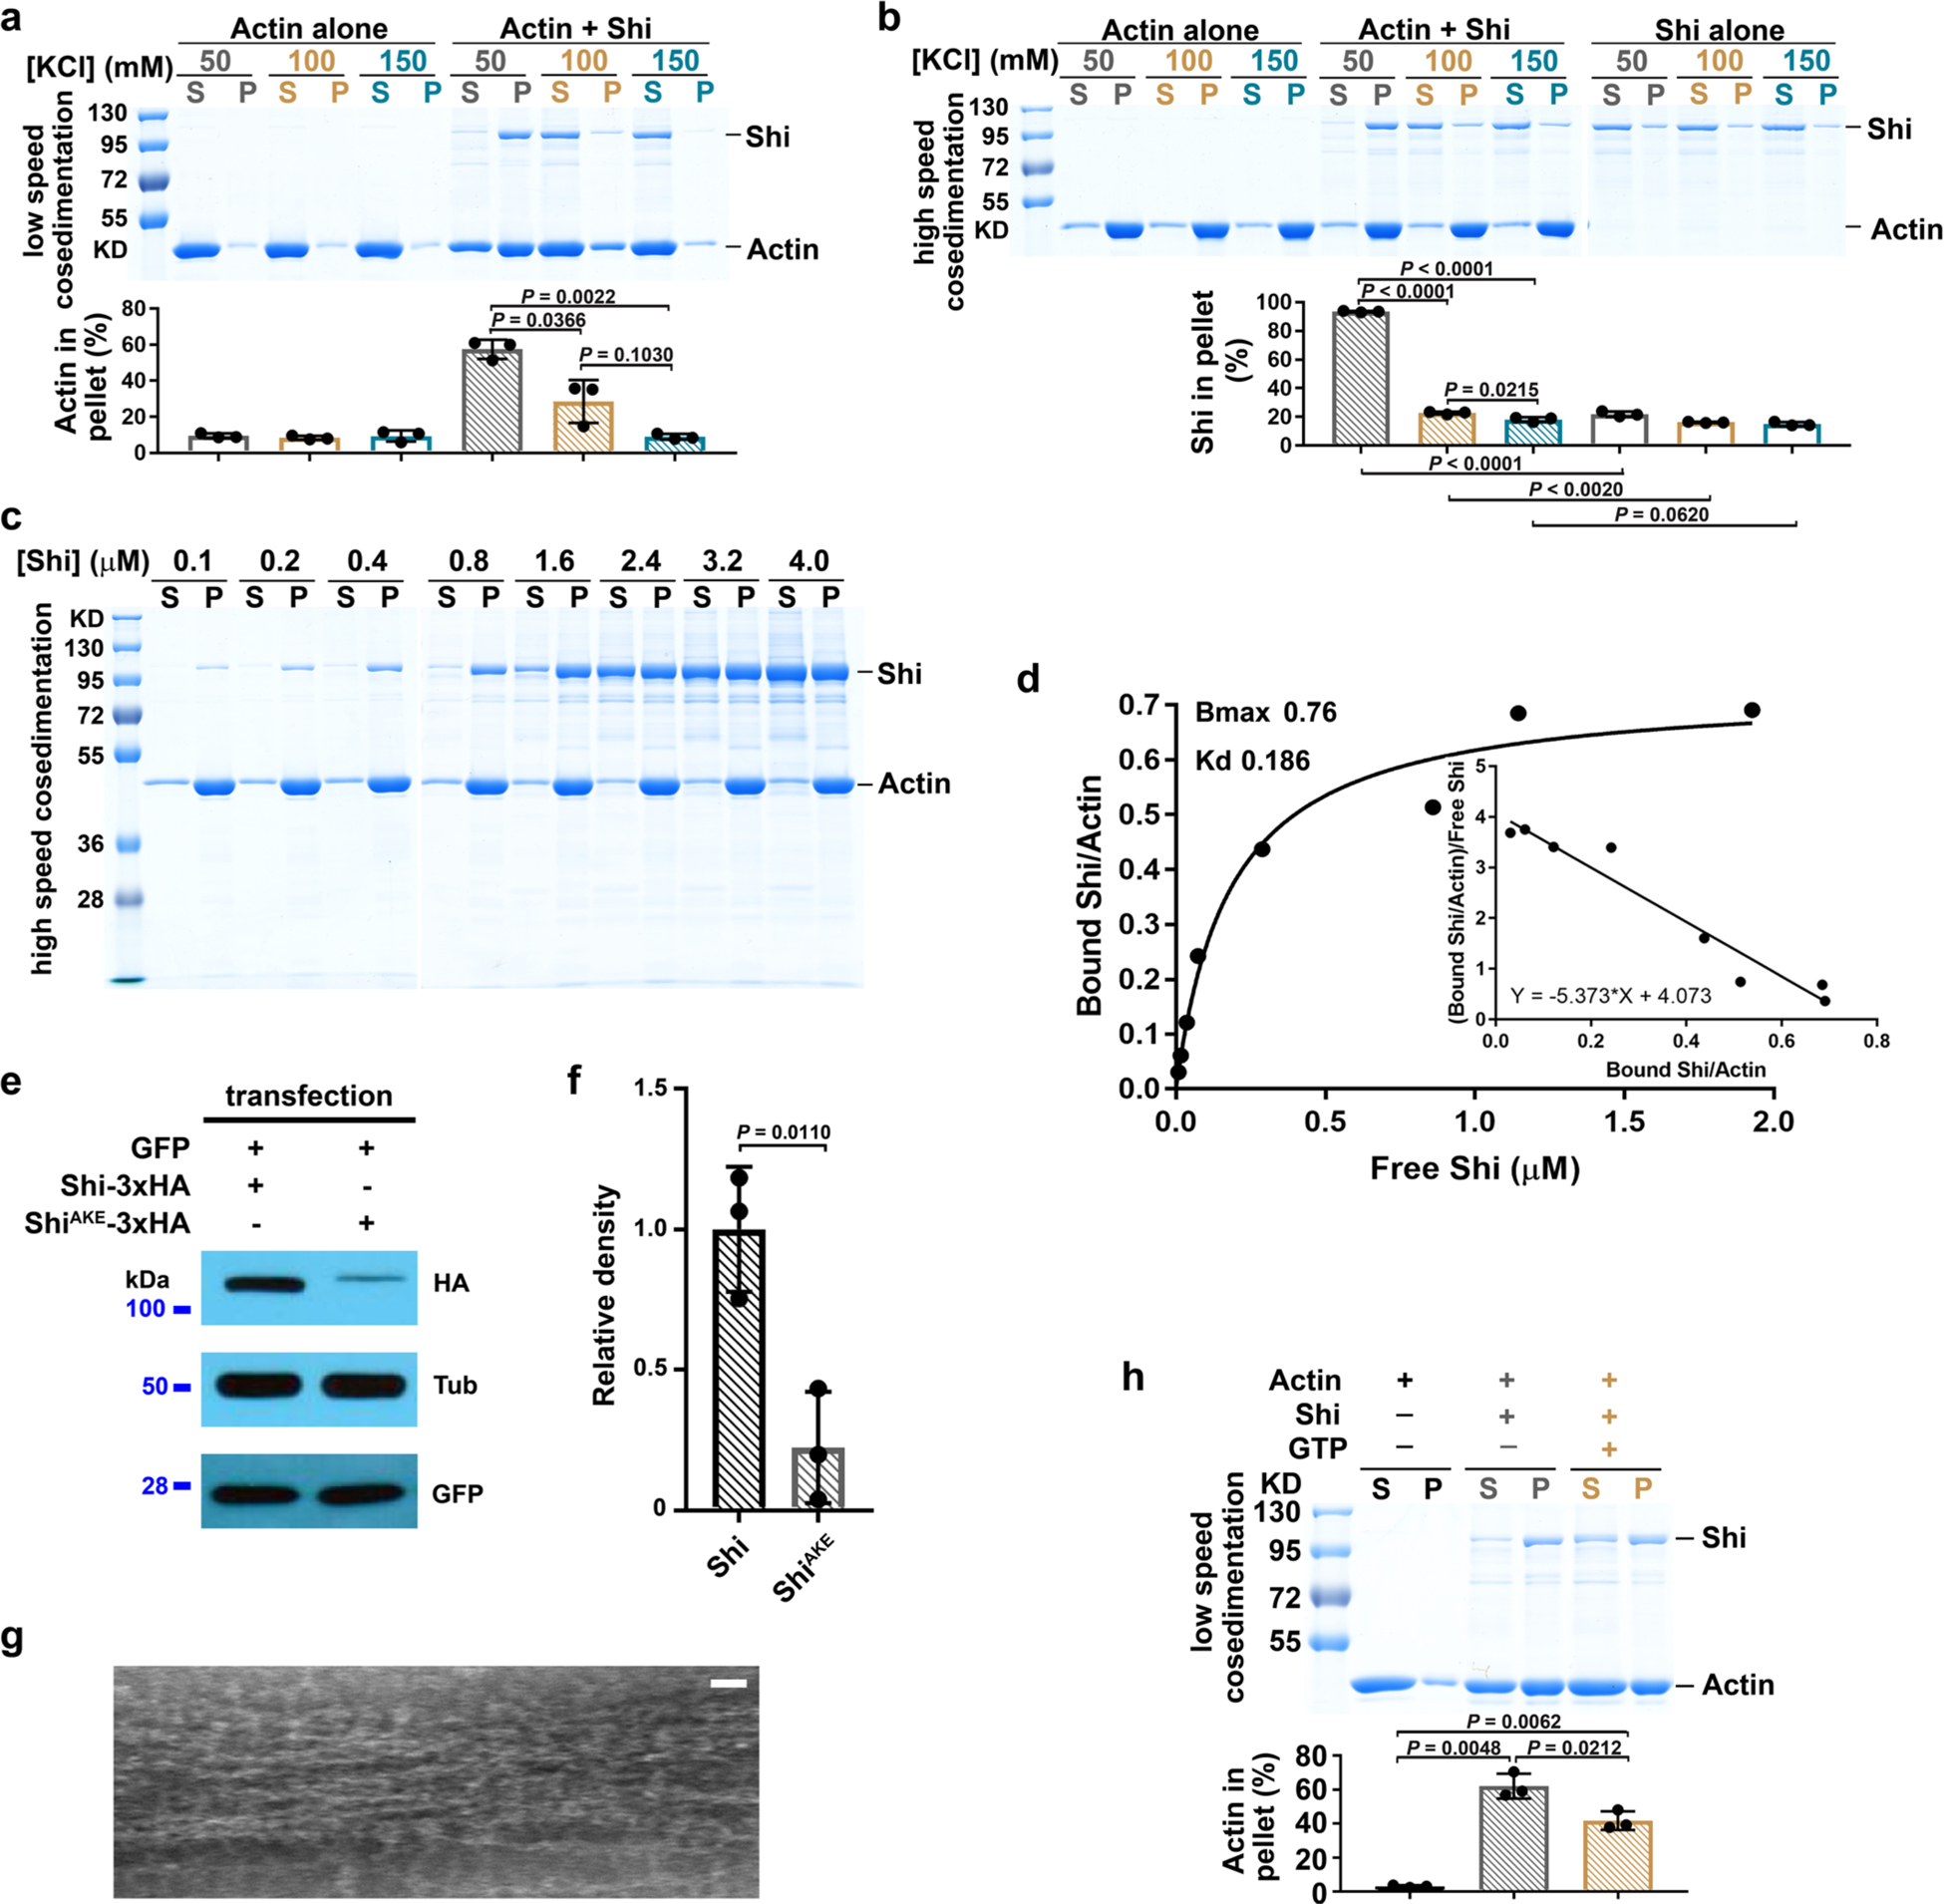
a, Shi bundles actin filaments at low salt condition. Low speed co-sedimentation assays were performed and quantified as in Fig. 2a. 3 μM G-actin was incubated alone or with 0.5 μM Shi at different salt (KCl) concentrations as indicated. Mean±s.d. values are shown in the dot plot, and significance was determined by the two-tailed Student’s t-test (as in b, f and h). n = 3 independent experiments. b, Shi binds actin filaments at low salt condition. High speed co-sedimentation assays were performed and quantified as in Fig. 3f. 3 μM G-actin or 0.5 μM Shi was incubated alone or together at different salt (KCl) concentrations as indicated. n = 3 independent experiments. c, High speed co-sedimentation assays were performed with 3 μM G-actin and increasing concentrations of Shi. Supernatants (S) and pellets (P) were monitored by SDS-PAGE after centrifugation at 50,000g. n = 3 independent experiments with similar results. See quantification in (d). d, Analysis of Shi-actin binding shown in (c). The concentration of bound Shi was plotted against that of free Shi and fitted to a hyperbolic function (one site binding). Scatchard analysis of Shi-actin binding was performed to calculate the stoichiometry of binding and dissociation equilibrium constant. n = 3 independent experiments. e, ShiAKE is less stable than Shi. Shi-3xHA and ShiAKE-3xHA were transfected into S2R+ cells co-expressing GFP and the cell lysates were subjected to western blot analysis. α-Tubulin and GFP were used as loading and transfection controls, respectively. n = 3 independent experiments with similar results. See quantification in (f). f, Quantification of western blot analyses, one of which is shown in (e). n = 3 independent experiments. g, Electron micrograph of negatively stained actin filaments in the presence of purified ShiAKE. n = 22 actin bundles were imaged, with similar results. Scale bar: 30 nm. h, Shi bundles actin filaments in the presence of GTP. 3 μM G-actin was incubated alone or with 0.5 μM Shi in the absence or presence of 1 mM GTP, and subjected to low speed co-sedimentation assays. n = 3 independent experiments. Numerical source data and unprocessed blots are provided with the paper.
Extended Data Fig. 4 |. The PRD domain of Shibire mediates Shibire-actin interaction.
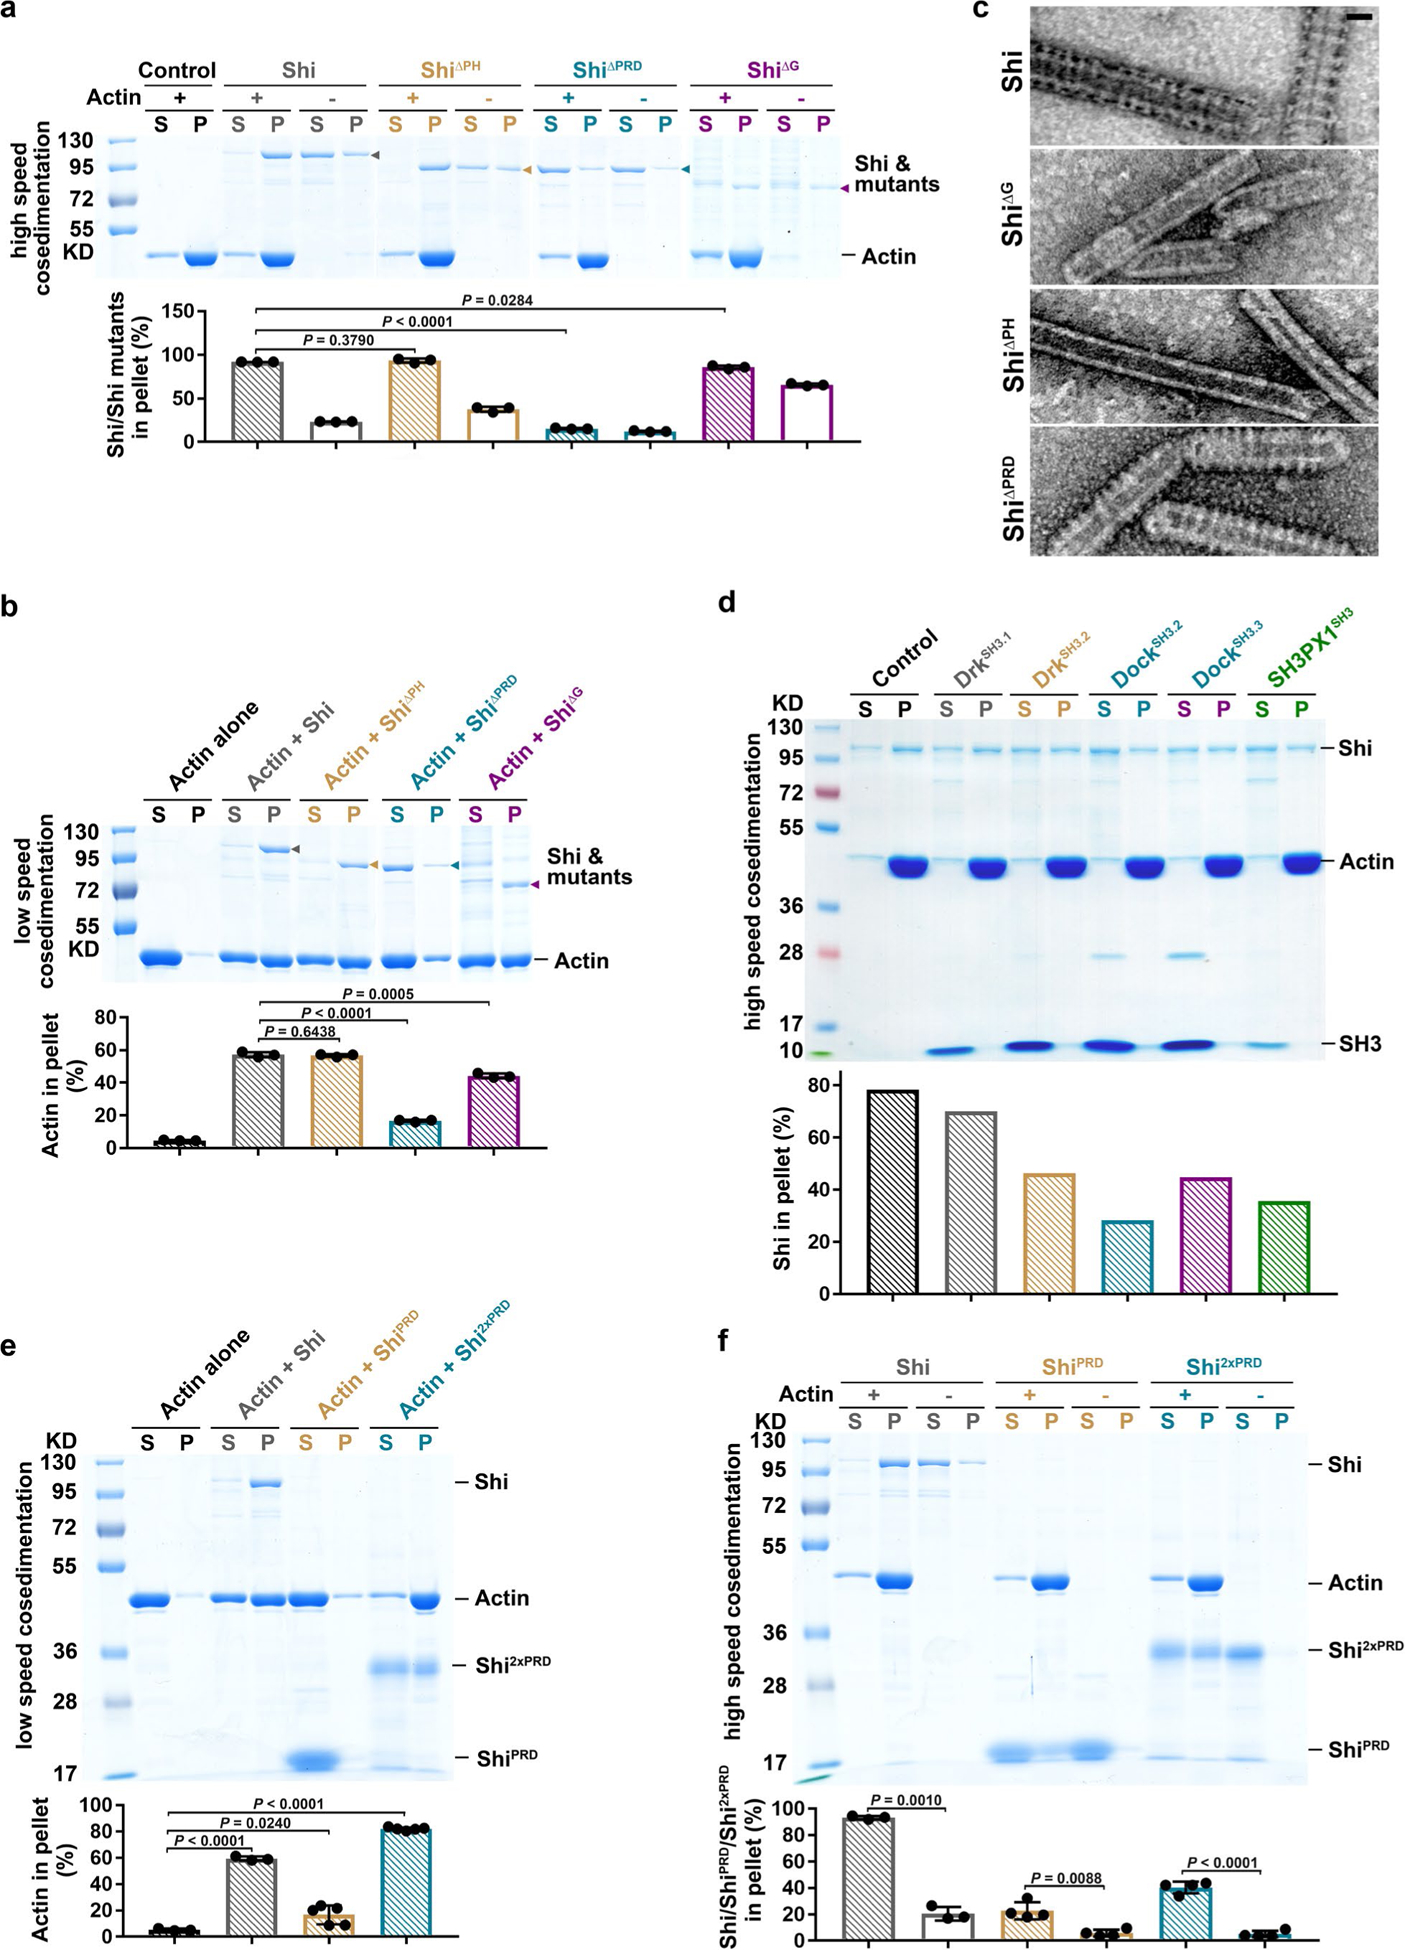
a, The PRD domain is required for Shi-actin binding. 0.5 μM Shi (or a Shi deletion mutant as indicated) was incubated alone or with 3 μM G-actin. The wild-type Shi and Shi mutant bands are marked by arrowheads. Mean±s.d. values are shown in the dot plot, and significance was determined by the two-tailed Student’s t-test (as in b, e and f). n = 3 independent experiments. b, The PRD and G domains, but not the PH domain, are involved in actin bundling. 3 μM G-actin was incubated alone or with 0.5 μM Shi (or a Shi deletion mutant as indicated), and subjected to low speed co-sedimentation assays. The wild-type Shi and Shi mutant bands are marked by arrowheads. n = 3 independent experiments. c, Electron micrographs of negatively stained lipid nanotubes that were incubated with Shi (or a Shi deletion mutant). n = 63, 76, 75, 94 (top to bottom) nanotubes were imaged, with similar results. Scale bar: 30 nm. d, SH3 domains interfere with, but do not block, Shi-actin interaction. 6 μM G-actin was incubated with 0.5 μM Shi in the absence or presence of a SH3 domain as indicated, and subjected to high speed co-sedimentation assays. n = 2 independent experiments (one is shown) with similar results. e, Actin-bundling activity of tandem PRD. 3 μM G-actin was incubated alone or with 0.5 μM Shi, 1.5 μM ShiPRD or 1 μM Shi2xPRD, respectively, and subjected to low speed co-sedimentation assays. n = 3, 3, 5, 5 (left to right) independent experiments. f, Actin-binding activity of single and tandem PRD. 0.5 μM Shi, 1.5 μM ShiPRD or 1 μM Shi2xPRD was incubated alone or with 3 μM G-actin, and subjected to high speed co-sedimentation assays. n = 3, 3, 4, 4, 4, 4 (left to right) independent experiments. Numerical source data and unprocessed blots are provided with the paper.
Extended Data Fig. 5 |. Critical role for the PRD in actin bundling.
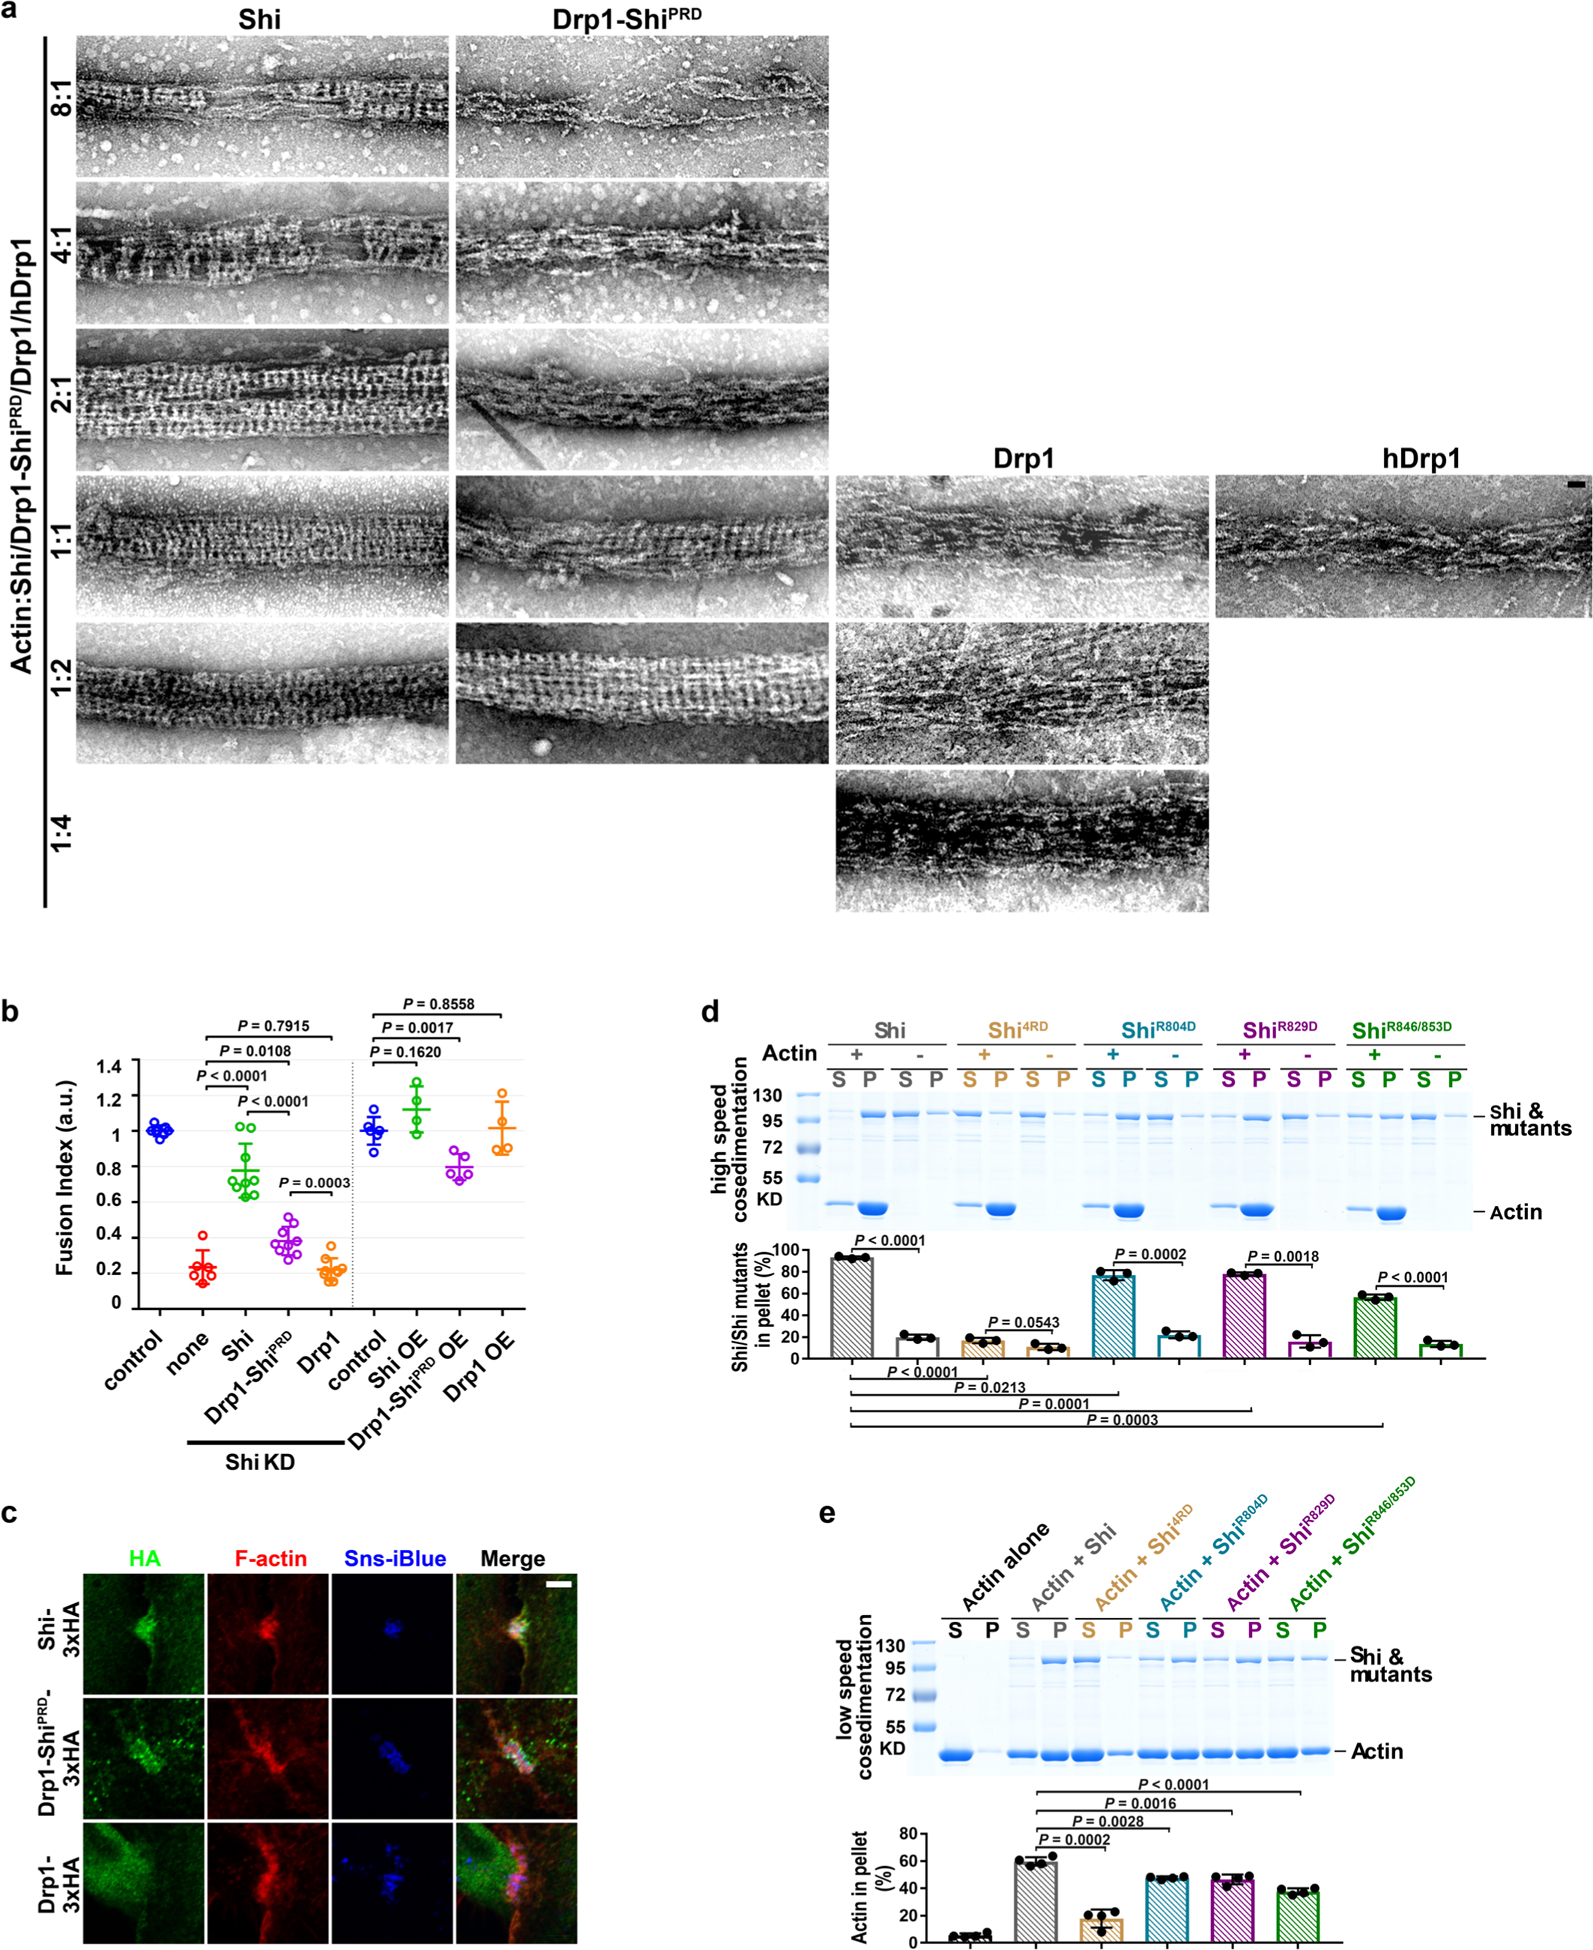
a, Electron micrographs of negatively stained actin filaments mediated by Drosophila Shi, Drp1-ShiPRD, Drp1, and human Drp1 (hDrp1). Different ratios of actin to Shi/Drp1-ShiPRD/Drp1/hDrp1 are indicated on the left. Note that Shi formed rings along actin bundles when actin:Shi = 8:1, whereas Drp1-ShiPRD started to form rings along actin bundles when actin:Drp1-ShiPRD = 1:1. Neither Drosophila or hDrp1 formed rings along actin bundles. n = 12, 11, 24, 10, 11, 7, 10, 12, 30, 59, 6, 5, 5, 16 (top to bottom and left to right) actin bundles imaged with similar results. b, Quantification of the fusion indices of S2R+ cells expressing Shi, Drp1-ShiPRD or Drp1. Note that Drp1-ShiPRD, but not Drp1, partially rescued the cell fusion defect in Sns-Eff-1-expressing Shi knockdown cells. Overexpression (OE) of Drp1-ShiPRD, but not Drp1, caused a dominant negative effect on the fusion of Sns-Eff-1-expressing cells. All Shi and mutant constructs were tagged with 3xHA. n = 7, 6, 9, 9, 9, 6, 4, 5 and 4 (left to right) independent experiments. Mean± s.d. values are shown in the dot plot, and significance was determined by the two-tailed Student’s t-test (as in d and e). c, Drp1-ShiPRD, but not Drp1, is enriched at the fusogenic synapse of S2R+ cells. Sns-Eff-1-expressing S2R+ cells were labeled by anti-HA (green), phalloidin (red) and Sns-iBlueberry (blue). The fusogenic synapses were marked by F-actin and Sns enrichment. n = 30, 90 and 102 (top to bottom) fusogenic synapses were imaged, with similar results. d, Actin-binding activity of Shi and its PRD domain mutants. 0.5 μM Shi (or a PRD mutant as indicated) was incubated alone or with 3 μM G-actin, and subjected to high speed co-sedimentation assays. n = 3 independent experiments. e, Actin-bundling activity of Shi and its PRD domain mutants. 3 μM G-actin was incubated alone or with 0.5 μM Shi (or a PRD mutant as indicated), and subjected to low speed co-sedimentation assays. n = 4 independent experiments. Scale bars: 30 nm (a), 5 μm (c). Numerical source data and unprocessed blots are provided with the paper.
Extended Data Fig. 6 |. Localization and endocytic function of Shi PRD domain mutants.
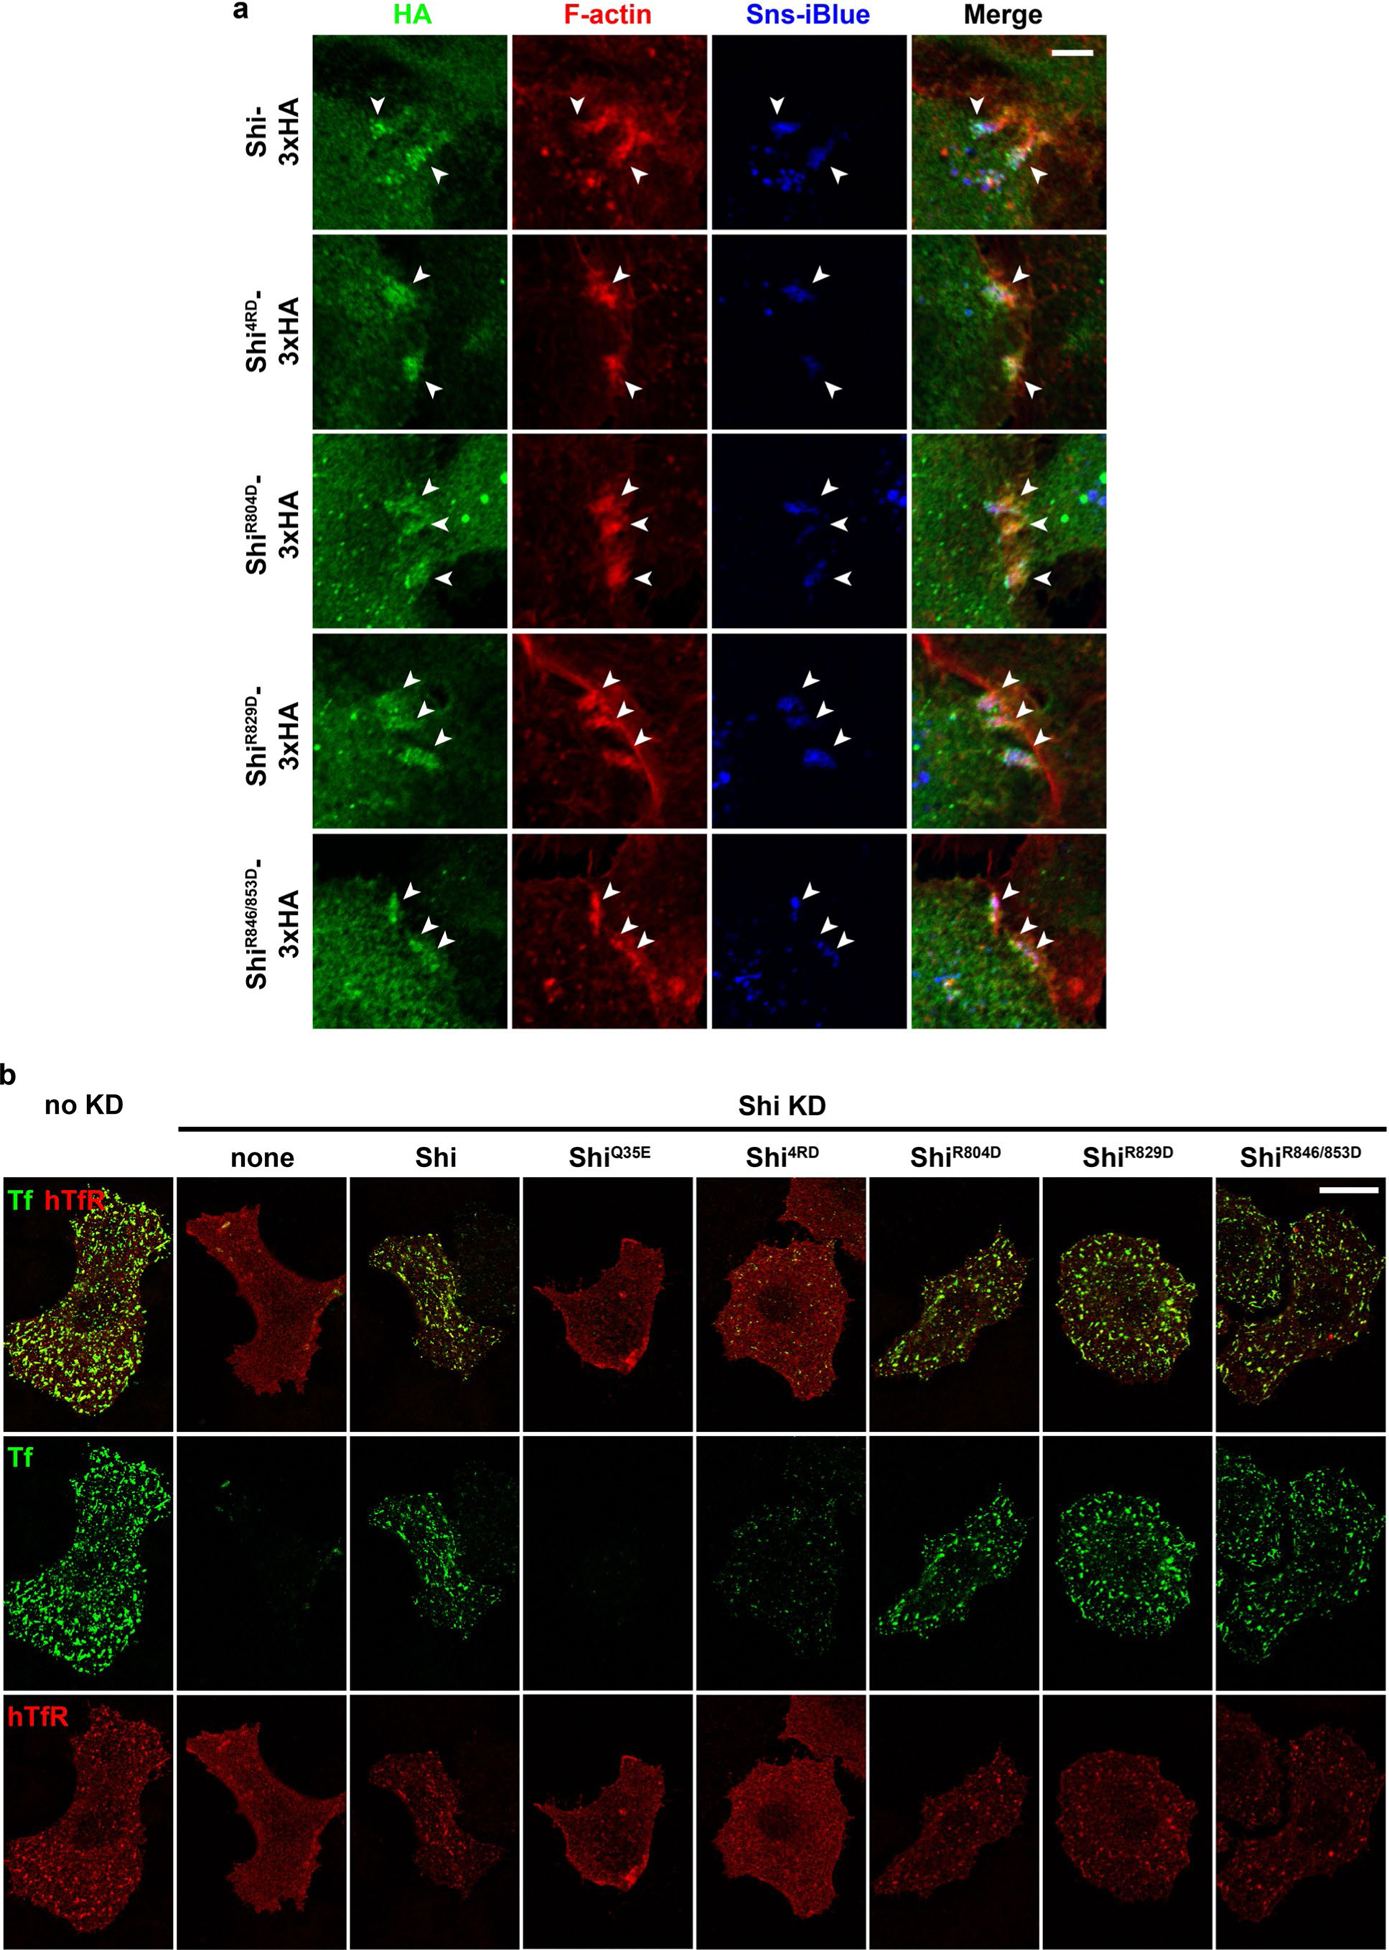
a, Shi PRD domain mutants (ShiR804D, ShiR829D, ShiR846/853D and Shi4RD) are enriched at the fusogenic synapse. Sns-Eff-1-expressing S2R+ cells were labeled by anti-HA (green), phalloidin (red) and Sns-iBlueberry (blue). The fusogenic synapses were marked by F-actin and Sns enrichment. n = 52, 65, 56, 77 and 73 (top to bottom) fusogenic synapses were imaged, with similar results. b, Pulse-chase transferrin (Tf) uptake assays were performed with Shi mutants in Shi knockdown S2R+ cells. Cells were labeled with Tf-Alexa488 (green) and anti-human Tf receptor (hTfR) (red). Note that Shi PRD domain mutants (ShiR804D, ShiR829D, and ShiR846/853D) rescued the endocytosis defect in Shi knockdown cells as did wild type Shi. Shi4RD partially rescued endocytosis, whereas the GTPase domain mutant ShiQ35E did not rescue the endocytosis defect. n = 25, 28, 27, 22, 35, 20, 20 and 20 (left to right) cells were imaged, with similar results. See quantification in Fig. 4i. Scale bars: 5 μm (a), 20 μm (b).
Extended Data Fig. 7 |. Cryo-ET of hDynl- and Shi-mediated actin bundles.
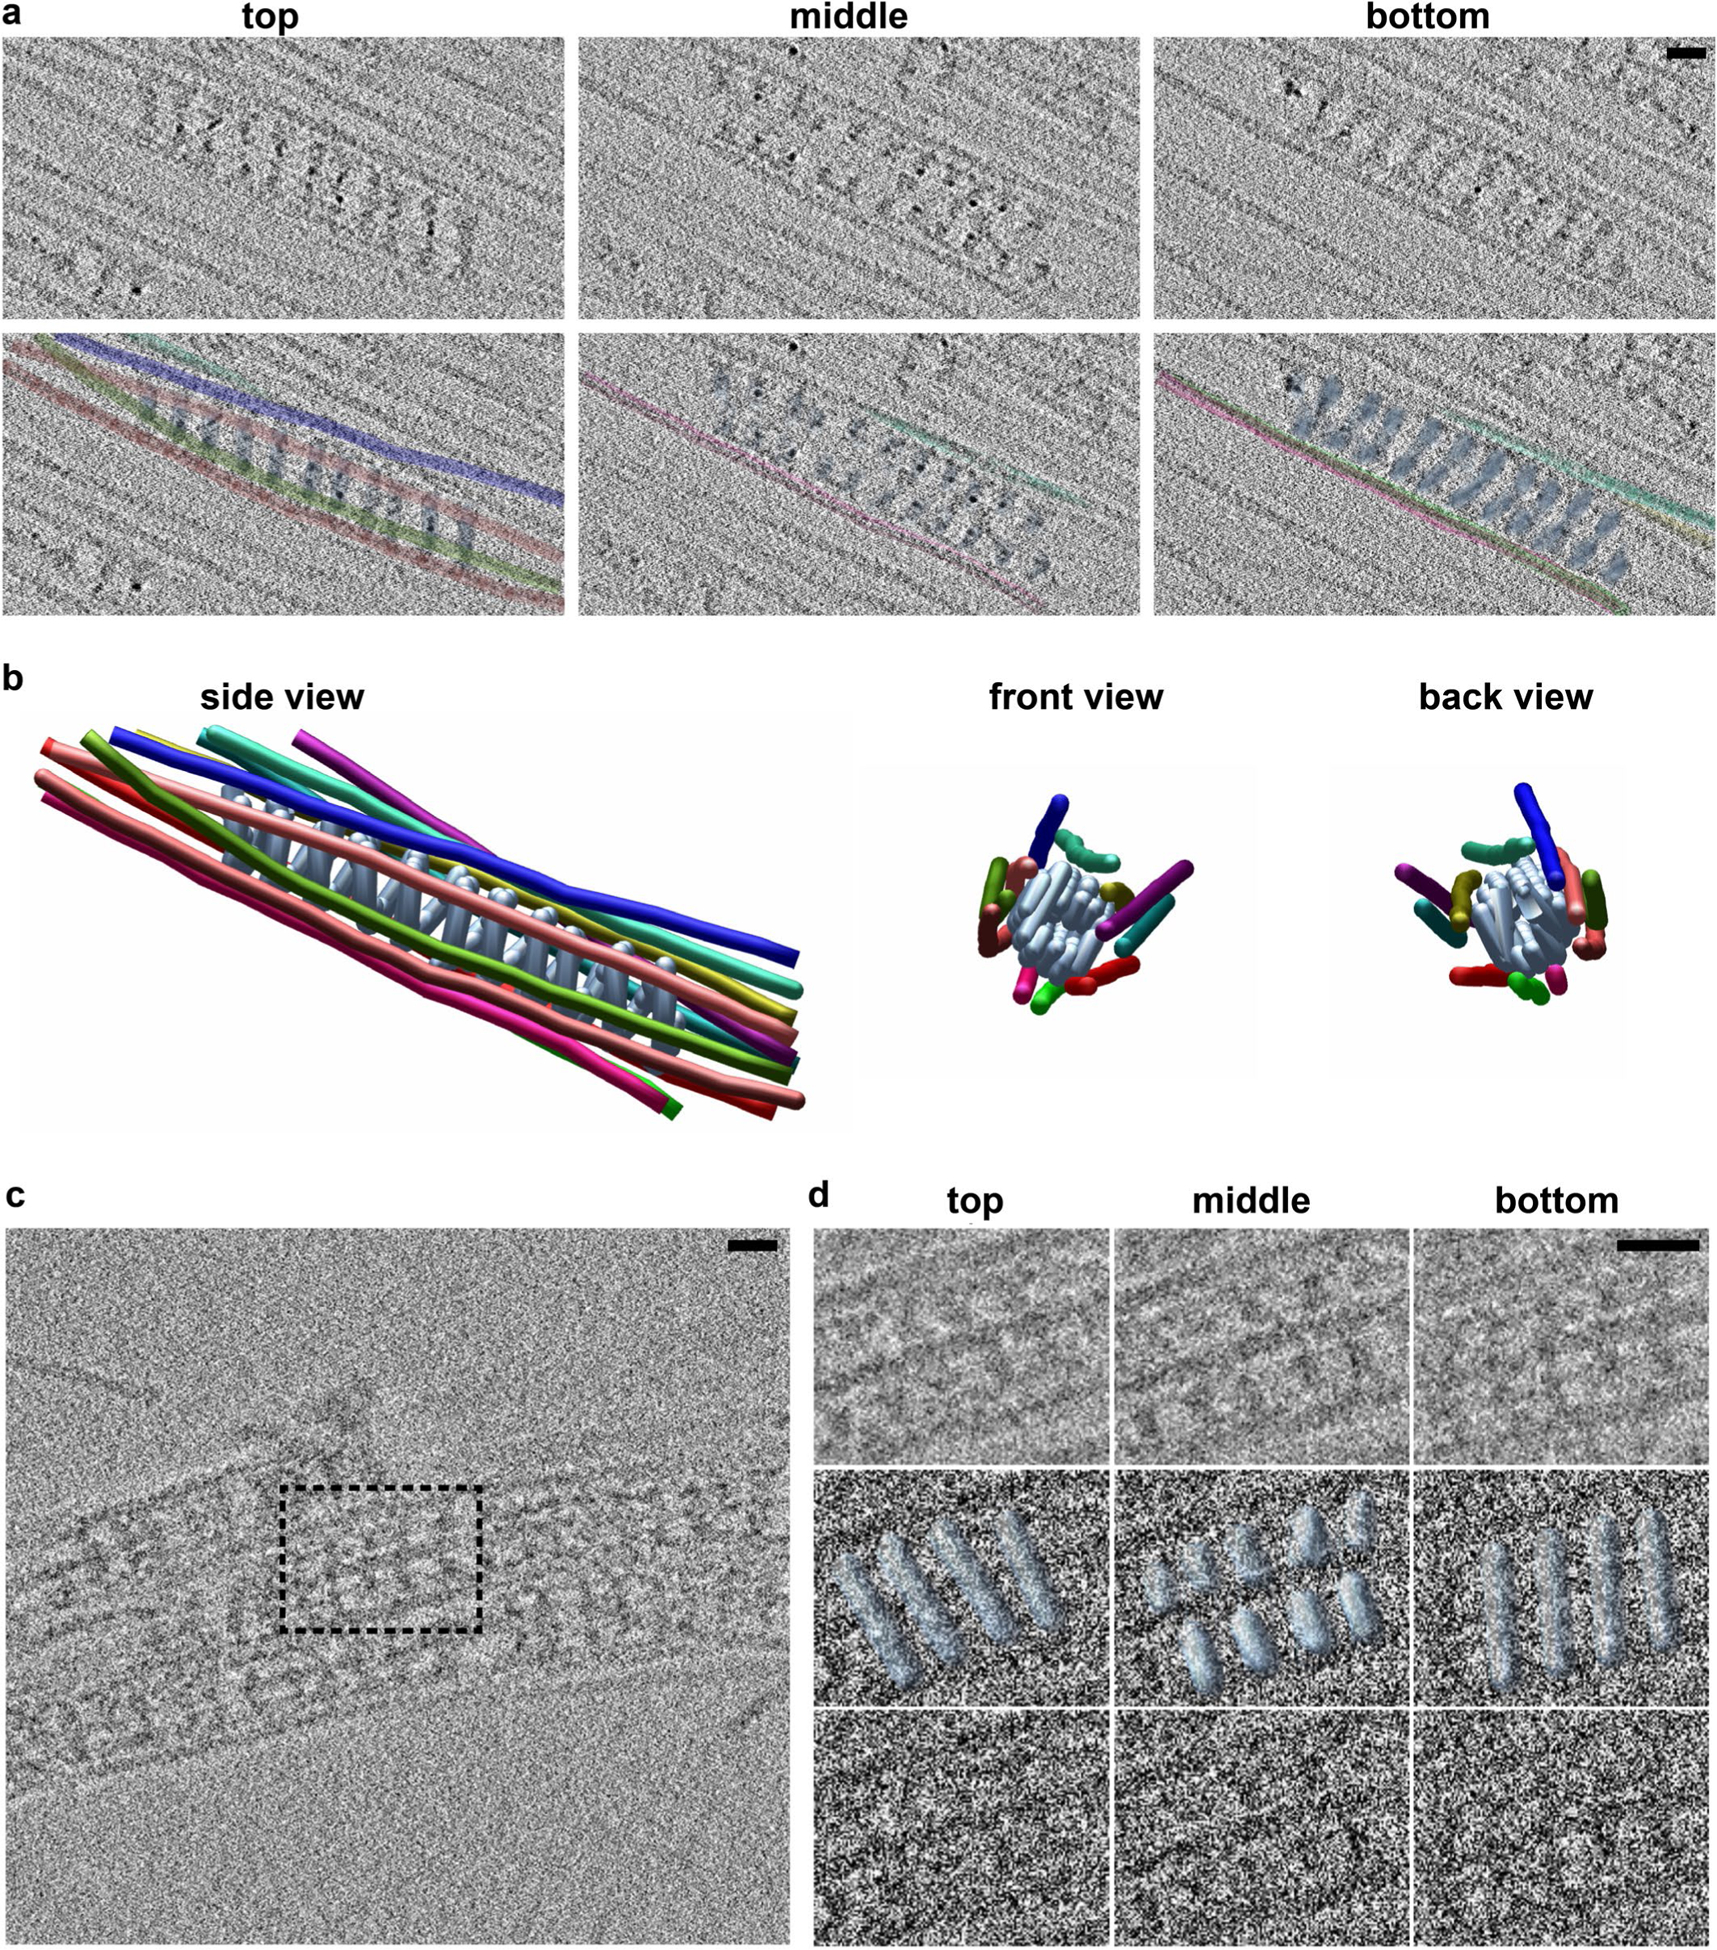
a, Sections through the cryo-tomogram with hDynl (light blue) and associated actin filaments (rainbow colored) (area corresponding to that in Fig. 5e left panel). The top section reveals a right-handed tilt of hDynl, the middle shows the T-shaped structures, and the bottom shows a left-handed tilt, consistent with a helical polymer. n = 3 tomograms were collected, with similar results. b, Tomogram-derived model of actin filaments bundled by a hDynl helix showing the side, front, and back views. Colors are the same as in (a). Figure is representative from three experiments of tomograms showing hDynl-actin interaction. c, Cryo-ET of three parallel Shi-mediated actin bundles. Boxed area of the tomogram enlarged in (d). n = 13 tomograms were collected, with similar results. d, Shi assembles as helices surrounded by actin filaments. Top, middle, and bottom views of the boxed region in (c) are consistent with a Shi helical polymer (light blue). The top panels are the boxed area binned for ease of visualization. The middle panels have the modelled Shi helix docked onto the unbinned tomogram. The bottom panel is a view of the unbinned tomogram. Figure is representative of 13 experiments of tomograms showing Shi-actin interaction. Scale bar: 20 nm (a, c and d). Numerical source data are provided with the paper.
Extended Data Fig. 8 |. GTP addition triggers increased Arp2/3-mediated branched actin polymerization on dynamin-actin bundles.
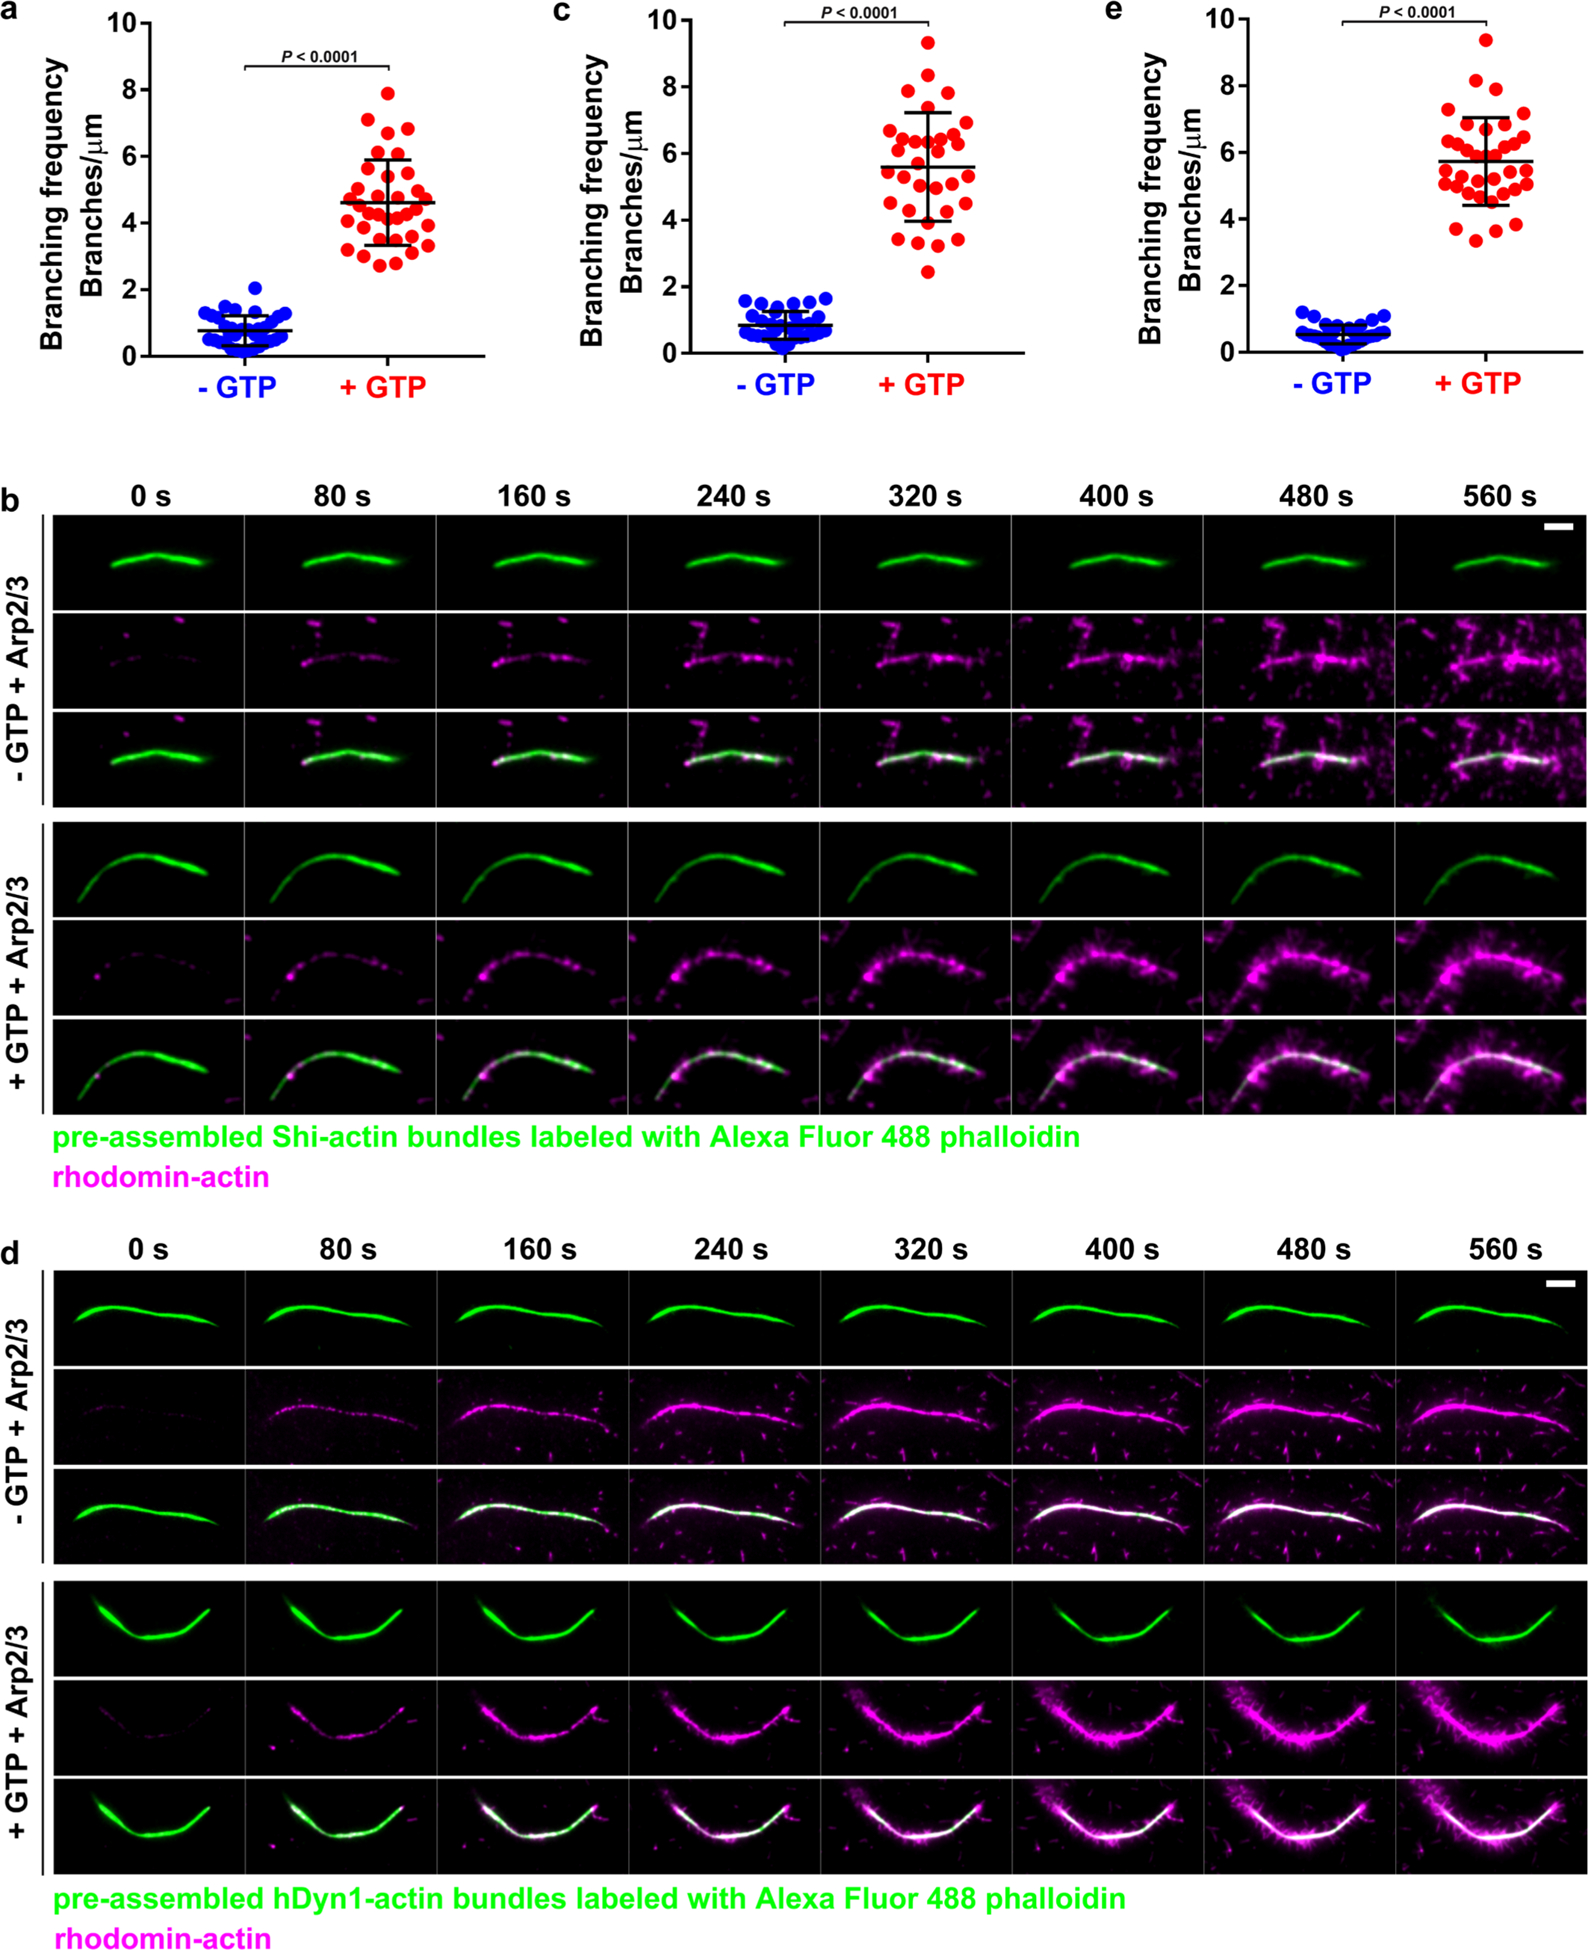
a, Quantification of Arp2/3-mediated branched actin filaments on Shi-actin bundles in the absence or presence of GTP shown in Fig. 6h. n = 34 actin bundles. Mean± s.d. values are shown in the dot plot, and significance was determined by the two-tailed Student’s t-test (as in c and e). b, Time-lapse stills of TIRF images of Arp2/3-mediated branched actin polymerization on Shi-actin bundles in the absence or presence of GTP (Supplementary Video 13). 2 μM Shi was first incubated with 1 μM Alexa Fluor 488 phalloidin-labeled actin (green) to generate actin bundles. Subsequently, Arp2/3, VCA and rhodamine-G-actin (magenta) were added to the Shi-actin bundles to start branched actin polymerization without (top three panels) or with (bottom three panels) 1 mM GTP. n = 32 actin bundles in the absence or presence of GTP were imaged, with similar results. See quantification in (c). c, Quantification of Arp2/3-mediated branched actin filaments in (b). n = 32 actin bundles. d, Time-lapse stills of TIRF images of Arp2/3-mediated branched actin polymerization on hDyn1-actin bundles in the absence or presence of GTP (Supplementary Video 15). 2 μM hDyn1 was first incubated with 1 μM Alexa Fluor 488 phalloidin-labeled actin (green) to generate actin bundles, followed by a wash with TIRF buffer without (top three panels) or with (bottom three panels) 0.01 mM GTP. Subsequently, Arp2/3, VCA and rhodamine-G-actin (magenta) were added to start branched actin polymerization. n = 34 and 35 actin bundles in the absence or presence of GTP, respectively, imaged with similar results. See quantification in (e). e, Quantification of Arp2/3-mediated branched actin filaments in (d). n = 34 and 35 (left to right) actin bundles. Scale bar: 5 μm (b and d). Numerical source data are provided with the paper.
Extended Data Fig. 9 |. Localization of dynamin on actin-enriched structures in cells.
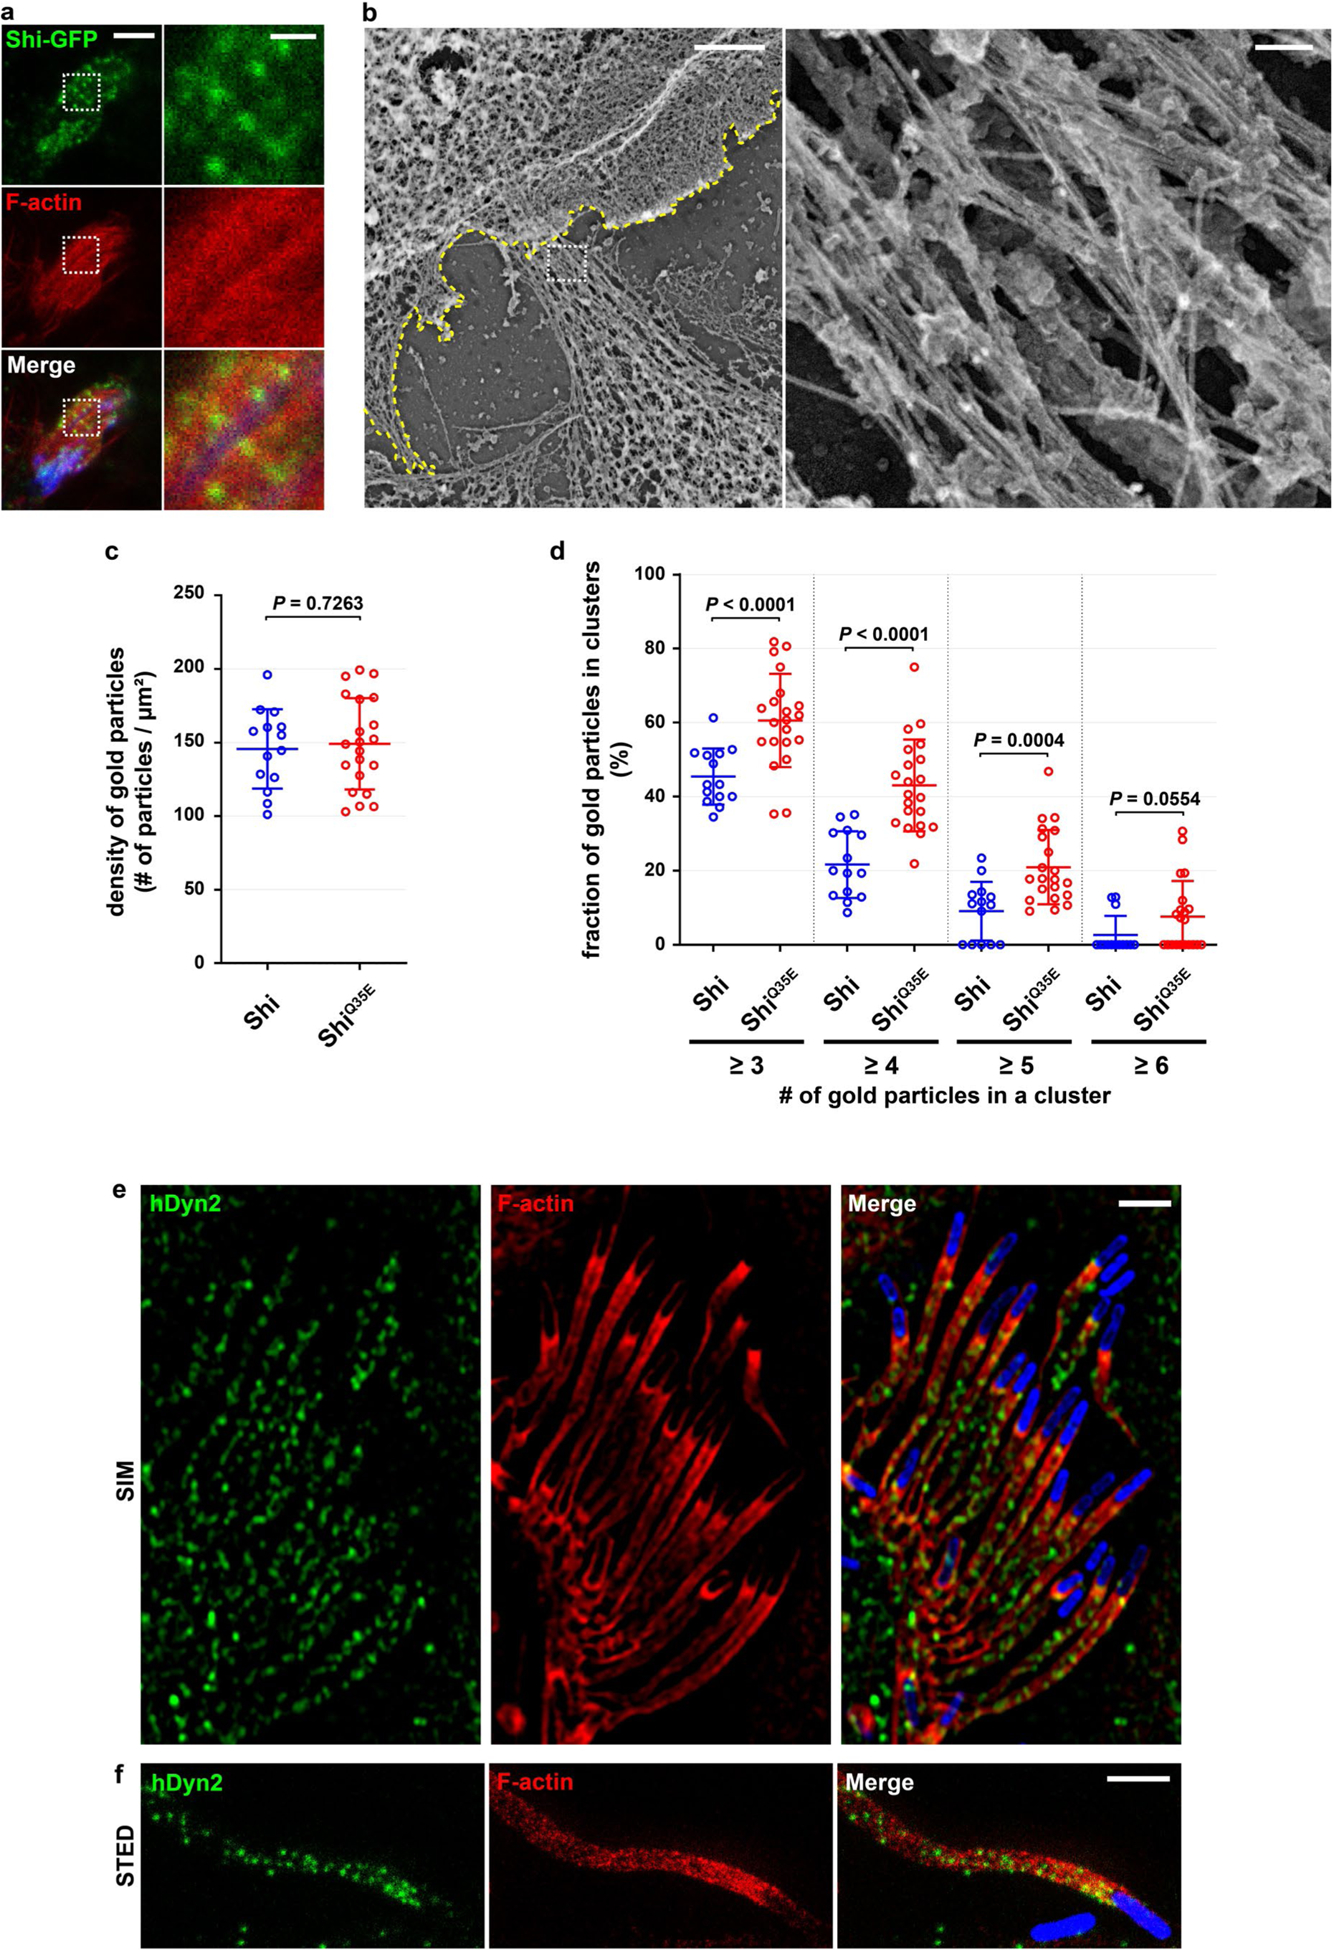
a, Shi localization on actin bundles at the fusogenic synapse revealed by STED microscopy. S2R+ cells co-expressing Shi-GFP, Sns-HA, and Eff-1-FLAG were labeled with anti-GFP (green), phalloidin (red), and anti-HA (blue). Boxed areas in the left panels are enlarged on the right. Note the Shi punctae along the actin bundles. n = 16 fusogenic synapses were imaged, with similar results. b, Specificity of antibodies in the immunogold PREM experiments. Boxed area in the left panel is enlarged on the right. Shi knockdown S2R+ cells co-expressing Sns, Eff-1 and Shits2-3xHA were stained with anti-HA for immunogold labeling. Note the absence of 18-nm colloidal gold particle labeling in these actin bundles, suggesting that this cell was untransfected and demonstrating the labeling specificity of the primary and secondary antibodies. n = 15 fusogenic synapses were imaged, with similar results. c, Quantification of gold particle density on actin bundles. The gold particle density was calculated as the number of gold particles divided by the area of the actin bundle examined. n = 14 and 21 actin bundles from 4 (Shi-GFP) and 7 (ShiQ35E-GFP) fusogenic synapses. Mean±s.d. values are shown in the dot plot, and significance was determined by the two-tailed Student’s t-test (as in d). d, Quantification of Shi cluster occurrence in Shi knockdown S2R+ cells co-expressing Sns, Eff-1 and Shi-GFP (or ShiQ35E-GFP). Shi cluster occurrence was calculated as the percentage of gold particles in clusters (containing ≥3 gold particles in a 100 nm2 square box) vs. the total number of gold particles on an actin bundle. Note the increase occurrence of ShiQ35E-GFP clusters than that of Shi. n = 14 and 21 actin bundles from 4 (Shi-GFP) and 7 (ShiQ35E-GFP) fusogenic synapses. e,f, hDyn2 localization on actin comet tails in Listeria-infected HeLa cell revealed by SIM (e) and STED (f). Over two dozen Listeria (GFP-Lm; blue) were protruding from a host cell, each propelled by an actin comet tail (e). Note the hDyn2 punctae (green) along each comet tail labeled with phalloidin (red) (e and f). n = 57 (e) and 9 (f) actin comet tails (biologically independent samples) were imaged, with similar results. Scale bars: 2 μm (a, left panels, b, left panel, e and f), 500 nm (a, right panels), 100 nm (b, right panel). Numerical source data are provided with the paper.
Extended Data Fig. 10 |. Models describing the mechanisms of dynamin-actin interaction.
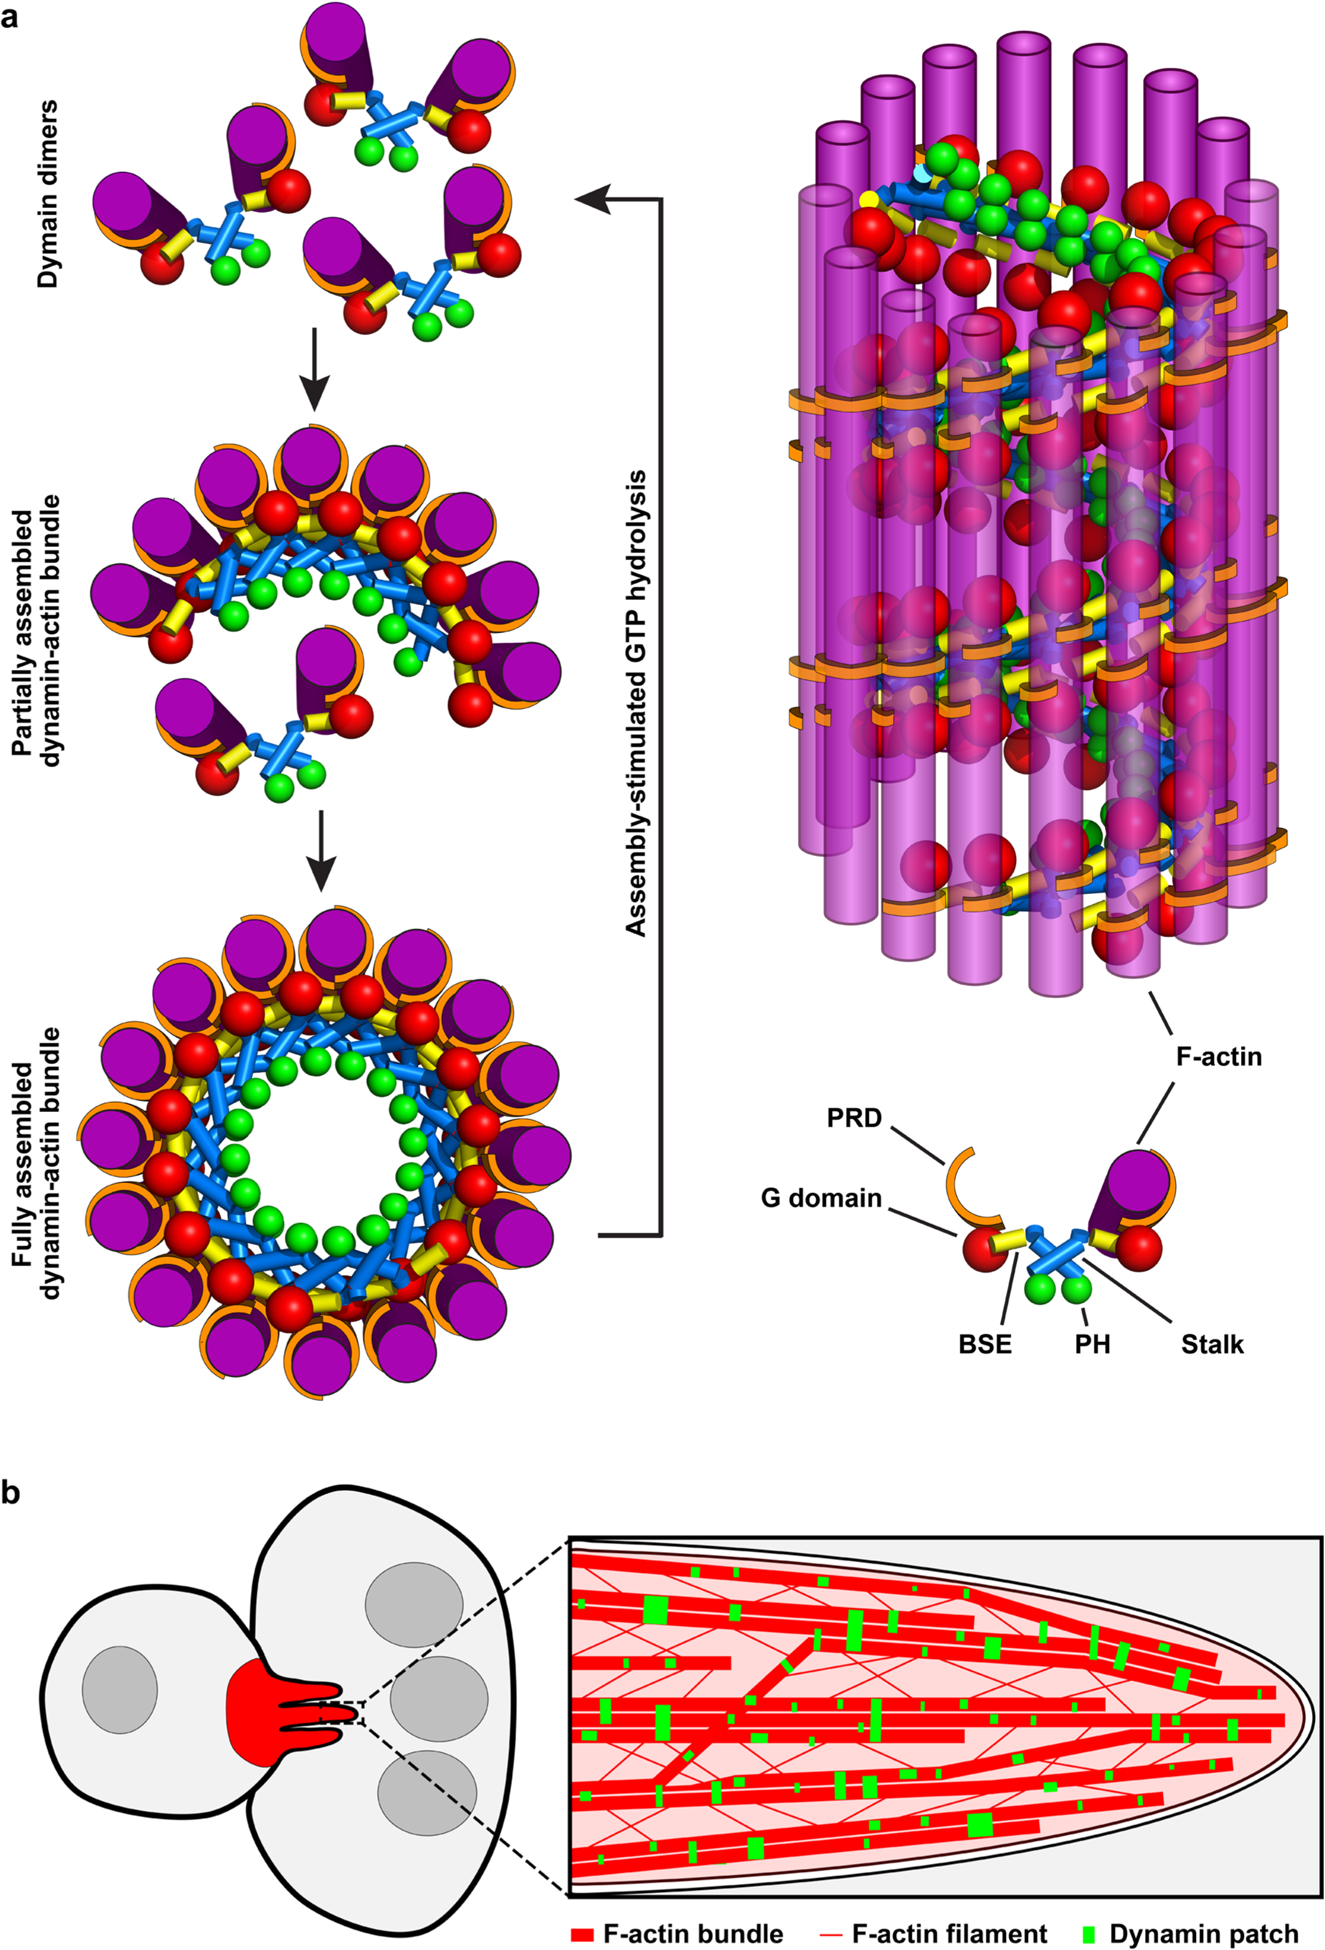
a, A schematic diagram of the cross section view (left) of the dynamin helix with associated actin filaments. During dynamin’s assembly into a helical structure, actin filaments are bundled to the outer rim of the partially assembled dynamin helices via the PRD domains. Once a dynamin helix is fully assembled, the assembly-stimulated GTPase activity of dynamin triggers rapid GTP hydrolysis and helix disassembly, freeing dynamin dimers/tetramers to bundle new actin filaments. A schematic diagram of the side view of the dynamin helix with associated actin filaments (right). At its full capacity, a hDyn1 helix (illustrated here) can bundle 16 actin filaments, whereas Shi helix can bundle 12 filaments. b, Dynamin-mediated actin bundling enhances mechanical stiffness of the actin network and promotes membrane protrusions at the fusogenic synapse. Each actin super bundle is likely organized by multiple dynamin helices that are being assembled, the dynamic asynchronous GTP hydrolysis results in a “hybrid” actin bundle that contains stretches of unprotected filaments held together at random locations by partial dynamin helices. Arp2/3-mediated actin polymerization on the unprotected areas of the actin bundles generate additional branched actin filaments, which may join the partially occupied bundles via trans-bundle PRD-actin interactions and crosslink multiple bundles. Through dynamin’s cycling between helix assembly and disassembly as a function of GTP hydrolysis, the actin bundles grow thicker and mechanically stiffer. As a consequence, the podosome-like structure at the fusogenic synapse is able to propel membrane protrusions to promote cell-cell fusion.
Supplementary Material
Acknowledgements
We thank the Bloomington Drosophila Stock Center for the fly stocks, B. Paterson for the myosin heavy chain antibody, K. Reed and A. Mohanakrishnan for help with protein purification and GTPase activity measurement, M. Mikolaj for help with generating the model in IMOD, H. He and H. Wang for help with generating the cryo-tomograms using SerialEM, K. Chinthalapudi for providing the actin filament for modelling in Chimera, and the Cryo-Electron Microscopy Core, NIDDK, NIH for Cryo-ET analyses. This work was supported by: NIH grants (R01 AR053173 and R01 GM098816), an American Heart Association Established Investigator Award and a HHMI Faculty Scholar Award to E.H.C.; an NIH grant (R01 GM095977) to T.M.S.; an NIH grant (R01 GM42455) and Welch Foundation grant (I-1823) to S.L.S.; an NIH grant (R01 GM104032) to M.G.; an NIH grant (R01 AI083359), HHMI and Simons Foundation grant and Welch Foundation grant (I-1704) to N.M.A.; and an NIH grant (R01 GM127673), Chan Zuckerberg Biohub Investigator Award and HHMI Faculty Scholar Award to A.F.M.K.R. is an HHMI investigator. R.Z. was supported by an American Heart Association postdoctoral fellowship. D.M.L. was supported by a Canadian Institute of Health Research postdoctoral fellowship. N.G. was supported by an American Heart Association predoctoral fellowship. J.A.D. was supported by a National Research Service Award from NIDDK (F32 DK101188). The electron microscopy imaging experiments at UT Southwestern were supported in part by an NIH grant (1S100D021685-01A1).
Footnotes
Competing interests
The authors declare no competing interests.
Publisher’s note Springer Nature remains neutral with regard to jurisdictional claims in published maps and institutional affiliations.
Extended data is available for this paper at https://doi.org/10.1038/s41556-020-0519-7.
Supplementary information is available for this paper at https://doi.org/10.1038/s41556-020-0519-7.
Data availability
All data that support the findings of this study are available from the corresponding author upon reasonable request. Source data for Figs. 1–7 and Extended Data Figs. 1, 3–5 and 7–9 are presented with the paper.
online content
Any methods, additional references, Nature Research reporting summaries, source data, extended data, supplementary information, acknowledgements, peer review information; details of author contributions and competing interests; and statements of data and code availability are available at https://doi.org/10.1038/s41556-020-0519-7.
References
- 1.Chen EH & Olson EN Unveiling the mechanisms of cell-cell fusion. Science 308, 369–373 (2005). [DOI] [PubMed] [Google Scholar]
- 2.Aguilar PS et al. Genetic basis of cell-cell fusion mechanisms. Trends Genet. 29, 427–437 (2013). [DOI] [PMC free article] [PubMed] [Google Scholar]
- 3.Willkomm L & Bloch W State of the art in cell-cell fusion. Methods Mol. Biol 1313, 1–19 (2015). [DOI] [PubMed] [Google Scholar]
- 4.Kim J & Chen EH The fusogenic synapse at a glance. J. Cell Sci 132, jcs213124 (2019). [DOI] [PMC free article] [PubMed] [Google Scholar]
- 5.Kim JH, Jin P, Duan R & Chen EH Mechanisms of myoblast fusion during muscle development. Curr. Opin. Genet. Dev 32, 162–170 (2015). [DOI] [PMC free article] [PubMed] [Google Scholar]
- 6.Sens KL et al. An invasive podosome-like structure promotes fusion pore formation during myoblast fusion. J. Cell Biol 191, 1013–1027 (2010). [DOI] [PMC free article] [PubMed] [Google Scholar]
- 7.Haralalka S et al. Asymmetric Mbc, active Rac1 and F-actin foci in the fusion-competent myoblasts during myoblast fusion in Drosophila. Development 138, 1551–1562 (2011). [DOI] [PMC free article] [PubMed] [Google Scholar]
- 8.Shilagardi K et al. Actin-propelled invasive membrane protrusions promote fusogenic protein engagement during cell-cell fusion. Science 340, 359–363 (2013). [DOI] [PMC free article] [PubMed] [Google Scholar]
- 9.Shin NY et al. Dynamin and endocytosis are required for the fusion of osteoclasts and myoblasts. J. Cell Biol 207, 73–89 (2014). [DOI] [PMC free article] [PubMed] [Google Scholar]
- 10.Randrianarison-Huetz V et al. Srf controls satellite cell fusion through the maintenance of actin architecture. J. Cell Biol 217, 685–700 (2018). [DOI] [PMC free article] [PubMed] [Google Scholar]
- 11.Chen EH Invasive podosomes and myoblast fusion. Curr. Top. Membr 68, 235–258 (2011). [DOI] [PMC free article] [PubMed] [Google Scholar]
- 12.Lee DM & Chen EH Drosophila myoblast fusion: invasion and resistance for the ultimate union. Annu. Rev. Genet 53, 67–91 (2019). [DOI] [PMC free article] [PubMed] [Google Scholar]
- 13.Jin P et al. Competition between Blown Fuse and WASP for WIP binding regulates the dynamics of wasp-dependent actin polymerization in vivo. Dev. Cell 20, 623–638 (2011). [DOI] [PMC free article] [PubMed] [Google Scholar]
- 14.Duan R et al. Group I PAKs function downstream of Rac to promote podosome invasion during myoblast fusion in vivo. J. Cell Biol 199, 169–185 (2012). [DOI] [PMC free article] [PubMed] [Google Scholar]
- 15.Kim JH et al. Mechanical tension drives cell membrane fusion. Dev. Cell 32, 561–573 (2015). [DOI] [PMC free article] [PubMed] [Google Scholar]
- 16.Duan R et al. Spectrin is a mechanoresponsive protein shaping fusogenic synapse architecture during myoblast fusion. Nat. Cell Biol 20, 688–698 (2018). [DOI] [PMC free article] [PubMed] [Google Scholar]
- 17.Ochoa GC et al. A functional link between dynamin and the actin cytoskeleton at podosomes. J. Cell Biol 150, 377–389 (2000). [DOI] [PMC free article] [PubMed] [Google Scholar]
- 18.McNiven MA, Baldassarre M & Buccione R The role of dynamin in the assembly and function of podosomes and invadopodia. Front. Biosci 9, 1944–1953 (2004). [DOI] [PubMed] [Google Scholar]
- 19.Baldassarre M et al. Dynamin participates in focal extracellular matrix degradation by invasive cells. Mol. Biol. Cell 14, 1074–1084 (2003). [DOI] [PMC free article] [PubMed] [Google Scholar]
- 20.Yamada H et al. Stabilization of actin bundles by a dynamin 1/cortactin ring complex is necessary for growth cone filopodia. J. Neurosci 33, 4514–4526 (2013). [DOI] [PMC free article] [PubMed] [Google Scholar]
- 21.Schlunck G et al. Modulation of Rac localization and function by dynamin. Mol. Biol. Cell 15, 256–267 (2004). [DOI] [PMC free article] [PubMed] [Google Scholar]
- 22.Lee E & De Camilli P Dynamin at actin tails. Proc. Natl Acad. Sci. USA 99, 161–166 (2002). [DOI] [PMC free article] [PubMed] [Google Scholar]
- 23.Orth JD, Krueger EW, Cao H & McNiven MA The large GTPase dynamin regulates actin comet formation and movement in living cells. Proc. Natl Acad. Sci USA 99, 167–172 (2002). [DOI] [PMC free article] [PubMed] [Google Scholar]
- 24.Gold ES et al. Dynamin 2 is required for phagocytosis in macrophages. J. Exp. Med 190, 1849–1856 (1999). [DOI] [PMC free article] [PubMed] [Google Scholar]
- 25.Schafer DA Regulating actin dynamics at membranes: a focus on dynamin. Traffic 5, 463–469 (2004). [DOI] [PubMed] [Google Scholar]
- 26.Antonny B et al. Membrane fission by dynamin: what we know and what we need to know. EMBO J 35, 2270–2284 (2016). [DOI] [PMC free article] [PubMed] [Google Scholar]
- 27.Faelber K et al. Crystal structure of nucleotide-free dynamin. Nature 477, 556–560 (2011). [DOI] [PubMed] [Google Scholar]
- 28.Ford MG, Jenni S & Nunnari J The crystal structure of dynamin. Nature 477, 561–566 (2011). [DOI] [PMC free article] [PubMed] [Google Scholar]
- 29.Sundborger AC et al. A dynamin mutant defines a superconstricted prefission state. Cell Rep 8, 734–742 (2014). [DOI] [PMC free article] [PubMed] [Google Scholar]
- 30.Gu C et al. Direct dynamin-actin interactions regulate the actin cytoskeleton. EMBO J 29, 3593–3606 (2010). [DOI] [PMC free article] [PubMed] [Google Scholar]
- 31.Palmer SE et al. A dynamin-actin interaction is required for vesicle scission during endocytosis in yeast. Curr. Biol 25, 868–878 (2015). [DOI] [PMC free article] [PubMed] [Google Scholar]
- 32.Mooren OL, Kotova TI, Moore AJ & Schafer DA Dynamin2 GTPase and cortactin remodel actin filaments. J. Biol. Chem 284, 23995–24005 (2009). [DOI] [PMC free article] [PubMed] [Google Scholar]
- 33.Yamada H, Takeda T, Michiue H, Abe T & Takei K Actin bundling by dynamin 2 and cortactin is implicated in cell migration by stabilizing filopodia in human non-small cell lung carcinoma cells. Int. J. Oncol 49, 877–886 (2016). [DOI] [PMC free article] [PubMed] [Google Scholar]
- 34.Somogyi K & Rorth P Cortactin modulates cell migration and ring canal morphogenesis during Drosophila oogenesis. Mech. Dev 121, 57–64 (2004). [DOI] [PubMed] [Google Scholar]
- 35.Mohler WA et al. The type I membrane protein EFF-1 is essential for developmental cell fusion. Dev. Cell 2, 355–362 (2002). [DOI] [PubMed] [Google Scholar]
- 36.Podbilewicz B et al. The C. elegans developmental fusogen EFF-1 mediates homotypic fusion in heterologous cells and in vivo. Dev. Cell 11, 471–481 (2006). [DOI] [PubMed] [Google Scholar]
- 37.Perez-Vargas J et al. Structural basis of eukaryotic cell-cell fusion. Cell 157, 407–419 (2014). [DOI] [PubMed] [Google Scholar]
- 38.Leikina E et al. Extracellular annexins and dynamin are important for sequential steps in myoblast fusion. J. Cell Biol 200, 109–123 (2013). [DOI] [PMC free article] [PubMed] [Google Scholar]
- 39.Richard JP et al. Intracellular curvature-generating proteins in cell-to-cell fusion. Biochem. J 440, 185–193 (2011). [DOI] [PMC free article] [PubMed] [Google Scholar]
- 40.Chuang MC et al. Tks5 and dynamin-2 enhance actin bundle rigidity in invadosomes to promote myoblast fusion. J. Cell Biol 218, 1670–1685 (2019). [DOI] [PMC free article] [PubMed] [Google Scholar]
- 41.Koenig JH & Ikeda K Disappearance and reformation of synaptic vesicle membrane upon transmitter release observed under reversible blockage of membrane retrieval. J. Neurosci 9, 3844–3860 (1989). [DOI] [PMC free article] [PubMed] [Google Scholar]
- 42.Rafiq NBM et al. Forces and constraints controlling podosome assembly and disassembly. Phil. Trans. R Soc. Lond. B Biol. Sci 374, 20180228 (2019). [DOI] [PMC free article] [PubMed] [Google Scholar]
- 43.Hinshaw JE & Schmid SL Dynamin self-assembles into rings suggesting a mechanism for coated vesicle budding. Nature 374, 190–192 (1995). [DOI] [PubMed] [Google Scholar]
- 44.Warnock DE, Hinshaw JE & Schmid SL Dynamin self-assembly stimulates its GTPase activity. J. Biol. Chem 271, 22310–22314 (1996). [DOI] [PubMed] [Google Scholar]
- 45.Bleazard W et al. The dynamin-related GTPase Dnm1 regulates mitochondrial fission in yeast. Nat. Cell Biol 1, 298–304 (1999). [DOI] [PMC free article] [PubMed] [Google Scholar]
- 46.Kong L et al. Cryo-EM of the dynamin polymer assembled on lipid membrane. Nature 560, 258–262 (2018). [DOI] [PMC free article] [PubMed] [Google Scholar]
- 47.Chappie JS, Acharya S, Leonard M, Schmid SL & Dyda F G domain dimerization controls dynamin’s assembly-stimulated GTPase activity. Nature 465, 435–440 (2010). [DOI] [PMC free article] [PubMed] [Google Scholar]
- 48.Pollard TD Actin and actin-binding proteins. Cold Spring Harb. Perspect. Biol 8, a018226 (2016). [DOI] [PMC free article] [PubMed] [Google Scholar]
- 49.Chen EH & Olson EN Antisocial, an intracellular adaptor protein, is required for myoblast fusion in Drosophila. Dev. Cell 1, 705–715 (2001). [DOI] [PubMed] [Google Scholar]
- 50.Menon SD & Chia W Drosophila rolling pebbles: a multidomain protein required for myoblast fusion that recruits D-Titin in response to the myoblast attractant Dumbfounded. Dev. Cell 1, 691–703 (2001). [DOI] [PubMed] [Google Scholar]
- 51.Paululat A, Holz A & Renkawitz-Pohl R Essential genes for myoblast fusion in Drosophila embryogenesis. Mech. Dev 83, 17–26 (1999). [DOI] [PubMed] [Google Scholar]
- 52.Ben-Yaacov S, Le Borgne R, Abramson I, Schweisguth F & Schejter ED Wasp, the Drosophila Wiskott-Aldrich syndrome gene homologue, is required for cell fate decisions mediated by Notch signaling. J. Cell Biol 152, 1–13 (2001). [DOI] [PMC free article] [PubMed] [Google Scholar]
- 53.Kim S et al. A critical function for the actin cytoskeleton in targeted exocytosis of prefusion vesicles during myoblast fusion. Dev. Cell 12, 571–586 (2007). [DOI] [PubMed] [Google Scholar]
- 54.Kocherlakota KS, Wu JM, McDermott J & Abmayr SM Analysis of the cell adhesion molecule sticks-and-stones reveals multiple redundant functional domains, protein-interaction motifs and phosphorylated tyrosines that direct myoblast fusion in Drosophila melanogaster. Genetics 178, 1371–1383 (2008). [DOI] [PMC free article] [PubMed] [Google Scholar]
- 55.Estes PS et al. Traffic of dynamin within individual Drosophila synaptic boutons relative to compartment-specific markers. J. Neurosci 16, 5443–5456 (1996). [DOI] [PMC free article] [PubMed] [Google Scholar]
- 56.White S, Taetle R, Seligman PA, Rutherford M & Trowbridge IS Combinations of anti-transferrin receptor monoclonal antibodies inhibit human tumor cell growth in vitro and in vivo: evidence for synergistic antiproliferative effects. Cancer Res 50, 6295–6301 (1990). [PubMed] [Google Scholar]
- 57.Zhang S & Chen EH in Cell Fusion: Overviews and Methods (ed. Chen EH) 275–297 (Humana Press, 2008). [Google Scholar]
- 58.Sato T A modified method for lead staining of thin sections. J. Electron Microsc. (Tokyo) 17, 158–159 (1968). [PubMed] [Google Scholar]
- 59.Kalia R et al. Structural basis of mitochondrial receptor binding and constriction by DRP1. Nature 558, 401–405 (2018). [DOI] [PMC free article] [PubMed] [Google Scholar]
- 60.Staiger CJ et al. Actin filament dynamics are dominated by rapid growth and severing activity in the Arabidopsis cortical array. J. Cell Biol 184, 269–280 (2009). [DOI] [PMC free article] [PubMed] [Google Scholar]
- 61.Su X et al. Phase separation of signaling molecules promotes T cell receptor signal transduction. Science 352, 595–599 (2016). [DOI] [PMC free article] [PubMed] [Google Scholar]
- 62.Winkelman JD, Bilancia CG, Peifer M & Kovar DR Ena/VASP Enabled is a highly processive actin polymerase tailored to self-assemble parallel-bundled F-actin networks with Fascin. Proc. Natl Acad. Sci. USA 111, 4121–4126 (2014). [DOI] [PMC free article] [PubMed] [Google Scholar]
- 63.Kremer JR, Mastronarde DN & McIntosh JR Computer visualization of three-dimensional image data using IMOD. J. Struct. Biol 116, 71–76 (1996). [DOI] [PubMed] [Google Scholar]
- 64.Pettersen EF et al. UCSF Chimera—a visualization system for exploratory research and analysis. J. Comput. Chem 25, 1605–1612 (2004). [DOI] [PubMed] [Google Scholar]
- 65.Chen M et al. Convolutional neural networks for automated annotation of cellular cryo-electron tomograms. Nat. Methods 14, 983–985 (2017). [DOI] [PMC free article] [PubMed] [Google Scholar]
- 66.Leonard M, Song BD, Ramachandran R & Schmid SL Robust colorimetric assays for dynamin’s basal and stimulated GTPase activities. Methods Enzymol 404, 490–503 (2005). [DOI] [PubMed] [Google Scholar]
- 67.Leyton-Puig D et al. PFA fixation enables artifact-free super-resolution imaging of the actin cytoskeleton and associated proteins. Biol. Open 5, 1001–1009 (2016). [DOI] [PMC free article] [PubMed] [Google Scholar]
- 68.Svitkina T Imaging cytoskeleton components by electron microscopy. Methods Mol. Biol 1365, 99–118 (2016). [DOI] [PMC free article] [PubMed] [Google Scholar]
- 69.Svitkina TM & Borisy GG Correlative light and electron microscopy of the cytoskeleton of cultured cells. Methods Enzymol 298, 570–592 (1998). [DOI] [PubMed] [Google Scholar]
- 70.Schermelleh L, Heintzmann R & Leonhardt H A guide to super-resolution fluorescence microscopy. J. Cell Biol 190, 165–175 (2010). [DOI] [PMC free article] [PubMed] [Google Scholar]
Associated Data
This section collects any data citations, data availability statements, or supplementary materials included in this article.