

Abstract
The effectiveness of virus-specific strategies, including administered HIV-specific mAbs, to target cells that persistently harbor latent, rebound-competent HIV genomes during combination antiretroviral therapy (cART) has been limited by inefficient induction of viral protein expression. To examine antibody-mediated viral reservoir targeting without a need for viral induction, we used an anti-CD4 mAb to deplete both infected and uninfected CD4+ T cells. Ten rhesus macaques infected with barcoded SIVmac239M received cART for 93 weeks starting 4 days after infection. During cART, 5 animals received 5 to 6 anti-CD4 antibody administrations and CD4+ T cell populations were then allowed 1 year on cART to recover. Despite profound CD4+ T cell depletion in blood and lymph nodes, time to viral rebound following cART cessation was not significantly delayed in anti-CD4–treated animals compared with controls. Viral reactivation rates, determined based on rebounding SIVmac239M clonotype proportions, also were not significantly different in CD4-depleted animals. Notably, antibody-mediated depletion was limited in rectal tissue and negligible in lymphoid follicles. These results suggest that, even if robust viral reactivation can be achieved, antibody-mediated viral reservoir depletion may be limited in key tissue sites.
Keywords: AIDS/HIV
Keywords: T cells

Introduction
Combination antiretroviral therapy (cART) can effectively suppress ongoing HIV-1 replication and dramatically improve the life expectancy of HIV-1–infected individuals (1). However, cART only inhibits new rounds of viral replication and does not affect cells that are already infected. Thus, a population of cells harboring replication-competent viral genomes, the majority of which are transcriptionally silent, or latent, can persist for the lifetime of the infected individual despite continued cART (2). Upon cART cessation, reactivation of one or more of these long-lived replication-competent viral genomes can lead to recrudescent viral infection (3). Lifelong cART is thus indicated for the overwhelming majority of HIV-1–infected people, but the prospect of lifelong daily drug treatment for nearly 40 million people worldwide raises considerable concerns over drug costs, access, compliance, and potential drug resistance emergence (4–6). Moreover, even with treatment, HIV-1–infected people continue to have elevated rates of non-AIDS morbidities, with elevated immune activation and inflammation levels that may be related to the persistence of virally infected cells (7).
Given the effectiveness and safety/tolerability profile of modern cART, most efforts to eliminate cells harboring replication-competent viral genomes (i.e., viral reservoirs) are intended for use in individuals on cART (8). Because in treated individuals the majority of the remaining, intact viral genomes are latent, a successful virus-specific reservoir elimination approach will need to include reactivation of residual viral genomes to produce viral antigen that can be immunologically targeted (2). While a number of viral reactivation strategies have shown some activity in animal models and clinical studies (9–15), subsequent studies evaluating these same agents have indicated that their modest viral reactivation activity may be inconsistent or may depend critically on the specific dosing strategy or underlying characteristics of the treated population (16–20). Moreover, the difficulty in sampling and measuring the viral reservoir poses a major challenge for assessing the effectiveness of these agents, and thus, even in studies where viral reactivation was apparently induced, it is not known what fraction of residual viral genomes may have been affected. Thus, a viral-reactivation strategy that consistently and reliably reactivates a substantial portion of residual viral genomes in vivo has not yet been identified.
The lack of a consistent and potent viral reactivation agent complicates evaluations of candidate reservoir targeting and elimination approaches, which often depend upon robust viral reactivation as a prerequisite for activity. Among the viral targeting approaches that have been proposed, Ab-based strategies are of particular interest due to their specificity and the potential for some Abs to induce the elimination of targeted cells through Fc-mediated effector functions (21). Abs are also easy to administer, with generally good safety and tolerability profiles (22). The potential for Abs to mediate clearance of HIV-1–infected cells was recently demonstrated with passive administration of the broadly neutralizing Ab (bnAb) 3BNC177 plus cART at the time of adoptive transfer of HIV-1–infected human T cells into immunodeficient mice (23). However, Ab-mediated clearance of persistent virus-infected cells in the setting of established virologic suppression on cART remains theoretical. Passive administration of the bnAb VRC01 to cART-treated HIV-1–infected individuals had no demonstrable impact on the size of the persistent virus pool (24), though it is not clear whether this reflects a limitation of Ab-based approaches, an inability to measure potential reservoir reduction accurately, or the absence of a concomitantly administered viral reactivation agent. Perhaps the most promising demonstration of administered antiviral Abs directly affecting viral reservoirs was a study in which rhesus macaques were started on cART early (7 days) after intrarectal infection with a chimeric simian-human immunodeficiency virus (SHIV) and subsequently treated with the bnAb PGT121, the TLR7 agonist GS-9620, or both (25). While provocative potential effects of the Ab and TLR7 agonist combination, including lack of off-cART viral rebound in some animals, were shown (25), early cART initiation coupled with a limited initial viral inoculum precluded a direct demonstration of reduction or elimination of persistent virus-infected cells, and the mechanism of durable off-cART aviremia remains unclear.
Since the identification and development of effective cART regimens that feasibly can be administered long term to nonhuman primates (NHPs) (12, 26), NHP models of cART-mediated virologic suppression have been highly useful for the study of persistent viral reservoirs and for the evaluation of viral eradication and functional cure strategies. Here, we evaluated an idealized Ab-mediated reservoir-targeting strategy, targeting the CD4 molecule itself, rather than a viral protein, to deplete potential viral target cells irrespective of infection status. This approach of targeting a host cell-surface protein obviated the need for viral reactivation and antigen expression as a prerequisite for Ab binding. To ensure the establishment of a limited viral reservoir that might be more tractable for Ab-mediated clearance, cART was initiated early following a high-dose intravenous challenge with the barcoded virus SIVmac239M (27). After allowing for partial recovery of the CD4+ T cells under cover of continued cART, treatment was discontinued and the impact of CD4 depletion on viral rebound evaluated. By utilizing SIVmac239M, we were able to evaluate the impact of CD4+ T cell depletion both by a conventional time-to-rebound approach and by using viral reactivation-rate calculations based on the relative proportions of rebounding viral clonotypes (i.e., barcodes; refs. 27–29), which maximize our sensitivity for detecting changes in the rebound-competent viral reservoir.
Results
Virologic suppression on cART.
Ten Indian-origin rhesus macaques were intravenously infected with the barcoded virus SIVmac239M (27) and treated with an effective cART regimen (26) starting at 4 days post-infection (dpi). Plasma viral loads (pVLs) declined from peak levels (range 7.2 × 10⁴ to 1.7 × 10⁶ viral RNA [vRNA] copies/mL) measured at 4 to 7 dpi to less than 15 vRNA copies/mL within 23–44 days of cART initiation (Figure 1A and Supplemental Figure 1; supplemental material available online with this article; https://doi.org/10.1172/JCI142421DS1). The animals were then divided into a CD4-depletion group (n = 5; mean pre-cART pVL = 1.3 × 10⁵ vRNA copies/mL, range 5.4 × 10⁴ to 2.1 × 10⁵) and a control group (n = 5; mean pre-cART pVL = 1.5 × 10⁵ vRNA copies/mL, range 5.9 × 10⁴ to 4.2 × 10⁵) balanced for pre-cART pVLs (Supplemental Figure 1). Starting at approximately 30 weeks after cART initiation, each experimental group animal received the rhesusized in vivo CD4-depleting Ab CD4R1 once every 2 weeks for a total of 5 to 6 administrations. After the final dose of CD4R1, the animals were maintained on cART for another 54 weeks. The control group animals were maintained on cART without Ab administration for the same cumulative duration. pVLs for all 10 animals remained stably below 15 vRNA copies/mL through the period of anti-CD4 Ab administration and until cART was discontinued after approximately 93 total weeks of therapy (Figure 1A).
Figure 1. pVL suppression and CD4 depletion in blood.

(A) SIV RNA was quantified in longitudinal plasma samples using a qRT-PCR assay with a threshold quantification limit of 15 vRNA copies/mL. Shown are the values for the first 94 weeks of the study, which include pre-cART time points and approximately 93 weeks on cART (gray shaded region). (B and C) Longitudinal cell counts in blood for (B) total CD4+ T cells and for (C) naive (CD95–), central memory (CM, CD95+CD28+), and effector memory (EM, CD95+CD28–) CD4+ T cell subsets are shown. Data shown in C are represented as means ± SEM for all 5 animals within each group. Red arrows show the timing of 6 anti-CD4 Ab administrations to the CD4-depleted group. CD4-depleted experimental group animals are shown with red plots; control animals are shown with blue plots.
CD4+ T cell depletion and recovery in blood.
CD4+ T cells in blood were robustly depleted by anti-CD4 Ab administration. Absolute CD4+ T cell counts in the blood of experimental group animals declined by 96.3% to 100.0% during the CD4-depletion phase of the study (Figure 1B). CD4+ T cell counts declined to nadir levels of 0 CD4+ T cells/μL in 2 of the 5 depleted animals, with a median nadir CD4+ T cell count of 3 CD4+ T cells/μL (range 0–28 CD4+ T cells/μL) for the experimental group. Naive (CD95–) CD4+ T cells declined by 99.4% to 100.0%, central memory (CD95+CD28+) CD4+ T cells declined by 94.0% to 100.0%, and effector memory (CD95+CD28–) CD4+ T cells declined by 100.0% for all 5 animals (Figure 1C). Following the final dose of anti-CD4 Ab, animals were maintained on suppressive cART for 1 year to allow CD4+ T cells to recover so that virologic rebound kinetics would not be confounded by a lack of available target cells. CD4+ T cell counts in blood recovered slowly following the final dose of anti-CD4 Ab, returning to approximately half their predepletion levels (mean recovery to 58.2% of predepletion levels, range 28.0%–68.1%) by the final day of cART, 1 year after the final dose of anti-CD4 Ab (Figure 1B). Despite incomplete recovery of total CD4 counts in the experimental group, the relative proportions of the naive, central memory, and effector memory CD4+ T cell populations within these animals returned to their predepletion ratios after 8 to 9 months of recovery and were maintained at these relative proportions until cART release (Figure 1C and Supplemental Figure 2A). On average in the CD4-depleted animals, naive, central memory, and effector memory cells constituted 56.2%, 40.7%, and 3.1%, respectively, of the total blood CD4+ T cell population prior to depletion, while at pre-cART release, after CD4 cell recovery, these same populations constituted on average 53.3%, 42.7%, and 4.1%, respectively. CD14+ monocytes, which express low levels of CD4, were not measurably depleted in blood by anti-CD4 Ab administration (Supplemental Figure 2B). In the control animals, blood CD4+ T cell counts were essentially unchanged other than normal fluctuations over the course of the study, with mean CD4 counts that were approximately 4% higher at the pre-cART time points compared with the predepletion time point (Figure 1, B and C, and Supplemental Figure 2A).
Prior studies have shown that following experimental CD8+ cell depletion by administration of an anti-CD8α Ab in rhesus macaques, CD4+ T cells undergo a transient expansion consistent with a homeostatic proliferative response (30). Following anti-CD4 Ab administration and CD4+ T cell depletion, we observed an inverse expansion of CD8+ T cells in blood. CD8+ T cells increased by approximately 140% on average (range 75%–242% increase) within 4 weeks of the final anti-CD4 Ab dose (Supplemental Figure 2B). Thereafter, CD8+ T cell counts declined, but remained elevated relative to pre–anti-CD4 administration time points (Supplemental Figure 2B), perhaps due to the incomplete recovery of CD4+ T cells.
CD4+ T cell depletion and recovery in tissues.
To evaluate CD4+ cell depletion in key tissue sites of SIV replication and reservoir establishment, we collected rectal pinch biopsies and excisional LN biopsies immediately prior to anti-CD4 Ab administration, following Ab doses 3 and 6, and 2 to 3 weeks prior to cART release. Ab-mediated CD4+ T cell depletion was less robust and more variable within tissues than in blood. In rectal tissues, CD4+ T cell frequencies declined by 35.0% to 62.6% following anti-CD4 Ab administration (Figure 2A). When comparing CD4+ T cell frequencies following dose 3 with the CD4+ T cell frequencies following dose 6, there was no evidence of additional cumulative depletion of CD4+ T cells with 3 additional anti-CD4 Ab administrations (Figure 2A). By 1 year after the final anti-CD4 administration, just prior to cART release, rectal CD4+ T cell frequencies partially or completely recovered in 4 of 5 depleted animals, ranging from 52.4% lower to 8.6% higher than predepletion levels. As expected, CD4+ T cell frequencies in rectal tissue of control group animals were essentially unchanged over the course of the study, with CD4+ T cell frequencies just prior to cART release that ranged from 15.3% lower to 39.5% higher than the predepletion study time point.
Figure 2. CD4 depletion in tissues.

(A and B) The frequency of CD4+ T cells as a percentage of total CD3+ T cells in rectal (A) and LN (B) tissues was determined by flow cytometry at the indicated time points. Values were normalized to the pre-CD4–depletion time point (30 weeks after cART initiation) for CD4-depleted (red) and control (blue) animals. (C) The frequency of naive (CD95–), central memory (CD95+CD28+), and effector memory (CD95+CD28–) CD4+ T cells as a percentage of total CD3+ T cells in LNs was determined by flow cytometry at the indicated time points for CD4-depleted (red) and control (blue) animals. (D, left) Representative images showing immunohistochemical staining for CD4 (brown) and CD68/CD163 (red) in LN sections from a CD4-depleted animal and a control animal at the indicated time points. B cell follicles are indicated with dashed borders. Scale bars: 200 μm. (D, right) Quantitation of immunohistochemical CD4 staining in T cell zone regions and B cell follicles of LN tissues collected at the indicated time points from CD4-depleted (red) and control (blue) animals. The data shown in A, B, and D were statistically analyzed using a 2-sample 2-sided t test. *P < 0.05; **P < 0.01; ***P < 0.001; ****P < 0.0001.
In LN tissues, CD4 depletion was more pronounced than in rectal tissue. Nadir CD4+ T cell frequencies in LN were 80.6% to 86.9% lower than at the predepletion time point (Figure 2B). For all 5 CD4-depleted animals, there was a greater reduction in LN CD4+ T cell frequencies after 6 doses of anti-CD4 Ab when compared with CD4+ T cell frequencies following only 3 doses of Ab, suggesting that there may have been additional CD4+ T cell depletion with additional doses of anti-CD4 Ab (Figure 2B). Further depletion of central memory cells (CD95+CD28+), which were initially more resistant to depletion and which have been shown to be a major source of residual viral genomes in the setting of suppressive cART (31–33), was the primary driver of this additional CD4+ T cell depletion (Figure 2C and Supplemental Figure 3). Prior to anti-CD4 Ab administration, mean naive (CD95–) and central memory CD4+ T cell frequencies were 44.4% and 11.8%, respectively, of total CD3+ T cells in LN (Figure 2C). Following 3 doses of anti-CD4 Ab, the mean frequency of naive CD4+ T cells declined by 88% down to 5.6% of the total CD3+ T cell population, but did not decline further after 3 additional anti-CD4 Ab administrations. In contrast, the mean frequency of central memory CD4+ T cells declined by only 56% down to 5.2% of the total CD3+ T cell population after 3 doses of anti-CD4 Ab and declined by another 22% down to 2.7% of the total CD3+ T cell population in LN after 6 doses of anti-CD4 Ab (Figure 2C and Supplemental Figure 3). Like the recovery observed in blood, CD4+ T cell frequencies in LN tissue returned to approximately half their predepletion levels (mean recovery to 59.3% of predepletion levels, range 44.4%–74.5%) within a year of the final anti-CD4 dose. In control animals, CD4+ T cell frequencies in LN were relatively steady throughout the course of the study, with only minor changes consistent with sampling variability and immunologic fluctuations. CD4+ T cell frequencies at the pre-cART release time point in LN in control animals ranged from 19.6% lower to 2.8% higher than at the predepletion study time point.
LN follicles are viewed as a sanctuary site for residual virally infected cells during cART, perhaps due to the limited virus-specific CD8+ T cell surveillance that occurs therein (34–38). To examine the ability of Abs to target and eliminate cells within different regions of the LN, we immunohistochemically stained fixed LN tissue sections for CD4. As shown in Figure 2D, depletion of CD4+ cells occurred primarily in the extrafollicular T cell zone, where the majority of the CD4+ T cells reside in LN. There were limited or no consistent changes in CD4+ T cells in B cell follicles following anti-CD4 administration, suggesting that T cells within the follicles were less susceptible to Ab-mediated targeting and depletion.
Changes in viral DNA in PBMC and tissues.
To assess changes in potential residual sources of virus associated with depletion of viral target cells, we quantified viral DNA (vDNA) in PBMCs and in replicate rectal and LN tissue samples collected at the same time points as those used to assess tissue CD4 depletion (i.e., immediately prior to anti-CD4 Ab administration, after Ab doses 3 and 6, and 2 to 3 weeks prior to cART release). We have previously shown that the overwhelming majority of persistent vDNA genomes are intact in SIV-infected macaques that initiate cART early after infection (39, 40). To confirm that this finding applied to the current study animals, we performed near full-length (nFL) viral genome sequencing on vDNA extracted from LN-derived mononuclear cells from 1 control group animal and 1 CD4-depletion group animal with the highest levels of vDNA prior to anti-CD4 Ab treatment (ZJ39 and ZK40; see Figure 3). Consistent with our prior findings, 80% to 88% of the viral genome sequences in these 2 animals were intact (Supplemental Figure 4). Prior to anti-CD4 Ab administration (at ~30 weeks after cART initiation), vDNA levels in all samples were low, consistent with the establishment of small viral reservoirs due to early cART initiation (41). In PBMCs prior to CD4 depletion, mean vDNA levels in the CD4-depletion and control group animals were 4.9 (range 1.2–17.0) and 8.6 (range 1.2–29.0) vDNA copies/106 cells, respectively (Figure 3). After 3 doses of anti-CD4 Ab, PBMC vDNA levels in all 5 Ab-treated animals declined to below the assay detection limit (<0.2 to <0.8 vDNA copies/106 cells), while PBMC vDNA could be detected in all 5 control animals at the same time point (mean 5.6 vDNA copies/106 cells). Apart from a single vDNA+ PBMC sample from 1 CD4-depleted animal after dose 6, vDNA remained below the assay detection limit in all 5 CD4-depleted animals through the duration of cART administration (Figure 3). Consistent with anti-CD4 administration directly depleting infected cells, this single vDNA+ sample after dose 6 was from animal ZK40, in which the pre–anti-CD4 vDNA levels were highest (17 vDNA copies/106 PBMC) and in which the extent of blood CD4 depletion was least robust (3.7% CD4+ T cells remaining at nadir vs 0.0%–0.7% remaining at nadir in other animals). In the control group animals, vDNA decayed over the course of the experiment. After 93 weeks on cART, vDNA levels in PBMCs declined to below the detection limit in 2 of 5 control animals and averaged 2.8 vDNA copies/mL in the remaining 3 control animals (Figure 3). Notably, the control animal with the highest PBMC and LN vDNA levels was animal ZJ39, which had the highest pre-cART peak viral load of the study animals (Figure 1A).
Figure 3. Cell- and tissue-associated vDNA levels.

vDNA quantification in PBMCs (top panel), rectal pinch biopsy samples (center panel), and LN biopsy samples (bottom panel) are shown for CD4-depletion (red symbols) and control (blue symbols) group animals at the indicated time points. Determined vDNA levels were normalized based on input diploid genome cell equivalents (Cell Eq) assayed for each sample determined by the duplex quantification of the copy number of a host cell gene within the same sample extraction. Open symbols represent samples in which no vDNA was detected, with the symbol plotted at the threshold sensitivity limit for that sample based on the number of cell equivalents assayed.
In biopsies collected 30 weeks after cART initiation (immediately prior to CD4 depletion), vDNA levels were also low in rectal tissue, with no vDNA detected in 2 control group animals (<0.2 and <0.6 vDNA copies/106 cells) and in 1 CD4-depletion group animal (<0.3 vDNA copies/106 cells, Figure 3). Seven weeks later, following anti-CD4 dose 3, vDNA levels in 2 of 5 CD4-depletion group animals were below the assay threshold sensitivity limit (<0.08 and <0.09 vDNA copies/106 cells), with mean vDNA levels of 0.09 vDNA copies/106 cells in the remaining 3 animals (Figure 3). At the same time point, rectal samples from control group animals contained 0.3 vDNA copies/106 cells (mean). Following 3 additional anti-CD4 doses, vDNA was not detected in rectal tissue samples from 4 of 5 CD4-depleted animals (assay sensitivity cutoffs between 0.06 and 0.1 vDNA copies/106 cells) and was quantified at only 0.1 vDNA copies/106 cells in the fifth animal. In the control group animals at the same time point, vDNA was detected in rectal tissue of 4 of 5 animals at 0.27 vDNA copies/106 cells on average (mean). One year later, just prior to cART release, vDNA levels were below the assay detection limit in all 5 CD4-depletion group animals (<0.23 vDNA copies/106 cells) and in 3 of 5 control group animals (<0.24 vDNA copies/106 cells). In the remaining control group animals, quantifiable vDNA levels in rectal tissue prior to cART release were low (0.18 vDNA copies/106 cells and 1.1 vDNA copies/106 cells).
As was the case for PBMCs and rectal tissue, LN tissue vDNA levels were low after 30 weeks of cART prior to CD4 depletion, averaging 2.1 copies/106 cells in the 5 control group animals and 3.3 copies/106 cells in the 4 CD4-depletion group animals with quantifiable vDNA levels (Figure 3). One CD4-depletion group animal, ZK31, had LN vDNA levels that were below the quantitative PCR (qPCR) assay sensitivity limits throughout the study. CD4 depletion did not result in a clear reduction in vDNA levels in LNs. vDNA levels in LNs of the CD4-depletion group animals were 4.5- to 5.5-fold lower on average following anti-CD4 dose 3 and subsequent assessed time points when compared with the predepletion time point in the 4 animals that had quantifiable vDNA prior to CD4 depletion. However, vDNA levels in the LNs of the 5 control group animals were similarly 2.1- to 5.8-fold lower at the same assessed later study time points when compared with the predepletion time point, consistent with spontaneous decay of initially infected cell populations after prolonged cART, initiated early in infection (41).
Taken together, these findings confirm that early cART initiation resulted in the establishment of limited vDNA levels and demonstrate that anti-CD4 Ab–induced depletion of CD4+ T cells was able to deplete residual infected cells (i.e., those harboring vDNA), particularly in PBMCs and rectal tissues, though perhaps less so in LN tissues despite relatively robust depletion of CD4+ T cells overall in LNs.
Time to rebound.
Antiretroviral therapy was discontinued 54 weeks after the final dose of anti-CD4 Ab. Plasma viremia rebounded in all 10 study animals. In 9 of 10 macaques, quantifiable vRNA was first detected in plasma within 4 weeks of cART discontinuation (Figure 4 and Figure 5). Viral rebound was delayed in 1 CD4-depletion group animal (ZK08), with vRNA first detected in plasma 98 days following cART cessation (Figure 4 and Figure 5). Although there was a trend toward a small delay in viral rebound in the CD4-depletion group animals, with a median time to first detection of vRNA of 28 days (range 18 to 98 days) in the CD4-depletion group compared with 18 days for the control group animals (range 14 to 28 days), this difference between the groups was not significant (P = 0.13, log-rank test, Figure 4).
Figure 4. Time to rebound.

Shown are Kaplan-Meier curves depicting comparison of time to first vRNA-positive blood sample (>15 vRNA copies/mL plasma) following cART cessation for CD4-depleted (red) and control (blue) group animals (n = 5 per group). The data were statistically analyzed using a Mantel-Cox test.
Figure 5. Viral rebound after cART cessation.

SIV RNA was quantified in longitudinal plasma samples using a qRT-PCR assay with a threshold quantification limit of 15 vRNA copies/mL. Shown are the values spanning the final 2 weeks of cART (gray shaded region) and the time period following cART discontinuation for each of the 10 study animals. For each animal, deep sequencing was used to determine the number and relative proportions of the viral clonotypes, shown in inset plots, present at the circled time point. Each bar in the inset plots represents a single clonotype, with its log relative proportion shown. The clonotype proportions and viral loads at the circled time points were used to calculate a viral reactivation rate for all animals other than ZK08. For ZK08, because only a single clonotype was detected at the 2 time points indicated by dashed circles, the viral reactivation rate was estimated using a different probabilistic model (see methods). Control animals are shown with blue plots; CD4-depleted experimental group animals are shown with red plots.
Viral reactivation rate determinations.
Because reactivation is a stochastic process, the time to initiation of successful viral replication from the rebound-competent viral reservoir is intrinsically variable. Therefore, time-to-rebound analyses are limited in their capacity to detect small changes in the size of the viral reservoir (42, 43). To determine whether there were smaller differences in the viral reservoir sizes between the CD4-depletion and control groups that may not have been identifiable by time-to-rebound analyses, we took advantage of the increased power afforded by the barcoded SIVmac239M virus system. Although cART was initiated at an early postinfection time point (4 days), deep-sequencing of vRNA in 0.7 mL of plasma (input 5,500–10,000 cDNA copies per animal) collected at peak viremia prior to cART initiation revealed a large number of replicating unique viral clonotypes in each of the 10 study animals (mean: 1,161 unique clonotypes per animal; range: 803–1,369) (Supplemental Figures 5 and 6). After cART was released, 15 of the 41 unique viral clonotypes that rebounded across all 10 study animals were not previously detected at peak viremia (Supplemental Figure 5), suggesting that our sequencing results from pre-cART peak viremia underrepresented the number of replicating viral clonotypes that were capable of forming rebound-competent viral reservoirs and highlighting the very rapid and low viral load requirement for any given clonotype to become a long-lived reservoir.
We directly estimated the viral reactivation rate (27, 29) for each animal based on the viral growth rate and the relative proportions of the rebounding clonotype constituents that made up rebound viremia (Figure 5). Notably, the animal with the greatest number of rebounding clonotypes (animal ZJ39 with 15 clonotypes) was also the animal with the earliest viral rebound, first detected at 14 days after cART release (Figure 5). In contrast, the rebounding virus in CD4-depletion group animal ZK08, which had a prolonged delay in viral rebound (98 days), contained only a single rebounding clonotype, consistent with an expectation that substantially delayed viral rebound would be characterized by infrequent viral reactivation events and thus a single rebounding viral clonotype (Figure 5). Because reactivation rate calculations based on viral barcode sequencing rely upon differences in the relative proportions of multiple detected viral barcodes, a barcode sequencing–based viral reactivation rate as was calculated for the 9 other study animals could not be calculated using the available sequencing data for outlier animal ZK08. ZK08 was therefore omitted from barcode sequencing–based reactivation rate analysis and group comparisons. When comparing the determined viral reactivation rates for the CD4-depletion group animals with the control animals, there was a trend toward lower viral reactivation rates in the CD4-depletion group animals (median: 1 reactivation per 5.1 days, range: 1 reactivation per 1.6–8.5 days) compared with the control group animals (median: 1 reactivation per 2.0 days, range: 1 reactivation per 0.4–5.8 days), but this difference was not significant (P = 0.16, 1-sided Wilcoxon’s rank-sum test; Figure 6). There was no significant correlation between CD4 levels in blood or LNs at the time of cART discontinuation and the calculated viral reactivation rates for the study animals (Supplemental Figure 7), suggesting that the degree of CD4 reconstitution was not associated with the viral reactivation rate.
Figure 6. Comparison of calculated viral reactivation rates.

Viral reactivation rates (i.e., the number of days between each productive viral genome reactivation) were calculated (27, 29) for each study animal based on the relative frequency of rebounding viral barcode clonotypes and the viral growth rate during the exponential growth phase of viral rebound. Data were statistically analyzed using a 1-tailed Wilcoxon’s rank-sum test.
Although a viral reactivation rate could not be estimated for animal ZK08 based on viral barcode sequencing, it was clear based on the prolonged delay to viral rebound that the animal had a substantially lower reactivation rate than any of the other study animals. Animal ZK31, which initially had a single rebounding viral clonotype detected at 28 days off cART (not shown) with a second rebounding clonotype detected at approximately 26,000-fold lower proportion than the dominant clonotype in a higher viral load sample 7 days later (Figure 5), had the lowest reactivation rate that could be estimated, at 1 per 8.5 days. Even for this animal, the probability of an observed time to detection of 98 days or more was highly unlikely (probability of 4.5 × 10⁻⁵, assuming a 13-day delay for drug washout and viral growth sufficient to reach detectable levels). To estimate bounds for the frequency of reactivation for animal ZK08, we used an alternative, though less precise approach based on the observed time to rebound (42). Based on this approach, the viral reactivation rate would have to range from a maximum of 1 per 28 days to a minimum of 1 per 1657 days for the observed time to detection to lie within the range expected for 95% of subjects. This large range in the estimate bounds for the reactivation rate highlights the imprecision inherent in reactivation rate determinations based only on time to rebound data and underscores the power and value of barcode sequencing–based reactivation rate determinations made possible by the SIVmac239M infection model.
Discussion
The use of passively administered mAbs to deplete targeted cells in vivo is now well established for the treatment of a variety of human diseases. Accordingly, passive administration of one or more mAbs with broad HIV-1 Env specificity and potential for Fc-dependent cytotoxicity has emerged as an obvious candidate approach to consider for eliminating persistent cells harboring replication-competent HIV genomes (21, 44). However, the ability of an anti–HIV-1 Ab to induce target cell death will depend critically upon the expression of sufficient viral antigen on the cell surface to allow Ab binding and effector recruitment. Because the overwhelming majority of viral genomes that persist during cART are latent (2), concomitant robust induction of viral gene expression will be required to assess the potential of virus-specific Abs to reduce the size of the persistent viral reservoir. As yet, a consistent and potent in vivo HIV/SIV reactivation strategy has not been identified, limiting our ability to evaluate antiviral Abs or many other proposed virus-specific methods to deplete viral reservoirs. Additionally, even if robust viral reactivation were routinely achievable, the in vivo cell-depleting activity of each individual mAb is unclear and may be difficult to demonstrate directly, potentially complicating the interpretation of studies that seek to assess the capacity of specific mAbs to reduce the viral reservoir.
By using an Ab with an established and easily measured capacity for target cell depletion in vivo (45) and by targeting a constitutively expressed host cell protein found on latently SIV-infected cells, we were able to model Ab-mediated reservoir targeting without the confounding challenges of using an antiviral mAb. By theoretically targeting all CD4+ cells, irrespective of their infection status, we were able to nonspecifically target all residual SIV-infected cells because SIV infection requires cell-surface CD4 expression (46). Although CD4 surface expression can be downregulated by several different SIV proteins (47), during stable cART-mediated virologic suppression, the majority of the remaining infected cells do not express viral proteins and thus would not be expected to downregulate CD4. To mitigate against possible CD4 downregulation by cells with spontaneously reactivating viral genomes during the period of anti-CD4 administration, 5 to 6 doses of anti-CD4 Ab were administered over a 10- to 12-week period, with the expectation that any cells expressing sufficient amounts of viral protein to downregulate CD4 would either return to quiescence and be targetable by subsequent CD4 administrations or die from lytic viral infection or immune surveillance.
Antiretroviral therapy was initiated in our study animals at 4 dpi to limit the size of the established viral reservoirs to a level that would be more tractable for demonstrating a potential reservoir depletion effect. Prior to CD4 depletion, at 30 weeks after cART initiation, average cell-associated vDNA levels, determined by qPCR quantification of a small region of the SIV gag gene, were less than 10 vDNA copies/106 cell equivalents in PBMCs. In comparison, in a prior study, we found that cell-associated vDNA levels were approximately 100- to 300-fold higher in animals that started cART at 4 weeks after infection and were treated for a comparable duration (10). Studies evaluating the “intactness” of residual vDNA genomes in HIV-1–infected humans on suppressive cART have suggested that similar qPCR quantification of a small region of the viral gag gene is an inaccurate measure of the replication-competent viral reservoir because the overwhelming majority of the residual viral genomes contain gross defects such as deletions and APOBEC-hypermutated regions (48, 49). However, in contrast to the human subjects evaluated in these studies, nearly all of whom started cART well into chronic infection and/or received cART for many years before genome intactness was analyzed (48, 49), the SIV-infected macaques in this study initiated cART within days of infection. Consistent with our prior work evaluating viral genome intactness in SIV-infected macaques on cART (39, 50), the current study animals possessed a high proportion (>80%) of intact residual viral genomes, suggesting that standard gag qPCR can adequately approximate intact viral genomes within this system. Our vDNA data therefore suggest that our use of early cART to limit the size of the established viral reservoir size in our study animals was successful. Because the established viral reservoirs were so small, with many virologic parameters below assay detection levels in the control animals, additional characterizations beyond those presented here of the reservoir changes associated with CD4 depletion and recovery were not possible.
Despite the small reservoirs established in our study animals, profound Ab-mediated depletion of CD4+ T cells in blood and LNs did not meaningfully reduce the rebound-competent viral reservoir, as assessed by the time to viral rebound or more sensitive viral reactivation–rate calculations. Our findings highlight potential limitations of Ab-mediated depletion of HIV/SIV infected cells that should be carefully considered. We show that Ab-mediated depletion of CD4+ T cells in the gut, where most CD4+ T cells reside, is far more limited than in blood and LNs. Even within LN tissue, where the overall extent of CD4+ T cell depletion was substantial, CD4+ T cell depletion was minimal in B cell follicles, sites previously identified as key sanctuaries for viral persistence during cART (37, 38). While it is currently unclear why Ab-mediated cell depletion was more limited in these tissue sites, we suspect that Ab penetrance into the relevant tissues was not the primary limitation. Using fluorophore-labeled Abs, Schneider and colleagues have shown that passively administered Abs have biodistribution patterns similar to those of endogenous Abs, including Ab penetrance into intestinal tissues (51). There were also apparent disparities in the sensitivity of different CD4+ T cell subsets to Ab-mediated depletion. Although central memory CD4+ T cells were relatively well depleted in blood and LNs, they appeared to be somewhat more resistant to depletion than naive or effector memory CD4+ T cells. Given the enrichment of residual replication-competent viral genomes in central memory CD4+ T cells (31–33), it will be important to identify approaches to improve upon the degree of depletion for this key cell type. We observed a trend toward additional incremental depletion of central memory CD4+ T cells with additional Ab administrations, suggesting that the resistance of central memory CD4+ T cells to Ab-mediated depletion may be overcome through alternative Ab-dosing strategies. Although myeloid lineage cells also represent a potentially infectable CD4+ cell type that may be resistant to Ab-mediated depletion, and indeed we observed no evidence of depletion of monocytes in blood following anti-CD4 administration, during early SIV and HIV infection, the overwhelming majority of infected cells are T cells (45, 52–56). This is particularly true for SIVmac239, a strictly T cell tropic virus that only infects substantial numbers of macrophages in a subset of animals late in infection in association with progression to clinical disease (57). Thus, infected macrophages are unlikely to have contributed appreciably to the overall viral reservoirs established within our study animals.
A single animal in the CD4-depletion group, animal ZK08, had a substantial delay in time to viral rebound, with vRNA first detected in plasma at 98 days after cART discontinuation, compared with plasma vRNA first detected within 14–28 days for all other study animals. It is not clear whether this delay in viral rebound was due to baseline infection parameters, extent of CD4 depletion, or a combination of these and/or other factors in this animal. Prior to cART initiation, ZK08 had only the fifth lowest pVL of all the study animals, at 1.2 × 10⁵ vRNA copies/mL. Within the CD4-depletion group, 3 of the animals, including ZK08, had virtually indistinguishable pretreatment pVLs ranging from 1.2 to 1.5 × 10⁵ vRNA copies/mL. Similarly, vDNA levels in PBMCs and tissues in ZK08 prior to CD4 depletion were low but were comparable to those in multiple CD4-depletion group and control group animals. The extent of CD4 depletion in this animal was also not demonstrably superior to that of the other CD4-depletion group animals. Nadir CD4+ T cell counts in blood of ZK08 were 3 cells/μL compared with 2 CD4-depletion group animals that had nadir CD4+ T cell counts of 0 cells/μL. In LNs, there was an 87% reduction in overall CD4+ T cell frequency following depletion for both ZK08 and animal ZK40, with a similar 86% reduction also measured for animal ZK21. Likewise, CD4+ T cell depletion in LN follicles was not measurably superior in animal ZK08 compared with the other CD4-depletion group animals. In rectal tissue, the extent of depletion for ZK08 was second highest at a 53% reduction compared with a 63% reduction in CD4 cell frequency for animal ZK21.
As would be the case for any proposed reservoir reduction strategy, it is possible that clonal expansion of infected cells reconstituted some fraction of the infected cell population that was depleted. We maintained our study animals on cART for 1 year following the final anti-CD4 Ab administration to allow CD4+ T cells to reconstitute to avoid the potential confounding effect that a lack of available target cells might have on measures of viral rebound. However, during this period of CD4 recovery, it is possible that SIV-infected cells expanded in parallel with the total CD4 population. Because vDNA levels were so low in our animals prior to cART release (no vDNA detected in PBMC and <3 vDNA copies/106 cell equivalents in LNs in 5 of 5 CD4-depleted animals), we were not able to evaluate whether there was evidence of reservoir reconstitution through expansion of SIV-infected clones. Prior to CD4 depletion, low but quantifiable levels of vDNA were detected in PBMCs of all 10 study animals. However, prior to cART release, following CD4 depletion and reconstitution, PBMC vDNA was not detected in any of the CD4-depleted animals, while 3 of 5 control animals had low but quantifiable levels of PBMC vDNA. These results suggest that if clonal expansion of SIV-infected cells occurred in our CD4-depleted study animals, the magnitude of expansion may have been limited. After administering the same CD4-depleting Abs to rhesus macaques receiving cART initiated during chronic SIV infection, which allowed higher baseline vDNA levels to be established, Kumar and colleagues (58) measured a decrease rather than an increase in PBMC-associated vDNA during CD4+ T cell recovery, suggesting that clonal expansion of virus-infected cells may not substantially reconstitute the infected cell population following depletion.
Our findings have broad implications for the challenges that will face any HIV-1 reservoir eradication/reduction strategy, which to be successful will have to effectively target residual infected cells distributed throughout the tissues of the body that may be heterogeneous in their susceptibility to any given reservoir depletion approach. Our results also underscore the perils of evaluating reservoirs only in blood or only in limited tissue sites, as uniform effects across diverse tissues cannot be assumed. If only blood were assessed in this study, one might conclude that our CD4-depleted animals were cured of their SIV infection, as we did not detect vDNA in the PBMCs of any of the 5 CD4-depleted animals. Nevertheless, virus rebounded readily in all 5 CD4-depleted animals, with a delay in rebound only observed in a single animal.
In addition to obviating a requirement for robust viral reactivation as a prerequisite for the evaluation of Ab-mediated reservoir depletion, our approach of utilizing an in vivo cell-depleting mAb with specificity for a host cell protein also avoided the confounding complication of uncertain in vivo cell-depleting capacity for individual HIV-1 Env targeted mAbs. While several studies have demonstrated Fc-dependent effector functions for a number of HIV-1 mAbs in vitro (59), whether or not any given mAb will actually deplete target cells in vivo must be evaluated empirically and may be difficult to demonstrate unequivocally due to the limited number of potential target cells. Here, by administering an Ab with well-characterized capacity for depleting targeted cells in vivo (45), we were able to readily and directly quantify the extent and duration of depletion of the targeted cell type in both blood and tissue sites.
A recent study by Borducchi and coworkers suggested that administering the TLR7 agonist GS-9620 along with the bnAb PGT121 to SHIV-infected rhesus macaques on early-initiated suppressive cART resulted in delayed viral rebound in a greater proportion of animals than PGT121 treatment alone (25). One possible explanation for this apparently synergistic effect is a TLR7 agonist–induced increase in Ab-mediated clearance of infected cells, particularly within tissues, perhaps through the upregulation of Fcγ receptor on monocytes/macrophages, as we recently showed in a separate study involving TLR7 agonist administration in rhesus macaques (18). However, quantitative depletion of viral reservoirs in vivo was not directly demonstrable within the context of the Borducchi et al. study due to limited viral reservoir size and limited available dynamic range for reservoir measurements, thus leaving the underlying mechanism of the observed effect unclear (25). Here, we establish the use of a well-characterized in vivo cell-depleting mAb with specificity for a host cell protein as a model for evaluating Ab-based approaches for HIV-1 reservoir targeting and to assess the capacity of proposed enhancing agents to improve depletions across tissues and cell subtypes. Future studies should seek to identify and evaluate approaches that measurably improve cell depletion across diverse tissues and relevant cell subtypes, with the goal of developing a consistent approach for analytic reservoir depletion in SIV-infected, cART-suppressed macaques that can serve as a positive control for studies evaluating clinically relevant reservoir reduction strategies.
Methods
Animals and treatments.
Ten purpose-bred, Indian-origin rhesus macaques (Macaca mulatta, ages 3.1–5.5 years at study initiation, 7 males and 3 females) were housed at the NIH. Prior to study initiation, all animals were free of cercopithecine herpesvirus 1, SIV, simian type-D retrovirus, and simian T lymphotropic virus type 1. Nine of the study animals received enrofloxacin (10 mg/kg, administered orally, once per day for 10 days), paromomycin (25 mg/kg, administered orally, twice daily for 7 days), and fenbendazole (50 mg/kg administered orally, once per day for 5 days) 1 to 2 months prior to SIV infection, while the tenth animal (DEDC) received the same regimen 11 months prior to SIV infection. All 10 animals were negative for the Mamu-B*08 and Mamu-B*17 MHC alleles. Animals were each intravenously inoculated with 2.2 × 10⁵ infectious units (titer determined on TZM-bl cells, as previously described, ref. 60) of the barcoded virus SIVmac239M (27) and at 4 dpi started on a cART regimen consisting of coformulated tenofovir disoproxil fumarate (TDF), emtricitabine (FTC), and dolutegravir (DTG) (provided by Gilead Sciences). The drug regimen was formulated and administered as previously described (26), except that FTC was administered at 40 mg/kg rather than 50 mg/kg. After 30 weeks on cART, 4 animals (experimental group) received 6 doses of rhesusized depleting anti-CD4 Ab (CD4R1, NIH Nonhuman Primate Reagent Resource), administered subcutaneously to anesthetized animals at 25 mg/kg once every 2 weeks concomitantly with continued cART. The fifth experimental group animal (ZK31) received the first 5 of these anti-CD4 doses but did not receive the sixth dose. Anti-CD4 Ab administration was well tolerated in all 5 treated animals, with no adverse events noted. The control group was maintained on cART without anti-CD4 Ab. After the final dose of anti-CD4 Ab, animals were maintained on cART for an additional 54 weeks; in total, animals received continuous daily cART for a total of approximately 93 weeks (~1.8 years).
Sample collection and processing.
Whole blood, peripheral LN biopsies, and rectal pinch biopsies were collected from anesthetized animals. Plasma for vRNA quantification and sequencing and PBMCs for flow cytometric assays and cell-associated vDNA quantification were prepared from blood collected in EDTA Vacutainer Tubes (BD). Following separation from whole blood by centrifugation, plasma aliquots were stored at –80°C. After plasma separation, the cellular fraction of each whole blood sample was resuspended in PBS and PBMCs were then isolated by Ficoll-Paque Plus (GE Healthcare) gradient centrifugation. Portions of isolated PBMC samples were cryopreserved viably or as dry cell pellets. Rectal pinch biopsies were obtained using biopsy forceps by direct visualization. Freshly collected LN and rectal tissue specimens were collected into tubes containing zirconium microbeads (for later tissue dissociation) and snap-frozen in liquid nitrogen or into tubes containing 4% paraformaldehyde or RPMI 1640 medium supplemented with 10% or 5% FBS, respectively. Mononuclear cell suspensions were prepared from tissues collected in RPMI essentially as described previously (10).
pVLs.
SIV RNA in plasma was quantified using a quantitative reverse-transcription PCR (qRT-PCR) assay with a threshold quantification limit of 15 vRNA copies/mL, as previously described (61).
Cell- and tissue-associated viral loads.
Cell-associated vDNA levels in PBMC and biopsy tissues were analyzed essentially as described previously, using a qPCR assay targeting a conserved sequence in gag (62, 63). Threshold sensitivity for this assay is dependent on the amount of input sample available for testing. For each sample type, the number of cell equivalents analyzed was as follows: 1.0 × 10⁶–9.2 × 10⁶ for PBMCs, 5.5 × 10⁶–5.1 × 10⁷ for rectal tissue, and 1.1 × 10⁷–2.4 × 10⁸ for LN tissue.
Flow cytometry.
Absolute counts of immune cell populations in whole blood and immunophenotyping of immune cells in whole blood and in freshly isolated tissue suspension cells were determined by flow cytometry. Abs and reagents were obtained from BD Biosciences, unless indicated otherwise, and data analysis was performed using FCS Express (De Novo Software). Ab panel validation and population gating were performed using fluorescence minus one and corresponding biological controls, and flow cytometers were calibrated daily with BD Cytometer Setup and Tracking Beads. For absolute cell counting, EDTA–anti-coagulated whole blood (50 μL) was incubated for 20 minutes with the following Ab panel: CD20 Pacific Blue (clone 2H7, BioLegend), CD28 Brilliant Violet (BV) 510 (clone CD28.2), CD45 FITC (clone DO58-1283), CD3 PE (clone SP34-2), CD95 PE-Cy5 (clone DX2), CD8α PE-Cy7 (clone SK1), CD4 APC (clone L200), and CD14 APC-Cy7 (clone M5E2, BioLegend). Cells were then incubated for 10 minutes with 2 mL of 1× 1-step Fix/Lyse Solution (eBioscience), and then approximately 20,000 CD45+CD3+ gated cells were acquired per sample on a BD FACSVerse flow cytometer equipped with a volumetric flow sensor. Cell counts per microliter of whole blood were calculated by correcting for dilution and dividing raw numbers by the sample volume acquired. For immunophenotyping, 100 μL EDTA-anticoagulated whole blood or 1 × 10⁶ freshly isolated tissue-suspension cells were incubated for 20 minutes with the following Ab panel: CD20 BV605 (clone 2H7, BioLegend), CD28 ECD (clone CD28.2, Beckman Coulter), CD56 PE-Cy5 (clone B159), CD69 BV650 (clone FN50, BioLegend), CCR5 PerCP-Cy5.5 (clone HEK/1/85a, BioLegend), CD16 BV785 (clone 3G8, BioLegend), CD14 APC (clone M5E2, BioLegend), CD38 PE (clone OK10; NIH Nonhuman Primate Reagent Resource), CD95 BV711 (clone DX2, BioLegend), CD4 Pacific Blue (clone OKT4, BioLegend), HLA-DR Alexa Fluor 700 (clone L243, BioLegend), CD8α PE-Cy7, and CD3 APC-Cy7 (clone SP34-2). Samples were lysed with 1× FACS Lyse buffer for 10 minutes, washed twice with PBS containing 0.5% BSA and 0.05% NaN3 (PBA, MilliporeSigma), and then treated with Cytofix/Cytoperm buffer to fix and permeabilize the cells. Samples were then washed with 1× Perm Wash buffer, incubated with 50 μL of intracellular staining panel containing Ki67 FITC (B56) Ab for 30 minutes, washed twice with 1× Perm Wash, and resuspended in PBA; approximately 200,000 CD3+ T cells were acquired for each sample using a BD LSR Fortessa X-20 flow cytometer.
Barcode sequencing and analysis.
Plasma vRNA was quantified by RT-PCR prior to sequencing on an Illumina Miseq. Briefly, vRNA from plasma, or viral stock was extracted using the QIAamp Viral RNA Mini Kit (QIAGEN). cDNA was synthesized using SuperScript III Reverse Transcriptase (Thermo Fisher Scientific) and the gene-specific primer vpr.cDNA3 (5′-CAGGTTGGCCGATTCTGGAGTGGATGC-3′). The amount of cDNA template used for input normalization was determined by qPCR with primers VpxF1 5′-CTAGGGGAAGGACATGGGGCAGG-3′ at 6082-6101 and VprR1 5′-CCAGAACCTCCACTACCCATTCATC-3′ at 6220-6199 and with a labeled probe (ACCTCCAGAAAATGAAGGACCACAAAGGG). Prior to MiSeq sequencing, PCR was performed with a defined amount of input template (up to 500,000 copies/sample) using vpxF1 and vprR1 primers containing an 8-nucleotide index sequence for multiplexing, a spacer (4 random nucleotides), and the Illumina adaptor sequence (P5 and P7). PCR was performed using High Fidelity Platinum Taq (Thermo Fisher) with the following reaction conditions: 94°C for 2 minutes, 40 cycles of 94°C for 15 seconds, 60°C for 1.5 minutes, and 68°C for 30 seconds, with a final extension of 68°C for 5 minutes. The amplified DNA was purified and pooled prior to MiSeq sequencing (Illumina). Sequences were demultiplexed based on exact matches to the Illumina P5 index (1 of 40). All sequences for each unique index read were then aligned to the first 28 bases of the vpr gene allowing for 2 nucleotide mismatches. The 34 bases directly upstream of the start codon for vpr were extracted, corresponding to the barcode. Since the number of template cDNA copies was quantified using qRT-PCR, the limit of detection for animal samples was set at the theoretical number of sequences resulting from a single template copy (1/template input). In rare cases, all minor barcode sequences (less than 0.5% of the total sequence reads) that were a single nucleotide different from another prevalent barcode in the same sample were excluded. For multiplexed samples, infrequent index hopping was also observed between multiplexed samples, which were also excluded. Sequence analysis was performed using the Frederick National Laboratory for Cancer Research Barcode Analysis Tool (https://frederick.cancer.gov/science/compresources), a custom algorithm written in R (version 3.6.3) to analyze barcoded viruses.
nFL viral genome sequencing.
nFL viral genome sequencing was performed on vDNA extracted from LN-derived mononuclear cells as described previously (50, 64).
Estimation of the reactivation rate.
We used a previously described method to estimate the reactivation rate based on the relative frequencies of the rebounding clonotypes and the growth rate of the virus in each animal (27, 29). Assuming that the virus grows exponentially and that each clonotype, which differ only in the barcode sequence, has approximately the same growth rate, the reactivation rate can be estimated as follows: 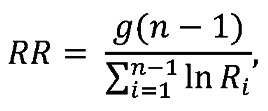 (Equation 1)where n is the number of clonotypes, g is the growth rate, and Ri is the ratio between the number of sequencing reads of clonotypes i and i+1, Ri = Si/Si+1. When possible, the clonotype ratio was assessed at a time point allowing maximum sequencing depth and at least 2 distinct clonotypes, but prior to a substantial reduction in the growth rate of the virus population (see Figure 5).
Because the barcode-based method for estimating the reactivation rate requires at least 2 rebounding clonotypes, we used an alternative, previously described method to estimate the reactivation rate based on time to detection for animal ZK08, for which only a single rebounding clonotype was observed (42). For this approach, the average delay to viral detection after cART discontinuation is modeled as the sum of the average time between reactivation events, which is exponentially distributed, and a fixed delay due to drug washout and viral growth to detectable levels after reactivation. The probability of a time to detection of at least T days for a fixed delay of d days and a reactivation rate of r events per day is calculated as e–r(T–d). To estimate bounds for the likely reactivation rate based on time to detection, we determined the maximum and minimum reactivation rates for which the observed time to detection (minus the fixed delay) falls within the 5th and 95th quantiles, respectively. To obtain the maximum possible reactivation rate, we set the fixed delay to 13 days on account of the earliest viral rebound being observed at 14 days.
IHC staining of tissue sections.
IHC was performed as previously described (65). Briefly, IHC on LN biopsy tissues was performed on 5 μm tissue sections. Heat-induced epitope retrieval was performed by heating sections in 0.01% citraconic anhydride containing 0.05% Tween-20, then incubated with Ab diluted in blocking buffer overnight at 4°C or for 1 hour at room temperature. Abs used were to the following: CD4 (1:200, Rb, Abcam) and a combination myeloid lineage Ab pair to CD68 (1:500, Ms, Biocare Medical) and CD163 (1:500, Ms, Leica). Slides were then washed in 1× TBS with 0.05% Tween-20, with endogenous peroxidases blocked using 1.5% (v/v) H2O2 in TBS, pH 7.4, for 5 minutes. Sections were then incubated with rabbit Polink-1 HRP and mouse Polink-2 alkaline phosphatase (AP) and developed with ImmPACT DAB (3,3′-diaminobenzidine; Vector Laboratories) followed by Warp Red (Biocare Medical) according to the manufacturer’s recommendations. All slides were washed in water, counterstained with hematoxylin, mounted in Permount (Thermo Fisher Scientific), and scanned at high magnification (×200) using the Aperio CS System (Leica) to generate high-resolution data from the entire tissue section. Representative regions of interest (0.4 mm2) were identified and high-resolution images extracted from these whole-tissue scans. The percentage area positive for positive cells was quantified using Photoshop (Adobe Systems), Noiseware (Imagenomic), and Fovea Pro (Reindeer Graphics).
Statistics.
Statistical analysis was performed using GraphPad Prism for Windows, version 8.3.1 (GraphPad Software, 2019) or in R (66). P values of less than 0.05 were considered significant.
Study approval.
All work involving research animals was conducted under a protocol approved by the Institutional Animal Care and Use Committee of the National Cancer Institute (protocol AVP-047) and adhered to the standards of the Guide for the Care and Use of Laboratory Animals (National Academies Press, 2011) in accordance with the Animal Welfare Act. Macaques were housed at the NIH and cared for in accordance with American Association for the Accreditation of Laboratory Animal Care (AAALAC) standards in an AAALAC-accredited facility (Animal Welfare Assurance number A4149-01).
Author contributions
GQDP conceived of the study. GQDP, BFK, and JDL planned the experiments. GQDP, AES, and JDL wrote the manuscript with input from all authors. AES, TTI, DD, TM, BFK, and GQDP analyzed the data. TTI performed the computational modeling. KO, CP, JAT, WJB, LS, MH, LN, VC, AW, RW, J Kiser, DRM, RS, RF, CMF, CMT, CD, and JDE processed samples and generated the primary data. MWB and J Kramer provided veterinary care.
Supplementary Material
Acknowledgments
We thank George Muthua and the animal care staff of the Laboratory Animal Sciences Program, Frederick National Laboratory, for expert animal care and support. We also thank Miles Davenport for helpful discussions. The anti-CD4 Ab administered to macaques on this study and the CD38-PE Ab used for flow cytometry were obtained from the NIH Nonhuman Primate Reagent Resource (R24 OD010976, U24 AI126683). This project has been funded in part with federal funds from the National Cancer Institute, NIH, under contract numbers HHSN261200800001E and 75N91019D00024 with additional partial support by the National Institute of Allergy and Infectious Diseases of the NIH under award number UM1AI126611. The content of this publication does not necessarily reflect the views or policies of the Department of Health and Human Services, nor does mention of trade names, commercial products, or organizations imply endorsement by the US Government.
Version 1. 01/19/2021
In-Press Preview
Version 2. 03/15/2021
Print issue publication
Footnotes
Conflict of interest: The authors have declared that no conflict of interest exists.
Copyright: © 2021, American Society for Clinical Investigation.
Reference information: J Clin Invest. 2021;131(6):e142421.https://doi.org/10.1172/JCI142421.
Contributor Information
Adrienne E. Swanstrom, Email: adrienne.swanstrom@nih.gov.
Taina T. Immonen, Email: taina.immonen@nih.gov.
Kelli Oswald, Email: oswaldk@nih.gov.
Cathi Pyle, Email: pyleca@nih.gov.
James A. Thomas, Email: james.thomas3@nih.gov.
William J. Bosche, Email: boschewj@mail.nih.gov.
Lorna Silipino, Email: lorna.silipino@nih.gov.
Michael Hull, Email: hullmj@mail.nih.gov.
Laura Newman, Email: laura.newman@nih.gov.
Vicky Coalter, Email: cvtrub@aol.com.
Adam Wiles, Email: wilesac@nih.gov.
Rodney Wiles, Email: Wilesrw@mail.nih.gov.
Jacob Kiser, Email: jacob.kiser@nih.gov.
David R. Morcock, Email: morcockd@nih.gov.
Rebecca Shoemaker, Email: shoemakerrw@mail.nih.gov.
Randy Fast, Email: randy.fast@nih.gov.
Matthew W. Breed, Email: matthew.breed@nih.gov.
Joshua Kramer, Email: josh.kramer@nih.gov.
Duncan Donohue, Email: duncan.donohue@nih.gov.
Tyler Malys, Email: tyler.malys@nih.gov.
Christine M. Fennessey, Email: christine.fennessey@nih.gov.
Charles M. Trubey, Email: trubeyc@mail.nih.gov.
Claire Deleage, Email: claire.deleage@nih.gov.
Jacob D. Estes, Email: estesja@ohsu.edu.
Jeffrey D. Lifson, Email: lifsonj@nih.gov.
Brandon F. Keele, Email: keelebf@nih.gov.
Gregory Q. Del Prete, Email: delpretegq@nih.gov.
References
- 1.Antiretroviral Therapy Cohort Collaboration Survival of HIV-positive patients starting antiretroviral therapy between 1996 and 2013: a collaborative analysis of cohort studies. Lancet HIV. 2017;4(8):e349–e356. doi: 10.1016/S2352-3018(17)30066-8. [DOI] [PMC free article] [PubMed] [Google Scholar]
- 2.Sengupta S, Siliciano RF. Targeting the latent reservoir for HIV-1. Immunity. 2018;48(5):872–895. doi: 10.1016/j.immuni.2018.04.030. [DOI] [PMC free article] [PubMed] [Google Scholar]
- 3.Chun TW, et al. Rebound of plasma viremia following cessation of antiretroviral therapy despite profoundly low levels of HIV reservoir: implications for eradication. AIDS. 2010;24(18):2803–2808. doi: 10.1097/QAD.0b013e328340a239. [DOI] [PMC free article] [PubMed] [Google Scholar]
- 4.Cleary S, McIntyre D. Financing equitable access to antiretroviral treatment in South Africa. BMC Health Serv Res. 2010;10(suppl 1):S2. doi: 10.1186/1472-6963-10-S1-S2. [DOI] [PMC free article] [PubMed] [Google Scholar]
- 5.Clutter DS, et al. HIV-1 drug resistance and resistance testing. Infect Genet Evol. 2016;46:292–307. doi: 10.1016/j.meegid.2016.08.031. [DOI] [PMC free article] [PubMed] [Google Scholar]
- 6.Ndung’u T, et al. Why and where an HIV cure is needed and how it might be achieved. Nature. 2019;576(7787):397–405. doi: 10.1038/s41586-019-1841-8. [DOI] [PMC free article] [PubMed] [Google Scholar]
- 7.Hunt PW, et al. Immunologic biomarkers, morbidity, and mortality in treated HIV infection. J Infect Dis. 2016;214(suppl 2):S44–50. doi: 10.1093/infdis/jiw275. [DOI] [PMC free article] [PubMed] [Google Scholar]
- 8.Cohn LB, et al. The biology of the HIV-1 latent reservoir and implications for cure strategies. Cell Host Microbe. 2020;27(4):519–530. doi: 10.1016/j.chom.2020.03.014. [DOI] [PMC free article] [PubMed] [Google Scholar]
- 9.Archin NM, et al. Administration of vorinostat disrupts HIV-1 latency in patients on antiretroviral therapy. Nature. 2012;487(7408):482–485. doi: 10.1038/nature11286. [DOI] [PMC free article] [PubMed] [Google Scholar]
- 10.Del Prete GQ, et al. Effect of suberoylanilide hydroxamic acid (SAHA) administration on the residual virus pool in a model of combination antiretroviral therapy-mediated suppression in SIVmac239-infected indian rhesus macaques. Antimicrob Agents Chemother. 2014;58(11):6790–6806. doi: 10.1128/AAC.03746-14. [DOI] [PMC free article] [PubMed] [Google Scholar]
- 11.Elliott JH, et al. Activation of HIV transcription with short-course vorinostat in HIV-infected patients on suppressive antiretroviral therapy. PLoS Pathog. 2014;10(10):e1004473. doi: 10.1371/journal.ppat.1004473. [DOI] [PMC free article] [PubMed] [Google Scholar]
- 12.Del Prete GQ, et al. Elevated plasma viral loads in romidepsin-treated simian immunodeficiency virus-infected rhesus macaques on suppressive combination antiretroviral therapy. Antimicrob Agents Chemother. 2015;60(3):1560–1572. doi: 10.1128/AAC.02625-15. [DOI] [PMC free article] [PubMed] [Google Scholar]
- 13.Søgaard OS, et al. The depsipeptide romidepsin reverses HIV-1 latency in vivo. PLoS Pathog. 2015;11(9):e1005142. doi: 10.1371/journal.ppat.1005142. [DOI] [PMC free article] [PubMed] [Google Scholar]
- 14.Lim SY, et al. TLR7 agonists induce transient viremia and reduce the viral reservoir in SIV-infected rhesus macaques on antiretroviral therapy. Sci Transl Med. 2018;10(439):eaao4521. doi: 10.1126/scitranslmed.aao4521. [DOI] [PMC free article] [PubMed] [Google Scholar]
- 15.Nixon CC, et al. Systemic HIV and SIV latency reversal via non-canonical NF-κB signalling in vivo. Nature. 2020;578(7793):160–165. doi: 10.1038/s41586-020-1951-3. [DOI] [PMC free article] [PubMed] [Google Scholar]
- 16.Archin NM, et al. HIV-1 expression within resting CD4 T-cells following multiple doses of vorinostat. J Infect Dis. 2014;210(5):728–735. doi: 10.1093/infdis/jiu155. [DOI] [PMC free article] [PubMed] [Google Scholar]
- 17.Leth S, et al. Combined effect of Vacc-4x, recombinant human granulocyte macrophage colony-stimulating factor vaccination, and romidepsin on the HIV-1 reservoir (REDUC): a single-arm, phase 1B/2A trial. Lancet HIV. 2016;3(10):e463–e472. doi: 10.1016/S2352-3018(16)30055-8. [DOI] [PubMed] [Google Scholar]
- 18.Del Prete GQ, et al. TLR7 agonist administration to SIV-infected macaques receiving early initiated cART does not induce plasma viremia. JCI Insight. 2019;4(11):e127717. doi: 10.1172/jci.insight.127717. [DOI] [PMC free article] [PubMed] [Google Scholar]
- 19.Bekerman E, et al. PD-1 Blockade and TLR7 activation lack therapeutic benefit in chronic simian immunodeficiency virus-infected macaques on antiretroviral therapy. Antimicrob Agents Chemother. 2019;63(11):e01163–19. doi: 10.1128/AAC.01163-19. [DOI] [PMC free article] [PubMed] [Google Scholar]
- 20. McMahon D, et al. Multidose IV romidepsin: no increase HIV-1 expression in person on ART, ACTG A5315. Presented at: 2019 Conference on Retroviruses and Opportunistic Infections (CROI); March 4–7, 2019; Seattle, Washington, USA. https://www.croiconference.org/croi-2019/# Accessed January 28, 2021.
- 21.Promsote W, et al. Anti-HIV-1 antibodies: an update. BioDrugs. 2020;34(2):121–132. doi: 10.1007/s40259-020-00413-2. [DOI] [PubMed] [Google Scholar]
- 22.Matucci A, et al. An overview on safety of monoclonal antibodies. Curr Opin Allergy Clin Immunol. 2016;16(6):576–581. doi: 10.1097/ACI.0000000000000315. [DOI] [PubMed] [Google Scholar]
- 23.Lu CL, et al. Enhanced clearance of HIV-1-infected cells by broadly neutralizing antibodies against HIV-1 in vivo. Science. 2016;352(6288):1001–1004. doi: 10.1126/science.aaf1279. [DOI] [PMC free article] [PubMed] [Google Scholar]
- 24.Riddler SA, et al. Randomized clinical trial to assess the impact of the broadly neutralizing HIV-1 monoclonal antibody VRC01 on HIV-1 persistence in individuals on effective ART. Open Forum Infect Dis. 2018;5(10):ofy242. doi: 10.1093/ofid/ofy242. [DOI] [PMC free article] [PubMed] [Google Scholar]
- 25.Borducchi EN, et al. Antibody and TLR7 agonist delay viral rebound in SHIV-infected monkeys. Nature. 2018;563(7731):360–364. doi: 10.1038/s41586-018-0600-6. [DOI] [PMC free article] [PubMed] [Google Scholar]
- 26.Del Prete GQ, et al. Short communication: comparative evaluation of coformulated injectable combination antiretroviral therapy regimens in simian immunodeficiency virus-infected rhesus macaques. AIDS Res Hum Retroviruses. 2016;32(2):163–168. doi: 10.1089/aid.2015.0130. [DOI] [PMC free article] [PubMed] [Google Scholar]
- 27.Fennessey CM, et al. Genetically-barcoded SIV facilitates enumeration of rebound variants and estimation of reactivation rates in nonhuman primates following interruption of suppressive antiretroviral therapy. PLoS Pathog. 2017;13(5):e1006359. doi: 10.1371/journal.ppat.1006359. [DOI] [PMC free article] [PubMed] [Google Scholar]
- 28.Khanal S, et al. In vivo validation of the viral barcoding of simian immunodeficiency virus SIVmac239 and the development of new barcoded SIV and subtype B and C simian-human immunodeficiency viruses. J Virol. 2019;94(1):e01420–19. doi: 10.1128/JVI.01420-19. [DOI] [PMC free article] [PubMed] [Google Scholar]
- 29.Pinkevych M, et al. Predictors of SIV recrudescence following antiretroviral treatment interruption. Elife. 2019;8:e49022. doi: 10.7554/eLife.49022. [DOI] [PMC free article] [PubMed] [Google Scholar]
- 30.Okoye A, et al. Profound CD4+/CCR5+ T cell expansion is induced by CD8+ lymphocyte depletion but does not account for accelerated SIV pathogenesis. J Exp Med. 2009;206(7):1575–1588. doi: 10.1084/jem.20090356. [DOI] [PMC free article] [PubMed] [Google Scholar]
- 31.Chomont N, et al. HIV reservoir size and persistence are driven by T cell survival and homeostatic proliferation. Nat Med. 2009;15(8):893–900. doi: 10.1038/nm.1972. [DOI] [PMC free article] [PubMed] [Google Scholar]
- 32.Cartwright EK, et al. Initiation of antiretroviral therapy restores CD4+ T memory stem cell homeostasis in simian immunodeficiency virus-infected macaques. J Virol. 2016;90(15):6699–6708. doi: 10.1128/JVI.00492-16. [DOI] [PMC free article] [PubMed] [Google Scholar]
- 33.Soriano-Sarabia N, et al. Quantitation of replication-competent HIV-1 in populations of resting CD4+ T cells. J Virol. 2014;88(24):14070–14077. doi: 10.1128/JVI.01900-14. [DOI] [PMC free article] [PubMed] [Google Scholar]
- 34.Folkvord JM, et al. Lymphoid follicles are sites of heightened human immunodeficiency virus type 1 (HIV-1) replication and reduced antiretroviral effector mechanisms. AIDS Res Hum Retroviruses. 2005;21(5):363–370. doi: 10.1089/aid.2005.21.363. [DOI] [PubMed] [Google Scholar]
- 35.Connick E, et al. CTL fail to accumulate at sites of HIV-1 replication in lymphoid tissue. J Immunol. 2007;178(11):6975–6983. doi: 10.4049/jimmunol.178.11.6975. [DOI] [PubMed] [Google Scholar]
- 36.Perreau M, et al. Follicular helper T cells serve as the major CD4 T cell compartment for HIV-1 infection, replication, and production. J Exp Med. 2013;210(1):143–156. doi: 10.1084/jem.20121932. [DOI] [PMC free article] [PubMed] [Google Scholar]
- 37.Fukazawa Y, et al. B cell follicle sanctuary permits persistent productive simian immunodeficiency virus infection in elite controllers. Nat Med. 2015;21(2):132–139. doi: 10.1038/nm.3781. [DOI] [PMC free article] [PubMed] [Google Scholar]
- 38.Deleage C, et al. Defining HIV and SIV reservoirs in lymphoid tissues. Pathog Immun. 2016;1(1):68–106. doi: 10.20411/pai.v1i1.100. [DOI] [PMC free article] [PubMed] [Google Scholar]
- 39.Bender AM, et al. The landscape of persistent viral genomes in ART-treated SIV, SHIV, and HIV-2 infections. Cell Host Microbe. 2019;26(1):73–85. doi: 10.1016/j.chom.2019.06.005. [DOI] [PMC free article] [PubMed] [Google Scholar]
- 40.Ferris AL, et al. Clonal expansion of SIV-infected cells in macaques on antiretroviral therapy is similar to that of HIV-infected cells in humans. PLoS Pathog. 2019;15(7):e1007869. doi: 10.1371/journal.ppat.1007869. [DOI] [PMC free article] [PubMed] [Google Scholar]
- 41.Okoye AA, et al. Early antiretroviral therapy limits SIV reservoir establishment to delay or prevent post-treatment viral rebound. Nat Med. 2018;24(9):1430–1440. doi: 10.1038/s41591-018-0130-7. [DOI] [PMC free article] [PubMed] [Google Scholar]
- 42.Pinkevych M, et al. Correction: HIV reactivation from latency after treatment interruption occurs on average every 5–8 days-implications for HIV remission. PLoS Pathog. 2015;11(7):e1005000. doi: 10.1371/journal.ppat.1005000. [DOI] [PMC free article] [PubMed] [Google Scholar]
- 43.Hill AL, et al. Predicting the outcomes of treatment to eradicate the latent reservoir for HIV-1. Proc Natl Acad Sci U S A. 2014;111(37):13475–13480. doi: 10.1073/pnas.1406663111. [DOI] [PMC free article] [PubMed] [Google Scholar]
- 44.Cohen YZ, Caskey M. Broadly neutralizing antibodies for treatment and prevention of HIV-1 infection. Curr Opin HIV AIDS. 2018;13(4):366–373. doi: 10.1097/COH.0000000000000475. [DOI] [PubMed] [Google Scholar]
- 45.Micci L, et al. CD4 depletion in SIV-infected macaques results in macrophage and microglia infection with rapid turnover of infected cells. PLoS Pathog. 2014;10(10):e1004467. doi: 10.1371/journal.ppat.1004467. [DOI] [PMC free article] [PubMed] [Google Scholar]
- 46.Clapham PR, et al. Specific cell surface requirements for the infection of CD4-positive cells by human immunodeficiency virus types 1 and 2 and by Simian immunodeficiency virus. Virology. 1991;181(2):703–715. doi: 10.1016/0042-6822(91)90904-P. [DOI] [PMC free article] [PubMed] [Google Scholar]
- 47.Piguet V, et al. The downregulation of CD4 and MHC-I by primate lentiviruses: a paradigm for the modulation of cell surface receptors. Immunol Rev. 1999;168:51–63. doi: 10.1111/j.1600-065X.1999.tb01282.x. [DOI] [PubMed] [Google Scholar]
- 48.Bruner KM, et al. Defective proviruses rapidly accumulate during acute HIV-1 infection. Nat Med. 2016;22(9):1043–1049. doi: 10.1038/nm.4156. [DOI] [PMC free article] [PubMed] [Google Scholar]
- 49.Hiener B, et al. Identification of genetically intact HIV-1 proviruses in specific CD4+ T cells from effectively treated participants. Cell Rep. 2017;21(3):813–822. doi: 10.1016/j.celrep.2017.09.081. [DOI] [PMC free article] [PubMed] [Google Scholar]
- 50.Long S, et al. Evaluating the intactness of persistent viral genomes in simian immunodeficiency virus-infected rhesus macaques after initiating antiretroviral therapy within one year of infection. J Virol. 2019;94(1):e01308–19. doi: 10.1128/JVI.01308-19. [DOI] [PMC free article] [PubMed] [Google Scholar]
- 51.Schneider JR, et al. Long-term direct visualization of passively transferred fluorophore-conjugated antibodies. J Immunol Methods. 2017;450:66–72. doi: 10.1016/j.jim.2017.07.009. [DOI] [PMC free article] [PubMed] [Google Scholar]
- 52.Zhang Z, et al. Sexual transmission and propagation of SIV and HIV in resting and activated CD4+ T cells. Science. 1999;286(5443):1353–1357. doi: 10.1126/science.286.5443.1353. [DOI] [PubMed] [Google Scholar]
- 53.Schacker T, et al. Productive infection of T cells in lymphoid tissues during primary and early human immunodeficiency virus infection. J Infect Dis. 2001;183(4):555–562. doi: 10.1086/318524. [DOI] [PubMed] [Google Scholar]
- 54.Li Q, et al. Peak SIV replication in resting memory CD4+ T cells depletes gut lamina propria CD4+ T cells. Nature. 2005;434(7037):1148–1152. doi: 10.1038/nature03513. [DOI] [PubMed] [Google Scholar]
- 55.Kelleher AD, Zaunders JJ. Decimated or missing in action: CD4+ T cells as targets and effectors in the pathogenesis of primary HIV infection. Curr HIV/AIDS Rep. 2006;3(1):5–12. doi: 10.1007/s11904-006-0002-5. [DOI] [PubMed] [Google Scholar]
- 56.Haase AT. Targeting early infection to prevent HIV-1 mucosal transmission. Nature. 2010;464(7286):217–223. doi: 10.1038/nature08757. [DOI] [PubMed] [Google Scholar]
- 57.Swanstrom AE, et al. The SIV envelope glycoprotein, viral tropism, and pathogenesis: novel insights from nonhuman primate models of AIDS. Curr HIV Res. 2018;16(1):29–40. doi: 10.2174/1570162X15666171124123116. [DOI] [PubMed] [Google Scholar]
- 58.Kumar NA, et al. Antibody-mediated CD4 depletion induces homeostatic CD4+ T cell proliferation without detectable virus reactivation in antiretroviral therapy-treated simian immunodeficiency virus-infected macaques. J Virol. 2018;92(22):e01235–18. doi: 10.1128/JVI.01235-18. [DOI] [PMC free article] [PubMed] [Google Scholar]
- 59.Butler AL, et al. The antibodiome-mapping the humoral immune response to HIV. Curr HIV/AIDS Rep. 2019;16(2):169–179. doi: 10.1007/s11904-019-00432-x. [DOI] [PMC free article] [PubMed] [Google Scholar]
- 60.Morcock DR, et al. HIV-1 inactivation by 4-vinylpyridine is enhanced by dissociating Zn(2+) from nucleocapsid protein. Virology. 2008;375(1):148–158. doi: 10.1016/j.virol.2008.01.045. [DOI] [PMC free article] [PubMed] [Google Scholar]
- 61.Li H, et al. Envelope residue 375 substitutions in simian-human immunodeficiency viruses enhance CD4 binding and replication in rhesus macaques. Proc Natl Acad Sci U S A. 2016;113(24):E3413–E3422. doi: 10.1073/pnas.1606636113. [DOI] [PMC free article] [PubMed] [Google Scholar]
- 62.Hansen SG, et al. Immune clearance of highly pathogenic SIV infection. Nature. 2013;502(7469):100–104. doi: 10.1038/nature12519. [DOI] [PMC free article] [PubMed] [Google Scholar]
- 63.Hansen SG, et al. Addendum: immune clearance of highly pathogenic SIV infection. Nature. 2017;547(7661):123–124. doi: 10.1038/nature22984. [DOI] [PubMed] [Google Scholar]
- 64.Lopker MJ, et al. Derivation and characterization of pathogenic transmitted/founder molecular clones from simian immunodeficiency virus SIVsmE660 and SIVmac251 following mucosal infection. J Virol. 2016;90(19):8435–8453. doi: 10.1128/JVI.00718-16. [DOI] [PMC free article] [PubMed] [Google Scholar]
- 65.Deleage C, et al. Impact of early cART in the gut during acute HIV infection. JCI Insight. 2016;1(10):e87065. doi: 10.1172/jci.insight.87065. [DOI] [PMC free article] [PubMed] [Google Scholar]
- 66. R: A Language and Environment for Statistical Computing. Version 4.0.4. R Foundation for Statistical Computing Vienna, Austria; 2020. Accessed January 28, 2021. https://www.r-project.org/
Associated Data
This section collects any data citations, data availability statements, or supplementary materials included in this article.