Abstract
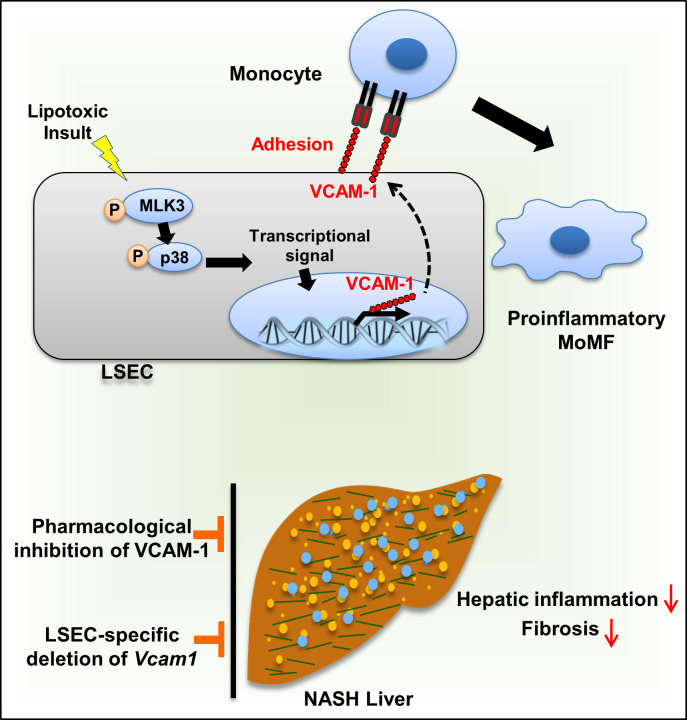
Monocyte homing to the liver and adhesion to the liver sinusoidal endothelial cells (LSECs) are key elements in nonalcoholic steatohepatitis (NASH) pathogenesis. We reported previously that VCAM-1 mediates monocyte adhesion to LSECs. However, the pathogenic role of VCAM-1 in NASH is unclear. Herein, we report that VCAM-1 was a top upregulated adhesion molecule in the NASH mouse liver transcriptome. Open chromatin landscape profiling combined with genome-wide transcriptome analysis showed robust transcriptional upregulation of LSEC VCAM-1 in murine NASH. Moreover, LSEC VCAM-1 expression was significantly increased in human NASH. LSEC VCAM-1 expression was upregulated by palmitate treatment in vitro and reduced with inhibition of the mitogen-activated protein 3 kinase (MAP3K) mixed lineage kinase 3 (MLK3). Likewise, LSEC VCAM-1 expression was reduced in the Mlk3–/– mice with diet-induced NASH. Furthermore, VCAM-1 neutralizing Ab or pharmacological inhibition attenuated diet-induced NASH in mice, mainly via reducing the proinflammatory monocyte hepatic population as examined by mass cytometry by time of flight (CyTOF). Moreover, endothelium-specific Vcam1 knockout mice were also protected against NASH. In summary, lipotoxic stress enhances the expression of LSEC VCAM-1, in part, through MLK3 signaling. Inhibition of VCAM-1 was salutary in murine NASH and might serve as a potential therapeutic strategy for human NASH.
Keywords: Hepatology
Keywords: Cell migration/adhesion, Endothelial cells
Introduction
Nonalcoholic fatty liver disease (NAFLD) is characterized by hepatic steatosis in the absence of substantial alcohol consumption. A subset of patients with NAFLD develop a progressive inflammatory subtype termed nonalcoholic steatohepatitis (NASH), which can progress to end-stage liver diseases (1). With the obesity pandemic, NASH has become the most common cause of chronic liver diseases worldwide (2). Since lifestyle modification and existing pharmacotherapies for NASH are of limited efficacy, there is a critical need for novel mechanism-based therapeutic targets for NASH (3, 4).
The unrelenting inflammatory response in NASH results in liver fibrosis, the most important risk factor for mortality and morbidity in patients with NASH (3). This inflammatory response is mainly mediated by recruited proinflammatory monocytes that differentiate into macrophages, so-called monocyte-derived macrophages (MoMFs) (5). One of the crucial processes involved in the homing of the circulating monocytes to the liver is monocyte adhesion to liver sinusoidal endothelial cells (LSECs) (6). While a growing body of evidence implicates LSEC dysfunction in various liver diseases, including NASH (7, 8), few studies have focused on targeting the molecular mediators of monocyte adhesion to LSECs in NASH (9).
We have reported recently that lipotoxic hepatocyte-derived extracellular vesicles (EVs) are enriched with integrin α9β1 (ITGα9β1), and enhance monocyte adhesion to LSECs through binding interaction with VCAM-1 expressed on LSECs (9). VCAM-1 is a member of the immunoglobulin superfamily of cell adhesion molecules. VCAM-1 is predominantly expressed on the surface of endothelial cells and regulates firm adhesion of leukocytes to the endothelium (10). Prior murine studies indicate that anti–VCAM-1 neutralizing Ab (anti-VCAM1Ab) treatment improves the inflammatory response in atherosclerosis and rheumatoid arthritis (RA) (11, 12). Interestingly, atherosclerosis and RA share common pathogenic features with NASH, namely endothelial dysfunction, increased activation of monocytes, and elevated serum levels of proinflammatory cytokines, such as TNF-α and IL-1β (13, 14). Furthermore, a recent study reported that serum levels of soluble VCAM-1 predicted fibrosis in NAFLD patients, suggesting the possible functional role of VCAM-1 in the progression of NASH (15). However, the regulation and the pathogenic role of LSEC VCAM-1 in NASH are unexplored.
Herein, we report, using a genome-wide transcriptome and open-chromatin analysis, abundant expression of Vcam1 in NASH liver. Toxic lipids induce expression of VCAM-1 in LSECs through a MAPK-dependent mechanism. Most importantly, using established diet-induced NASH mouse models, we demonstrate that pharmacological or genetic inhibition of VCAM-1 ameliorates liver injury, inflammation, and fibrosis, mainly by reducing monocyte infiltration into the liver.
Results
Genome-wide studies identified transcriptional upregulation of Vcam1 in murine NASH.
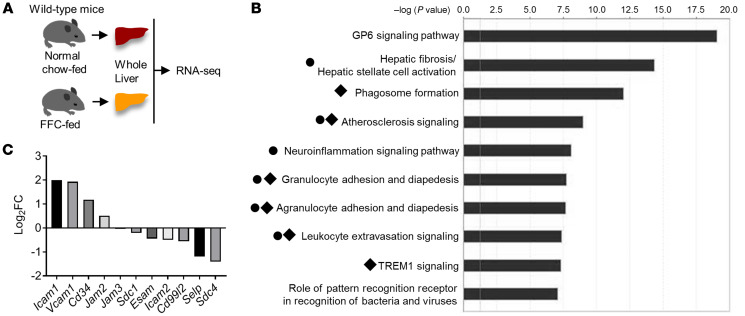
To gain a comprehensive insight into the pathophysiology of NASH, we performed unbiased transcriptomic analyses using RNA-Seq on whole livers; mice were fed either a diet rich in fat, fructose, and cholesterol (FFC) (16) or a normal chow diet (n = 3 per each group, Figure 1A). Out of 13,733 coding transcripts detected in the RNA-Seq, 986 genes were differentially upregulated in FFC mouse livers (genes that had a FDR < 0.05 and an absolute log2 fold change [FC] > 1.5 were considered to be significantly differentially expressed genes). We subjected these upregulated gene sets to Ingenuity Pathway Analysis (IPA) and found that, among the top 10 overrepresented canonical pathways, 6 pathways were profoundly involved in leukocyte adhesion and differentiation (Figure 1B), suggesting a strong pathophysiological impact of leukocyte adhesion to LSECs on the inflammatory response in NASH. We next aimed to identify the molecules implicated in leukocyte adhesion to LSECs in NASH. To this end, we examined “candidate genes” from published literature (17–19), which encode adhesion molecules expressed in endothelial cells and act as binding partners of leukocyte adhesion molecules, such as integrins (Supplemental Table 1; supplemental material available online with this article; https://doi.org/10.1172/JCI143690DS1). Among these candidate genes, only Icam1 (log2 FC, 1.99; FDR, 1.55 × 10–37) and Vcam1 (log2 FC, 1.93; FDR, 9.32 × 10⁻³⁵), which encode ICAM-1 and VCAM-1, respectively, were differentially upregulated in NASH liver (Figure 1C).
Figure 1. Whole-genome transcriptome studies identified transcriptional upregulation of Vcam1 in murine NASH.
(A) Schematic diagram of the transcriptomic study of whole livers of 3 chow- and 3 FFC-fed mice. (B) Top 10 ranked overrepresented canonical pathways. Black circles indicate pathways related to leukocyte adhesion. Black diamonds indicate pathways including Vcam1. (C) The x axis indicates candidate genes encoding LSEC adhesion molecules; the y axis indicates log2 FC of mRNA abundance in FFC- vs. chow-fed mice livers.
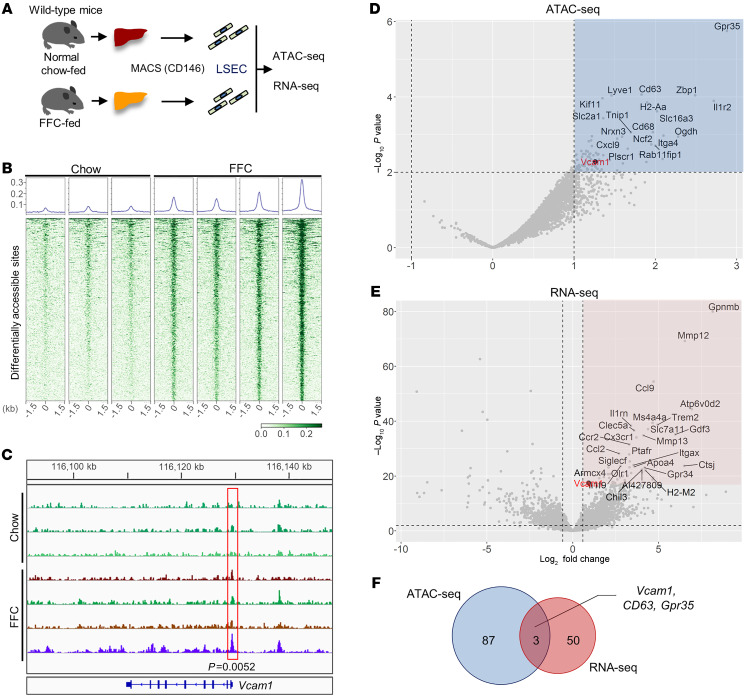
Based on these transcriptome data, we aimed to screen the genes that are epigenetically activated in LSECs during NASH development from the perspective of chromatin dynamics. To this end, we pursued assay for transposase-accessible chromatin by sequencing (ATAC-Seq) in combination with RNA-Seq performed in LSECs isolated from chow-fed mice and mice with FFC diet–induced NASH (Figure 2A). ATAC-Seq is a widely used approach for identifying open-chromatin regions (OCRs), which usually indicate active regulatory elements in the genome and coordinate transcription of neighboring genes. Of the top 500 differentially abundant OCRs out of the total detected in ATAC-Seq, 498 were more robust in FFC-fed mice compared with chow-fed mice, suggesting a genome-wide active epigenetic regulation in LSECs during NASH development (Figure 2B). Around 16% of these top OCRs were distributed to coding regions or regions close to the transcription start sites (TSSs), including promoter regions involved in transcriptional regulation of target genes (Supplemental Figure 1). Interestingly, one of these top OCRs was located in the promoter region of the Vcam1 gene (P = 0.0052) (Figure 2C). Next, we analyzed all the OCRs in whole-genome promoter regions. Out of 9367 OCRs, the top 90 of those differentially abundant in FFC-fed mice were extracted (Figure 2D and Supplemental Table 2). Likewise, out of 13,993 transcripts detected in RNA-Seq of LSECs from chow- and FFC-fed mice, the top 53 of those differentially expressed in FFC-fed mice were extracted (Figure 2E and Supplemental Table 3). Vcam1 expression was significantly upregulated in LSECs from FFC-fed mice compared with those from chow-fed mice (log2 FC, 0.925; P = 3.6 × 10⁻¹⁸). However, Icam1 upregulation (log2 FC, 0.416; P = 0.014) was not as striking as that of Vcam1. Hence, Icam1 was not among the top 63 differentially upregulated genes on the LSEC transcriptome (Supplemental Table 3). Furthermore, Vcam1 was 1 of 3 overlapping genes identified in both the ATAC-Seq and the RNA-Seq (Figure 2F). These findings indicate that in NASH liver, pathways related to leukocyte adhesion are profoundly activated and the adhesion molecule VCAM-1 is robustly transcriptionally upregulated, implicating VCAM-1 in NASH pathogenesis.
Figure 2. Genome-wide studies identified transcriptional upregulation of Vcam1 in LSECs in murine NASH.
(A) Schematic diagram of the transcriptome and open chromatin landscape study on LSECs. (B) Heatmaps of read densities within ± 1.5 kb of peak centers of the top 500 differential accessible regions (DARs) with the lowest FDR between chow-fed (n = 3) and FFC-fed (n = 4) mice. The graphs at the top represent the normalized read densities of the same 500 differential accessible regions. (C) Genome browser track of ATAC-Seq read signal intensities in the region close to Vcam1 locus. The red box indicates a genomic region with differential signal intensity between the conditions. (D) Volcano plot of genes associated with OCRs using LSECs of chow- vs. FFC-fed mice. Gray dots represent the nearest genes from detected OCRs located between –1 kb and +0.1 kb from the TSSs. The x and y axes represent log2 FC and –log10 converted P value (-log10p) of read coverage signals in FFC- versus chow-fed mice, respectively. Dots in the blue area represent genes that passed the threshold of log2 FC > 1 and –log10 P < 2. The black dot represents Vcam1. (E) Volcano plot of genes assessed by RNA-Seq of LSECs from chow- vs. FFC-fed mice. Dots in the pink area represent genes that passed the threshold of log2 FC > 0.9 and –log10 P < 17. (F) Venn diagram of the genes that passed the thresholds above extracted by ATAC-Seq and RNA-Seq using LSEC chow- vs. FFC-fed mice.
VCAM-1 is overexpressed in murine and human NASH.
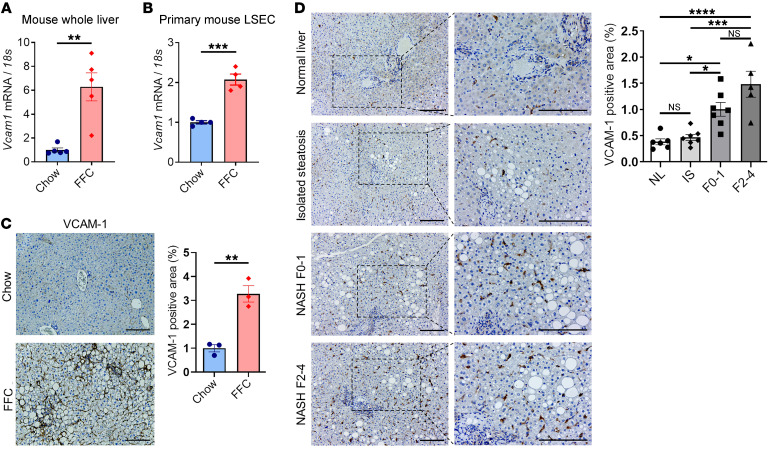
To confirm the data obtained by transcriptomic studies, we examined the mRNA expression levels of Vcam1. Real-time quantitative PCR (qPCR) demonstrated that Vcam1 was significantly upregulated in the whole liver as well as the isolated LSECs from FFC-fed mice compared with chow-fed mice (Figure 3, A and B). Likewise, immunohistochemistry confirmed increased VCAM-1 protein expression in liver sinusoidal endothelium of FFC-fed mice compared with chow-fed mice (Figure 3C). Furthermore, the clinical relevance of this finding was confirmed in histological sections from human livers, indicating that NASH patients (Supplemental Table 4) had a significant increase in hepatic VCAM-1 protein expression compared with those with normal liver or isolated hepatic steatosis when assessed by immunohistochemistry (Figure 3D). These findings indicate that in NASH liver, VCAM-1 is robustly upregulated.
Figure 3. VCAM-1 is upregulated in mouse and human NASH.
The mRNA expression levels of Vcam1 in (A) whole liver and (B) primary LSECs isolated from chow-fed mice and FFC-fed mice were evaluated by real-time qPCR. FC was determined after normalization to 18S rRNA expression and expressed as FC to that observed in chow-fed mice. (C) Representative images of VCAM-1 staining of liver sections from chow-fed mice and FFC-fed mice (left). VCAM-1 positive areas were quantified in 10 random ×10 microscopic fields and averaged for each animal (n = 3 per group) (right). Scale bars: 100 μm. (D) Representative images of VCAM-1 staining of liver tissue sections obtained from patients with normal liver (NL), isolated steatosis (IS), and NASH with fibrosis stages 0–1 (F0–1) or 2–4 (F2–4) (left). VCAM-1–positive areas were quantified in 5 random ×10 microscopic fields and averaged for each subject (n = 5–7 per group) (right). Scale bars: 100 μm. Graphs represent mean ± SEM. *P < 0.05; **P < 0.01; ***P < 0.001; ****P < 0.0001, unpaired t test and 1-way ANOVA with Bonferroni’s multiple comparison.
VCAM-1 is upregulated in LSECs under lipotoxic conditions via a MAPK pathway.
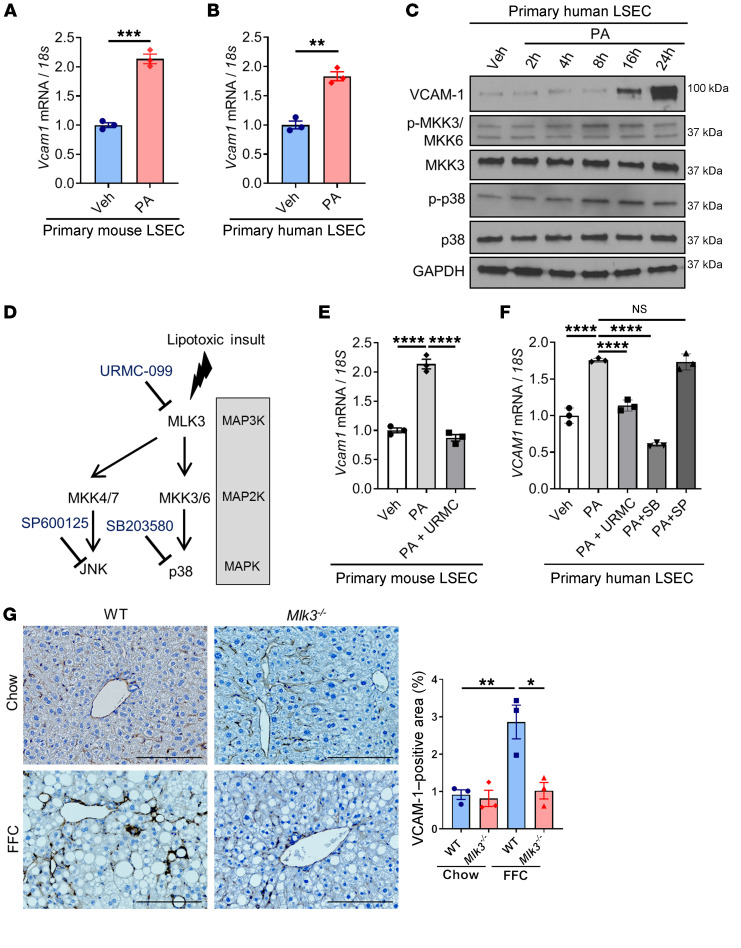
Lipotoxicity secondary to excess circulating saturated free fatty acids is a major driver of NASH pathogenesis. Prior studies have reported that palmitate (PA), one of the elevated saturated free fatty acids in the circulation of NASH patients, can induce Vcam1 upregulation in primary mouse LSECs (18, 20). Hence, we sought to examine the molecular mechanisms underlying VCAM-1 induction in LSECs under lipotoxic stress. First, we confirmed that PA treatment increased mRNA expression levels of Vcam-1 in primary mouse LSECs (Figure 4A). In addition, PA treatment–induced Vcam1 upregulation was reproduced in primary human LSECs at a concentration and duration that did not induce cell death (Figure 4B and Supplemental Figure 2A). Next, we demonstrated that the VCAM-1 protein level is upregulated with PA treatment in human LSECs as well (Figure 4C). Notably, PA treatment activated a MAPK signaling cascade, as assessed by phosphorylation of the MAP2K 3/6 (MMK3/6) and the MAPK p38 (Figure 4, C and D). Furthermore, pharmacological inhibition of the mitogen activated protein 3 kinase (MAP3K) mixed lineage kinase 3 (MLK3) by URMC-099 or p38 by SB203580 significantly attenuated PA-induced Vcam1 mRNA expression (Figure 4, E and F), while inhibition of another MAPK, JNK, did not alter Vcam1 expression in LSECs under lipotoxic conditions (Figure 4, E and F). Similar results were obtained using the mouse LSEC line transformed sinusoidal endothelial cells (TSECs) (Supplemental Figure 2, B and C). These findings suggest a major role of the MAPK signaling pathway in toxic lipid-induced VCAM-1 upregulation in LSECs. Furthermore, genetic deletion (21, 22) or pharmacological inhibition of MLK3 (23) in a diet-induced NASH mouse model markedly attenuated the protein expression of hepatic VCAM-1, as assessed by immunohistochemistry (Figure 4G and Supplemental Figure 2D). Collectively, these findings suggest that lipotoxic stress upregulates VCAM-1 expression in LSECs via an MLK3-dependent mechanism.
Figure 4. VCAM-1 is upregulated in LSECs under lipotoxic conditions via a MAPK pathway.
(A) Primary mouse LSECs were treated with vehicle (Veh) or 250 μM of PA for 16 hours. (B) Primary human LSECs were treated with vehicle or 500 μM of PA for 16 hours. The mRNA expression levels of Vcam1 were evaluated by real-time qPCR. FC was determined after normalization to 18S rRNA expression and expressed as FC to that observed in vehicle-treated cells. (C) Primary human LSECs were treated with 500 μM of PA. Protein levels of VCAM-1, phosphorylated and total MKK3/6, and p38 were assessed by Western blot. GAPDH was used as a loading control. (D) Schematic representation of the MAPK pathway and its inhibitors. (E) Primary mouse LSECs were treated with 250 μM of PA ± 2 μM of the MLK3 inhibitor URMC-099 (URMC) for 16 hours. (F) Primary human LSECs were treated with 500 μM of PA ± 2 μM of URMC or 10 μM of p38 inhibitor SB203580 (SB) or 20 μM of the JNK inhibitor SP600125 (SP) for 16 hours. The mRNA expression levels of Vcam1 were evaluated by real-time qPCR. (G) Eight-week-old WT C57BL/6J mice (WT) or mice with whole body Mlk3 knockout (Mlk3–/–) were fed either chow or FFC diet for 24 weeks to induce NASH. Representative images of VCAM-1 immunostaining of liver tissue sections are shown. Scale bars: 100 μm. VCAM-1–positive areas were quantified in 5 random ×10 microscopic fields and averaged for each animal (n = 3 per group). Graphs represent mean ± SEM. *P < 0.05, **P < 0.01, ***P < 0.001, ****P < 0.0001, unpaired t test and 1-way ANOVA with Bonferroni’s multiple comparison.
Anti-VCAM1Ab treatment in FFC-fed mice attenuates hepatic inflammation without altering the metabolic phenotype or hepatic steatosis.
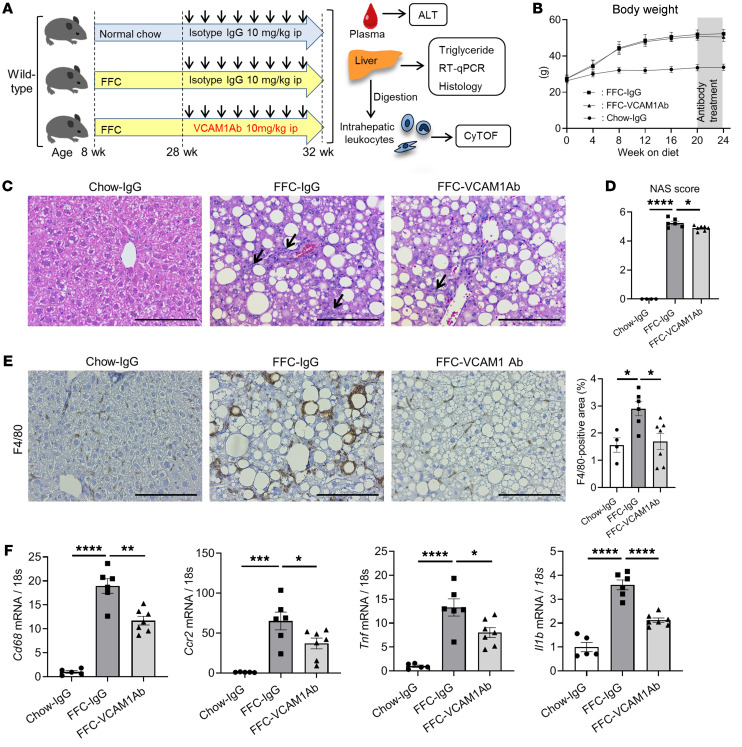
Based on our findings that VCAM-1 is upregulated under lipotoxic conditions both in vitro and in vivo, we examined the therapeutic effect of VCAM1Ab in our diet-induced NASH mouse model (Figure 5A). Body weight (Figure 5B), liver–to–body weight ratio (Supplemental Figure 3A), and daily caloric intake (Supplemental Figure 3B) were significantly increased with the FFC diet, but similar between VCAM1Ab-treated and control IgG–treated groups. Physical activity, respiratory quotient, and metabolic rate were also similar between the 2 treatment groups on the FFC diet (Supplemental Figure 3C). Moreover, the extent of hepatic steatosis, triglyceride content (Figure 5C and Supplemental Figure 3D), and insulin resistance as assessed by the homeostatic model assessment of insulin resistance (HOMA-IR) (Supplemental Figure 3E) and glucose tolerance test (Supplemental Figure 3F) were not different between VCAM1Ab-treated and control IgG–treated groups on the FFC diet. These data support the belief that VCAM1Ab treatment in FFC-fed mice was well tolerated and did not affect the metabolic phenotype or hepatic steatosis. Based on our recent in vitro finding showing that VCAM-1 on LSEC surfaces mediates monocyte adhesion to LSECs (9), a pivotal step in the sterile inflammatory response, we next examined the hepatic infiltration of MoMFs and the associated hepatic inflammation. VCAM1Ab-treated FFC-fed mice had fewer inflammatory infiltrates, resulting in significantly reduced NAFLD activity score (NAS) when compared with those of control IgG–treated mice on the same diet (Figure 5, C and D, and Supplemental Figure 3G). Moreover, immunostaining of liver tissues revealed that VCAM1Ab-treated mice had reduced positive areas for the macrophage marker F4/80 (Figure 5E) as well as galectin-3 (a mannose receptor expressed by macrophages; Supplemental Figure 3H). This finding was supported by decreased hepatic mRNA expression of the macrophage marker Cd68, the infiltrating proinflammatory monocyte marker Ccr2, and the proinflammatory cytokines Tnf (TNF-α), and Il1b in FFC-fed VCAM1Ab-treated mice (Figure 5F), suggesting that blockade of VCAM-1 reduces MoMF-mediated liver inflammation.
Figure 5. Anti-VCAM1Ab treatment in FFC-fed mice attenuates hepatic inflammation.
Eight-week-old WT C57BL/6J mice were fed either chow or FFC diet for 24 weeks to induce NASH and treated with either anti-VCAM1Ab or control IgG isotype Ab (IgG) twice a week for the last 4 weeks. (A) Schematic representation of the experimental model. (B) Body weight. (C) Representative images of H&E staining of liver tissues. Scale bars: 100 μm. Arrows indicate inflammatory cell infiltrate. (D) NAS. (E) Representative images of F4/80 staining of liver sections (left). Scale bars: 100 μm. F4/80-positive areas were quantified in 10 random ×10 microscopic fields and averaged for each animal (right). (F) Hepatic mRNA expression levels of Cd68, Ccr2, Tnf, and Il1b were assessed by real-time PCR. FC was determined after normalization to 18S rRNA and expressed relative to chow-IgG mice. (B–F) n = 5 to 7 per group; graphs represent mean ± SEM. *P < 0.05; **P < 0.01; ***P < 0.001; ****P < 0.0001, 1-way ANOVA with Bonferroni’s multiple comparison.
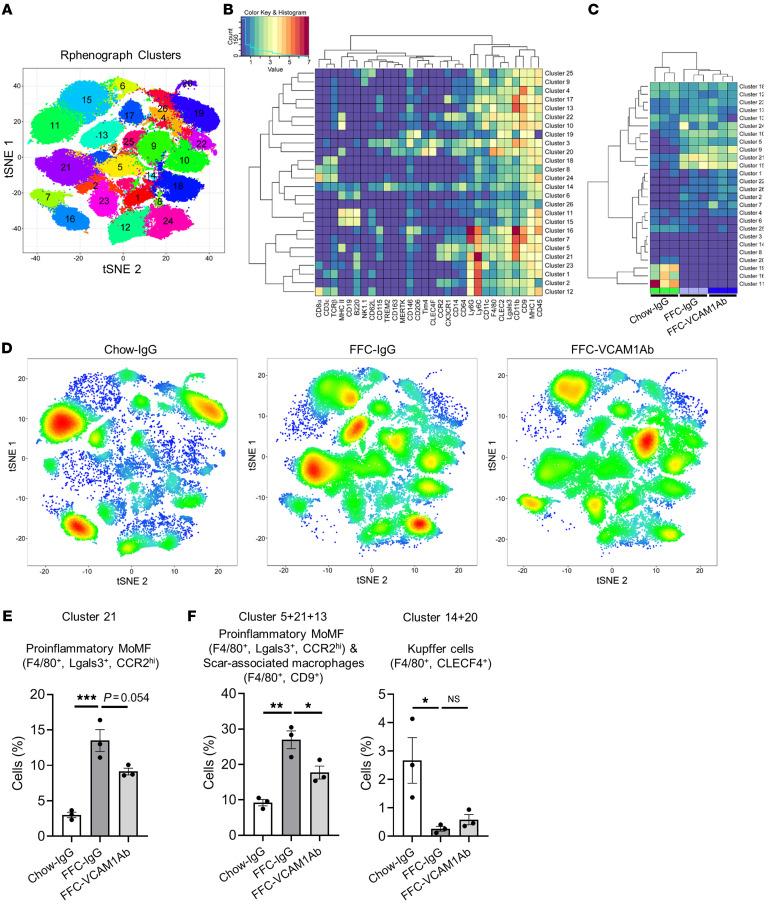
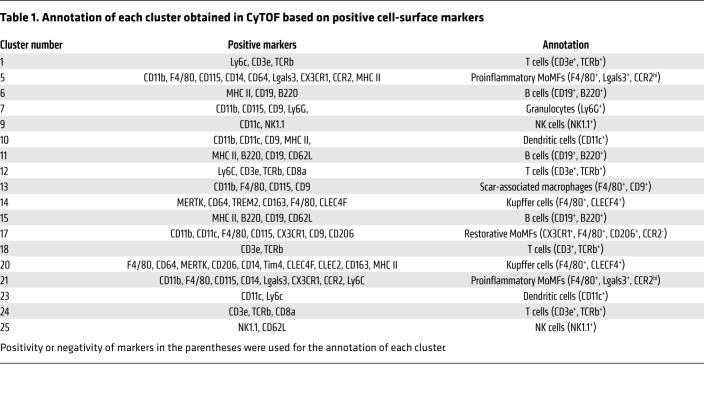
Liver macrophages are generally classified as resident macrophages (Kupffer cells) originating from the yolk sac or MoMFs originating from the bone marrow (24). While MoMFs play a crucial role in NASH pathogenesis and progression (25), various other immune cells, including neutrophils, dendritic cells, and lymphocytes, are also involved in NASH pathogenesis (26). To examine the contribution of the different immune cells to the protective effect of VCAM1Ab in NASH, we utilized mass cytometry by time of flight (CyTOF), which allows comprehensive profiling of the intrahepatic leukocyte (IHL) subpopulations based on multiple cell-surface markers. Twenty-six clusters were obtained (Figure 6A) based on the intensities of 30 different cell-surface markers (Supplemental Table 5 and Figure 6B) geared to identify the different subsets of IHLs. We annotated most of the 26 obtained clusters based on the expression patterns of individual cell-surface markers in each cluster (Supplemental Figure 4, A–D, and Table 1). The unclassified clusters (clusters 2, 3, 4, 8, 16, 19, 22) had either a combination of surface markers that would not allow annotation to a specific leukocyte subpopulation with confidence or high expression of the LSEC marker CD146 and/or were CD45 negative/low (t-distributed stochastic neighbor embedding [tSNE] plots in Supplemental Figure 4B); these populations were designated as unclassified based on the lack of markers available to further annotate these clusters. Strikingly, cluster 21 (F4/80+, CCR2+), a large cluster representing proinflammatory MoMFs, was increased with FFC feeding and reduced with VCAM1Ab treatment (Figure 6, C and D), which was further confirmed quantitatively by the cell percentage of cluster 21 in each experimental group in the total IHL population (Figure 6E). We also combined clusters within the macrophage subset with similar annotations or representation of biologically close populations, given the focus on these populations and the comprehensive surface markers employed to clearly show the profile shift between the different experimental conditions. Notably, we termed cluster 13 (F4/80+CD9+) as profibrogenic scar-associated macrophages, which are known to differentiate from circulating monocytes (27). Interestingly, cell fraction consisting of proinflammatory MoMFs and scar-associated macrophages (the combined clusters 5, 21, and 13) was significantly increased with FFC feeding and significantly reduced with VCAM1Ab treatment (Figure 6E and Supplemental Figure 5A). We did not include cluster 17 in the combination of proinflammatory/scar-associated macrophages, since we categorized it as restorative MoMF, given it was positive for CD206 and negative for CCR2 (Supplemental Figure 4C and Table 1). On the other hand, as shown in Figure 6F and Supplemental Figure 5B, F4/80+CLEC4F+ Kupffer cells (the combined clusters 14 and 20) were significantly reduced with the NASH-inducing diet as previously reported (28), and recovery with VCAM1Ab did not reach statistical significance. These findings suggest that blockade of VCAM-1 induces hepatic proinflammatory monocyte infiltration, which is consistent with whole-liver mRNA expression of proinflammatory genes (Figure 5F). For the comprehensive profiling of IHL, we next examined relative abundance of nonmacrophage subpopulations and confirmed that VCAM1Ab treatment in FFC-fed mice did not significantly alter the relative abundance of granulocytes (Supplemental Figure 5C), dendritic cells (Supplemental Figure 5D), T cells (Supplemental Figure 5E), B cells (Supplemental Figure 5F), or NK cells (Supplemental Figure 5G). Interestingly, mice fed the FFC diet when compared with mice fed the chow diet had increases in dendritic cell abundance (Supplemental Figure 5D). In addition, with the FFC feeding, there was a shift of the B cell (Supplemental Figure 5F) and the NK cell subpopulations (Supplemental Figure 5G), suggesting that these subsets might have different functions in inflammation in NASH. Further profiling of the B cells and the NK cells in FFC-fed mice is beyond the scope of the current study and a subject of future investigation, given the lack of change with VCAM1Ab treatment.
Figure 6. Anti-VCAM1Ab treatment in FFC-fed mice attenuates recruitment of proinflammatory monocytes to the liver.
CyTOF was performed on IHLs of control IgG–treated chow-fed mice and FFC-fed mice treated with either VCAM1Ab or control IgG. (A) Twenty-six unique clusters were defined by a 30 cell-surface marker panel (shown in Supplemental Table 5) using the Rphenograph clustering algorithm and were visualized on a tSNE plot. (B) Heatmap demonstrating the distribution and relative intensity of the cell-surface markers used in the clustering analysis. (C) Heatmap showing the relative abundance of each cluster for each mouse. (D) Representative tSNE plots of each experimental group. Red indicates high-frequency categorization of cells to a cluster; blue indicates low frequency. (E) Cell percentage of cluster 21 among total IHL population in mice from the different experimental groups. (F) Cell percentage of combined clusters consisting of proinflammatory MoMFs and scar-associated macrophages and those consisting of Kupffer cells. n = 3 per group. *P < 0.05; **P < 0.01; ***P < 0.001, 1-way ANOVA with Bonferroni’s multiple comparison.
Table 1. Annotation of each cluster obtained in CyTOF based on positive cell-surface markers.
Anti-VCAM1 Ab treatment reduces FFC diet–induced liver injury and fibrosis in murine NASH.
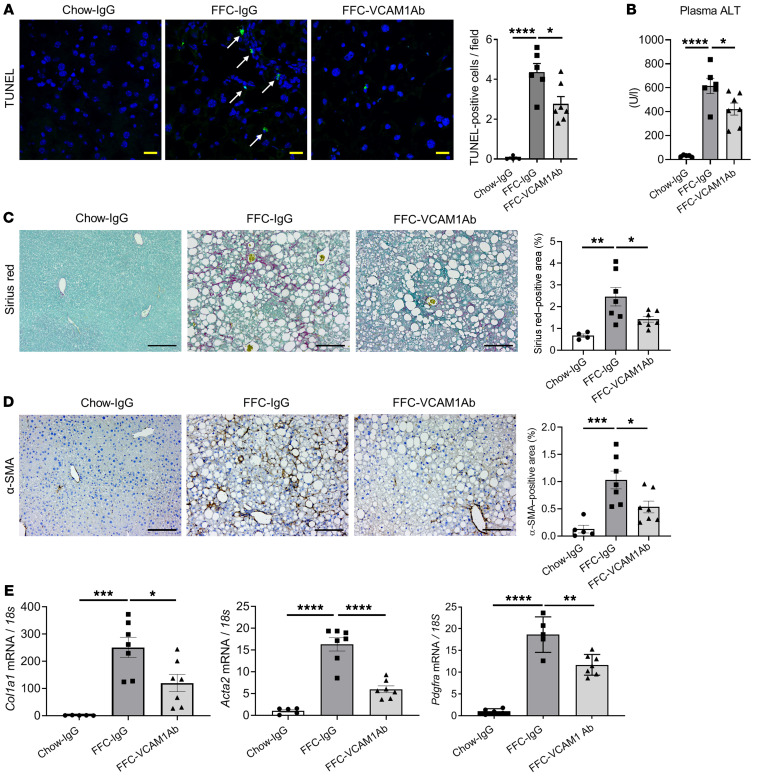
To determine a potential therapeutic effect of VCAM1Ab in our FFC model of NASH, we examined its impact on liver injury. FFC-fed, VCAM1Ab-treated mice displayed reduced TUNEL-positive cells in the liver (Figure 7A) as well as decreased plasma alanine aminotransferase (ALT) levels (Figure 7B) compared with control IgG–treated mice on the same diet, suggesting that VCAM1Ab treatment attenuates liver injury with reduced cell death in NASH. As liver fibrosis is a major cause of morbidity and mortality in patients with NASH and sequela of chronic inflammation, we next determined whether reduced hepatic inflammation through VCAM-1 blockade may protect against stellate cell activation and liver fibrosis in our diet-induced NASH mouse model. Sirius red staining (Figure 7C) as well as α-smooth muscle actin (α-SMA) immunohistochemistry (Figure 7D) displayed reduced pericellular fibrosis with VCAM1Ab treatment. Likewise, mRNA levels of Col1a1, Acta2 (α-SMA), and Pdgfra were elevated in the FFC-fed mice and significantly decreased with VCAM1Ab treatment (Figure 7E), further confirming the possible antifibrotic effect of VCAM1Ab in NASH, likely through reduced liver inflammation.
Figure 7. Anti–VCAM1Ab treatment reduces FFC diet–induced liver injury and fibrosis in murine NASH.
(A) Representative images of TUNEL staining of liver sections (left). Scale bars: 20 μm. Quantification of TUNEL-positive cells (right). Arrows indicate TUNEL-positive nuclei. (B) Plasma ALT levels. (C) Representative images of Sirius red staining; quantification of Sirius red–positive areas. Scale bars: 100 μm. (D) Representative images of α-SMA staining of liver sections; quantification of α-SMA–positive areas. Scale bars: 100 μm. (E) Hepatic mRNA expression of Col1a1, Acta2 (α-SMA), and Pdgfra. FC was determined after normalization to 18S expression and expressed relative to chow-IgG mice. n = 5 to 7 per group. Graphs represent mean ± SEM. *P < 0.05; **P < 0.01; ***P < 0.001; ****P < 0.0001, 1-way ANOVA with Bonferroni’s multiple comparison.
The VCAM1 pharmacological inhibitor AGI-1067 attenuates hepatic inflammation, injury, and fibrosis in FFC-fed mice.
AGI-1067, also called succinobucol, has broad antioxidative and antiinflammatory properties (29, 30) and is known to reduce VCAM-1 expression (31). AGI-1067 has been employed in clinical trials for atherosclerosis and type 2 diabetes (32, 33). Thus, we examined the effect of AGI-1067 in our NASH mouse model. First, we confirmed in vitro that AGI-1067 inhibits PA-induced LSEC VCAM-1 expression both at the mRNA and the protein levels (Supplemental Figure 6, A–D). We employed the antioxidant α-tocopherol as a control for the specific effect of AGI-1067 on suppressing VCAM-1 expression in LSECs under lipotoxic treatment and showed that AGI-1067 was more efficacious in reducing VCAM-1 protein expression compared with the antioxidant α-tocopherol (Supplemental Figure 6D). In our diet-induced NASH mouse model (Supplemental Figure 7A), AGI-1067 treatment did not alter weight gain, liver–to–body weight ratio, caloric intake, hepatic steatosis (Supplemental Figure 7, B–D), or liver triglyceride content (Supplemental Figure 7E) in the FFC fed-mice. Consistent with prior reports (33), AGI-1067 treatment reduced the HOMA-IR values (Supplemental Figure 7F) in the FFC fed-mice. Interestingly, the NAS was reduced in AGI-1067–treated FFC-fed mice, which was likely secondary to reduced liver inflammation (Supplemental Figure 7G). AGI-1067–treated FFC-fed mice had reduced liver injury, as indicated by a reduced number of TUNEL-positive hepatocytes (Supplemental Figure 8A). Although reduction in ALT did not reach statistical significance (Supplemental Figure 8B), AGI-1067–treated mice had reduced MoMF-related hepatic inflammation, as assessed by F4/80 staining of liver sections (Supplemental Figure 8C) and mRNA expression of Cd68, Il1b, and Tnf (TNF-α, Supplemental Figure 8D). Likewise, AGI-1067–treated FFC-fed mice had attenuated stellate cell activation and liver fibrosis, as assessed by Sirius red staining (Supplemental Figure 8E), immunohistochemistry for α-SMA (Supplemental Figure 8F), and mRNA expression of Col1a1 and Acta2 (α-SMA, Supplemental Figure 8G). Collectively, these findings are consistent with the observed protective effect of VCAM1Ab in the FFC diet–induced NASH mouse model.
Endothelial cell–specific loss of VCAM-1 ameliorates hepatic injury, inflammation, and fibrosis in murine NASH.
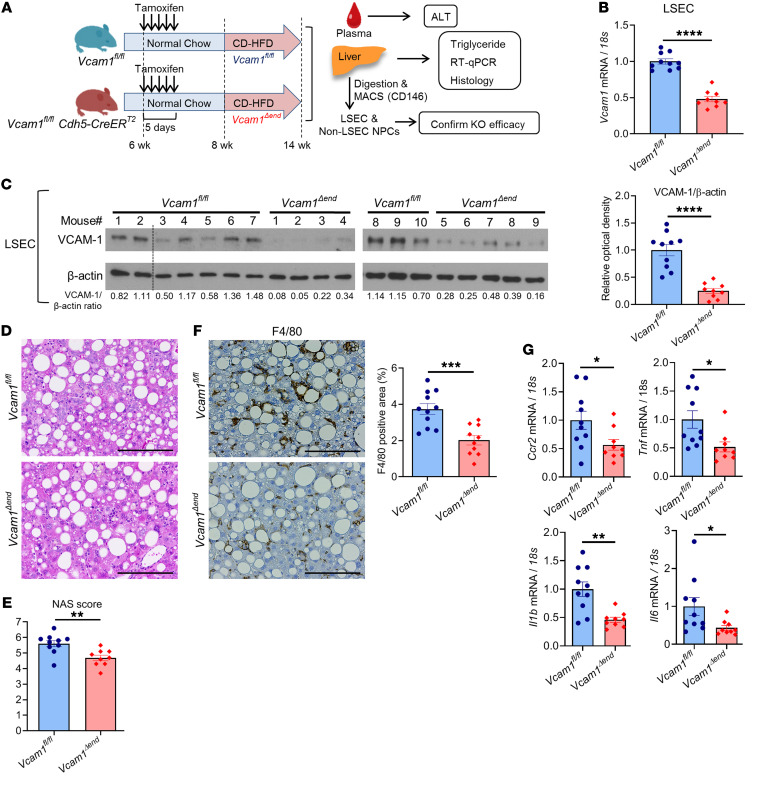
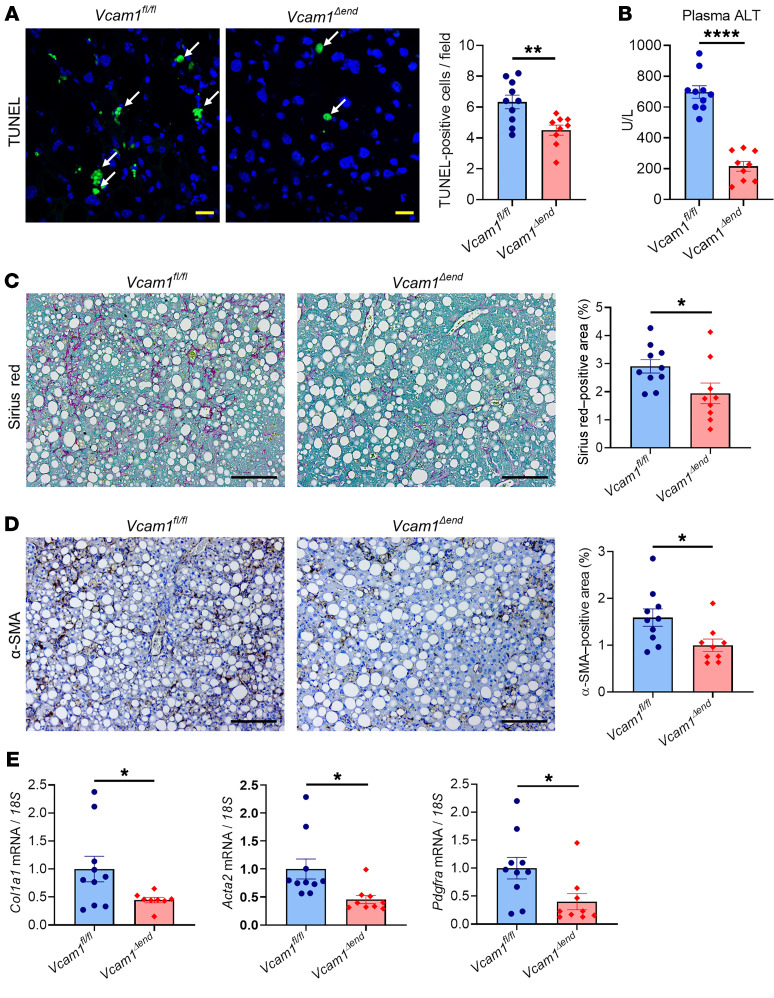
Given that VCAM-1 expression is not restricted to endothelial cells, but also observed on immune cells and cholangiocytes (19, 34), we sought to investigate the pathogenic role of LSEC-specific VCAM-1 in NASH using a Cre-loxP approach. Cells expressing vascular endothelial cadherin (VE-Cad) (an established endothelial marker in the postnatal period) in early embryogenesis can differentiate into nonendothelial cells such as hematopoietic cells, suggesting the possibility of lineage conversion during the developmental stage (35, 36). Hence, Vcam1fl/fl Cdh5(PAC)-CreERT2 mice were injected with tamoxifen and used as endothelial cell–specific Vcam1 knockout mice (Vcam1Δend), and littermate Vcam1fl/fl mice injected with tamoxifen were used as control mice. Since Cre recombinase activity may be reduced over time after tamoxifen administration (37), we fed Vcam1fl/fl or Vcam1Δend mice the choline-deficient high-fat diet (CD-HFD), which can induce most of the histological features observed in human NASH within a relatively short period when compared with the FFC diet (38). Prior to the study, we examined the histological and biochemical features of mice fed the CD-HFD starting at the age of 8 weeks for 4, 6, or 8 weeks, respectively, and confirmed that the CD-HFD–fed mice did not have significant weight loss for 8 weeks on the diet (Supplemental Figure 9A). Mice fed the CD-HFD for 6 weeks or 8 weeks developed similar elevation in ALT levels (Supplemental Figure 9B) and upregulation of hepatic Vcam1 expression (Supplemental Figure 9C) as well as similar hepatic steatosis (Supplemental Figure 9D), inflammation, and fibrosis (Supplemental Figure 9, E and F), as previously reported (38, 39). Based on these results and given our interest in exploring the pathogenic role of LSEC VCAM-1 in inflammation and fibrosis in NASH, we elected to use the 6-week feeding period of the CD-HFD in our study (Figure 8A). First, we confirmed that sufficient endothelial cell–specific knockout of Vcam1 in Vcam1Δend mice was sustained at the time of sacrifice both at the mRNA and protein levels (Figure 8, B and C, and Supplemental Figure 10A), without significant leakage to the non-LSEC nonparenchymal cells (Supplemental Figure 10B). Body weight during the study period, liver–to–body weight ratio, hepatic steatosis, and liver triglyceride content were similar between Vcam1fl/fl and Vcam1Δend mice (Supplemental Figure 10, C–F, and Figure 8D), indicating that loss of LSEC Vcam1 causes neither weight loss nor lipid metabolism alterations. The NAS was reduced in Vcam1Δend mice, which was likely secondary to reduced liver inflammation (Figure 8E and Supplemental Figure 10F). Notably, Vcam1Δend mice had reduced positive areas for F4/80 (Figure 8F) as well as decreased hepatic mRNA expressions of Ccr2, Tnf (TNF-α), Il1b, and Il6 (Figure 8G) compared with Vcam1fl/fl mice. These findings implicate LSEC VCAM-1 in MoMF-mediated hepatic inflammation in NASH. Likewise, CD-HFD–fed Vcam1Δend mice revealed fewer TUNEL-positive cells in the liver (Figure 9A) as well as reduced plasma ALT levels (Figure 9B), when compared with the Vcam1fl/fl mice on the same diet. Furthermore, CD-HFD–fed Vcam1Δend mice had attenuated stellate cell activation and liver fibrosis, as assessed by Sirius red staining (Figure 9C), immunohistochemistry for α-SMA (Figure 9D), and mRNA expression of Col1a1, Acta2 (α-SMA), and Pdgfra (Figure 9E). Collectively, these findings further support the pathogenic role of LSEC VCAM-1 in the progression of NASH.
Figure 8. Loss of endothelial Vcam-1 in CD-HFD–fed mice attenuates hepatic inflammation.
Six-week-old Vcam1fl/fl;Cdh5-CreERT2 mice were intraperitoneally injected with 4 mg of tamoxifen for 5 consecutive days and used as endothelial cell–specific Vcam1 knockout (Vcam1Δend) mice. Vcam1fl/fl mice injected with the same dose of tamoxifen were used as controls. Vcam1fl/fl and Vcam1Δend mice were fed the CD-HFD starting at the age of 8 weeks for 6 weeks to induce NASH. (A) Schematic representation of the experimental model. (B) The mRNA expression levels of Vcam1 in LSECs were evaluated by real-time qPCR. FC was determined after normalization to 18S rRNA and expressed relative to Vcam1fl/fl mice. (C) Western blot for VCAM-1 protein levels in LSECs from CD-HFD–fed Vcam1fl/fl and Vcam1Δend mice. β-Actin was used as a loading control (the dotted line indicates excluded mouse due to poor protein quality) (left). Quantification of VCAM-1 protein level relative to β-actin was assessed by densitometry (right). (D) Representative images of H&E staining of liver tissues. Scale bars: 100 μm. (E) NAS. (F) Representative images of F4/80 staining of liver sections (left). Scale bars: 100 μm. F4/80-positive areas were quantified in 10 random ×10 microscopic fields and averaged for each animal (right). (G) Hepatic mRNA expression levels of Ccr2, Tnf, Il1b, and Il6 were assessed by real-time PCR. FC was determined after normalization to 18S expression and expressed relative to Vcam1fl/fl mice. n = 9 to 10 per group. Graphs represent mean ± SEM. *P < 0.05, **P < 0.01; ***P < 0.001; ****P < 0.0001, unpaired t test.
Figure 9. Loss of endothelial Vcam-1 in CD-HFD–fed mice attenuates liver injury and fibrosis.
(A) Representative images of TUNEL staining of liver tissues (left). Arrows indicate TUNEL-positive nuclei. Scale bars: 20 μm. Quantification of TUNEL-positive cells (right). (B) Plasma ALT levels. (C) Representative images of Sirius red staining (left); quantification of Sirius red–positive areas (right). Scale bars: 100 μm. (D) Representative images of α-SMA staining of liver sections (left); quantification of α-SMA–positive areas (right). Scale bars: 100 μm. (E) Hepatic mRNA expression of Col1a1 and Acta2 (α-SMA) and Pdgfra. FC was determined after normalization to 18S expression and expressed relative to Vcam1fl/fl mice. n = 9 to 10 per group. Graphs represent mean ± SEM. *P < 0.05; **P < 0.01; ****P < 0.0001, unpaired t test.
Discussion
The current study provides insights regarding the role of VCAM-1 in the pathogenesis of NASH. Our data indicate that (a) LSEC Vcam1 is abundantly expressed in mouse and human NASH liver; (b) saturated free fatty acid upregulates the expression of VCAM-1 in LSECs through a MAPK-dependent mechanism; and (c) pharmacological inhibition of VCAM-1 or genetic deletion of endothelial cell VCAM-1 ameliorates liver inflammation, injury, and fibrosis, mainly by reducing proinflammatory monocyte infiltration into the liver in murine NASH. We have previously shown using a shear stress adhesion assay that blocking VCAM-1 on the LSEC surface reduces the adhesion of monocytes treated with EVs. These EVs were isolated from the conditioned media of toxic lipid-treated hepatocytes. We reported that these EVs are taken up by monocytes and enhance monocyte adhesion to LSECs in an ITGα9β1–VCAM-1–dependent manner (9). In the current study, we build on our prior observation and examine the mechanism of LSEC VCAM-1 upregulation in lipotoxicity and the role of VCAM-1 as a therapeutic target in NASH. To our knowledge, our report is the first study that examines the therapeutic effect of VCAM-1 inhibition in diet-induced NASH. Our findings are discussed in greater detail below.
LSECs are known for their antiinflammatory role in physiological conditions and early stages of NAFLD (40). However, during unrelenting inflammation, LSECs acquire a proinflammatory phenotype and function, contributing to NASH progression (6). A key role of LSECs in NASH pathophysiology is to mediate adhesion of circulating leukocytes, mainly monocytes (6). Leukocyte recruitment from the circulation is a tightly regulated multistep process mediated by specific interactions between adhesion molecules associated with the leukocytes and their counterpart on the endothelial cell surface. Using an unbiased transcriptome-based approach and further confirmation with traditional methods, we observed that leukocyte adhesion plays a central role in NASH pathogenesis. We identified transcriptional upregulation of LSEC VCAM-1 in NASH. We further confirmed the human relevance of this finding by demonstrating enhanced VCAM-1 expression on liver histological sections of patients with NASH when compared with patients with normal liver or isolated steatosis. These findings are in line with prior reports correlating the serum levels of soluble VCAM-1 with the extent of liver fibrosis in NASH patients, supporting the role of VCAM-1 as a potential biomarker for advanced NASH (15, 41).
Transcriptional regulation of VCAM-1 has been examined in extrahepatic endothelial cells (42, 43). These studies reported that cytokines such as TNF-α and IL-1β, LPS, and ROS induce VCAM-1 expression via several transcription factors, including NF-κB, interferon regulatory factor-1 (IRF-1), and activating protein-1 (AP-1). Intracellular signaling in LSECs in the context of NASH is logically affected by their location at the interface between blood derived from the visceral adipose tissue and the gut on one side and excessive fat-laden hepatocytes on the other side. In our current in vitro study, we confirmed the previously reported findings that PA treatment induced Vcam-1 mRNA expression in LSECs (18). Notably, our findings are the first, to our knowledge, to demonstrate that in LSECs, lipid-induced VCAM-1 expression is dependent on the MAPK signaling pathway, especially the activation of MLK3 and p38. We have previously reported that genetic deletion or pharmacological inhibition of MLK3 attenuated diet-induced murine NASH (22, 23). With regard to the mechanistic roles of MLK3 in NASH pathology, we have been focusing on hepatocyte MLK3, which we showed to mediate the induction of the chemokine CXCL10 in lipotoxic hepatocytes (21, 44). Our current data support the involvement of LSEC MLK3 in the inflammatory process in NASH through mediating toxic lipid–induced Vcam-1 expression.
VCAM-1 on endothelial cell surface mediates cell adhesion through binding interactions with adhesion molecules on target cells, such as ITGα9β1 or α4β7. We have recently reported that lipotoxic hepatocyte-derived EVs enriched with ITGα9β1 enhance monocyte adhesion to LSECs in vitro, and this enhanced adhesion was reduced with LSEC VCAM-1 blockade, supporting an essential role of VCAM-1 in monocyte adhesion to LSECs (9). Based on these initial observations, in the current study, we examined the functional roles of VCAM-1 in NASH pathophysiology in vivo. We employed a well-validated NASH mouse model that consists of high FFC diet for 24 weeks and is known to recapitulate the human metabolic syndrome and NASH pathophysiology. This model is known to induce a significant elevation of the transaminase (up to 1000 U/ml), likely secondary to the long duration of 24 weeks and the high FFC content (9, 45). Using this diet-induced murine NASH model, we demonstrated that VCAM1Ab-treated mice on the FFC diet had a relative attenuation of all the injurious features of NASH when compared with the IgG-treated mice. Furthermore, our CyTOF data revealed that the proinflammatory MoMF populations were selectively increased in FFC diet–fed mice and that these were reduced with VCAM1Ab treatment, suggesting that the therapeutic benefit of VCAM-1 blockade in NASH operates mainly through reduced proinflammatory monocyte infiltration into the liver.
AGI-1067 (succinobucol), a known VCAM-1 inhibitor, has been employed in clinical trials for atherosclerosis and type 2 diabetes (32, 46) without clear consistent data in relation to cardiovascular benefits. It is noteworthy that in these clinical trials, patients with moderate to severe liver dysfunction were excluded from the studies, suggesting that the efficacy of this drug in patients with NASH has never been evaluated in a clinical setting. In our experimental study in mice with advanced stages of NASH, we employed AGI-1067 at a significantly lower dose than what has been used in the mouse model of atherosclerosis (31). AGI-1067 was well tolerated and significantly attenuated liver injury, inflammation, and fibrosis. Since AGI-1067 is also known as an antioxidative and antiinflammatory agent (29, 30), mechanisms other than VCAM-1 inhibition might have contributed to the beneficial effect observed. Improvement of insulin sensitivity as indicated by HOMA-IR reduction in AGI-1067–treated mice might be due to an extrahepatic effect or multifunctional property of this drug. Nonetheless, the data from our experimental mouse study using AGI-1067 were consistent with the data obtained with the VCAM1Ab treatment, paving the way for a novel therapeutic strategy for NASH.
Finally, we showed that the beneficial effects observed in VCAM1Ab–treated NASH mice were reproduced in endothelial cell–specific Vcam1 knockout mice using another established mouse model of diet-induced NASH. These findings are striking given that VCAM-1 is expressed not only on endothelial cells, but also on professional immune cells (leukocytes) and on cholangiocytes (19, 34). Moreover, these findings demonstrate that LSEC VCAM-1 contributes to MoMF-related hepatic inflammation in NASH, which is associated with significant liver fibrosis. In this study, we employed Cdh5(PAC)-CreERT2 mice, since there are no established LSEC-specific gene deletion models that do not have any effects on other endothelial cells (47). Hence, Vcam1 deletion in endothelial cells other than LSECs is a relative limitation of this study. In addition, we cannot exclude a direct effect on stellate cells, since LSEC capillarization is a known phenomenon in NASH, and prior studies have linked LSEC capillarization to the development of perisinusoidal fibrosis (8, 48, 49). Whether LSEC VCAM-1-blockade or genetic deletion directly reverses LSEC capillarization and perisinusoidal fibrosis is a matter for our future investigation.
Collectively, our study implicates LSEC VCAM-1 in the pathophysiology of advanced stages of NASH fibrosis and provides preclinical data to support targeting VCAM-1 as an antiinflammatory and antifibrotic therapeutic approach in human NASH.
Methods
RNA-Seq and bioinformatics analysis.
RNA-Seq was performed on whole liver and isolated LSECs from both chow- and FFC diet–fed mice at the Mayo Clinic Genotyping Shared Resource facility. Three mice per group were included in the study. RNA libraries were prepared using 200 ng of total RNA according to the manufacturer’s instructions for the TruSeq RNA Sample Prep Kit, version 2 (Illumina). The concentration and size distribution of the completed libraries was determined using an Agilent Bioanalyzer DNA 1000 chip and Qubit Fluorometry (Invitrogen). Libraries were sequenced at 53 million to 90 million reads per sample following Illumina’s standard protocol using the Illumina cBot and HiSeq 3000/4000 PE Cluster Kit. The flow cells were sequenced as 100 × 2 paired end reads on an Illumina HiSeq 4000 using the HiSeq 3000/4000 Sequencing Kit and HCS, version 3.3.20, collection software. Base calling was performed using Illumina’s RTA, version 2.5.2. Genes with log2 FC more than 1.5 and P values of less than 0.05 were considered differentially expressed. IPA software was used to analyze the data. RNA-Seq data on mouse whole liver and isolated LSECs were deposited in the NCBI’s Gene Expression Omnibus database (GEO GSE164084 and GSE164006, respectively).
Assay for ATAC-Seq and bioinformatics analysis.
Mouse LSECs from both chow- and FFC-fed animals were subjected to ATAC-Seq assay. About 50,000 cells were preserved in 100 μl antifreezing buffer (10% DMSO, 10% FCS in RPMI-1640) and subjected to Omni-ATAC following the published protocol (50). The size of library DNA was determined from amplified and purified libraries by Fragment Analyzer (Advanced Analytical Technologies [AATI]), and the enrichment of accessible region was determined by the fold difference between positive and negative genomic loci using real-time PCR. The following primers were used: AT-MDusp6, forward: GGCTTATCCGGAGCGGAAAT; AT-MDusp6, reverse: GGCTGGAACAGGTTGTGTTG; AT-MVmn2r17, forward: TCCCCTTTACTGTTTTCCTCTAC; AT-MVmn2r17, reverse: GGATTGATGAGGAAACAGCCTC. The libraries were sequenced to 51 base pairs from both ends on an Illumina HiSeq 4000 instrument (Illumina) in the Mayo Clinic Center for Individualized Medicine Medical Genomics Facility. ATAC-Seq data were analyzed using the HiChIP pipeline (51). Briefly, paired end reads were mapped to the mm10 genome reference using the Burrows-Wheeler Alignment tool (BWA), version 0.5.9 (52). Pairs of reads with at least one uniquely mapped read were retained. The compressed binary version of the Sequencing Alignment/Maps (BAMs) were position sorted using the Picard SortSam command, and duplicates were removed using the Picard MarkDuplicates command (http://broadinstitute.github.io/picard/; version 1.67). Peaks were identified using the model-based analysis of ChIP-Seq (MACS) package, version 2.0.10, at the cutoff of FDR of 0.01 or less (53). Peaks were assigned to the nearest genes using the Homer package, version 4.8 (http://homer.ucsd.edu/homer/). Differential analysis was performed using the DiffBind package (54). Differential accessible regions were extracted at the cutoff of FC of 2 or more and FDR of 0.05 or less. Heatmap and average signal plot over peak centers were generated using the ngs.plot package, version 2.63. Volcano plots were generated using RStudio. ATAC-Seq data were deposited in the NCBI’s GEO database (GSE164008). All the sequencing data used in this study are available in the GEO database (GSE164085).
Human liver samples.
Deidentified archived liver specimens obtained by liver biopsy or surgical hepatic resection from patients with normal liver, isolated steatosis, or NASH were acquired. Histological diagnosis was based on established NASH criteria, as assessed by an experienced pathologist. Subjects with other chronic liver diseases (cholestatic liver disease, hemochromatosis, excessive alcohol consumption, viral hepatitis, Wilson disease, drug-induced liver disease, and α-1- antitrypsin deficiency) were excluded.
CyTOF analysis.
Intrahepatic mouse leukocytes were isolated using the Liver Dissociation Kit (130-105-807, Miltenyi Biotec) and Percoll gradient centrifugation as previously described (9). Cells were suspended in Maxpar Cell Staining Buffer (CSB) (Fluidigm) and labeled with 0.5 μM cisplatin (Fluidigm) solution. After centrifugation at 500 g for 5 minutes, cells were resuspended in CSB prior to addition of the Ab cocktail (composition shown in Supplemental Table 5) in an equal volume of CSB. Cells were incubated with gentle agitation at room temperature for 45 minutes. Following wash, cells were fixed overnight with 2% paraformaldehyde with gentle agitation at 4°C. DNA intercalation was performed by adding 1:10000 diluted 125 μM of Cell-ID Intercalator-Ir (Fluidigm) with gentle agitation in 4°C for 30 minutes. Cells were resuspended in 1:10 dilution of EQ beads (EQ Four Element Calibration Beads, Fluidigm) and then loaded onto Helios sample loader for data acquisition. Mass cytometry was performed in the Immune Monitoring Core at Mayo Clinic and employed Abs conjugated to stable heavy-metal isotopes to detect cellular antigens by CyTOF and enable comprehensive profiling of the phenotype and function of the IHLs (9, 55, 56). After data acquisition, fcs files were normalized using CyTOF software (version 6.7.1014). Cleanup of cell debris and removal of doublets and dead cells was performed using FlowJo software, version 10.5.3. Cleaned fcs files were analyzed by the R-based tool Cytofkit, version 3.8 (57). Clustering and dimensionality reduction to 15,000 events per file was performed using the Rphenograph algorithm that included all 30 markers in the panel (Supplemental Table 5). Visualization of clusters was mapped onto a tSNE plot.
Generation of endothelial cell–specific Vcam1 knockout mice.
Vcam1fl/fl mice on the C57BL/6J background (Jackson Laboratory, catalog 007665) were crossed with a line expressing tamoxifen-inducible Cre recombinase (CreERT2) under the regulation of the VE-Cad promoter (Cdh5[PAC]-CreERT2) (Taconic Laboratories) (58, 59), and the offspring Vcam1fl/fl Cdh5(PAC)-CreERT2 mice were obtained. At 6 weeks of age, Vcam1fl/fl Cdh5(PAC)-CreERT2 mice were injected intraperitoneally with 4 mg of tamoxifen for 5 consecutive days and used as endothelial cell–specific Vcam1 knockout mice (referred to as Vcam1Δend). Littermates that did not have the Cdh5(PAC)-CreERT2 transgene (referred to as Vcam1fl/fl) received the same tamoxifen dose and served as Vcam1-positive control mice.
Statistics.
Data are expressed as the mean ± SEM. Differences between multiple groups were compared using 1-way ANOVA followed by Bonferroni’s multiple comparisons test or two-tailed Student’s t test when comparing 2 groups. All analyses were performed using GraphPad Prism 8 software.
Study approval.
All animal experiments were performed in accordance with protocols approved by the Mayo Clinic IACUC. Clinical information was assimilated from patient records from the Mayo Clinic. Written informed consent was obtained for each patient on an ongoing research protocol approved by the Mayo Clinic Institutional Review Board (approval number 14-005891).
Full details of the materials and methods are included in the Supplemental Methods. Sequences of the PCR primers used in this study are shown in Supplemental Table 6.
Author contributions
KF designed research studies, conducted experiments, acquired data, analyzed data, and drafted the manuscript. QG designed research studies, conducted experiments, acquired data, analyzed data, and drafted the manuscript. JHL acquired data and analyzed data. KDR revised the manuscript. YN analyzed data. JM conducted experiments and acquired data. VHS provided material and revised the manuscript. KDP acquired data, analyzed data, and revised the manuscript. PH conducted experiments, acquired data, analyzed data, and revised the manuscript. SHI formulated the concept, designed research studies, analyzed data, and drafted and revised the manuscript.
Supplementary Material
Acknowledgments
Research reported in this publication was supported by the National Institute of Diabetes And Digestive And Kidney Diseases of the NIH (DK122948 to SHI), the American Association of Study of Liver Disease (AASLD) Foundation Bridge Award (to SHI), and the NIH Silvio O. Conte Digestive Diseases Research Core Centers P30 grant mechanism (DK084567). Support was also provided to PH by the AASLD Pinnacle Research Award and the Pilot and Feasibility Award from the Mayo Clinic Center for Cell Signaling in Gastroenterology (NIDDK P30DK084567) and to KF by the Japan Society for the Promotion of Science (JSPS) Overseas Research Fellowships. We thank Gregory J. Gores for his thorough review of the manuscript. We also thank Nathan K. LeBrasseur and his laboratory members, especially Thomas White, for their assistance with the Comprehensive Laboratory Animal Monitoring System data.
Version 1. 01/21/2021
In-Press Preview
Version 2. 03/15/2021
Print issue publication
Footnotes
Conflict of interest: The authors have declared that no conflict of interest exists.
Copyright: © 2021, American Society for Clinical Investigation.
Reference information: J Clin Invest. 2021;131(6):e143690.https://doi.org/10.1172/JCI143690.
See the related Commentary at VCAM-1: closing the gap between lipotoxicity and endothelial dysfunction in nonalcoholic steatohepatitis.
Contributor Information
Kunimaro Furuta, Email: furuta.kunimaro@mayo.edu.
Qianqian Guo, Email: guo.qianqian@mayo.edu.
Kevin D. Pavelko, Email: Pavelko.Kevin@mayo.edu.
Jeong-Heon Lee, Email: Lee.JeongHeon@mayo.edu.
Keith D. Robertson, Email: Robertson.Keith@mayo.edu.
Yasuhiko Nakao, Email: Nakao.Yasuhiko@mayo.edu.
Jan Melek, Email: jan.melek1@gmail.com.
Vijay H. Shah, Email: shah.vijay@mayo.edu.
Petra Hirsova, Email: hirsova.petra@mayo.edu.
Samar H. Ibrahim, Email: ibrahim.samar@mayo.edu.
References
- 1.Fazel Y, et al. Epidemiology and natural history of non-alcoholic fatty liver disease. Metabolism. 2016;65(8):1017–1025. doi: 10.1016/j.metabol.2016.01.012. [DOI] [PubMed] [Google Scholar]
- 2.Younossi Z, et al. Global burden of NAFLD and NASH: trends, predictions, risk factors and prevention. Nat Rev Gastroenterol Hepatol. 2018;15(1):11–20. doi: 10.1038/nrgastro.2017.109. [DOI] [PubMed] [Google Scholar]
- 3.Friedman SL, et al. Mechanisms of NAFLD development and therapeutic strategies. Nat Med. 2018;24(7):908–922. doi: 10.1038/s41591-018-0104-9. [DOI] [PMC free article] [PubMed] [Google Scholar]
- 4.Ibrahim SH, et al. Non-alcoholic steatohepatitis pathogenesis: sublethal hepatocyte injury as a driver of liver inflammation. Gut. 2018;67(5):963–972. doi: 10.1136/gutjnl-2017-315691. [DOI] [PMC free article] [PubMed] [Google Scholar]
- 5.Ritz T, et al. Dynamic plasticity of macrophage functions in diseased liver. Cell Immunol. 2018;330:175–182. doi: 10.1016/j.cellimm.2017.12.007. [DOI] [PubMed] [Google Scholar]
- 6.Hammoutene A, Rautou PE. Role of liver sinusoidal endothelial cells in non-alcoholic fatty liver disease. J Hepatol. 2019;70(6):1278–1291. doi: 10.1016/j.jhep.2019.02.012. [DOI] [PubMed] [Google Scholar]
- 7.Miyao M, et al. Pivotal role of liver sinusoidal endothelial cells in NAFLD/NASH progression. Lab Invest. 2015;95(10):1130–1144. doi: 10.1038/labinvest.2015.95. [DOI] [PubMed] [Google Scholar]
- 8.Hammoutene A, et al. A defect in endothelial autophagy occurs in patients with non-alcoholic steatohepatitis and promotes inflammation and fibrosis. J Hepatol. 2020;72(3):528–538. doi: 10.1016/j.jhep.2019.10.028. [DOI] [PubMed] [Google Scholar]
- 9.Guo Q, et al. Integrin β1-enriched extracellular vesicles mediate monocyte adhesion and promote liver inflammation in murine NASH. J Hepatol. 2019;71(6):1193–1205. doi: 10.1016/j.jhep.2019.07.019. [DOI] [PMC free article] [PubMed] [Google Scholar]
- 10.Taooka Y, et al. The integrin α9β1 mediates adhesion to activated endothelial cells and transendothelial neutrophil migration through interaction with vascular cell adhesion molecule-1. J Cell Biol. 1999;145(2):413–420. doi: 10.1083/jcb.145.2.413. [DOI] [PMC free article] [PubMed] [Google Scholar]
- 11.Carter RA, et al. Vascular cell adhesion molecule-1 (VCAM-1) blockade in collagen-induced arthritis reduces joint involvement and alters B cell trafficking. Clin Exp Immunol. 2002;128(1):44–51. doi: 10.1046/j.1365-2249.2002.01794.x. [DOI] [PMC free article] [PubMed] [Google Scholar]
- 12.Park JG, et al. Evaluation of VCAM-1 antibodies as therapeutic agent for atherosclerosis in apolipoprotein E-deficient mice. Atherosclerosis. 2013;226(2):356–363. doi: 10.1016/j.atherosclerosis.2012.11.029. [DOI] [PubMed] [Google Scholar]
- 13.Mahmoudi M, et al. New insights to the mechanisms underlying atherosclerosis in rheumatoid arthritis. Int J Rheum Dis. 2017;20(3):287–297. doi: 10.1111/1756-185X.12999. [DOI] [PubMed] [Google Scholar]
- 14.Totoson P, et al. Mechanisms of endothelial dysfunction in rheumatoid arthritis: lessons from animal studies. Arthritis Res Ther. 2014;16(1):202. doi: 10.1186/ar4450. [DOI] [PMC free article] [PubMed] [Google Scholar]
- 15.Lefere S, et al. Serum vascular cell adhesion molecule-1 predicts significant liver fibrosis in non-alcoholic fatty liver disease. Int J Obes (Lond) 2017;41(8):1207–1213. doi: 10.1038/ijo.2017.102. [DOI] [PubMed] [Google Scholar]
- 16.Charlton M, et al. Fast food diet mouse: novel small animal model of NASH with ballooning, progressive fibrosis, and high physiological fidelity to the human condition. Am J Physiol Gastrointest Liver Physiol. 2011;301(5):G825–G834. doi: 10.1152/ajpgi.00145.2011. [DOI] [PMC free article] [PubMed] [Google Scholar]
- 17.Ley K, et al. Getting to the site of inflammation: the leukocyte adhesion cascade updated. Nat Rev Immunol. 2007;7(9):678–689. doi: 10.1038/nri2156. [DOI] [PubMed] [Google Scholar]
- 18.Miyachi Y, et al. Roles for cell-cell adhesion and contact in obesity-induced hepatic myeloid cell accumulation and glucose intolerance. Cell Rep. 2017;18(11):2766–2779. doi: 10.1016/j.celrep.2017.02.039. [DOI] [PubMed] [Google Scholar]
- 19.Hintermann E, Christen U. The many roles of cell adhesion molecules in hepatic fibrosis. Cells. 2019;8(12):1503. doi: 10.3390/cells8121503. [DOI] [PMC free article] [PubMed] [Google Scholar]
- 20.de Almeida IT, et al. Plasma total and free fatty acids composition in human non-alcoholic steatohepatitis. Clin Nutr. 2002;21(3):219–223. doi: 10.1054/clnu.2001.0529. [DOI] [PubMed] [Google Scholar]
- 21.Ibrahim SH, et al. Mixed lineage kinase 3 mediates release of C-X-C motif ligand 10-bearing chemotactic extracellular vesicles from lipotoxic hepatocytes. Hepatology. 2016;63(3):731–744. doi: 10.1002/hep.28252. [DOI] [PMC free article] [PubMed] [Google Scholar]
- 22.Ibrahim SH, et al. Mixed lineage kinase 3 deficient mice are protected against the high fat high carbohydrate diet-induced steatohepatitis. Liver Int. 2014;34(3):427–437. doi: 10.1111/liv.12353. [DOI] [PMC free article] [PubMed] [Google Scholar]
- 23.Tomita K, et al. Mixed-lineage kinase 3 pharmacological inhibition attenuates murine nonalcoholic steatohepatitis. JCI Insight. 2017;2(15):94488. doi: 10.1172/jci.insight.94488. [DOI] [PMC free article] [PubMed] [Google Scholar]
- 24.Dey A, et al. Ontogeny and polarization of macrophages in inflammation: blood monocytes versus tissue macrophages. Front Immunol. 2014;5:683. doi: 10.3389/fimmu.2014.00683. [DOI] [PMC free article] [PubMed] [Google Scholar]
- 25.Kazankov K, et al. The role of macrophages in nonalcoholic fatty liver disease and nonalcoholic steatohepatitis. Nat Rev Gastroenterol Hepatol. 2019;16(3):145–159. doi: 10.1038/s41575-018-0082-x. [DOI] [PubMed] [Google Scholar]
- 26.Li Z, et al. Dietary factors alter hepatic innate immune system in mice with nonalcoholic fatty liver disease. Hepatology. 2005;42(4):880–885. doi: 10.1002/hep.20826. [DOI] [PubMed] [Google Scholar]
- 27.Ramachandran P, et al. Resolving the fibrotic niche of human liver cirrhosis at single-cell level. Nature. 2019;575(7783):512–518. doi: 10.1038/s41586-019-1631-3. [DOI] [PMC free article] [PubMed] [Google Scholar]
- 28.Seidman JS, et al. Niche-specific reprogramming of epigenetic landscapes drives myeloid cell diversity in nonalcoholic steatohepatitis. Immunity. 2020;52(6):1057–1074. doi: 10.1016/j.immuni.2020.04.001. [DOI] [PMC free article] [PubMed] [Google Scholar]
- 29.Kunsch C, et al. Selective inhibition of endothelial and monocyte redox-sensitive genes by AGI-1067: a novel antioxidant and anti-inflammatory agent. J Pharmacol Exp Ther. 2004;308(3):820–829. doi: 10.1124/jpet.103.059733. [DOI] [PubMed] [Google Scholar]
- 30.Liu Z, et al. Novel ASK1 inhibitor AGI-1067 attenuates AGE-induced fibrotic response by suppressing the MKKs/p38 MAPK pathway in human coronary arterial smooth muscle cells. Int Heart J. 2018;59(6):1416–1424. doi: 10.1536/ihj.17-625. [DOI] [PubMed] [Google Scholar]
- 31.Sundell CL, et al. AGI-1067: a multifunctional phenolic antioxidant, lipid modulator, anti-inflammatory and antiatherosclerotic agent. J Pharmacol Exp Ther. 2003;305(3):1116–1123. doi: 10.1124/jpet.102.048132. [DOI] [PubMed] [Google Scholar]
- 32.Tardif JC, et al. Effects of succinobucol (AGI-1067) after an acute coronary syndrome: a randomised, double-blind, placebo-controlled trial. Lancet. 2008;371(9626):1761–1768. doi: 10.1016/S0140-6736(08)60763-1. [DOI] [PubMed] [Google Scholar]
- 33.Lo MC, Lansang MC. Recent and emerging therapeutic medications in type 2 diabetes mellitus: incretin-based, Pramlintide, Colesevelam, SGLT2 Inhibitors, Tagatose, Succinobucol. Am J Ther. 2013;20(6):638–653. doi: 10.1097/MJT.0b013e3181ec9eb2. [DOI] [PubMed] [Google Scholar]
- 34.Kong DH, et al. Emerging roles of vascular cell adhesion molecule-1 (VCAM-1) in immunological disorders and cancer. Int J Mol Sci. 2018;19(4):1057. doi: 10.3390/ijms19041057. [DOI] [PMC free article] [PubMed] [Google Scholar]
- 35.Alva JA, et al. VE-Cadherin-Cre-recombinase transgenic mouse: a tool for lineage analysis and gene deletion in endothelial cells. Dev Dyn. 2006;235(3):759–767. doi: 10.1002/dvdy.20643. [DOI] [PubMed] [Google Scholar]
- 36.Dzierzak E, Speck NA. Of lineage and legacy: the development of mammalian hematopoietic stem cells. Nat Immunol. 2008;9(2):129–136. doi: 10.1038/ni1560. [DOI] [PMC free article] [PubMed] [Google Scholar]
- 37.Monvoisin A, et al. VE-cadherin-CreERT2 transgenic mouse: a model for inducible recombination in the endothelium. Dev Dyn. 2006;235(12):3413–3422. doi: 10.1002/dvdy.20982. [DOI] [PubMed] [Google Scholar]
- 38.Matsumoto M, et al. An improved mouse model that rapidly develops fibrosis in non-alcoholic steatohepatitis. Int J Exp Pathol. 2013;94(2):93–103. doi: 10.1111/iep.12008. [DOI] [PMC free article] [PubMed] [Google Scholar]
- 39.Zhao P, et al. An AMPK-caspase-6 axis controls liver damage in nonalcoholic steatohepatitis. Science. 2020;367(6478):652–660. doi: 10.1126/science.aay0542. [DOI] [PMC free article] [PubMed] [Google Scholar]
- 40.Carambia A, et al. TGF-β-dependent induction of CD4(+)CD25(+)Foxp3(+) Tregs by liver sinusoidal endothelial cells. J Hepatol. 2014;61(3):594–599. doi: 10.1016/j.jhep.2014.04.027. [DOI] [PubMed] [Google Scholar]
- 41.Kar S, et al. Assay validation and clinical performance of chronic inflammatory and chemokine biomarkers of NASH fibrosis. PLoS One. 2019;14(7):e0217263. doi: 10.1371/journal.pone.0217263. [DOI] [PMC free article] [PubMed] [Google Scholar]
- 42.Neish AS, et al. Endothelial interferon regulatory factor 1 cooperates with NF-κ B as a transcriptional activator of vascular cell adhesion molecule 1. Mol Cell Biol. 1995;15(5):2558–2569. doi: 10.1128/MCB.15.5.2558. [DOI] [PMC free article] [PubMed] [Google Scholar]
- 43.Ahmad M, et al. Role of activating protein-1 in the regulation of the vascular cell adhesion molecule-1 gene expression by tumor necrosis factor-alpha. J Biol Chem. 1998;273(8):4616–4621. doi: 10.1074/jbc.273.8.4616. [DOI] [PubMed] [Google Scholar]
- 44.Tomita K, et al. Mixed lineage kinase 3 mediates the induction of CXCL10 by a STAT1-dependent mechanism during hepatocyte lipotoxicity. J Cell Biochem. 2017;118(10):3249–3259. doi: 10.1002/jcb.25973. [DOI] [PMC free article] [PubMed] [Google Scholar]
- 45.Krishnan A, et al. A longitudinal study of whole body, tissue, and cellular physiology in a mouse model of fibrosing NASH with high fidelity to the human condition. Am J Physiol Gastrointest Liver Physiol. 2017;312(6):G666–G680. doi: 10.1152/ajpgi.00213.2016. [DOI] [PMC free article] [PubMed] [Google Scholar]
- 46.Geraud C, et al. Endothelial transdifferentiation in hepatocellular carcinoma: loss of Stabilin-2 expression in peri-tumourous liver correlates with increased survival. Liver Int. 2013;33(9):1428–1440. doi: 10.1111/liv.12262. [DOI] [PubMed] [Google Scholar]
- 47.Poisson J, et al. Liver sinusoidal endothelial cells: physiology and role in liver diseases. J Hepatol. 2017;66(1):212–227. doi: 10.1016/j.jhep.2016.07.009. [DOI] [PubMed] [Google Scholar]
- 48.Rogers GW, et al. Decreased hepatic uptake of cholesterol and retinol in the dimethylnitrosamine rat model of cirrhosis. Liver. 1992;12(5):326–329. doi: 10.1111/j.1600-0676.1992.tb00581.x. [DOI] [PubMed] [Google Scholar]
- 49.Furuta K, et al. Emerging roles of liver sinusoidal endothelial cells in nonalcoholic steatohepatitis. Biology (Basel) 2020;9(11):E395. doi: 10.3390/biology9110395. [DOI] [PMC free article] [PubMed] [Google Scholar]
- 50.Corces MR, et al. An improved ATAC-seq protocol reduces background and enables interrogation of frozen tissues. Nat Methods. 2017;14(10):959–962. doi: 10.1038/nmeth.4396. [DOI] [PMC free article] [PubMed] [Google Scholar]
- 51.Yan H, et al. HiChIP: a high-throughput pipeline for integrative analysis of ChIP-Seq data. BMC Bioinformatics. 2014;15(1):280. doi: 10.1186/1471-2105-15-280. [DOI] [PMC free article] [PubMed] [Google Scholar]
- 52.Li H, Durbin R. Fast and accurate short read alignment with Burrows-Wheeler transform. Bioinformatics. 2009;25(14):1754–1760. doi: 10.1093/bioinformatics/btp324. [DOI] [PMC free article] [PubMed] [Google Scholar]
- 53.Zhang Y, et al. Model-based analysis of ChIP-Seq (MACS) Genome Biol. 2008;9(9):R137. doi: 10.1186/gb-2008-9-9-r137. [DOI] [PMC free article] [PubMed] [Google Scholar]
- 54.Ross-Innes CS, et al. Differential oestrogen receptor binding is associated with clinical outcome in breast cancer. Nature. 2012;481(7381):389–393. doi: 10.1038/nature10730. [DOI] [PMC free article] [PubMed] [Google Scholar]
- 55.Becher B, et al. High-dimensional analysis of the murine myeloid cell system. Nat Immunol. 2014;15(12):1181–1189. doi: 10.1038/ni.3006. [DOI] [PubMed] [Google Scholar]
- 56.Wong MT, et al. Mapping the diversity of follicular helper T cells in human blood and tonsils using high-dimensional mass cytometry analysis. Cell Rep. 2015;11(11):1822–1833. doi: 10.1016/j.celrep.2015.05.022. [DOI] [PubMed] [Google Scholar]
- 57.Chen H, et al. Cytofkit: a bioconductor package for an integrated mass cytometry data analysis pipeline. PLoS Comput Biol. 2016;12(9):e1005112. doi: 10.1371/journal.pcbi.1005112. [DOI] [PMC free article] [PubMed] [Google Scholar]
- 58.Hilscher MB, et al. Mechanical stretch increases expression of CXCL1 in liver sinusoidal endothelial cells to recruit neutrophils, generate sinusoidal microthombi, and promote portal hypertension. Gastroenterology. 2019;157(1):193–209. doi: 10.1053/j.gastro.2019.03.013. [DOI] [PMC free article] [PubMed] [Google Scholar]
- 59.Pitulescu ME, et al. Inducible gene targeting in the neonatal vasculature and analysis of retinal angiogenesis in mice. Nat Protoc. 2010;5(9):1518–1534. doi: 10.1038/nprot.2010.113. [DOI] [PubMed] [Google Scholar]
Associated Data
This section collects any data citations, data availability statements, or supplementary materials included in this article.


