

Abstract
Background.
We sought to determine the mediating effects of magnetic resonance imaging (MRI) biomarkers at term gestation on the relationship between perinatal illness-severity and neurodevelopment.
Methods.
The Clinical Risk Index for Babies – second edition (CRIB-II) was correlated with indices of brain maturation or injury and neurodevelopment at 2-year follow-up in infants born less than 32 weeks gestation. Using a counterfactual mediation analysis, associations between CRIB-II, MRI biomarkers and neurodevelopment were confirmed, followed by an assessment of the mediating effects of MRI biomarkers on the relationship between CRIB-II and neurodevelopment.
Results:
CRIB-II correlated significantly with neurodevelopment and MRI biomarkers of brain injury or cortical maturation. Two MRI biomarkers, cortical surface area and global injury score, were associated with neurodevelopmental scores at follow-up and included in mediation analyses.
Conclusion:
Biomarkers of cortical maturation or brain injury at term equivalent age mediated a substantial portion of the risks conveyed by perinatal illness-severity on neurodevelopmental outcomes at 2 years corrected age.
Keywords: early prediction, illness-severity, neurodevelopment, magnetic resonance imaging, brain injury, cortical brain development
INTRODUCTION
The Clinical Risk Index for Babies – second edition (CRIB-II) was designed by health services researchers to compare the mortality risk of preterm infants between institutions.(1–3) A composite of clinical and physiologic data collected in the perinatal period, CRIB-II has been shown to predict white matter damage(4) and cortical growth abnormalities(5) at term-equivalent age and neurodevelopmental outcomes observed at follow-up.(6)
A growing body of evidence suggests that macrostructural and morphometric abnormalities identified by magnetic resonance imaging (MRI) at term-equivalent age can be used as biomarkers of delayed maturation or brain injury, and that these biomarkers are associated with neurodevelopmental outcomes.(7–9) Brain MRI is more sensitive than cranial ultrasound (CUS) in detecting non-cystic white matter abnormalities.(10, 11) Although severe neuroimaging abnormalities are generally present on late cranial ultrasound studies, less severe imaging abnormalities can be missed by ultrasound.(12) We have previously shown that very preterm infants exhibit evidence of delayed cortical maturation on term-equivalent MRI and that these derangements are associated with abnormal development at follow-up.(9) Specifically, cortical surface area in almost every region of the cortex correlated positively with cognitive and language scores at age 2 years, while increased curvature of the inner cortex in the frontal, parietal and temporal lobes correlated with a decrease in Bayley-III scores at 2 years corrected age.
We hypothesized that developmental adversities associated with perinatal illness-severity are mediated, in part, by structural biomarkers of brain injury or delayed cortical maturation identified at term-equivalent age in very preterm infants. Therefore, we sought to determine the relationship between CRIB-II, a validated illness-severity score, with both MRI biomarkers at term-equivalent age and functional development at 2 years corrected age (CA) in order to determine the degree to which MR biomarkers mediate the relationship between early illness-severity and cognitive, language, and motor outcomes.
MATERIALS AND METHODS
The Early Prediction Study is a regional cohort study of very preterm infants recruited soon after birth from four neonatal intensive care units (NICUs) in central Ohio. The sample included 110 very preterm (<32 completed weeks’ gestation) infants whose parents consented to participate in the study, which included review of the medical record, brain MRI assessments at term-equivalent age, and neurodevelopmental follow-up at 22 to 26 months CA. Infants with chromosomal or congenital anomalies affecting the central nervous system and cyanotic heart diseases were excluded from the study. The study was approved by the Institutional Review Board at Nationwide Children’s Hospital, Columbus, OH and parents/guardians of all study infants provided full informed consent. We used a recently proposed counterfactual approach(13) to identify exposure/outcome relationships and to perform a mediation analysis in 3 steps, as depicted in Figure 1.
Figure 1.
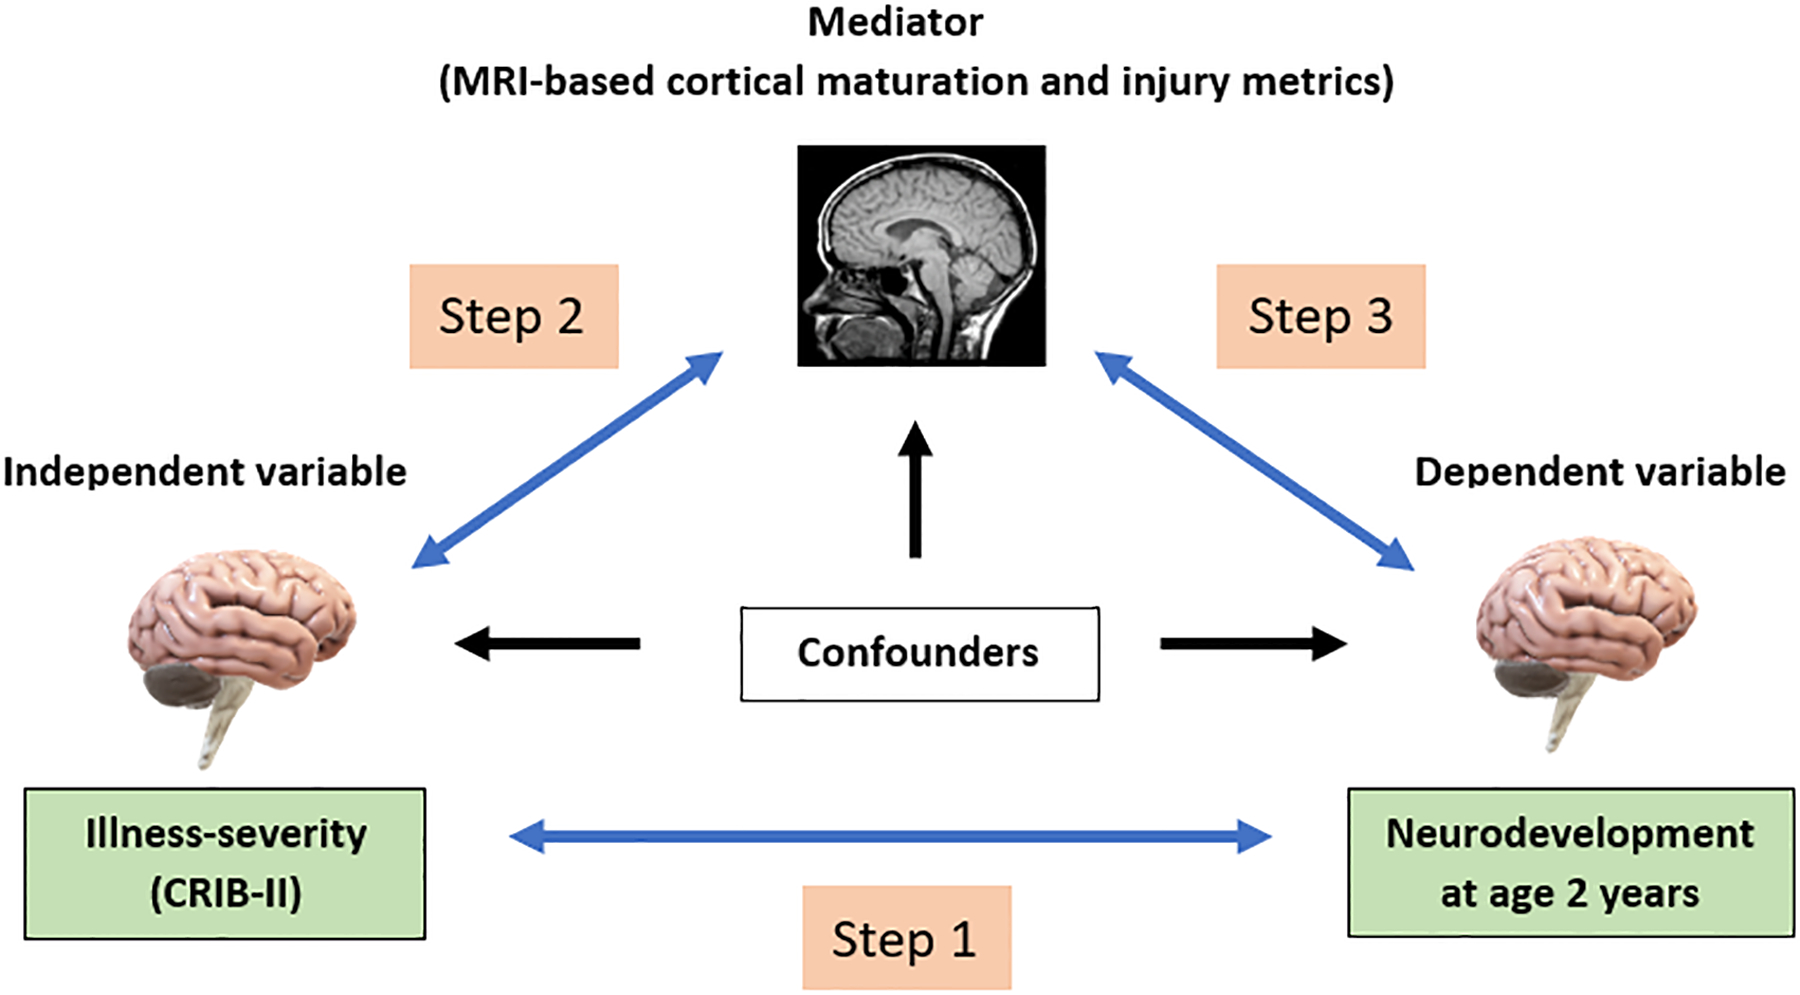
Mediation Analysis. Gray arrows represent the association between CRIB-II, MRI (mediator) variables, and neurodevelopmental impairment. Black arrows represent the effects of confounding exposures on these variables.
The first step in our mediation analysis was to confirm the findings of others regarding the relationship between perinatal illness-severity (CRIB-II) and neurodevelopmental scores at follow-up. The second step was to confirm an association between CRIB-II and structural biomarkers of cortical development or brain injury at term-equivalent age. The third and final step was to determine if our MRI biomarkers were associated with neurodevelopment, and if so, the degree to which these biomarkers of brain injury/cortical maturation mediate the relationship between CRIB-II and neurodevelopment.
Characteristics and exposures
Antenatal, perinatal and neonatal characteristics were collected prospectively, including maternal demographics, characteristics of the pregnancy and delivery, and neonatal characteristics after birth and before hospital discharge. Brain MRI studies were obtained at term-equivalent age, regardless of hospitalization status, and neurodevelopmental testing was performed by skilled examiners per guidelines of the Nationwide Children’s Hospital’s High-risk Follow-up Clinic.
Characteristics and exposures of infants born <32 weeks gestational age are presented in Table 1. We used a hierarchy of best obstetric estimates for assessments of gestational age, as previously described.(14, 15) Because gestational age and birthweight are components of CRIB-II, their effects are included in analyses by way of their impact on CRIB-II; however, they were not included explicitly as potential confounders. Potential confounders of the relationship between illness-severity (CRIB-II) and neurodevelopment included antenatal steroid administration (ANS), low 5-minute APGAR score, days of expressed breast milk in the first 28 days, maternal infection, chorioamnionitis, maternal education (< 12th grade), low income (< $60,000), maternal public insurance, socioeconomic status (SES) - a composite of three socioeconomic indicators, severe bronchopulmonary dysplasia (BPD), severe retinopathy of prematurity (ROP), severe ROP or BPD, major surgery requiring anesthesia, postnatal sepsis, and proven necrotizing enterocolitis (NEC). Characteristics and exposures that were significantly associated with the outcomes of interest (p<0.05) were included in multivariable models to adjust for confounding.
Table 1.
Characteristics and exposures
| Mean ± SD/N (%) | |
|---|---|
| Maternal Demographics | |
| Age n=110 | 29.96 ± 5.95 |
| Maternal infection n=102 | 20 (20%) |
| Antenatal corticosteroids n=110 | 51 (46%) |
| Clinical chorioamnionitis n=110 | 19 (17%) |
| Education (< 12th grade) n=110 | 53 (48%) |
| Public Insurance n=110 | 68 (62%) |
| Low income (< $60,000) n=101 | 36 (36%) |
| SES (composite indicator) n=110 | 67 (61%) |
| Neonatal Characteristics | |
| Birthweight n=110 | 1103.87 ± 391.51 |
| APGAR score at 5 min n=107 | 7.06 ± 1.69 |
| Expressed breast milk n=110 | 23.28 ± 6.77 |
| Low 5 min APGAR n=110 | 24 (22%) |
| Severe BPD n=110 | 37 (34%) |
| Severe ROP n=110 | 10 (9%) |
| Severe BPD or ROP n=110 | 40 (36%) |
| Major surgery n=110 | 22 (20%) |
| Neonatal Predictors – CRIB-II | |
| Base deficit n=107 | −5.0 ± 3.6 |
| CRIB score n=106 | 8.1 ± 4.4 |
| Neonatal Predictors – MRI | |
| Sulcal depth n=94 (unitless; mean convexity/concavity) | 24.32 ± 2.78 |
| Curvature n=94 (1/mm) | 2.16 ± 0.21 |
| Gyral index n=94 (unitless) | 2.48 ± 0.15 |
| Surface area n=94 (mm2) | 79922.57 ± 9573.92 |
| Global Risk Score n=110 | 3.02 median (IQR) 1.5 (0, 3) |
Perinatal Illness severity (CRIB-II)
CRIB-II derives from epidemiologic studies of the relationship between illness-severity and mortality before hospital discharge and includes 5 perinatal risk factors associated with mortality: birthweight, gestational age, sex, admission temperature, and serum base deficit (obtained from either a cord blood gas or an early postnatal blood gas).(2, 6) CRIB-II is presented as an integer for each patient; each unit increase in CRIB-II conveys an increased risk of mortality and neurodevelopmental adversity, as reported by Lodha et al.(6)
Of the 110 subjects in the sample, 24 lacked blood gas data (base deficits) needed to compute a CRIB-II score. Six of these 24 infants also lacked Bayley-III developmental assessments at age 2, thus leaving 18 subjects with missing data needed for the correlation of perinatal illness-severity and neurodevelopment. All but one of these required only CPAP or no respiratory support at all, and all had an uncomplicated transition. Thus, we elected to impute a base deficit of [−2] for each of these healthy subjects, as this approximates the base deficit of other low-risk infants (on CPAP or room air) in the sample. The basis for this imputation is that infants requiring non-invasive respiratory support (or room air) rarely meet clinical criteria for collection of a blood gas and are therefore unlikely to have a base deficit for calculation of the CRIB-II score.
Imaging methodology
Because the timing of neuroimaging can affect image interpretation, MRI scans were restricted to within +/− one week of 40 weeks PMA. Brain MRI was performed on a 3 Tesla Siemens Skyra scanner. Imaging acquisition standards were applied per protocol for T2-weighted imaging sequences and included an echo time of 147ms, a repetition time of 9500ms, a flip angle of 150°, voxel dimensions of 0.93×0.93×1.00 mm3, and a scan time of 4.09 minutes. 3-dimensional magnetization-prepared rapid gradient echoes (MPRAGE) included an echo time of 2.9ms, a repetition time of 2270ms, an echo spacing time of 8.5ms, a flip angle of 13°, voxel dimensions of 1.0×1.0×1.0 mm3 and a scan time of 3:32 seconds. The axial susceptibility weighted imaging (SWI) – echo time was 20ms; the repetition time 27ms; the flip angle 15°; and the resolution 0.7× 0.7×1.6 mm3.
A study research nurse, neonatal nurse practitioner, and/or a physician with imaging experience was present for all MRI scans. A quality assurance phantom was scanned quarterly, and the signal-to-noise ratio (SNR), contrast-to-noise ratio (CNR) and gradient performance were tracked serially per protocol. Scans were completed while using silicone ear plugs (instaputty, E.A.R., Boulder CO, USA) for ear protection, swaddling with a blanket, a vacuum immobilization device (MedVac, CFI Medical Solutions, Fenton, MI, USA), and feedings 30 minutes prior to the imaging study.
MRI assessments used in study comparisons
We examined the correlation between CRIB-II and 4 MRI metrics of cortical maturation (surface area, sulcal depth, gyrification index, and curvature) and a single composite MRI injury severity score (global injury score), as described by Kidokoro et al.(16) We used the automated developing Human Connectome Pipeline (dHCP) to perform processing of T2-weighted MRI scans;(17) dHCP uses cortical and subcortical segmentation algorithms to calculate cortical maturation metrics such as cortical thickness, sulcal depth, gyrification index, white matter curvature, and cortical surface area. A value for each cortical metric is generated for all regions of the Gousia’s brain atlas(18), for merged lobar regions, and for the full brain, as well. After running the dHCP pipeline algorithm, we visually inspected the results. Subjects with moderate or severe ventriculomegaly or with poor-quality imaging (poor tissue identification, improper segmentation, or artifact) were excluded from analyses that made use of the dHCP algorithm (cortical surface metrics). However, these infants were included in analyses related to the global injury score, which accounts for macroscopic intracranial injuries, such as intraventricular hemorrhage (IVH), peri-ventricular leukomalacia (PVL), and ventriculomegaly (VM), in their evolved form.
The global injury score is defined by both signal abnormalities and impaired brain growth for cerebral white matter, cortical gray matter, deep nuclear gray matter, and cerebellar abnormalities.(16) Two-dimensional biometric measurements were obtained by a single rater using the free Onis 2.5® software for analysis (available at: http://www.onis-viewer.com/ProductInfo.aspx?id=19). These measurements were combined with structural MRI evaluations by three pediatric neuroradiologists to yield a global injury score, as described by Kidokoro et al.(16) In the present study, cortical surface area, cortical folding measures (gyrification index), sulcal depth, curvature of the cortical white matter surface, and the global injury score were correlated with both CRIB-II and the 3 subtests (cognitive, language, and motor) of the Bayley Scales of Infant & Toddler Development – third edition (BSID-III) obtained at the 2 year CA developmental follow-up visit.
Outcome assessments
The goal of the Early Prediction Study is to assess the prognostic value of advanced MRI at term-equivalent age, among survivors of very preterm birth. Roughly 98% of very preterm infants that survive to 32 weeks gestation will also survive to follow-up at age 2 years. Because brain MRI is not relevant to the parents of infants who die, we enrolled very preterm infants at 32 weeks postmenstrual age (or older) and did not consider mortality a relevant outcome for the present study.
Developmental assessments were performed by skilled examiners at 22 to 26 months corrected age using the BSID-III.(19) All Bayley examiners are trained to reliability using the standards of the NICHD Neonatal Research Network (NRN). The cognitive subscale of the BSID-III examines global mental function derived from memory, object manipulation and/or problem solving; the language subscale assesses language understanding and vocabulary; and the motor subscale examines fine and gross motor function. The subscales have a mean score of 100, a standard deviation of ±15 and range of 40 to 160.(19) Bayley testers were blinded to cortical maturation indices relevant to this study, but not to structural neuroimaging results.
Statistical Analysis
Patient demographics, MRI outcomes, and Bayley-III scores were summarized using mean and standard deviations or frequency and percentages. The associations between independent variables and outcomes were assessed using Independent t-tests and Pearson correlations. Separate linear regressions were performed to estimate the effect of independent variables (CRIB-II score, SES, severe BPD or ROP, major surgery, Apgar score at 5 minutes, antenatal steroids and maternal infection) and MRI measures on the cognitive, language and motor Bayley scores at 2 years CA, respectively. Stepwise forward regression was applied to select the best variable set for a multivariable model. At each step, Akaike’s information criterion (AIC) was calculated to decide whether the variable with the smallest effect should be dropped from the model. Mediation analysis was performed on each Bayley outcome with each MRI mediators separately.(13) Variables selected in the final model for each outcome were used to adjust for confounding in the mediation analysis. All analyses were conducted using SAS 9.4 Proc CausalMed (SAS Institute, Cary, NC).
RESULTS
Of the 110 infants in the sample, all (100%) had enough data for calculation of a composite MRI global injury score; 106 (96%) had sufficient data for calculation of CRIB-II and 83 (78%) received a Bayley-III neurodevelopmental assessment. Of the 110 infants in the sample, high-quality cortical surface measures were recorded in 96 (87%) subjects; 93 (85%) of these had sufficient data for computation of the CRIB-II score, and 83 (75%) received a Bayley-III neurodevelopmental assessment.
The mean (SD) CRIB-II score was 8.1 (4.4). The mean (SD) gestational age was 28.1 (2.6) weeks and the gestational age (SD) at MRI scan was 40.4 (0.6) weeks. The mean cognitive score (SD) for the cohort was 95.1 (17.6), the mean language score (SD) was 93.1 (17.9), and the mean (SD) motor score was 91.4 (17.4) at 24 months corrected age.
We also compared infants evaluated at follow-up (n=83) to those who were lost to follow-up (n=27) and found that the follow-up cohort was similar (p > 0.05) to the cohort that was lost to follow-up, in all but one comparison. The follow-up cohort had a median GA of 28.0 (95% CI: 27.5, 28.5) weeks, whereas those lost to follow-up had a GA of 28.4 (95% CI: 27.2, 29.5) weeks. The median birthweight of the follow-up cohort was 1090 (95% CI: 1005, 1175) grams, compared to 1121 (95% CI: 959, 1284) grams in the group lost to follow-up. Forty-nine percent of the follow-up cohort received a complete course of ACS, versus 37% among those lost to follow-up, and the median CRIB-II score for the follow-up cohort was 8.15 (95% CI: 7.22, 9.07), while that of infants lost to follow-up was 8.08 (95% CI: 5.95, 10.2). The only significant difference between the characteristics and exposures of those evaluated at follow-up and those lost to follow-up was that 49% of the follow-up cohort had a diagnosis of postnatal sepsis, compared to 33% of those lost to follow-up (p =0.01).
While there was no correlation between the age at MRI and developmental scores at follow-up, birthweight, gestational age, 5-minute APGAR and use of expressed breast milk within 28 days correlated significantly with developmental scores at age 2 years. The mean CRIB-II (SD) core was 8.1 (4.4) and correlated significantly with each of the 3 measures of functional development at follow-up (not shown).
Step 1: Association between illness-severity (CRIB-II) and neurodevelopment at 2 years’ corrected age
After adjusting for potential confounders, CRIB-II, SES, and major surgery remained significantly associated with Bayley cognitive scores; cognitive scores decreased by approximately 0.9 units for each unit increase in CRIB-II score (Table 2). CRIB-II was also associated with Bayley language scores, as was major surgery and maternal infection; language scores decreased by approximately 1.2 units for each unit increase in CRIB-II score. CRIB-II and major surgery were also associated with Bayley motor scores; motor scores decreased by approximately 0.9 units, on average, for each unit increase in CRIB-II score (Table 2).
Table 2.
Multivariable models of the relationship between CRIB-II and independent variables and neurodevelopmental outcomes at 2 years CA *
| Independent variables | Cognitive Score 24 months * | P | Language Score 24 months * | P | Motor Score 24 months * | p |
|---|---|---|---|---|---|---|
| CRIB-II | −0.9 (−1.7, −0.03) | <.01 | −1.2 (−2.2, −0.3) | 0.01 | −0.9 (−1.6, −0.1) | <0.01 |
| SES | −8.3 (−14.7, −1.9) | 0.01 | ||||
| Major surgery | −21.3 (−30.4, −12.1) | <0.01 | −18.7 (−29., −8.0) | <0.01 | −26.3 (−34.9, −17.8) | <0.01 |
| Mat Infection | −11.0 (−19.5, −2.5) | 0.01 |
Adjusted for ANS, 5-min APGAR, SES, severe ROP or BPD, major surgery, and maternal infection. Two-sided p-values < 0.05 are significant.
Step 2: Association between illness-severity (CRIB-II) and MRI biomarkers at term-equivalent age
MRI variables correlated significantly with each other. Sulcal depth correlated negatively with the global injury score (r= −0.32, p<0.01) and positively with cortical surface area (r= 0.37, p<0.01), whereas the global injury score correlated negatively with surface area (r= −0.41, p<0.01). We also examined the possibility of interaction between the terms within the model, especially between CRIB-II and the 3 MRI variables, and found no such interaction (not shown).
CRIB-II correlated significantly with 3 of the 5 MRI biomarkers (surface area, sulcal depth, and global injury score) included in the study (Table 3). The correlation between CRIB-II and curvature of the white matter surface approached significance (p=0.05). However, both cortical surface area and sulcal depth decreased significantly (p<0.01) with each unit increase in CRIB-II, whereas the global injury score increased significantly with each unit increase in CRIB-II (p<0.01).
Table 3.
Multivariable models of independent variables and the MRI biomarkers sulcal depth, cortical surface area, and global injury score.
| Table 3a | Cognitive Bayley Score * | Language Bayley score * | Motor Bayley score * | |||
|---|---|---|---|---|---|---|
| Coeff (95% CI) | p | Coeff (95% CI) | p | Coeff (95% CI) | p | |
| Sulcal Depth | 0.3 (−0.8, 1.5) | 0.56 | 1.1 (−0.4, 2.6) | 0.14 | 0.98 (−0.1, 2.0) | 0.06 |
| Covariates | ||||||
| SES | −11.4 (−17.9, −4.9) | <0.01 | ||||
| Major Surgery | −13.5 (−23.0, −3.9) | <0.05 | ||||
| Maternal Infection | −12.7 (−22.3, −3.0) | <0.05 | ||||
| Table 3b | Cognitive Bayley Score * | Language Bayley score * | Motor Bayley score * | |||
| Coeff (95% CI) | p | Coeff (95% CI) | p | Coeff (95% CI) | p | |
| Surf area / 1000 | 0.6 (0.3, 1.0) | <0.01 | 0.5 (0.1, 0.9) | <0.05 | 0.7 (0.4, 1.0) | <0.01 |
| Covariates | ||||||
| SES | −10.5 (−16.4, −4.6) | <0.01 | −10.0 (−17.2, −2.8) | <0.05 | ||
| Severe BPD/ROP | −7.0 (−12.8, −1.1) | <0.05 | ||||
| Table 3c | Cognitive Bayley Score * | Language Bayley score * | Motor Bayley score * | |||
| Coeff (95% CI) | p | Coeff (95% CI) | p | Coeff (95% CI) | p | |
| Global Injury score | −2.3 (−2.8, −1.8) | <0.01 | −2.0 (−2.6, −1.4) | <0.01 | −2.1 (−2.6, −1.5) | <0.01 |
| Covariates | ||||||
| Major Surgery | −7.4 (−15.9, 1.1) | 0.09 | ||||
| Maternal Infection | −10.7 (−17.6, −3.7) | <0.01 | −14.3 (−22.2, −6.4) | <0.01 | ||
Adjusted for ANS, SES, severe BPD or ROP, major surgery, APGAR 5 min, and maternal infection. Two-sided p-values < 0.05 are significant (bold).
CRIB-II and the composite outcome severe BPD or ROP were both univariately associated with sulcal depth. After adjusting for potential confounders, the multivariable model containing CRIB-II was the best model for associations with sulcal depth, which decreased approximately 0.3 units (−0.44, −0.19) for each unit increase in CRIB-II score.
Likewise, CRIB-II was univariately associated with the cortical surface area and was the only covariate in the multivariable model for surface area that reached significance; cortical surface area decreased approximately 779 units (−1238, −320) for each unit increase in CRIB-II score.
Similarly, CRIB-II, severe BPD or ROP, and major surgery were all univariately associated with the global brain injury score. However, the multivariable model containing the CRIB-II and major surgery was the best model for global brain injury score. The global Injury score increased by approximately 7.4 units (5.18, 9.61) for each major surgery and by 0.39 units for each unit increase in CRIB-II.
Step 3: Mediating effects of MRI biomarkers on the relationship between CRIB-II and neurodevelopment at 2-years’ corrected age
In the third step of our analyses, we confirmed an association between our biomarkers of brain injury/maturation and neurodevelopmental scores at 2 years CA. Here a significant association was found, and we determined the magnitude of the mediating effects of MRI on the relationship between illness-severity (CRIB-II) and neurodevelopment.
While surface area, sulcal depth and global injury score were associated with developmental scores on univariate analyses, after adjusting for confounders, only surface area and global injury score remained significantly associated with developmental scores at 2 years CA (Table 3).
After adjusting for confounders, the relationship between sulcal depth and neurodevelopment was non-significant (Table 3a). On the other hand, both surface area (Table 3b) and global injury risk score (Table 3c) were significantly associated with neurodevelopmental outcomes, even after adjusting for confounders. Therefore, both surface area and global injury score were included in the mediation analyses.
Using methods described by VanderWeele et al,(13) we demonstrated that a significant proportion of the effects of illness-severity on neurodevelopment are mediated by the MRI biomarkers (Table 4). Roughly 70% of the relationship between CRIB-II and cognitive impairments was mediated by our composite MRI risk score, global injury score (Table 4a). The mediating effects of the global injury score also accounted for roughly 40% of the effects of the relationship between CRIB-II and Bayley language scores (Table 4b). Moreover, approximately 87% of the effects of illness-severity on motor scores was mediated through the global injury score, and roughly 50% through cortical surface area (Table 4c).
Table 4.
Mediating effects of 3 MRI variables on the relationship between perinatal illness-severity (CRIB-II) and Bayley cognitive scores at 2 years corrected age *
| Mediator variable | Bayley Cognitive Scores * | |||
|---|---|---|---|---|
| Total Effect Coeff (95%CI) p-value |
Direct Effect Coeff (95%CI) p-value |
Indirect Effect Coeff (95%CI) p-value |
% Mediated (95%CI) p-value |
|
| Sulcal Depth | −0.83 (−1.63, −0.02) P=0.04 |
−1.10 (−2.05, −0.15) P=0.02 |
0.27 (−0.25, 0.79) P=0.31 |
−32.9% (−104.2, 38.5) P=0.37 |
| Global Injury | −0.87 (−1.68, −0.06) P=0.03 |
−0.26 (−1.02, 0.50) P=0.50 |
−0.61 (−1.06, −0.16) P=0.01 |
70.0% (4.3, 135.7) P=0.04 |
| Surface Area | −0.83 (−1.63, −0.02) P=0.04 |
−0.32 (−1.14, 0.50) P=0.46 |
−0.51 (−0.93, −0.08) P=0.02 |
61.3% (−8.3, 130.9) P=0.08 |
| Mediator variable | Bayley Language Scores * | |||
| Total Effect Coef (95%CI) p-value |
Direct Effect Coef (95%CI) p-value |
Indirect Effect Coef (95%CI) p-value |
% Mediated (95%CI) p-value |
|
| Sulcal Depth | −1.33 (−2.24, −0.42) P=0.00 |
−1.39 (−2.45, −0.33) P=0.01 |
0.06 (−0.47, 0.60) P=0.82 |
−4.8% (−45.1, 35.6) P=0.82 |
| Global Injury | −1.24 (−2.12, −0.37) P=0.01 |
−0.74 (−1.58, 0.10) P=0.08 |
−0.50 (−0.94, −0.06) P=0.02 |
40.2% (3.0, 77.7) P=0.03 |
| Surface Area | −1.33 (−2.24, −0.42) P=0.00 |
−1.10 (−2.06, −0.14) P=0.02 |
−0.23 (−0.59, 0.13) P=0.21 |
17.1% (−11.6, 45.8) P=0.24 |
| Mediator variable | Bayley Motor Scores * | |||
| Total Effect Coef (95%CI) p-value |
Direct Effect Coef (95%CI) p-value |
Indirect Effect Coef (95%CI) p-value |
% Mediated (95%CI) p-value |
|
| Sulcal Depth | −1.02 (−1.74, −0.30) P=0.01 |
−0.82 (−1.68, 0.03) P=0.06 |
−0.19 (−0.67, 0.28) P=0.42 |
18.9% (−29.5, 67.2) P=0.44 |
| Global Injury | −0.87 (−1.61, −0.13) P=0.02 |
−0.11 (−0.74, 0.52) P=0.73 |
−0.76 (−1.26, −0.26) P=0.03 |
87.3% (22.4, 152.2) P=0.01 |
| Surface Area | −1.02 (−1.74, −0.30) P=0.01 |
−0.51 (−1.24, 0.22) P=0.17 |
−0.51 (−0.91, −0.11) P=0.01 |
50.2% (4.5, 96.0) P=0.03 |
Adjusted for potential confounders. Values in the far-right column represent the magnitude (%) of the mediating effects of the MRI variable (left) on the relationship between illness-severity (CRIB-II) and neurodevelopment. Negative values represent a change in effect (non-significant) and two-sided p-values < 0.05 are significant (bold).
DISCUSSION
After adjusting for potential confounders, brain injury and maturational abnormalities identified on MRI at term-equivalent age mediated a substantial portion of the adversities conveyed by CRIB-II on neurodevelopmental outcomes. Our findings suggest that abnormalities identified on a term-equivalent MRI convey risks that are present around the time of birth and may not be appreciated until 2 years later. Recently, published guidelines suggest that early detection of cerebral palsy is possible.(20, 21) However, we still lack adequate evidence regarding the predictive value of brain MRI, in combination with general motor assessments, to accurately predict CP severity before 6 months of age.(22) Our findings confirm those of others that very preterm infants with measures of perinatal illness-severity are at increased risk of neurodevelopmental adversities at follow-up, even in the absence of a complicated NICU course. What our study adds, however, is that a significant portion of the risks conveyed by illness-severity are mediated by MRI biomarkers of delayed maturation or injury, even after adjusting for potential confounders. This is important and suggests that our MRI biomarkers may add significantly to our ability to predict the need for early intervention services.
In 2009, Lodha et. al used CRIB-II as a predictor of neurodevelopmental impairment in preterm infants ≤1250g who underwent follow-up testing at 36 months CA.(6) Poor outcomes were defined as death or major neurodevelopmental disability. CRIB-II scores of 13 or more in the first hour of life reliably predicted major neurodevelopmental impairment at 36 months’ CA.(6) Unfortunately, illness-severity scores are not consistently associated with the adversities seen at follow-up, suggesting that other biomarkers are needed. Greenwood et al. evaluated CRIB-II as a predictor of moderate to severe functional disabilities in 2210 infants born <29 weeks’ GA in one of two neonatal units in Australia between 1998 and 2003.(23) While CRIB-II scores were significantly higher among infants with functional disability, it performed no better than either GA or birthweight in predicting functional disability.(23)
Brouwer et al evaluated TEA-MRI in extremely preterm infants using the Kidokoro et al scoring system and found that the global brain injury score was inversely related to cognitive and motor scores at 2 years corrected age.(24) The authors report that the variance (R2) explained by these associations was small (~22%). Our findings corroborate this, as we showed that only a portion of the relationship between perinatal illness-severity and neurodevelopment was mediated by MRI biomarkers (Table 4). We have not reported the variance (R2) explained, per se’, but we view percent mediation in much the same way we view variance (R2). One key difference between the Brouwer et al study and ours, however, is that perinatal factors included in the Brouwer study occurred [after] the exposure of interest in our study. Our exposure, CRIB-II, is derived from measures collected just after delivery, but before the interventions or exposures of the Brouwer et al paper. Similarly, George et al used the Kidokoro et al scoring system to document a significant association between both early (29 to 35 weeks) and TEA-MRI abnormalities and neurodevelopment at follow-up.(25) Their TEA-MRI findings more reliably predicted adversities than early MRI, suggesting that MRI obtained just before discharge is likely better than MRI obtained earlier in the hospital course. What our study adds, however, is that a portion of the risks conveyed by MRI (at term-equivalent age) reflect risks already present in the first hours after delivery (CRIB-II).
While perinatal illness-severity scores (CRIB-II) provide meaningful information regarding the risk of death or disability, MRI biomarkers provide additional information regarding the risk of adverse outcomes. Consider that a number of inflammation-initiating illnesses and exposures occur after the perinatal period, thus increasing the risk of neurodevelopmental impairment (e.g., bacterial sepsis, NEC, BPD, ROP).(26) Our mediation analysis suggests that a significant portion of the risks of adversity are already present just after birth, before any inflammation-initiating illnesses or exposures are encountered, and this provides an explanation for the risk of adversity of infants that lack exposure to postnatal inflammatory exposures. Since the majority of infants born very preterm are discharged at or around term gestation, then, biomarkers at TEA are needed to inform decision-making regarding follow-up and/or the need for early intervention.
Our findings have several important implications. First, perinatal illness-severity, our indicator of the endogenous risks present around the time of birth, is a marker for subsequent risks. This confirms findings from the Extremely Low Gestational Age Newborn (ELGAN) Study Group.(27) In addition, macrostructural and maturational MRI abnormalities identified at term-equivalent age (many weeks later) mediate a significant portion of the risks conveyed by perinatal illness-severity. Our findings suggest the possibility that perinatal illness-severity is an early biomarker for functional developmental deficits, and that these risks are partially mediated by abnormalities identified on brain MRI at term-equivalent age. Because we adjusted for potential confounders in the antenatal and perinatal period, it is unlikely that these potential confounders contributed to the risks conveyed by CRIB-II. However, it is possible that our sample size was not large enough to adequately adjust for confounding.
It is not surprising that SES was among the most important risk factors for neurodevelopmental impairment at follow-up; this is consistent with prior reports that socioeconomic status plays an important role in functional development.(28) And it is also worth noting that the variable major surgery represents those infants who had surgery requiring general anesthesia while in the NICU. Unfortunately, it is difficult, with the available data, to tease-out whether general anesthesia explains the association with adverse outcomes, or rather the inflammatory cascade that accompanies the major surgery. Moreover, despite the significant contribution of SES, major surgery requiring anesthesia, severe BPD or ROP and maternal infection with developmental impairments at follow-up, the contribution of early/perinatal illness-severity persisted at 2-year follow-up, and MRI biomarkers mediated a significant portion of these risks at term equivalent age.
The strength of our study is that antenatal, perinatal and postnatal data were acquired prospectively; clinical and demographic data were collected using strict protocols and procedures and MRI acquisition and processing algorithms were designed to mitigate concerns about ascertainment bias. In addition, we used imaging algorithms documented in prior publications, and our findings appear to duplicate those of others.(16, 17) Moreover, the study was adequately powered for the analyses performed and there were no differences between the follow-up group and those lost to follow-up,
The limitations of our study include the relatively small sample size, the loss of 27 infants (24%) to follow-up, and that 18 infants required imputation of base deficit data needed to compute the CRIB-II score (because they lacked a postnatal blood gas). The subset of infants that received imputed CRIB-II scores had a normal postnatal transition, and with one exception, required only CPAP or room air in the first hours after birth. Infants with a normal postnatal transition (room air or CPAP) generally do not have blood gases drawn. The infants that received an imputed base deficit were generally healthy and all but one was managed with CPAP and did not have a blood gas drawn in the first hours after birth. All infants with an imputed base deficit data had cognitive and motor scores well within 1 SD of the normative mean, and only 1 infant had a language score <1 SD below the mean at follow-up. The 6 infants that lacked an imputed CRIB-II score did not have developmental testing data available for analysis; therefore, they could not be included in mediation analyses. Another limitation is that 16 infants were excluded from cortical maturation analyses due to motion artifact or poor imaging quality. To address this limitation, our study included the use of a global injury score, as described by Kidokoro et al, which includes both quantitative and qualitative metrics for evaluating brain injury on MRI.
CONCLUSION
Brain injury and maturational MRI biomarkers at term-equivalent age mediate a substantial portion of the risk of developmental impairments conveyed by early illness-severity. As such, these MRI biomarkers can be used in combination with other early biomarkers to predict infants at greater risk of disability. These MRI biomarkers are also potentially important for capturing the neurodevelopmental risks associated with perinatal care/early illness severity. These biomarkers might allow clinicians to adjust their perinatal care practices (e.g. through rapid PDSA cycles) to improve potentially modifiable risk factors such as admission temperature, acid-base derangements, or other perinatal care practices associated with perinatal illness-severity.
ACKNOWLEDGMENTS
Funding: this study was supported, in part, by the National Institute of Neurological Disorders and Stroke, United States (NIH Grants R01-NS094200 and R01-096037).
The authors would also like to express our gratitude to the families who participated in the study and the clinical and administrative staff in the High-risk Follow-up Clinic at Nationwide Children’s Hospital.
Footnotes
CONFLICTS OF INTEREST
None of the authors have any conflicts of interest, financial or otherwise, relevant to this study
BIBLIOGRAPHY
- 1.Buhrer C, Metze B, Obladen M. CRIB, CRIB-II, birth weight or gestational age to assess mortality risk in very low birth weight infants? Acta Paediatr. 2008;97(7):899–903. [DOI] [PubMed] [Google Scholar]
- 2.Ezz-Eldin ZM, Hamid TA, Youssef MR, Nabil Hel D. Clinical Risk Index for Babies (CRIB II) Scoring System in Prediction of Mortality in Premature Babies. J Clin Diagn Res. 2015;9(6):SC08–11. [DOI] [PMC free article] [PubMed] [Google Scholar]
- 3.Gagliardi L, Cavazza A, Brunelli A, Battaglioli M, Merazzi D, Tandoi F, et al. Assessing mortality risk in very low birthweight infants: a comparison of CRIB, CRIB-II, and SNAPPE-II. Archives of disease in childhood Fetal and neonatal edition. 2004;89(5):F419–22. [DOI] [PMC free article] [PubMed] [Google Scholar]
- 4.Horsch S, Hallberg B, Leifsdottir K, Skiold B, Nagy Z, Mosskin M, et al. Brain abnormalities in extremely low gestational age infants: a Swedish population based MRI study. Acta Paediatr. 2007;96(7):979–84. [DOI] [PubMed] [Google Scholar]
- 5.Kaukola T, Kapellou O, Laroche S, Counsell SJ, Dyet LE, Allsop JM, et al. Severity of perinatal illness and cerebral cortical growth in preterm infants. Acta Paediatr. 2009;98(6):990–5. [DOI] [PubMed] [Google Scholar]
- 6.Lodha A, Sauve R, Chen S, Tang S, Christianson H. Clinical Risk Index for Babies score for the prediction of neurodevelopmental outcomes at 3 years of age in infants of very low birthweight. Dev Med Child Neurol. 2009;51(11):895–900. [DOI] [PubMed] [Google Scholar]
- 7.Hintz SR, Barnes PD, Bulas D, Slovis TL, Finer NN, Wrage LA, et al. Neuroimaging and neurodevelopmental outcome in extremely preterm infants. Pediatrics. 2015;135(1):e32–42. [DOI] [PMC free article] [PubMed] [Google Scholar]
- 8.He L, Parikh NA. Atlas-guided quantification of white matter signal abnormalities on term-equivalent age MRI in very preterm infants: findings predict language and cognitive development at two years of age. PLoS One. 2013;8(12):e85475. [DOI] [PMC free article] [PubMed] [Google Scholar]
- 9.Kline JE, Illapani VSP, He L, Altaye M, Logan JW, Parikh NA. Early cortical maturation predicts neurodevelopment in very preterm infants. Archives of disease in childhood Fetal and neonatal edition. 2019. [DOI] [PMC free article] [PubMed] [Google Scholar]
- 10.Inder TE, Anderson NJ, Spencer C, Wells S, Volpe JJ. White matter injury in the premature infant: a comparison between serial cranial sonographic and MR findings at term. AJNR Am J Neuroradiol. 2003;24(5):805–9. [PMC free article] [PubMed] [Google Scholar]
- 11.Laptook AR, O’Shea TM, Shankaran S, Bhaskar B, Network NN. Adverse neurodevelopmental outcomes among extremely low birth weight infants with a normal head ultrasound: prevalence and antecedents. Pediatrics. 2005;115(3):673–80. [DOI] [PubMed] [Google Scholar]
- 12.Parikh NA. Advanced neuroimaging and its role in predicting neurodevelopmental outcomes in very preterm infants. Seminars in perinatology. 2016;40(8):530–41. [DOI] [PMC free article] [PubMed] [Google Scholar]
- 13.VanderWeele TJ. Mediation Analysis: A Practitioner’s Guide. Annu Rev Public Health. 2016;37:17–32. [DOI] [PubMed] [Google Scholar]
- 14.Tyson JE, Parikh NA, Langer J, Green C, Higgins RD, National Institute of Child H, et al. Intensive care for extreme prematurity--moving beyond gestational age. The New England journal of medicine. 2008;358(16):1672–81. [DOI] [PMC free article] [PubMed] [Google Scholar]
- 15.Donovan EF, Tyson JE, Ehrenkranz RA, Verter J, Wright LL, Korones SB, et al. Inaccuracy of Ballard scores before 28 weeks’ gestation. National Institute of Child Health and Human Development Neonatal Research Network. The Journal of pediatrics. 1999;135(2 Pt 1):147–52. [DOI] [PubMed] [Google Scholar]
- 16.Kidokoro H, Neil JJ, Inder TE. New MR imaging assessment tool to define brain abnormalities in very preterm infants at term. AJNR Am J Neuroradiol. 2013;34(11):2208–14. [DOI] [PMC free article] [PubMed] [Google Scholar]
- 17.Makropoulos A, Robinson EC, Schuh A, Wright R, Fitzgibbon S, Bozek J, et al. The developing human connectome project: A minimal processing pipeline for neonatal cortical surface reconstruction. Neuroimage. 2018;173:88–112. [DOI] [PMC free article] [PubMed] [Google Scholar]
- 18.Gousias IS, Rueckert D, Heckemann RA, Dyet LE, Boardman JP, Edwards AD, et al. Automatic segmentation of brain MRIs of 2-year-olds into 83 regions of interest. Neuroimage. 2008;40(2):672–84. [DOI] [PubMed] [Google Scholar]
- 19.Bayley N Bayley scales of infant and toddler development - third edition. 2006.
- 20.Maitre NL, Burton VJ, Duncan AF, Iyer S, Ostrander B, Winter S, et al. Network Implementation of Guideline for Early Detection Decreases Age at Cerebral Palsy Diagnosis. Pediatrics. 2020;145(5). [DOI] [PMC free article] [PubMed] [Google Scholar]
- 21.Novak I, Morgan C, Adde L, Blackman J, Boyd RN, Brunstrom-Hernandez J, et al. Early, Accurate Diagnosis and Early Intervention in Cerebral Palsy: Advances in Diagnosis and Treatment. JAMA Pediatr. 2017;171(9):897–907. [DOI] [PMC free article] [PubMed] [Google Scholar]
- 22.Parikh NA. Are Structural Magnetic Resonance Imaging and General Movements Assessment Sufficient for Early, Accurate Diagnosis of Cerebral Palsy? JAMA Pediatr. 2018;172(2):198–9. [DOI] [PubMed] [Google Scholar]
- 23.Greenwood S, Abdel-Latif ME, Bajuk B, Lui K. Can the early condition at admission of a high-risk infant aid in the prediction of mortality and poor neurodevelopmental outcome? A population study in Australia. J Paediatr Child Health. 2012;48(7):588–95. [DOI] [PubMed] [Google Scholar]
- 24.Brouwer MJ, Kersbergen KJ, van Kooij BJM, Benders M, van Haastert IC, Koopman-Esseboom C, et al. Preterm brain injury on term-equivalent age MRI in relation to perinatal factors and neurodevelopmental outcome at two years. PLoS One. 2017;12(5):e0177128. [DOI] [PMC free article] [PubMed] [Google Scholar]
- 25.George JM, Fiori S, Fripp J, Pannek K, Bursle J, Moldrich RX, et al. Validation of an MRI Brain Injury and Growth Scoring System in Very Preterm Infants Scanned at 29- to 35-Week Postmenstrual Age. AJNR Am J Neuroradiol. 2017;38(7):1435–42. [DOI] [PMC free article] [PubMed] [Google Scholar]
- 26.Synnes A, Luu TM, Moddemann D, Church P, Lee D, Vincer M, et al. Determinants of developmental outcomes in a very preterm Canadian cohort. Archives of disease in childhood Fetal and neonatal edition. 2017;102(3):F235–F4. [DOI] [PubMed] [Google Scholar]
- 27.Dammann O, Naples M, Bednarek F, Shah B, Kuban KC, O’Shea TM, et al. SNAP-II and SNAPPE-II and the risk of structural and functional brain disorders in extremely low gestational age newborns: the ELGAN study. Neonatology. 2010;97(2):71–82. [DOI] [PMC free article] [PubMed] [Google Scholar]
- 28.Ford RM, Neulinger K, O’Callaghan M, Mohay H, Gray P, Shum D. Executive function in 7–9-year-old children born extremely preterm or with extremely low birth weight: effects of biomedical history, age at assessment, and socioeconomic status. Archives of clinical neuropsychology : the official journal of the National Academy of Neuropsychologists. 2011;26(7):632–44. [DOI] [PubMed] [Google Scholar]