

Abstract
Genome-wide profiling of histone modifications can reveal not only the location and activity state of regulatory elements, but also the regulatory mechanisms involved in cell-type-specific gene expression during development and disease pathology. Conventional assays to profile histone modifications in bulk tissues lack single cell resolution. Here, we describe an ultra-high throughput method, Paired-Tag, for joint profiling of histone modifications and transcriptome in single cells to produce cell-type-resolved maps of chromatin state and transcriptome in complex tissues. We used this method to profile five histone modifications jointly with transcriptome in the adult mouse frontal cortex and hippocampus. Integrative analysis of the resulting maps identified distinct groups of genes subject to divergent epigenetic regulatory mechanisms. Our single cell multi-omics approach enables comprehensive analysis of chromatin state and gene regulation in complex tissues and characterization of gene regulatory programs in the constituent cell types.
Editorial summary:
Paired-Tag offers a multiomics assay for joint profiling of histone modifications and gene expression in single nuclei; and is applied to mouse frontal cortex and hippocampus for measuring cell-type-resolved chromatin state and transcriptome.
Introduction
In a multi-cellular organism, virtually every cell type contains an identical copy of the same genetic material, but the epigenome, including state of DNA methylation and histone modifications, differs substantially between cell types1. Next-generation sequencing-based techniques, such as ChIP-seq2, DNase-seq3 and ATAC-seq4, have enabled the investigation of chromatin structure and histone modifications in many species5; however, conventional assays using bulk tissues as input do not resolve cell-type-specific epigenetic states. To overcome this barrier, a variety of epigenomic methods have been developed to measure gene expression6, high-order chromatin organizations7, chromatin accessibility8–10, histone modifications and transcription factors binding11–19, and DNA base modifications20–23 at single-cell resolution. High-throughput, single-cell analysis of transcriptome24,25, chromatin accessibility26,27 and DNA methylome28 one at a time or together29–32 have begun to allow the dissection of cell-type-specific transcriptional and chromatin structure in complex tissues.
Methods have been described to profile histone modifications in single cells one mark at a time16–19. However, different histone modifications vary greatly in their cellular specificity and relationships to cell-type-specific gene expression, leading to varying degrees of success in resolving cellular heterogeneity from complex tissues17. Thus, it is very difficult or nearly impossible to integrate datasets of multiple histone marks in different cell types from complex tissues. Moreover, to better understand the gene regulatory mechanisms, it is necessary to assess the transcriptional profiles along with chromatin states from the same cells33. Thus, a single-cell approach that can jointly assay both histone modifications and gene expression would be highly desired.
Here we present a highly scalable strategy, Paired-Tag (parallel analysis of individual cells for RNA expression and DNA from targeted tagmentation by sequencing), for joint analysis of gene expression and histone modifications in single cells. Paired-Tag extends a technique that we previously reported, Paired-seq31, for co-assay of open chromatin and gene expression in single cells, by adapting the CUT&Tag strategy14. To demonstrate the utility of Paired-Tag, we used it to map transcriptome and histone modifications jointly from the adult mouse frontal cortex and hippocampus, and generated, for the first time, cell-type-resolved maps of chromatin state and transcriptome for 22 mammalian brain cell types, providing insight into the gene regulatory programs of different groups of genes in these cell types.
Results
Overview of Paired-Tag
Paired-Tag includes the following steps (Fig. 1a and Extended Data Fig. 1a). First, permeabilized nuclei are incubated with antibodies against specific histone modifications to target the binding of protein A-fused Tn5 to chromatin. Tagmentation reaction and reverse transcription (RT) are then sequentially performed. Specifically, reactions are carried out in 12 different wells, each with a well-specific DNA barcode included in the transposase adaptors and RT primers, to label different samples or replicates (1st round of barcodes). Next, a ligation-based combinatorial barcoding strategy34 is used to introduce the 2nd and 3rd rounds of DNA barcodes to the nuclei, by sequentially attaching well-specific DNA barcodes to the 5’-end of both chromatin DNA fragments and cDNA from RT in 96-well plates. Finally, the barcoded nuclei are divided into sub-libraries and lysed, the chromatin DNA and cDNA are purified, amplified and split into two sequencing libraries, one for each modality (Supplementary Table 1 and Methods).
Fig. 1 |. Overview of Paired-Tag.
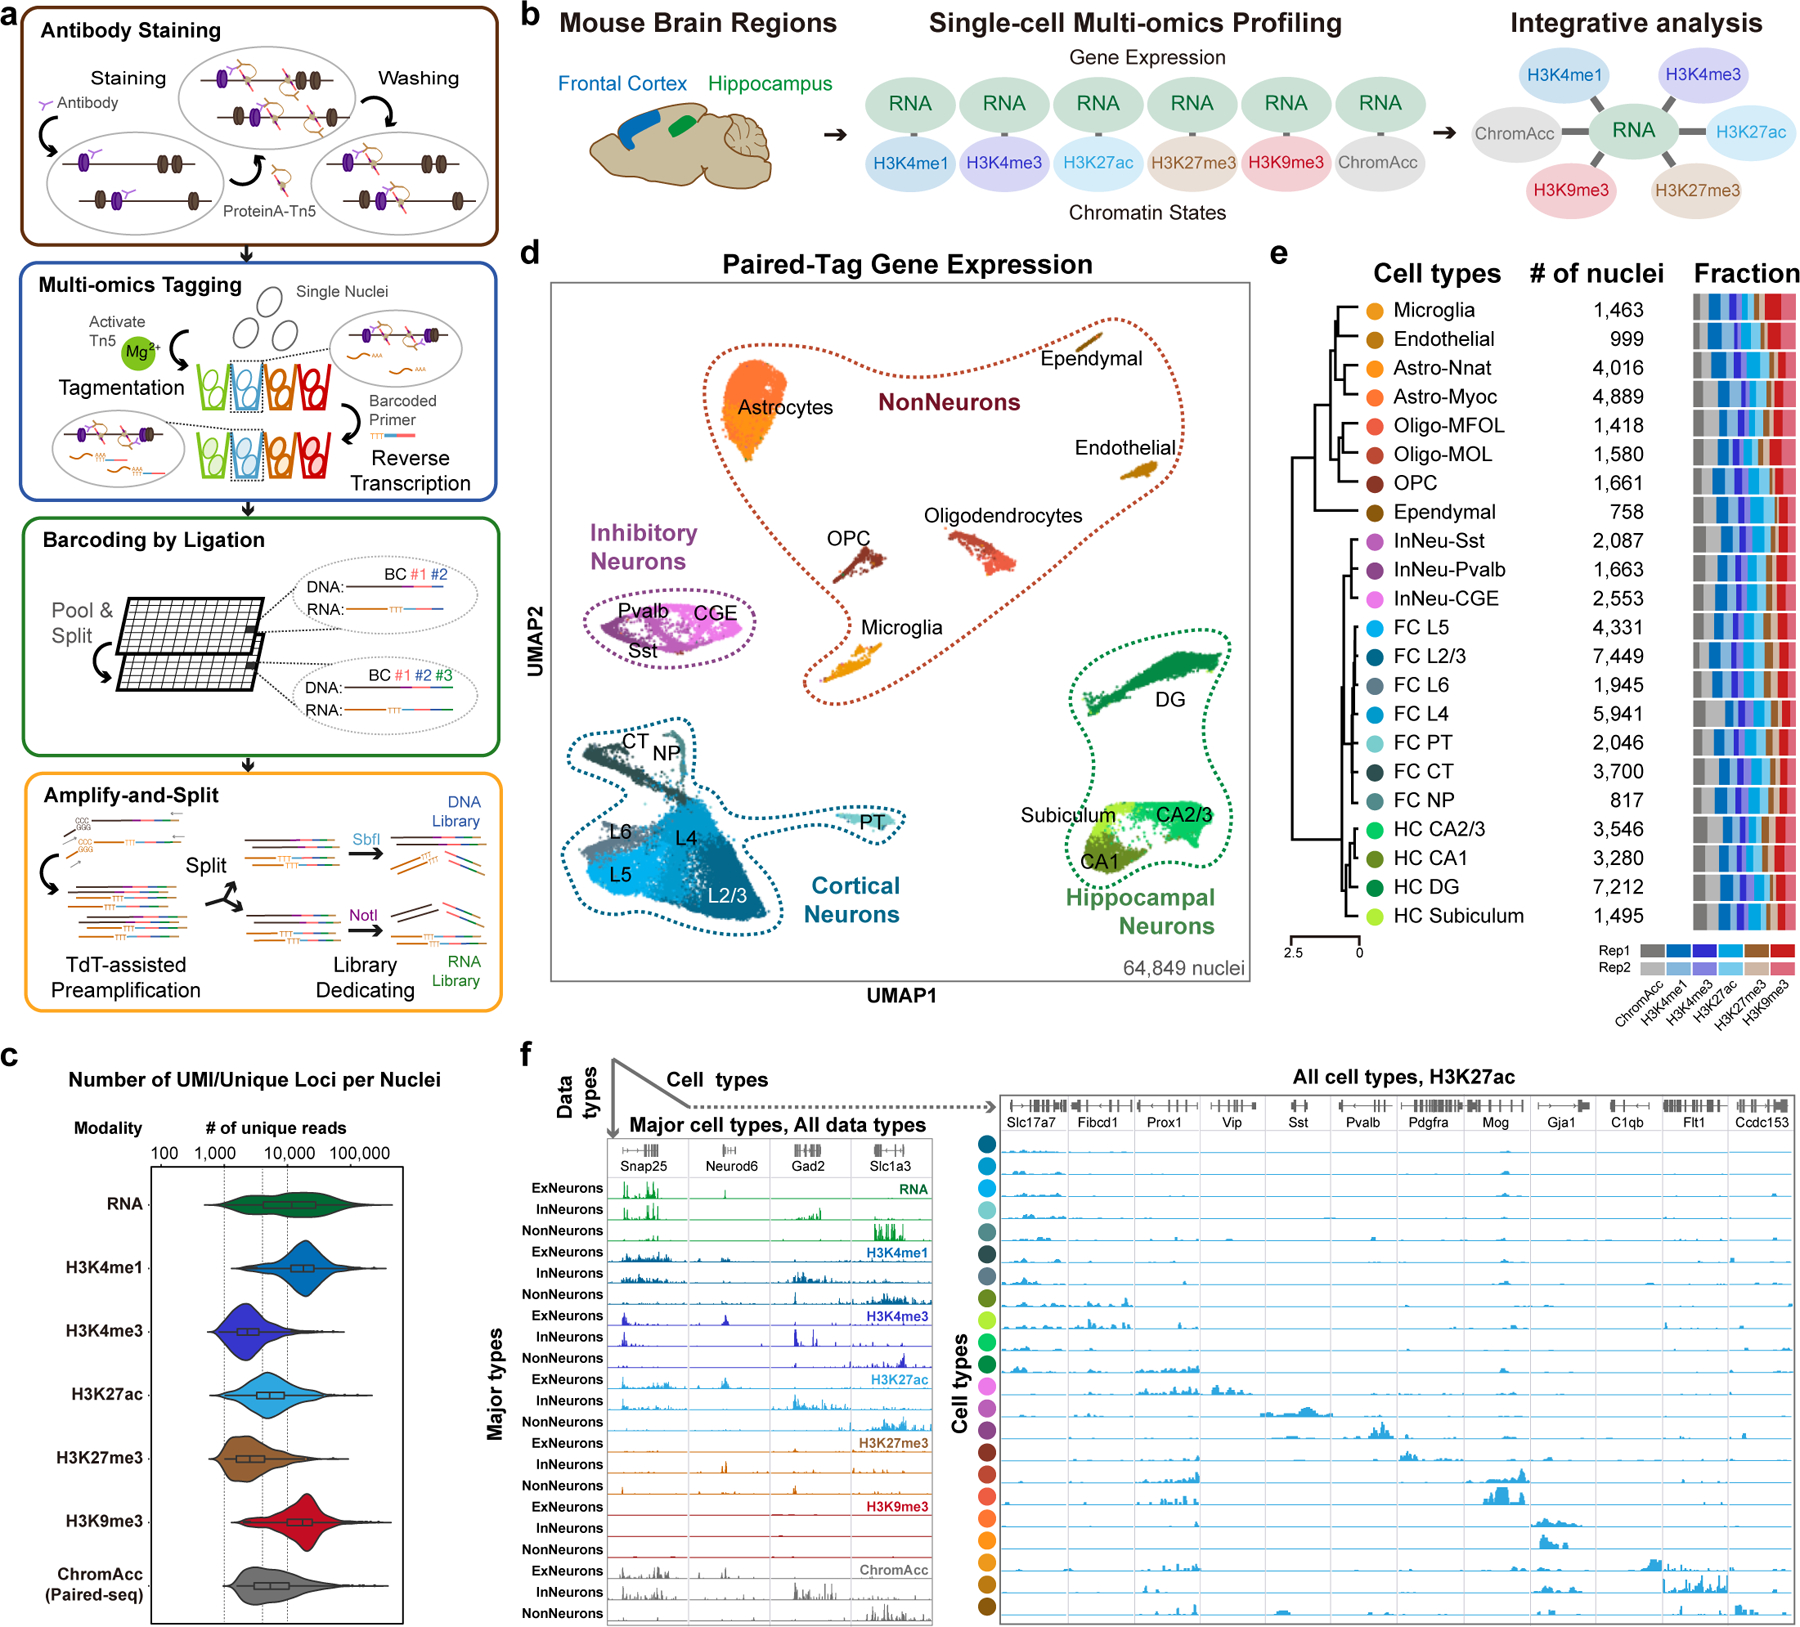
a, Schematic of Paired-Tag workflow. b, Single-cell, joint analysis of histone modifications and transcriptome in adult mouse frontal cortex and hippocampus. Paired-Tag assays were performed with antibodies against H3K4me1, H3K27ac, H3K27me3 or H3K9me3. Paired-seq assay was also performed with the same tissue samples (ChromAcc: chromatin accessibilities). The transcriptomic profiles from each paired dataset were then used to annotate each cell cluster. c, Violin plots showing the unique loci (DNA) or UMI (RNA) per nuclei of representative deeply sequenced Paired-Tag and Paired-seq datasets. The violin plots were drawn from lower quartile (Q1) to upper quartile (Q3) with the middle line denote the median, whiskers with maximum 1.5 IQR, outliers were indicated with dots. n= 1,651 (RNA), 865 (H3K4me1), 1,002 (H3K4me3), 786 (H3K27ac), 558 (H3K27me3), 1,054 (H3K9me3) and 2,472 (ChromAcc) cells from dissections of 2 different mice. d, UMAP embedding showing the clustering of single nuclei from Paired-Tag and Paired-seq transcriptomic profiles. Each dot represents an individual nucleus profiled by Paired-Tag and Paired-seq and was colored according to the assigned cell cluster according to (e). e, Numbers of nuclei from the 22 mouse brain cell types and the fraction of nuclei from each replicate. Cell clusters were annotated based on marker genes expression. PT: pyramidal tract excitory neurons; CT: corticothalamic excitatory neurons; NP: near projecting excitatory neurons. f, Representative genome browser views of aggregated single-nuclei transcriptomic and the matched epigenetic profiles.
We first performed Paired-Tag with ~10,000 HeLa cells each with antibodies against H3K4me1, H3K27ac, H3K27me3 and H3K9me3, and compared the aggregate profiles of each histone modification with published ChIP-seq datasets of this cell line35: ~60% of called peaks from Paired-Tag overlapped with those identified from ChIP-seq datasets generated from the same cell line (65.9% for H3K4me1, 65.7% for H3K27ac, 59.6% for H3K27me3 and 64.0% for H3K9me3). The genomic distributions of the histone modification signals also correlated well (Pearson’s Correlation Coefficients (PCC): 0.70–0.86 for different histone marks, Extended Data Fig. 1b–d). The gene expression levels measured from Paired-Tag were highly correlated with nuclei RNA-seq data generated in-house from the same cell line (PCC: 0.96, Extended Data Fig. 1e). These data confirm that Paired-Tag produces chromatin and transcriptome profiles that match with ChIP-seq and RNA-seq from bulk-cell samples.
Single-cell co-assay of histone modifications and transcriptome in mouse cortex and hippocampus
To demonstrate the utility of Paired-Tag for analysis of heterogeneous tissues, we applied it to snap-frozen frontal cortex and hippocampus from adult mice, focusing on five histone marks, namely H3K4me1, H3K4me3, H3K27ac, H3K27me3 and H3K9me3 (Fig. 1b and Extended Data Fig. 2a). The aggregate single-cell Paired-Tag DNA profiles and bulk profiles generated in parallel showed excellent agreement (PCC: 0.79–0.96, Extended Data Fig. 2b). Paired-Tag generated datasets with high mapping rates: >95% of H3K4me1 and H3K27ac, ~72% of H3K27me3, and >85% of H3K4me3, H3K9me3 and RNA reads can be mapped to the reference genome, with an estimated random barcode collision rate of ~8.2% (Extended Data Fig. 2c, d). To estimate the library complexities of Paired-Tag datasets, we sequenced a fraction of representative nuclei to near saturation (PCR duplication rates: 81.4% for H3K4me1, 81.2% for H3K4me3, 80.2% for H3K27ac, 57.8% for H3K27me3, 58.2% for H3K9me3, 63.6% for RNA). We recovered up to ~20,000 unique loci mapped per nucleus for DNA profiles (median number of fragments per nucleus, H3K4me1: 19,332 and 17,357, H3K4me3: 2,571 and 2,046, H3K27ac: 4,460 and 4,543, H3K27me3: 2,565 and 2,499, H3K9me3: 16,404 and 18,497, for frontal cortex and hippocampus, respectively) and up to ~15,000 UMI per nucleus for RNA profiles with 85% of them assigned to genic regions (median numbers, 14,295 and 8,185 UMIs, corresponding to 2,400 and 1,855 genes, for frontal cortex and hippocampus, respectively) (Fig. 1c and Extended Data Fig. 2e–g). The histone modification profiles have a similar number of unique loci captured per nucleus as the recently developed CoBATCH17, and are higher than itChIP18 and HT-scChIP-seq19 (Extended Data Fig. 2e). The capture efficiency of nuclear RNA in Paired-Tag is also on par with other commonly used scRNA-seq assays, such as SPLiT-seq34 and 10X scRNA-seq (Extended Data Fig. 2g).
Histone modification maps of cortical and hippocampal cell types in adult mouse brain
We next sequenced a total of ~70,000 nuclei to moderate depth. In parallel we also generated Paired-seq31 data for ~20,000 nuclei from the same tissues. After filtering out nuclei with low sequence coverage and removing potential doublets (Methods), we recovered 64,849 nuclei with matched DNA and RNA profiles (Extended Data Fig. 2h–k, and Supplementary Table 2). Compared to 10X scRNA-seq, Paired-Tag RNA datasets have more reads mapped to genic regions and captured more intronic reads (Extended Data Fig. 2k, l). We clustered these nuclei into 22 cell groups based on their transcriptome profiles and assigned them to seven cortical neuron types (Snap25+, Satb2+, Gad1−), four hippocampal neuron types (Snap25+, Slc17a7+ or Prox1+), three inhibitory neuron types (Gad1/Gad2+) and eight non-neuron cell types (Snap25−) including oligodendrocyte precursor cells (OPC), two groups of oligodendrocytes (OGC), two groups of astrocytes (ASC), microglia, endothelial and ependymal cells (Fig. 1d–f, Extended Data Fig. 3a–c and Supplementary Table 3). We also compared our transcriptomic profiles with previously published scRNA-seq datasets from the same brain regions (reference dataset)36, and found excellent agreement (Extended Data Fig. 3d–g). Specifically, 16 of the 22 clusters can be uniquely assigned to a corresponding cluster (or several closely related sub-clusters) of reference dataset. Some of the sub-clusters here matched multiple sub-clusters of the reference dataset, which includes: the FC L5 and L6 matched with TEGLU10 and 20, the FC L2/3 and L4 matched TEGLU7,8, the CA1 and subiculum clusters in our datasets fell into two CA1 neuron groups (TEGLU21, 23 and 24) of the reference dataset (Extended Data Fig. 3e).
Comparison of histone modification- and transcriptome-based cell clustering
We also clustered the Paired-Tag profiles based on profiles of different histone marks (Fig. 2 and Methods). For fair comparisons, we first performed independent cell-clustering based on transcriptome profiles for each Paired-Tag dataset (Extended Data Fig. 3b). As expected, reduced cell number lowered the resolution in identifying cell types: for H3K4me1, H3K27ac and H3K9me3 datasets (>11,000 nuclei), 18 clusters were revealed (four closely related cell subtypes identified from the 65k merged dataset were grouped together: FC L6 were merged with FC L5, HC Subiculum cells were merged with HC CA1, InNeu-Sst and InNeu-Pvalb were classified as InNeu-MGE, and two oligodendrocytes subtypes were identified as one group); for H3K27me3 dataset with 6,534 nuclei, 14 clusters were revealed (FC NP, HC CA2/3, InNeu-Pvalb and endothelial were further mixed with closely related cell groups). Next, with histone modifications H3K4me1-, H3K4me3- and H3K27ac- based clustering, we revealed 18, 3 and 15 clusters, respectively (Extended Data Fig. 4a–c). Sixteen groups of H3K4me1-based and 12 of H3K27ac-based clustering matched well with those from RNA-based clustering (Fig. 2c). Two cortical neuron clusters (L4 and L5) in H3K4me1- and H3K27ac-based clustering matched with L2/3, L4 and L5 groups of RNA-based clustering. Additionally, RNA-based clustering can further separate astrocytes subgroups; in the H3K27ac dataset, RNA profiles can identify FC NP, HC CA1 and CA2/3 from FC CT and HC CA groups of DNA-based clustering (Fig. 2c). For promoter histone mark H3K4me3, only neuronal cells from two different brain regions and the non-neurons can be distinguished (Extended Data Fig. 4b). For H3K27me3-based clustering, all cortical excitatory neurons formed a single cluster (Extended Data Fig. 4d). For H3K9me3, only the major non-neuron cell types can be separated, while all neuronal cell types were grouped together as a single cluster (Extended Data Fig. 4e). These results suggest that cell-clustering based on Paired-Tag histone modification profiles varies considerably depending on the histone marks used, that the repressive histone marks do not resolve the cell types as well as the active histone marks H3K4me1 and H3K27ac but better than the promoter mark H3K4me3 (Extended Data Fig. 4f, g).
Fig. 2 |. Histone modification-based cell-clustering recapitulate transcriptomic -based cell clustering with varying degrees of success.
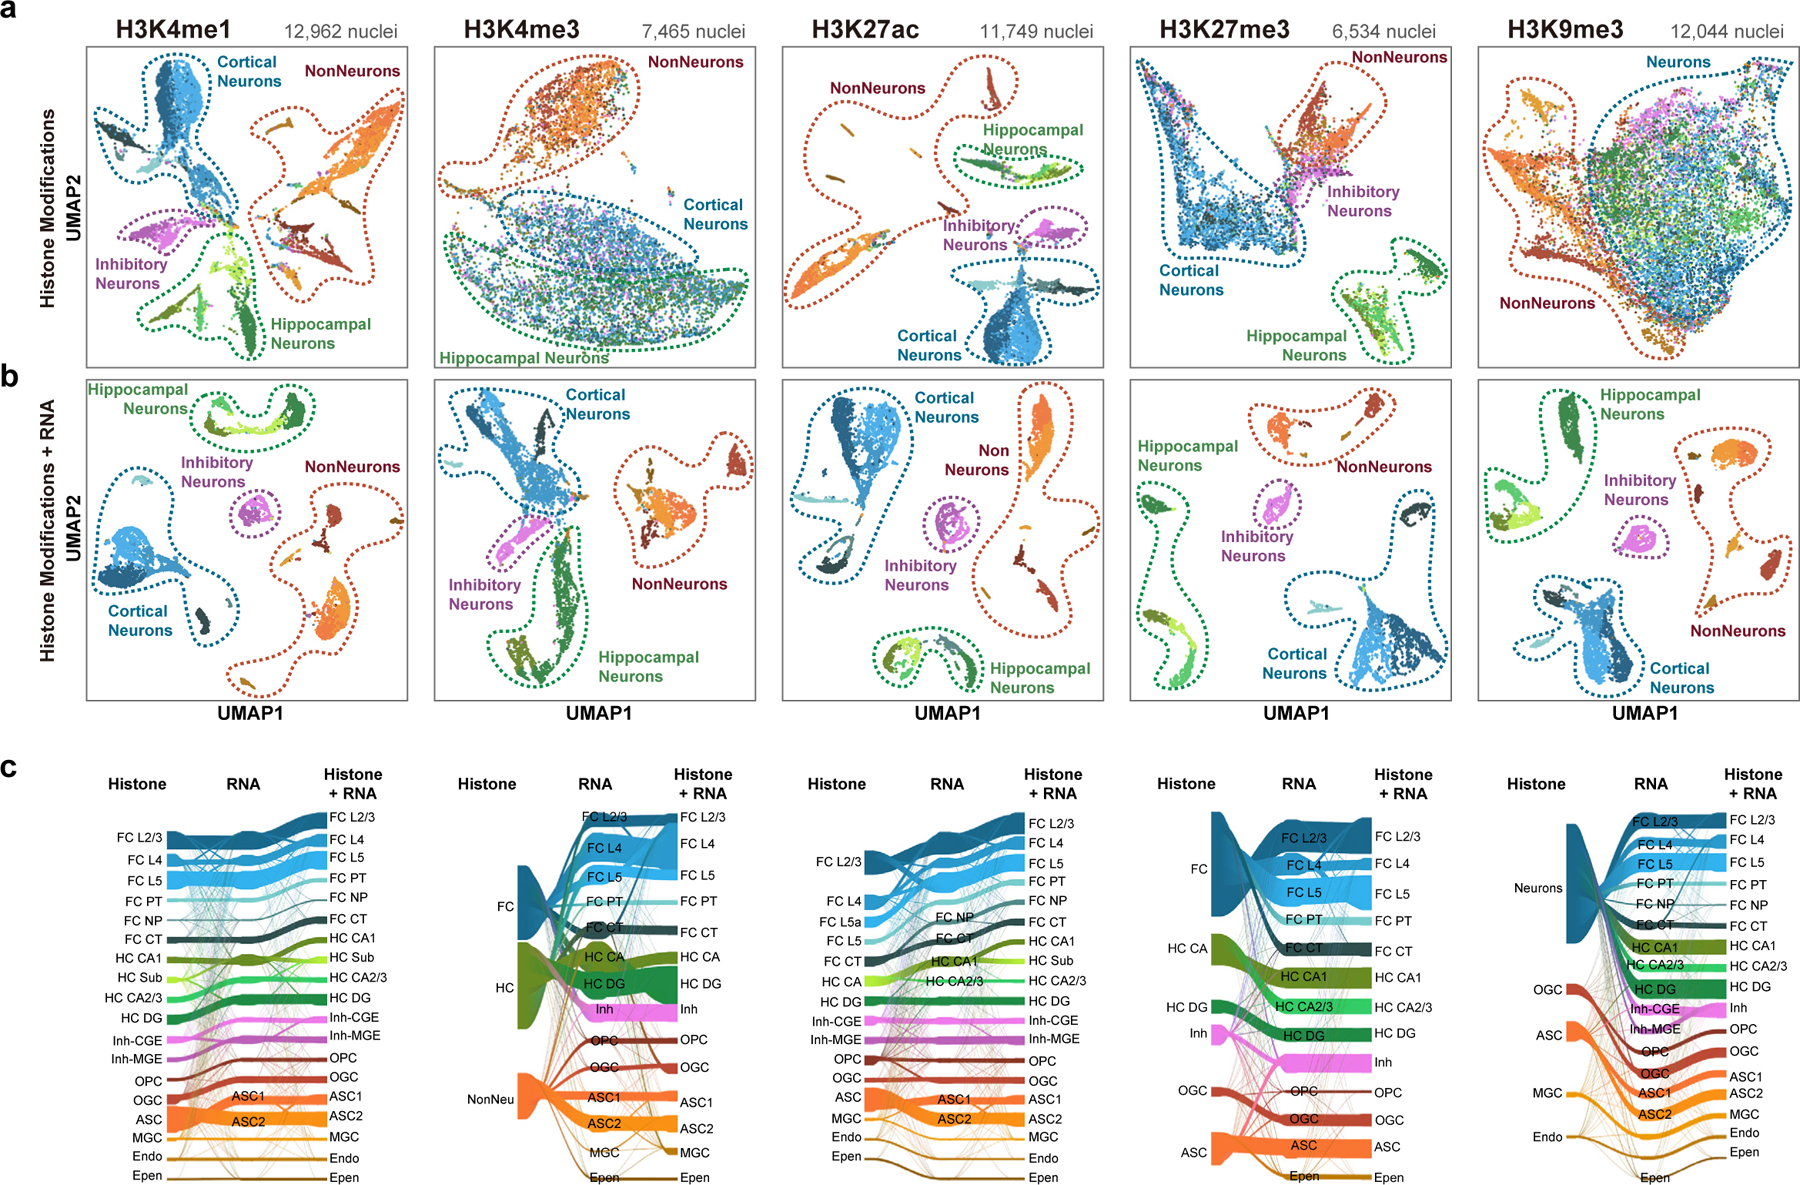
a, UMAP-embedding from single-nucleus histone modification profiles. b, UMAP-embedding from single-nucleus joint histone modification and nuclear transcriptome profiles. Each dot represents an individual nucleus profiled by Paired-Tag and was colored by cell type annotations from the joint clustering. c, Sankey plots showing the overlap between cell clustering based on Paired-Tag histone modification profiles, RNA profiles and joint modalities for H3K4me1, H3K4me3, H3K27ac, H3K27me3 and H3K9me3 DNA datasets.
We further performed joint clustering based on histone modification and gene expression profiles from the same cells (Fig. 2b and Methods). Generally, joint clustering with the two modalities identified more cell groups for most histone marks (Fig. 2c). For example, we identified FC NP and astrocyte subgroups, which are presented in RNA-based clustering of H3K4me1 and H3K27ac Paired-tag datasets but absent from the corresponding histone mark-based clustering results (two astrocytes subtypes were grouped together in H3K4me1 and H3K27ac datasets, FC NP were merged with FC-CT in H3K27ac dataset); on the other hand, we identified the Subiculum cell group by H3K4me1 DNA-based clustering, but not from RNA-based clustering. Interestingly, for H3K27ac datasets, the Subiculum group was missing from both DNA and RNA groups and joint clustering of both modalities helped to identify them. For H3K27me3, the histone modification profiles can only separate major cell groups and thus, the joint clustering mainly recapitulated the same cell clustering as RNA-based analysis. For H3K9me3 and H3K4me3, the resolution of joint clustering was even poorer than RNA-based clustering alone, as the histone signal can only separate neurons from non-neuron cells or neurons from different regions.
The inconsistency of cell clustering based on different histone marks indicates that it is important to use the transcriptome profiles to construct the cell-type-specific epigenome maps. We therefore generated genome-wide maps of each histone modification along with gene expression profiles in each of the 22 mouse brain cell types identified based on clustering of the RNA-components of Paired-Tag datasets (Fig. 1f). To facilitate the dissemination of these maps, we set up a web portal (http://catlas.org/pairedTag) to enable interactive exploration of the chromatin state in each brain cell type.
Integrative analysis of chromatin states and gene expression at gene promoters across different brain cell types
To investigate the relationship between chromatin states and cell-type-specific gene expression, we aggregated the Paired-Tag signals of each histone modification at annotated gene promoters (−1,500 bp to +500 bp) in each of the brain cell types. For this analysis, we mainly examined the 18 cell groups with at least 50 cells and at least 50,000 combined unique reads for all molecular modalities. A total of 17,398 genes (GENCODE GRCm38.p6) with sufficient levels of transcription (RPKM > 1 in at least one cell type) or promoter occupancy (CPM > 1 for any histone mark in at least one cell group, and Methods) were retained for subsequent analysis. Using K-means clustering, we categorized these gene promoters into seven groups with distinct combinations of histone modification: class I promoters appeared to be repressed by H3K9me3 (13.1% of all tested genes), class II-a and II-b groups were associated with the polycomb repressive histone mark H3K27me3 (9.2% of all tested genes), and the remaining four groups of promoters were associated with variable levels of active histone marks H3K4me1 and H3K27ac (77.6% of all tested genes) (Fig. 3a–c, Extended Data Fig. 5a–c and Supplementary Table 4).
Fig. 3 |. Integrative analysis of chromatin states at promoters and gene expression across mouse brain cell types.
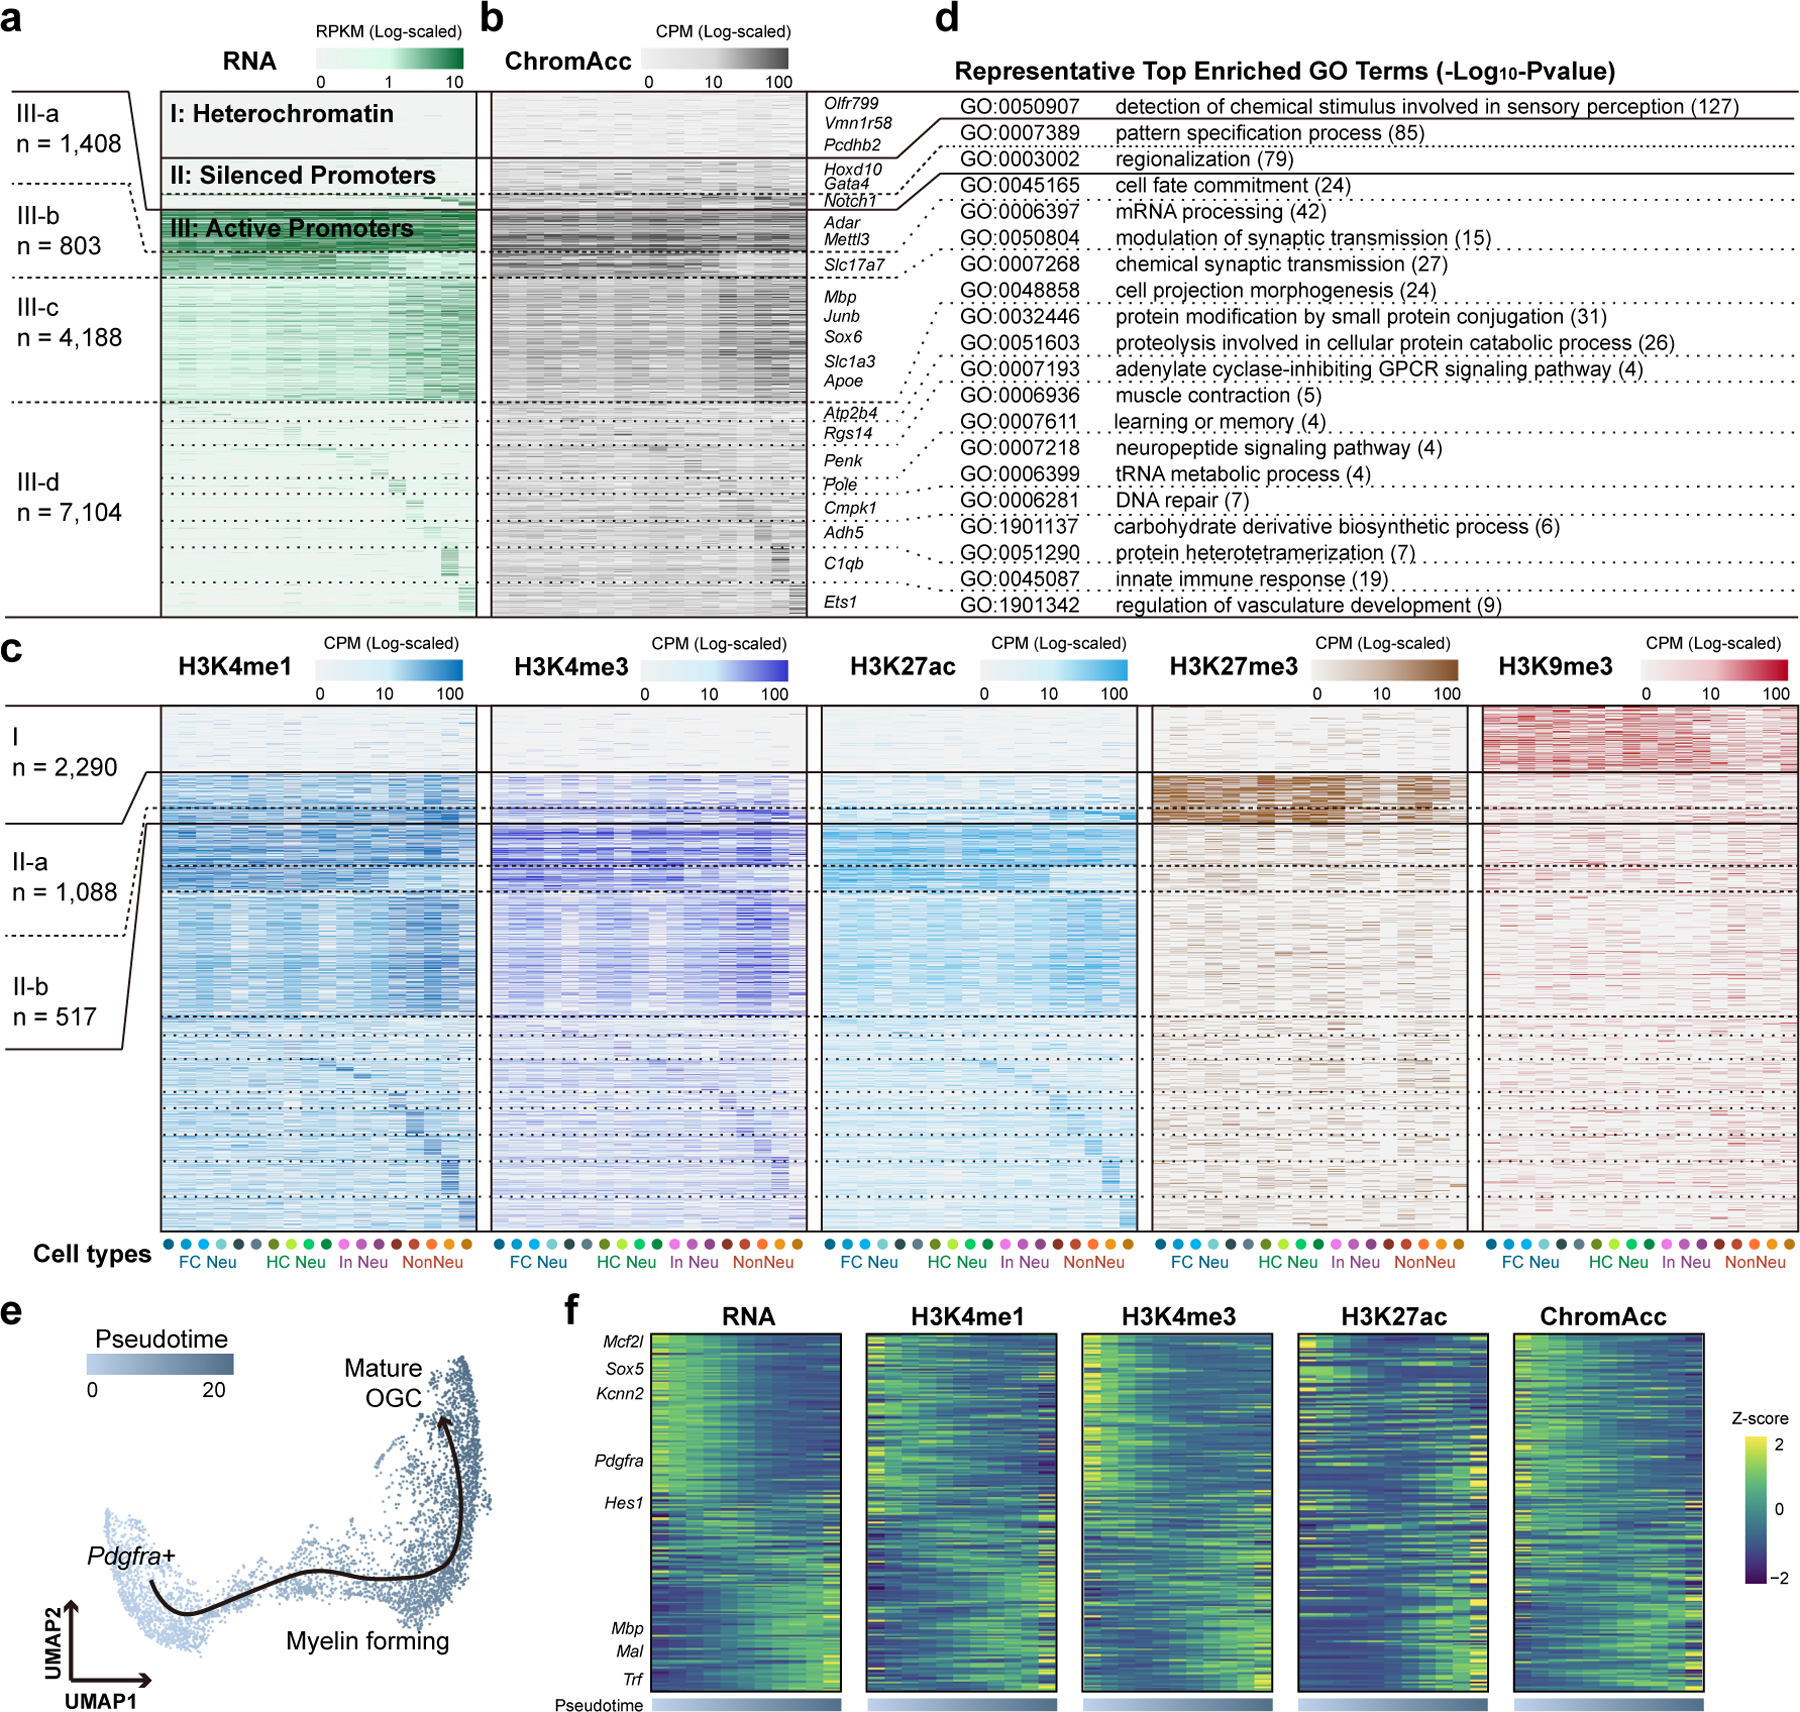
a, Heatmap showing the (a) transcript levels of genes with detected matched histone modification profiles for each mouse brain cell type. Cell types were indicated with colored dots below and the color of the dots are the same as in Fig. 1d. b, c, Heatmaps showing the matched (b) chromatin accessibility and (c) histone modification levels for the promoters of corresponding genes in (a). Genes were grouped using K-means clustering based on both expression and histone modification levels of H3K27ac, H3K27me3 and H3K9me3. c, Top enriched GO terms for genes in each category of (a). e, UMAP embedding showing the trajectory of oligodendrocyte maturation. Each dot represents a single nucleus and colored by pseudotime. f, Heatmaps showing the gene expression levels, promoter histone modification levels and promoter chromatin accessibility of differentially expressed genes along the pseudotime.
We carried out Gene Ontology (GO) analysis and found distinct functional categories of genes within each group (Fig. 3d and Supplementary Table 5). For example, genes in class I were strongly enriched for sensory-related pathways, including olfactory receptor (OR) genes (Olfr, 647 of 730 detected) and vomeronasal (Vmnr, 189 of 201 detected) receptor genes. OR genes were previously shown to be associated with heterochromatin marks during the process of OR choice in olfactory sensory neurons37. Our data suggest that OR genes are silenced by similar mechanisms in the frontal cortex and hippocampus (Extended Data Fig. 5d). H3K27me3-repressed genes were further divided into two groups: class II-a genes were repressed in all cell clusters and class II-b genes repressed in a more restricted manner. GO analysis revealed that II-a group genes were enriched for terms of general developmental processes such as pattern specification process and embryonic organ development, while II-b group genes were enriched for terms including morphogenesis of an epithelium (Fig. 3d, Extended Data Fig. 5e, f and Supplementary Table 5). Genes in III-a group were characterized by active chromatin state at promoters in all cell types (10.4% of class III genes), while genes in III-b group were expressed in all neuronal cell types (5.9% of class III genes) and genes in III-c group were glial-expressed (31.0% of class III genes). Group III-d genes (52.6% of class III genes) were marked by active chromatin state in a cell-type-specific manner, with corresponding cell-type-specific expression patterns (Fig. 3a–c). These genes were enriched for GO terms with more specific cellular processes: for example, hippocampal neuron-expressed genes were enriched for learning or memory and microglia-expressed genes were enriched for inflammatory response (Fig. 3d and Supplementary Table 5). We also carried out pseudotime analysis on oligodendrocyte lineages based on the transcriptome profile and assigned the promoter chromatin states to the differentially expressed genes (Fig. 3e, Extended Data Fig. 5g, h and Methods). The chromatin accessibilities and densities of active chromatin marks (H3K4me1, H3K4me3 and H3K27ac) are concordant with expression levels of these genes (Fig. 3f). For example, Sox5 and Pdgfra were highly expressed in progenitor populations, agreeing with the role of Sox5 in activating Pdgfra expression to maintain the immature state of oligodendrocyte progenitor cells38. These results demonstrated the utility of Paired-Tag in studying epigenetic regulatory programs during development and cell differentiation.
Integrative analysis of chromatin state at distal elements across brain cell types
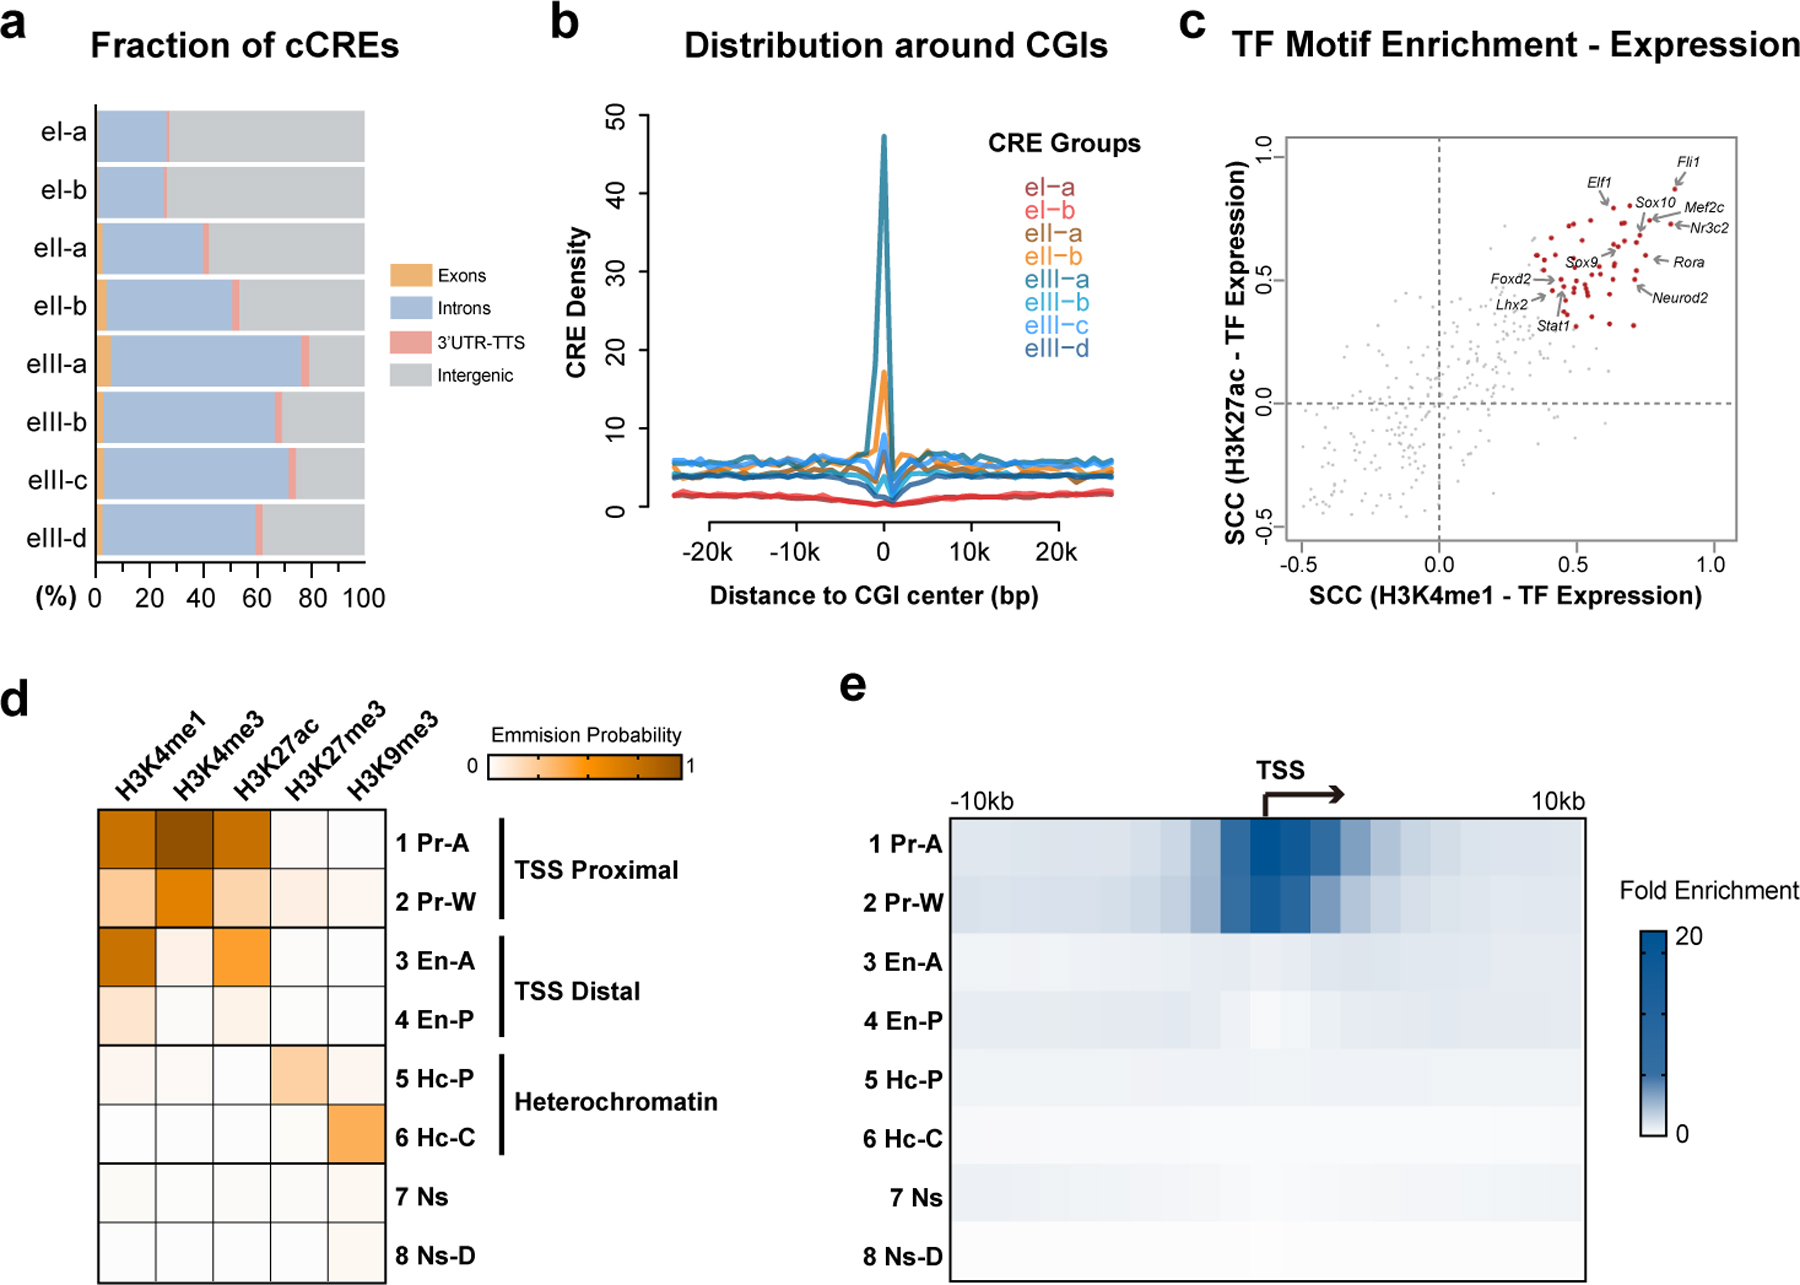
Cis-regulatory elements (CREs) are marked with highly cell-type-specific chromatin states and strongly correlate to cell-type-specific gene expression1. Recently, a comprehensive analysis of chromatin accessibility from the adult mouse cerebrum identified 491,818 candidate CREs (cCREs)39. We found that 286,168 (58.2%) distal CREs from this list showed sufficient levels of Paired-Tag signals in at least one cell group and one or more histone marks (CPM > 1, and more than 1,500 bp upstream and 500 bp downstream away from the transcription start sites, TSS). To characterize the chromatin state of these candidate CREs across different brain cell types, we again performed K-means clustering with the aggregate Paired-Tag signals of different histone marks in each of the 18 cell clusters defined above (Methods). We categorized these candidate CREs into 8 groups: two were marked by H3K9me3 in either all cell clusters (class eI-a, 16.3% of all CREs) or selectively in neuronal cells (class eI-b, 4.9% of all CREs), two were marked with H3K27me3 (eII-a, 5.5% and eII-b, 3.1% of all CREs) primarily in all neuronal cell clusters or in a more restricted manner (eII-b elements). The remaining four groups (class eIII-a to eIII-d) were marked by variable levels of H3K4me1 and H3K27ac modifications in different cell clusters (Fig. 4a–c and Supplementary Table 6). As expected, negligible H3K4me3 signals were detected for these promoter-distal cCREs (Fig. 4a). Similar to the promoter groups, the sub-class of cCREs with H3K27ac mark in one or a few cell groups comprised the largest fraction (class eIII-d, 37.1% of all CREs). H3K9me3-marked cCREs reside preferentially in intergenic regions (eI-a and eI-b), while cCREs marked by relatively invariable H3K4me1 and H3K27ac levels tend to reside in genic regions (eIII-a) (Extended Data Fig. 6a). Class eII-b cCREs were significantly enriched for CpG islands (CGI) regions (5.4%, p < 2.2×10⁻¹⁶) and eII-a cCREs were less enriched (2.0%, p = 0.002). The two H3K9me3-marked groups were depleted from CGI regions (0.16% and 0.12%, p < 2.2×10⁻¹⁶). For the active cCRE groups, class eIII-a cCREs displayed the highest enrichment for CGI regions (14.1%, p < 2.2×10⁻¹⁶) while the other sub-classes of eIII cCREs were not (Extended Data Fig. 6b).
Fig. 4 |. Characterization of chromatin state at distal candidate cis-regulatory elements across brain cell types.

a-c Heatmaps showing the modification levels of (a) active histone marks (H3K4me1, H3K4me3, H3K27ac), (b) repressive histone marks (H3K27me3, H3K9me3) and (c) chromatin accessibility of candidate CREs in each mouse brain cell type. The cCREs were grouped using K-means clustering based on histone modification signals (H3K27ac, H3K27me3 and H3K9me3) across different cell types. Cell types were indicated with colored dots below and the color of the dots are same as in Fig. 1d. d, Top enriched de novo motifs and GO terms for cCREs in different classes. e, Heatmap showing the enrichment of known transcription factor motifs for cCREs of each class in (a-c). cCREs in eIII-d group were further separated by their densities in each cell type, indicated by the colored dots left side. The color of the dots is the same as Fig. 1d. Each column represents a TF motif, colored by -Log10(P-value) and ordered according to K-means clustering. f, Boxplots showing genomic coverage of chromHMM chromatin state. The boxes were drawn from lower quartile (Q1) to upper quartile (Q3) with the middle line denote the median, whiskers with maximum 1.5 IQR. n = 22 cell types. g, Representative genome browser view of chromHMM chromatin states on marker genes. Chromatin states were colored according to (f). h, Heatmap showing the fraction of variable bases in different chromatin states of FC L2/3 compared to the other 21 cell clusters.
To identify potential transcription factors that act on the above classes of cCRE, we performed de novo motif enrichment analysis (Fig. 4d). The heterochromatin associated eI-a and eI-b groups cCREs were enriched for recognition motif of well-known transcriptional repressors EVX1 and MAFG, which play a critical role in embryogenesis40 and in the central nervous system41, respectively (Fig. 4d). The two polycomb-repressed cCRE groups eII-a and eII-b were enriched for LHX motifs and the group eIII-d cCREs with dynamic H3K27ac across all clusters enriched for motif matched with CTCF recognition (Fig. 4d). We also performed enrichment analysis of known TF motifs followed by K-means clustering and revealed distinct modules (Fig. 4e and Supplementary Table 7). For example, the heterochromatin (eI-a group) and inhibitory neuron groups (eIII-d) were enriched for the Ascl1 motif. Ascl1 can function as a pioneer factor targeting closed chromatin to activate the neurogenic gene expression programs42 as well as to induce the generation of GABAergic neurons43.
To infer potential regulators for each cell lineage by leveraging the joint profiles, we calculated the TF motif enrichment in each cell type, and compared it to expression levels of the corresponding TF genes (Extended Data Fig. 6c). More than half of the TFs (65%) showed a positive correlation between gene expression levels and motif enrichment in the cCREs across different cell types (Supplementary Table 8). For example, one of the top-ranked TFs, Fli1, was restricted in microglia and endothelial cells. Fli1 is known to activate chemokines to mediate the inflammatory response in endothelial cells44 and recently found to be in a coordinated gene expression module associated with Alzheimer’s disease45. Other highly ranked TFs including Sox9/10, Mef2c and Neurod2, etc., known to play a critical role in the development of neuronal systems. We further characterized the chromatin states based on the five histone marks using chromHMM. Eight chromatin states were recovered, including active and weak promoters, active and primed enhancers, H3K27me3-associated- and H3K9me3- associated heterochromatins and two categories without detected signals from these 5 histone profiles (Fig. 4f, g and Extended Data Fig. 6d, e). The promoter regions are less variable compared to active enhancers across brain cell types. The H3K9me3-associated heterochromatin regions are generally invariable among all excitatory neuron cell types; in non-neuronal cells these chromatin regions adopt other chromHMM states (Fig. 4h).
Integrative analysis of chromatin state and gene expression connects distal candidate CREs to putative target genes
Distal regulatory elements including enhancers and silencers, control cell-type-specific transcriptional programs during development or in response to stimuli. Imaging-based tools and chromosome conformation capture techniques have been extensively used to elucidate the interplay between promoters and distal CREs46. Recently, efforts were made to predict putative targets for cell-type-specific enhancers from complex tissues using single-cell genomics tools47, but less attention was paid on the repressive CREs48,49. The epigenetic and transcriptional states from the same cells provide an excellent opportunity to connect both the candidate active and repressive cCREs to their putative target genes. We first identified putative promoter-CRE pairs based on co-occupancy of H3K4me1 reads between cCRE and TSS-proximal regions (−1,500 bp to +500 bp) across all cells. We then calculated the pairwise Spearman’s correlation coefficients (SCC) between the gene expression levels of the putative target genes and the histone mark levels of the cCREs across cell clusters (Fig. 5a and Methods). We identified 32,252 candidate CRE-gene pairs where H3K27ac levels at the distal cCREs positively correlated with gene expression, and 15,199 pairs of candidate CRE-gene where H3K27me3 levels at the cCREs negatively correlated with expression of linked genes (FDR < 0.05, Fig. 5b, c, Extended Data Fig. 7a–f, Supplementary Table 9 and Methods). Interestingly, a significant fraction of H3K27ac-associated cCRE-gene pairs were in common with the H3K27me3-associated cCRE-gene pairs (p < 2.2×10⁻¹⁶, 2,621 observed compared to 185 randomly expected) (Fig. 5d and Supplementary Table 9). The cCREs in these shared pairs tended to be in the eII-b group (Fig. 5e), and target genes of whom were enriched for development processes such as gliogenesis and forebrain development (Extended Data Fig. 7g). These results are consistent with the recent finding that transition between PRC2-associated silencers and active enhancers occurs during differentiation48. Despite the potentially shared fraction, CREs of the inactive pairs are more enriched in intergenic regions as well as are more distal to their targets (Extended Data Fig. 7h–j).
Fig. 5 |. Correlative analysis of chromatin state and gene expression links distal candidate cis-regulatory elements to putative target genes.
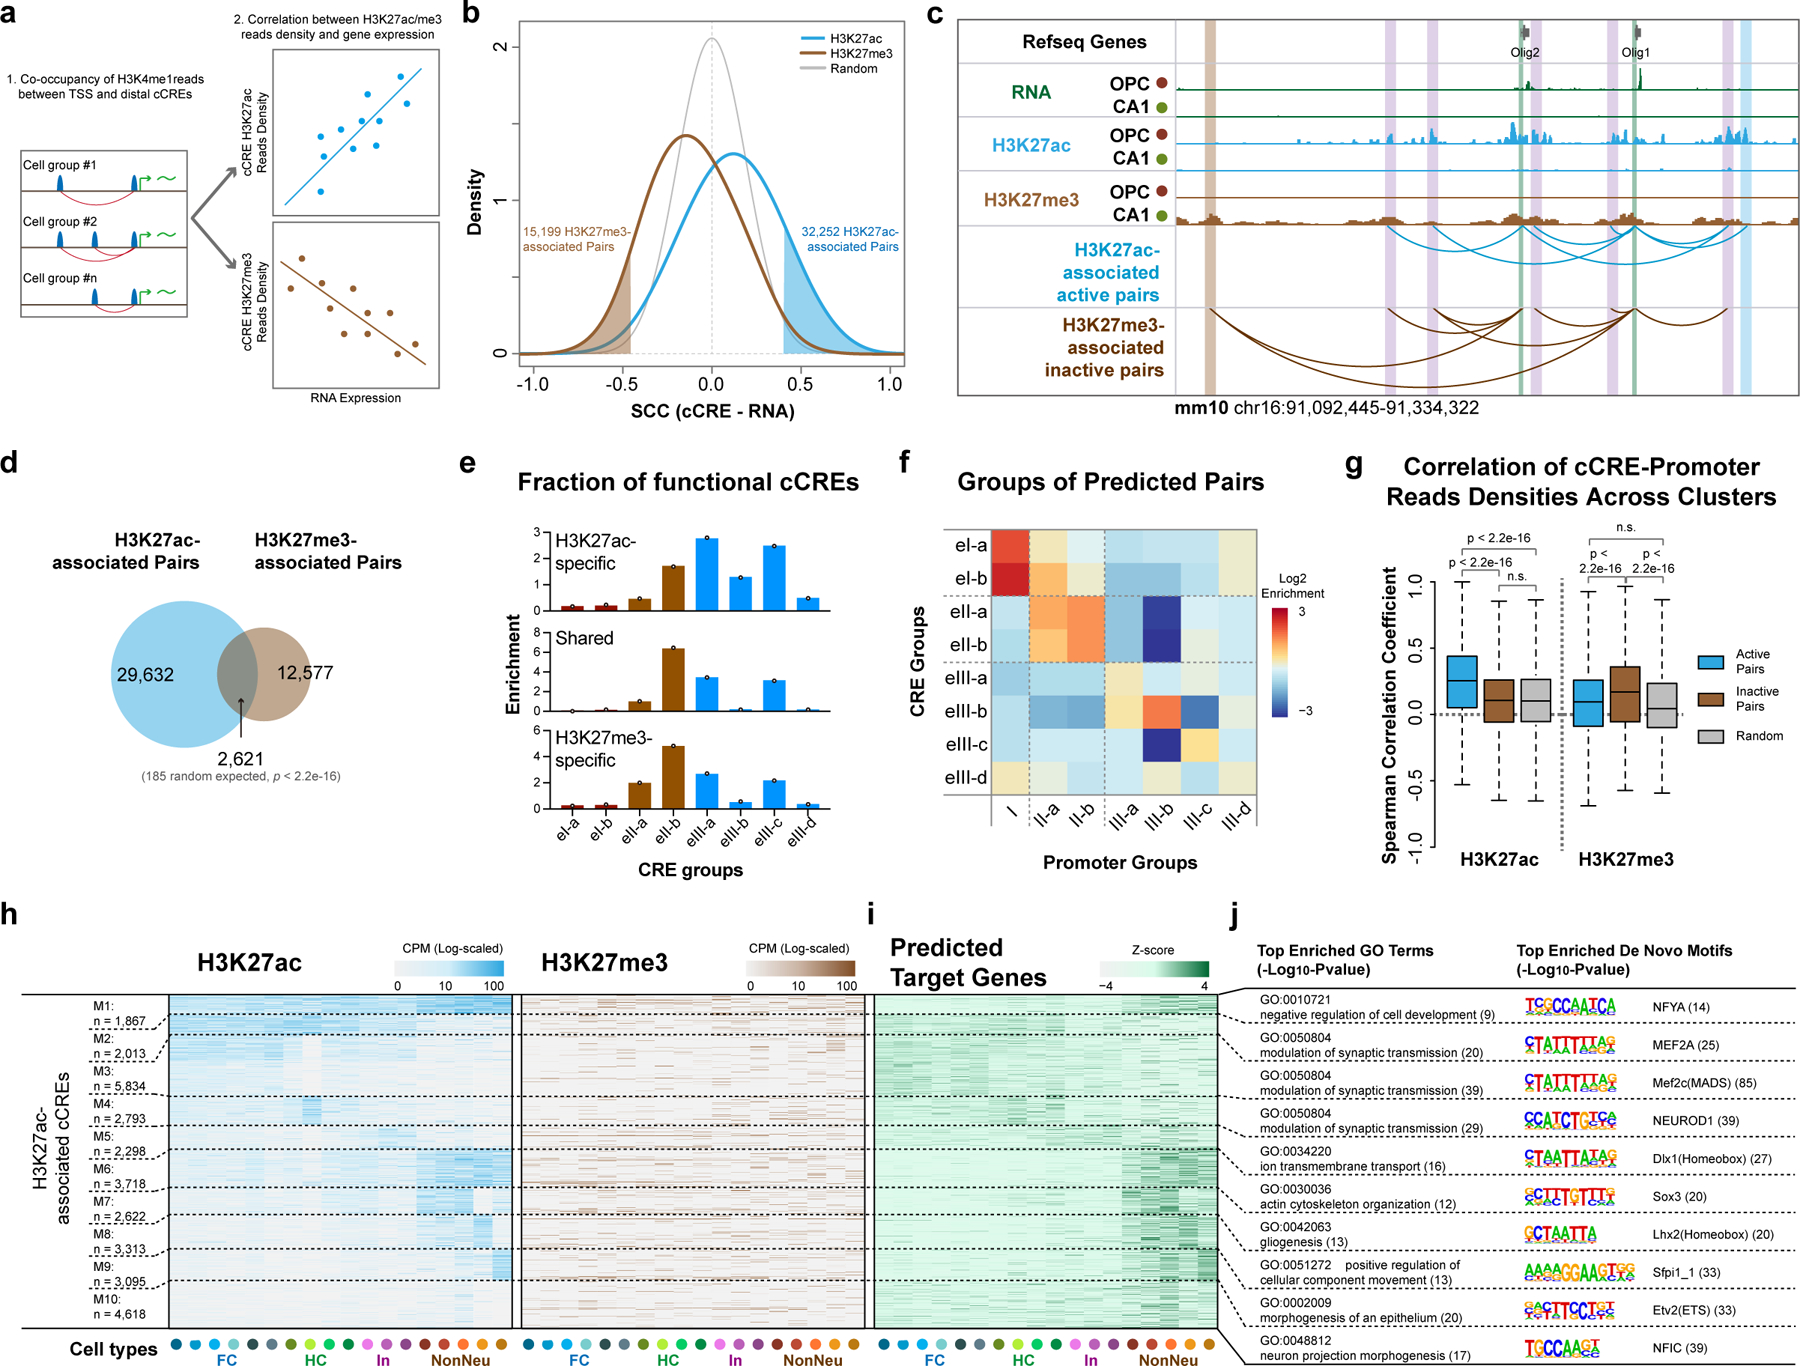
a, Schematics for identifying potential targets for cCREs. Putative cCRE-gene pairs were first determined by calculating the co-occupancy of H3K4me1 reads in gene promoter and distal cCRE regions. The Spearman’s Correlation Coefficients between expression levels of genes and H3K27ac or H3K27me3 levels of cCREs were then used to identify cCRE-gene pairs. b, Density plot showing the distribution of correlations between histone modification levels of cCREs and expression of potential target genes. The cutoffs (FDR = 0 .05) for identifying potential H3K27ac-associated active and H3K27me3-associated inactive cCRE-gene pairs are also indicated. c, Representative genome browser view of Olig1 and Olig2 gene locus, both H3K27ac- and H3K27me3-associated cCREs were shown. TSS-proximal regions are marked with green boxes and cCREs are indicated with blue (H3K27ac-specific), brown (H3K27me3-specific) or purple (shared) boxes. d, Venn diagram showing the overlap between predicted H3K27ac- and H3K27me3- associated cCRE-gene pairs. P-value, two-tailed Fisher’s exact test. e, Relative enrichment of the distribution in CRE groups of Fig. 4 for cCREs in H3K27ac-specific, shared and H3K27me3-specific pairs. f, Heatmap showing the enrichments of predicted targeted genes of each promoter group defined in Fig. 3a linked by cCREs of each CRE group defined in Fig. 4. g, Spearman’s Correlations Coefficients between reads densities of cCREs and promoters of putative target genes across cell types for H3K27ac and H3K27me3. P-value, two-tailed Wilcoxon signed-rank test. The boxes were drawn from lower quartile (Q1) to upper quartile (Q3) with the middle line denote the median, whiskers with maximum 1.5 IQR. n = 22 cell types. h, Heatmap showing the histone modification levels at cCREs with potential active roles in expression of putative target gene. cCRE were grouped using K-means clustering based on histone modification levels. i, Heatmap showing the expression levels of corresponding putative target genes of cCREs in (h). j, Top enriched Gene Ontology terms for genes in (i) and the top enriched de novo motifs for cCREs from each group in (h).
We next compared the categories of cCREs with those of their putative target genes. Interestingly, promoters of target genes tend to be in the similar group with cCREs: for example, target genes of class eII-a and eII-b cCREs were strongly enriched in promoters of class II-a and II-b genes (Fig. 5f). These genes are enriched in those with functions in development processes (Fig. 3c and Extended Data Fig. 5f). We then compared the chromatin state of cCREs with the promoters of the putative target genes: cCREs and promoters from the active pairs displayed higher concordance for their H3K27ac levels, but not for the inactive pairs; on the other hand, higher concordance for H3K27me3 levels was only observed from the inactive pairs (Fig. 5g and Extended Data Fig. 7k). We then grouped the candidate CREs with linked genes according to their H3K27- acetylation and methylation states (Fig. 5h, i, Extended Data Fig. 7l, m and Supplementary Table 10). Target genes of neuron-specific cCRE groups are enriched in GO terms including modulation of synaptic transmission, genes linked to cCRE groups of glial cells are enriched for terms including gliogenesis, morphogenesis of epithelium and neuron projection morphogenesis and so on (Fig. 5j). For the inactive pairs, only a small fraction showed strong cluster-specific enrichment of H3K27me3 and the concordant depletion of gene expression (M12-M14, Extended Data Fig. 7l–n). One of the transcription factors, Sox11, is essential for both embryonic and adult neurogenesis50, whose motifs showed a strong H3K27me3 signature in endothelial cells (M14).
Discussion
Here we report a high-throughput method for simultaneous profiling of histone modifications and gene expression in single cells. Paired-Tag detects both histone modifications and RNA transcripts in individual nuclei with an efficiency comparable to single-nucleus RNA-seq and single-cell ChIP-seq assays17–19,34. We also demonstrate the utility of Paired-Tag by applying it to the adult mouse frontal cortex and hippocampus, producing, the first of its kind, combined maps of five histone modifications and transcriptome for 22 cortical and hippocampal cell types. Through integrative analysis, we identified distinct epigenetic regulatory processes acting at different categories of genes and candidate CREs.
Paired-Tag enables the joint profiling of transcriptome and histone mark with a substantially lower cost for library construction compared to other commercial single-cell omics platforms. Compared to scATAC-seq or joint ATAC-gene expression assays, our method can reveal the functional states of cCREs to provide mechanistic insights of regulatory programs for each cell type from heterogeneous cellular environments. Computational methods have been developed for the integrated analysis of single-cell datasets from multiple modalities; however, it is still challenging for integration of different histone modifications with distinct biological features. The ability of Paired-Tag to achieve unbiased cell type classification from the transcriptional states provided a unique chance to integrate previous single cell atlases.
The proteinA-Tn5 strategy in Paired-Tag can also be adopted to droplet-based platforms, such as SNARE-seq30, to allow efficient generation of single-cell dual-omics profiles (Supplementary Note). While current Paired-Tag protocol survey only single histone marks with nuclear transcriptome, with additional modification, it should be possible to monitor multiple histone marks from the same cells, to help reveal the cross-talks and combinatorial effects of different histone marks during gene expression. In addition, the barcoding strategy here can be further extended to the analysis of other molecular modalities such as DNA base modifications and transcription factor binding.
Online Methods
Cell culture and processing
HeLa S3 (human, ATCC CCL-2.2) cells were cultured according to standard procedures in Dulbecco’s Modified Eagles’ Medium (ThermoFisher Scientific, 10569010) supplemented with 10% fetal bovine serum (ThermoFisher Scientific, 16000044) and 1% penicillin-streptomycin (ThermoFisher Scientific, 10378016) at 37 °C with 5% CO2. Cells were not authenticated nor tested for mycoplasma. To prepare nuclei, HeLa S3 cells were harvested by centrifugation, washed with PBS (ThermoFisher Scientific, 10010–23) and counted using BioRad TC20 cell counter. The cells were then resuspended in cold Nuclei Permeabilization Buffer (NPB: 10 mM Tris-HCl pH 7.4 [Sigma, T4661], 10 mM NaCl [Sigma, S7653], 3 mM MgCl2 [Sigma, 63069], 1X Protease Inhibitor [Roche, 05056489001], 0.5 U/µL RNase OUT [Invitrogen, 10777–019] and 0.5 U/µL SUPERase Inhibitor [Invitrogen, AM2694]) with 0.1% IGEPAL CA-630 (Sigma, I8896) and centrifuged for 10 min at 1,000 g, 4 °C and proceed to Paired-Tag experiments.
Processing of biospecimens
Male C57BL/6J mice were purchased from Jackson Laboratories at 8 weeks of age and maintained in the Salk animal barrier facility on 12-hr dark-light cycles with controlled temperature (20–22 °C) and humidity (30–70%), and with food ad libitum for four weeks before dissection. The frontal cortex and hippocampus were dissected and snap-frozen in dry ice. All protocols were approved by the Salk Institute’s Institutional Animal Care and Use Committee (IACUC).
Single-cell suspension were prepared from douncing of the frozen tissues, in Doucing Buffer with Protease/RNase Inhibitor cocktail (DBI: 0.25 M sucrose [Sigma, S7903], 25 mM KCl [Sigma, P9333], 5 mM MgCl2, 10 mM Tris-HCl pH 7.4, 1 mM DTT [Sigma, D9779], 1X Protease Inhibitor, 0.5 U/µL RNase OUT and 0.5 U/µL SUPERase Inhibitor) supplemented with 0.1% Triton-X 100 (Sigma T9284). The cell suspension was then filtered by 30 µm Cell-Tric (Sysmex) and spun-down for 10 min, 1,000 g at 4 °C. After washing the cell pellets with DBI and spun-down again, NPB with 0.2% IGEPAL CA-630 was added to resuspend the nuclei pellets and rotate for 10 min at 4 °C. The nuclei were counted by cell counter and proceed to Paired-Tag experiments immediately.
Annealing of sequence adaptors
Six microliters of each barcoded oligos (100 µM, Supplementary Table 1) were distributed into two 96-well plates (Eppendorf, 0030603303). Forty-four microliters of Linker-R02 or Linker-R03 (12.5 µM, Supplementary Table 1) were then added to each well of the two plates. The plates were sealed and annealed with following program: 95 °C for 5 min, slowly cool down to 20 °C with a ramp of −0.1 °C/s (stock solution plates). The stock solution plates were then divided into 4 new 96-well plates, with each well of the working plates contains 10 µL of barcoded oligos ready for ligation reaction.
To prepare P5 adaptor mix for 2nd adaptor tagging of DNA libraries, P5-FokI was mixed with P5c-NNDC-FokI and P5H-FokI was mixed with P5Hc-NNDC-FokI (final concentration 50 µM for both, Supplementary Table 1). The oligo mixtures were then annealed with following program: 95 °C for 5 min, slowly cool down to 20 °C with a ramp of −0.1 °C/s. The annealed P5 complex and P5H complex were then mixed on the ice at the ratio of 1:3, and stored at −20°C.
Assembly of transposomes
Barcoded DNA adaptor oligos were mixed with a pMENTs oligo (final concentration 50 µM, Supplementary Table 1). The oligo mixtures were then annealed with following program: 95 °C for 5 min, slowly cool down to 20 °C with a ramp of −0.1 °C/s. One microliter of transposome was then mixed with 6 µL of unloaded proteinA-Tn5 (0.5 mg/mL)14, briefly vortex and quickly spun down. The mixtures were incubated at room temperature for 30 min then at 4 °C for an additional 10 min. The transposon complex can be stored at −20 °C for up to 6 months.
Paired-Tag procedures
A step-by-step protocol is available from Protocol Exchange51.
Antibody staining and targeted tagmentation:
3.6 million permeabilized nuclei were aliquoted into 12 Maximum Recovery tubes (Axygen) and resuspended in 50 µL Complete Buffer (20 mM HEPES pH 7.5 [Invitrogen, 15630106], 150 mM NaCl [Sigma, S7653], 0.5 mM Spermidine [Sigma, 85558], 1X Protease Inhibitor Cocktail [Promega, G6521] 0.5 U/µL SUPERase IN, 0.5 U/µL RNase OUT, 0.01% IGEPAL-CA630 [Sigma, I8896], 0.01% Digitonin [Sigma, D141] and 2 mM EDTA[Invitrogen, AM9261]). Antibodies (2 µg for each tube) were added and the mixtures were rotated at 4 °C overnight. Antibodies: H3K4me1 (Abcam, ab8895), H3K4me3 (Abcam, ab8580), H3K27ac (Abcam, ab4729), H3K27me3 (Active Motifs, 39055), H3K9me3 (Abcam, ab8898). Nuclei were spun-down at 600 g, 4 °C for 10 min, resuspended in 50 µL Complete Buffer, and repeated twice. The nuclei were again spun-down at 600 g, 4 °C for 10 min and resuspended in 50 µL Medium Buffer #1 (20 mM HEPES pH 7.5, 300 mM NaCl, 0.5 mM Spermidine, 1 X Protease Inhibitor cocktail, 0.5 U/µL SUPERase IN, 0.5 U/µL RNase OUT, 0.01 % IGEPAL CA-630, 0.01% Digitonin and 2 mM EDTA). Barcoded proteinA-Tn5 (1 µL 0.5 mg/mL for each tube) were then added and rotated for 60 min at room temperature. The nuclei were then spun down at 300 g, 4 °C for 10 min, and resuspended in 50 µL Medium Buffer #2 (20 mM HEPES pH. 7.5, 300 mM NaCl, 0.5 mM Spermidine, 1 X Protease Inhibitor cocktail, 0.5 U/µL SUPERase IN, 0.5 U/µL RNase OUT, 0.01 % IGEPAL CA-630 and 0.01% Digitonin) and repeated twice. Tagmentation reaction was initiated by adding 2 µL 250 mM MgCl2 (Sigma, M1028) and was carried out at 550 r.p.m., 37 °C for 60 min in a ThermoMixer (Eppendorf). The reaction was quenched by adding of 16.5 µL 40.5 mM EDTA. Nuclei were then spun-down at 1,000 g, 4 °C for 10 min and proceeded to Reverse Transcription immediately.
Reverse transcription: Reverse:
Transcription was carried out similarly to the previous described31 with minor modifications. Briefly: nuclei pellets were resuspended in 20 µL RT Buffer (1X Buffer RT, 0.5 mM dNTP [NEB, N0447S], 0.5 U/µL SUPERase IN, 0.5 U/µL RNase OUT, 2.5 µM barcoded T15 primer and 2.5 µM barcoded N6 primer, and 1 U/µL Maxima Reverse H minus Reverse Transcriptase [Invitrogen, EP0751]). The reverse transcription was performed in a thermocycler with the following program (Step1: 50 °C × 10 min; Step2: 8 °C × 12 s, 15 °C × 45 s, 20 °C × 45 s, 30 °C × 30s, 42 °C × 2 min, 50 °C × 5 min, goto Step2 for additional 2 times; Step3: 50 °C × 10 min and hold at 12 °C). After the reaction, the nuclei were transferred and pooled into a 1.5 mL tubes pre-washed with 5% BSA in PBS and cooled on ice for 2 min, 4.8 µL of 5% Triton-X100 (Sigma, T9284). Nuclei were then spun-down at 1,000 g, 4 °C for 10 min and proceeded to ligation-based combinatorial barcoding immediately.
Ligation-based combinatorial barcoding:
Nuclei were resuspended and mixed in 1 mL 1X NEBuffer 3.1 and then transferred to Ligation Mix (2,262 µL H2O, 500 µL 10X T4 DNA Ligase Buffer, 50 µL 10 mg/mL BSA, 100 µL 10X NEBuffer 3.1 and 100 µL T4 DNA Ligase [NEB, M0202L]). Each 40 µL of the ligation reaction mix was distributed to Barcode-plate-R02 using a multichannel pipette and incubate at 300 r.p.m., 37 °C for 30 min in a ThermoMixer (Eppendorf). 10 µL of R02-Blocking-Solution (264 µL of 100 µM Blocker-R02 oligo, 250 µL of 10X T4 Ligation Buffer, 486 µL ultrapure H2O) was then added to each well using a multichannel pipette and the reaction were continued for an additional 30 min. The nuclei were then pooled and spun-down at 1,000 g, 4 °C for 10 min. The 2nd round of ligation was then carried out similar to the 1st round, except for after 30 min of the ligation reaction, Termination-Solution (264 µL of 100 µM R04 Terminator oligo, 250 µL of 0.5 M EDTA and 236 µL ultrapure H2O) was added to quench the reaction.
Typically, 100,000 to 300,000 nuclei could be recovered after ligation-based barcoding. Nuclei were then resuspended in PBS, counted and aliquot to sub-libraries containing 2 k to 5 k nuclei. The size of sub-libraries positively correlates with potential barcode collision rates9,34, hence we used 3.5 k nuclei for each sub-library, which gave us 8.2% collision rate (expected estimate 3.2%). To further reduce the collision rate, nuclei sorting can be used to replace dilution-based aliquoting52. Sub-libraries were diluted to 35 µL with PBS. 5 µL 4M NaCl [Sigma, S7653], 5 µL 10% SDS [Invitrogen, 15553–035] and 5 µL 10 mg/mL Protease K [NEB, P8107S] was then added and nuclei were lysed at 850 r.p.m., 55 °C for 2 hr in a ThermoMixer. The lysed solution was cooled to room temperature and then purified with 1X SPRI beads [Beckman coulter, B23319] and eluted in 12.5 µL H2O. The purified DNA can be stored at −20 °C or −80 °C for up to 4 weeks.
Pre-amplification of barcoded DNA/cDNA:
1.5 µL 10X TdT buffer, 0.5 µL 1 mM dCTP [NEB, N0447S] was added into 12.5 µL purified DNA/cDNA mix and denatured at 95 °C for 5 min and then quickly chilled on ice for 5 min. 1µL of TdT [NEB, M0315S] was added and incubated at 37 °C for 30 min followed by heat deactivation at 75 °C for 20 min. Anchor Mix (6 µL 5X KAPA Buffer, 0.6 µL 10 mM dNTPs, 0.6 µL 10 µM Anchor-FokI-GSH-Oligo and 0.6 µL KAPA HiFi HS [KAPA, KK2502]) were added and the linear amplification was performed in a thermocycler with the following program (Step1: 98 °C × 3 min; Step2: 98 °C × 15 s, 47 °C × 60 s, 68 °C × 2 min, 47 °C × 60 s, 68 °C × 2 min and repeat Step2 for additional 15 times; Step3: 72°C × 10 min and hold at 12 °C).
Preamplification Mix (4 µL 5X KAPA buffer, 0.5 µL 10 mM dNTPs, 2 µL of 10 µM PA-F and PA-R, 0.5 µL KAPA HiFi HS) were then added and pre-amplification was performed with following program (Step1: 98 °C × 3 min; Step2: 98 °C × 20 s, 65 °C × 20 s, 72 °C × 2.5 min and repeat Step2 for additional 10 times; Step3: 72°C × 2 min and hold at 12 °C). Amplified products were purified with SPRI double-size selection (10 µL + 32.5 µL, 0.2X + 0.65X) and were eluted in 35 µL H2O.
Endonuclease digestion and 2nd adaptor tagging:
Transfer 17 µL each of purified amplified products into two tubes for DNA and RNA library construction, respectively. Add 2.5 µL 10X Cutsmart buffer [NEB, M7204S], 1 µL SbfI-HF [NEB, R3642] and 1 µL FokI [NEB, R0109S] and 3.5 µL H2O to DNA-tube. Add 2 µL 10X Cutsmart buffer and 1 µL NotI-HF [NEB, R3189] to RNA-tube. The digestion reaction was incubated at 37 °C for 60 min. Use 1.25 X (31.3 µL for DNA and 25 µL for RNA) SPRI beads to purify the digestion product and elute in 10 µL. For DNA part, 2 µL 10X T4 DNA Ligase Buffer, 2 µL P5 Adaptor Mix, 4 µL H2O and 2 µL T4 DNA Ligase were added and ligation reactions were carried out with program (4 °C 10. min, 10 °C 15 min, 16 °C 15 min, 25 °C 45 min). The ligation product was then purified with 1.25X (25 µL) SPRI beads and elute in 30 µL H2O. For RNA part, add 10.5 µL 2X Tagmentation Buffer [66 mM Tris-Ac, pH 7.8 (ThermoFisher Scientific, BP-152), 22 mM MgAc (Sigma, M2545), 133 mM KAc (Sigma, P5708), and 32% DMF (EMD Millipore, DX1730)], and 0.5 µL 0.05 mg/mL Tn5-N5 were added and tagmentation reaction were carried out at 550 r.p.m., 37 °C for 30 min in a ThermoMixer followed by cleaned up using QIAquick PCR purification kit and eluted in 30 µL 0.1X Elution Buffer (QIAGEN).
Indexing PCR and sequencing:
Prepare the PCR mix (30 µL purified P5-tagged product, 10 µL 5X Q5 buffer, 1 µL 10 mM dNTP, 0.5 µL 50 µM P5 Universal primer for DNA or N5 primer for RNA, 2.5 µL 10 µM P7 primer, 5 µL H2O and 1 µL NEB Q5 DNA Polymerase [NEB, M0491]) and run the following program (Step1: 72 °C × 5 min, 98 °C × 30 s; Step2: 98 °C × 10 s, 63 °C × 30 s, 72 °C × 1 min and repeat Step2 for additional 8–13 times to reach 10 nM concentration; Step3: 72°C × 1 min and hold at 12 °C). Cleanup the libraries using 0.9X (45 µL) SPRI beads. The final libraries were sequenced using a NextSeq 550 or NovaSeq 6000 platform (Illumina) with the following read lengths: PE 50 + 7 + 100 or PE 100 + 7 + 100 (Read1 + Index1 + Read2).
Paired-seq
An optimized Paired-seq protocol based on previously described method31 was used to generate paired chromatin accessibility and transcriptome. Briefly, nuclei were isolated similar to Paired-Tag procedures and counted, 1.2 million permeabilized nuclei were aliquoted into 12 tubes and spun-down at 1,000 g, 4°C for 10 mins. Nuclei were resuspended in 9 µL of 1.1X Tagmentation Buffer (36.7 mM Tris-Ac, pH 7.8, 12.1 mM MgAc, 73.3 mM KAc, and 17.8 % DMF), with 75 µM PitStop253. Barcoded Tn5 were then added and reaction were carried out at 37°C, 550 r.p.m. for 30 mins in ThermoMixer. Reaction were quenched by adding 5 µL 40 mM EDTA and nuclei were spun-down at 1,000 g, 4°C for 10 mins. Start from Reverse transcription, the steps are the same as in Paired-Tag procedures described above.
Quality control of Paired-Tag data
DNA reads were mapped to mm10 or hg19 using bowtie254 with default parameters, only Read1 were used for mapping. Alignment files were cleaned by removing reads with MAPQ<10 (for H3K4me1, H3K27ac and H3K27me3). PCR duplicates were removed by mapped position (bulk profiles) and UMI (aggregated single-cell profiles). Reads counts within 10-kb non-overlapping bins across the whole genome were then counted and Spearman’s correlation coefficients were used to evaluate the specificities of each dataset.
Pre-processing of Paired-Tag data
Cellular barcodes and the linker sequences are read by Read2. The first base of BC#1, BC#2 and BC#3 should locate within 84–87th, 47–50th and 10–13rd base of Read2. We identify the positions of barcodes by matching the linker sequences adjacent to the cellular barcodes. A bowtie reference index was generated with all possible cellular barcode combinations (96*96*12) and barcodes sequences were mapped to the cellular barcodes reference using bowtie55 with parameters: -v 1 -m 1 --norc (reads with more than 1 barcode mismatch and can be assigned to more than 1 cell were discarded). NextEra adaptor sequences were trimmed from 3’ of DNA and RNA libraries, Poly-dT sequences were further trimmed from 3’ of RNA libraries and low-quality reads (L = 30, Q = 30) were excluded for further analysis.
Analysis of Paired-Tag data
Evaluation of collision rate:
Reads from species mixing test were extracted based on cellular barcodes (BC#1 = 06 or 12, Extended Data Fig. 2a) and mapped to a reference genome using STAR56 with the combined reference genome (GRCh37 for human and GRCm38 for mouse). Duplicates were removed based on the mapped position, cellular barcode, PCR index and UMI. For evaluation of the collision rate, nuclei with less than 80% UMIs mapped to one species were classified as mixed cells.
Reads mapping:
Cleaned reads were first mapped to a mouse GRCm38 genome reference genome with STAR56 (version: 2.6.0a) for RNA or bowtie254 for DNA. Mapped DNA reads of H3K4me1, H3K4me3, H3K27ac and H3K27me3 were further filtered by mapping quality (MAPK>10). Duplicates were removed based on the mapped position, cellular barcode, PCR index and UMI. We used BC#1 for the identification of the origin of samples. Low coverage nuclei were removed from further analysis (<1,000 transcripts and <500 unique DNA reads). Before generating the cell-counts matrices, DNA bam files were further filtered by removing high-pileup positions (cutoff = 10) regardless of cellular barcode, PCR index and UMI.
Clustering of Paired-Tag profiles:
RNA alignment files were converted to a matrix with cells as columns and genes as rows. DNA alignment files were converted to a matrix with cells as columns and 5-kb bins (instead of peaks) as rows. Cells with less than 200 features in both DNA and RNA matrices were removed. DNA matrix was further filtered by removing the 5% highest covered bins. The clustering of single-cells based on RNA-profiles was performed with Seurat package57. Briefly, cell-to-gene counts were normalized and variable genes were selected for dimension reduction by PCA, batch effects were corrected with harmony58, visualized with UMAP59 and clustered with Louvain algorithm. Cell groups with high expression levels of marker genes from multiple major cell types were considered as doublets and excluded from further analyses. Co-embedding of Paired-Tag RNA profile and published scRNA-seq dataset36 were performed using Seurat package57. To compare the clustering results from different studies, overlap coefficients (O) were calculated according to the number of cells with the labels from Paired-Tag dataset (A), from Zeisel Cell, 201836 (B) and from co-embedding (C):
To visualize the single-cell DNA profiles, cell-to-bins (5-kb bin-size) matrices were binarized (B) and converted to cell-to-cell similarity Jaccard matrices (S) by snapATAC60:
The coverage biases were then normalized with runNormJaccard function of snapATAC60, followed by dimension reduction by PCA, batch effect correction with harmony58, visualization with UMAP59 and cell clustering with Louvain algorithm.
To cluster single-cells with joint modalities, transcript counts of each cell were first normalized with the median number of the corresponding gene across all cells and log-transformed (L). Cell-to-cell Euclidean distance matrices (E) of RNA profiles were calculated from the normalized cell-to-gene counts matrices:
Jaccard distance matrices (D) were then converted from S (D = 1 - S). The two distance matrices (D, E) were rescaled to [0,1] (Dnor, Enor) by min-max normalization. The “total distance” matrices (I) were obtained by calculating the Entrywise sum of Dnor and Enor (I = Dnor + Enor). Dimension reduction (PCA) were then performed on I, followed by batch effect correction with harmony58, visualization with UMAP59 and cell clustering by Louvain algorithm. Cell types were annotated based on average expression levels of marker genes from transcriptomic profiles.
Classification of promoter and CRE modules
To classify genes according to epigenetic states of promoters, gene expression (RPKM) and reads densities of promoters (CPM) were summarized from aggregated profiles based on transcriptome-based clustering. Genes with RPKM > 1 for expression and CPM > 1 for promoters in at least one cluster were retained for analysis. Genes were first grouped by K-means clustering based on reads densities of 3 histone marks (H3K27ac, H3K27me3 and H3K9me3) (k = 4). Each group was then subjected to secondary K-means clustering based on gene expression, resulting in the 7 promoter groups in Fig. 3.
To classify CRE into different groups. Firstly, the cCRE list was from CEMBA39 and extended for 1,000 bp (500 bp at both directions). cCRE overlap with promoter regions (−1,500 bp to +500bp of TSS). were excluded for further analysis. CRE reads densities of four histone marks were then summarized from aggregated profiles based on transcriptome-based clustering. cCREs with CPM > 1 in at least one cluster or one histone profile were retained for analysis. cCREs were first grouped by K-means clustering based on reads densities of 3 histone marks (H3K27ac, H3K27me3 and H3K9me3) (k = 4). Each group was then subjected to secondary K-means clustering based on H3K27ac reads densities, resulting in the 8 CRE groups in Fig. 4.
Motif enrichment and Gene Ontology analysis
Motif enrichment for each cell type:
Motif enrichment for each cell type and histone modifications were carried out using ChromVAR61. Briefly, mapped reads were converted to cell-to-bin matrices with a bin-size of 1,000 bp for four histone profiles. Reads for each bin were summarized from all cells of the same groups from transcriptome-based clustering. GC bias and background peaks were calculated and motif enrichment score for each cell type was then computed using the computeDeviations function of ChromVAR61.
Motif enrichment for each CRE module: Motif enrichment for each CRE module was analyzed using Homer (v4.11)62. We scanned a region of +/− 200 bp around the center of the element for both de novo and known motif enrichment analysis (from the JASPAR database63). We used the total peak list as the background for motif enrichment analysis of cCREs in each group.
Gene ontology enrichment:
Gene ontology annotation was performed with Homer (v4.11)62 with default parameters. Gene set library “Biological process” was used. GO terms with more than 500 total genes in the list were excluded from the “Top Enriched GO Terms”.
Pseudotime analysis
Pseudotime analysis was performed with Monocle352. Nuclei annotated as OPC, Oligo-MFOL and Oligo-MOL were used for analysis (933, 580, 790, 450 and 1,131 nuclei from H3K4me1, H3K4me3, H3K27ac, H3K27me3 and H3K9me3 Paired-Tag and 775 nuclei from Paired-seq datasets). After batch correction, PCA were performed and the first 35 PCs were used for construction of pseudotime trajectory. To plot gene expression and promoter histone mark densities across pseudotime. Differentially expressed genes between OPC, Oligo-MFOL and Oligo-MOL (edgeR64, FDR<0.05) showed positive correlation with promoter histone mark signals were selected (SCC>0 for H34me1, H3K4me3 and H3K27ac) and ordered according to the expression levels of aggregated single-cells in each ten-quantile of the pseudotime and smoothed with smooth.spline function of with spar=0.5.
ChromHMM analysis
Chromatin state analysis were performed with chromHMM65. De-duplicated alignment files of each cell type were generated based on transcriptome-based clustering and annotations and then binarized using the binarizeBam function with bin-size set to 1,000 bp. Model were generated with LearnModel function with 8 states. Chromatin states were annotated based on their distribution to TSS and emission probabilities of different histone marks.
Linking CREs with putative target genes
To predict putative target genes for active and inactive cCREs, we first identified the candidate CRE-gene pairs by calculating the co-occupancy of H3K4me1 reads between promoter regions (−1,500 bp to +500 bp) and cCREs with cicero47 using default parameters. cCRE-gene pairs with co-accessibility of >0.1 were used for further analysis.
To identify functional cCRE-gene pairs, we then calculated the Spearman’s correlation coefficients between H3K27ac (for active pairs) or H3K27me3 (for inactive pairs) reads densities of cCREs (CPM) and gene expression of corresponding linked genes (RPKM) across clusters from transcriptome-based clustering. To estimate the background noise levels, we shuffled the cell IDs for each read and calculated the corresponding Spearman’s correlation coefficients. False-positive detection rates were estimated based on the fraction of detected pairs from the shuffled group under different cutoffs. Finally, a cutoff of FDR<0.05 was used for the identification of both active and inactive cCRE-gene pairs.
Statistics and Reproducibility
Datasets for each histone modification or chromatin accessibility were obtained from dissections of 2 different mice and datasets of RNA were obtained from dissections of 4 different mice: all these independent replicates showed similar results.
Reporting Summary
Further information on design of this study is available in the Nature Research Reporting Summary linked to this article.
Data Availability
The sequencing data obtained in this study have been deposited to the NCBI Gene Expression Omnibus (GEO) (http://www.ncbi.nlm.nih.gov/geo/) under accession number GSE152020. The processed data can be accessed from the web portal (http://catlas.org/pairedTag). All other data are available upon request.
CEMBA datasets were available from NEMO (https://nemoanalytics.org) with the accession number of RRID SCR_016152.
ENCODE (https://www.encodeproject.org/) datasets were downloaded with the accession numbers: H3K4me1 (ENCSR000APW), H3K27ac (ENCSR000AOC), H3K27me3 (ENCSR000DTY), H3K9me3 (ENCSR000AQO), DNase-seq (ENCSR959ZXU).
The other external datasets were downloaded from NCBI Gene Expression Omnibus (GEO) (http://www.ncbi.nlm.nih.gov/geo/), with the accession numbers: SPLiT-seq (GSE110823), CoBATCH (GSE129335), itChIP (GSE109762) and HT-scChIP-seq (GSE117309).
10X scRNA-seq datasets were downloaded from 10x genomics website (https://www.10xgenomics.com/).
Code Availability
Custom scripts used in this study are available from https://github.com/cxzhu/Paired-Tag.
Extended Data
Extended Data Fig. 1. Overview of Paired-Tag.
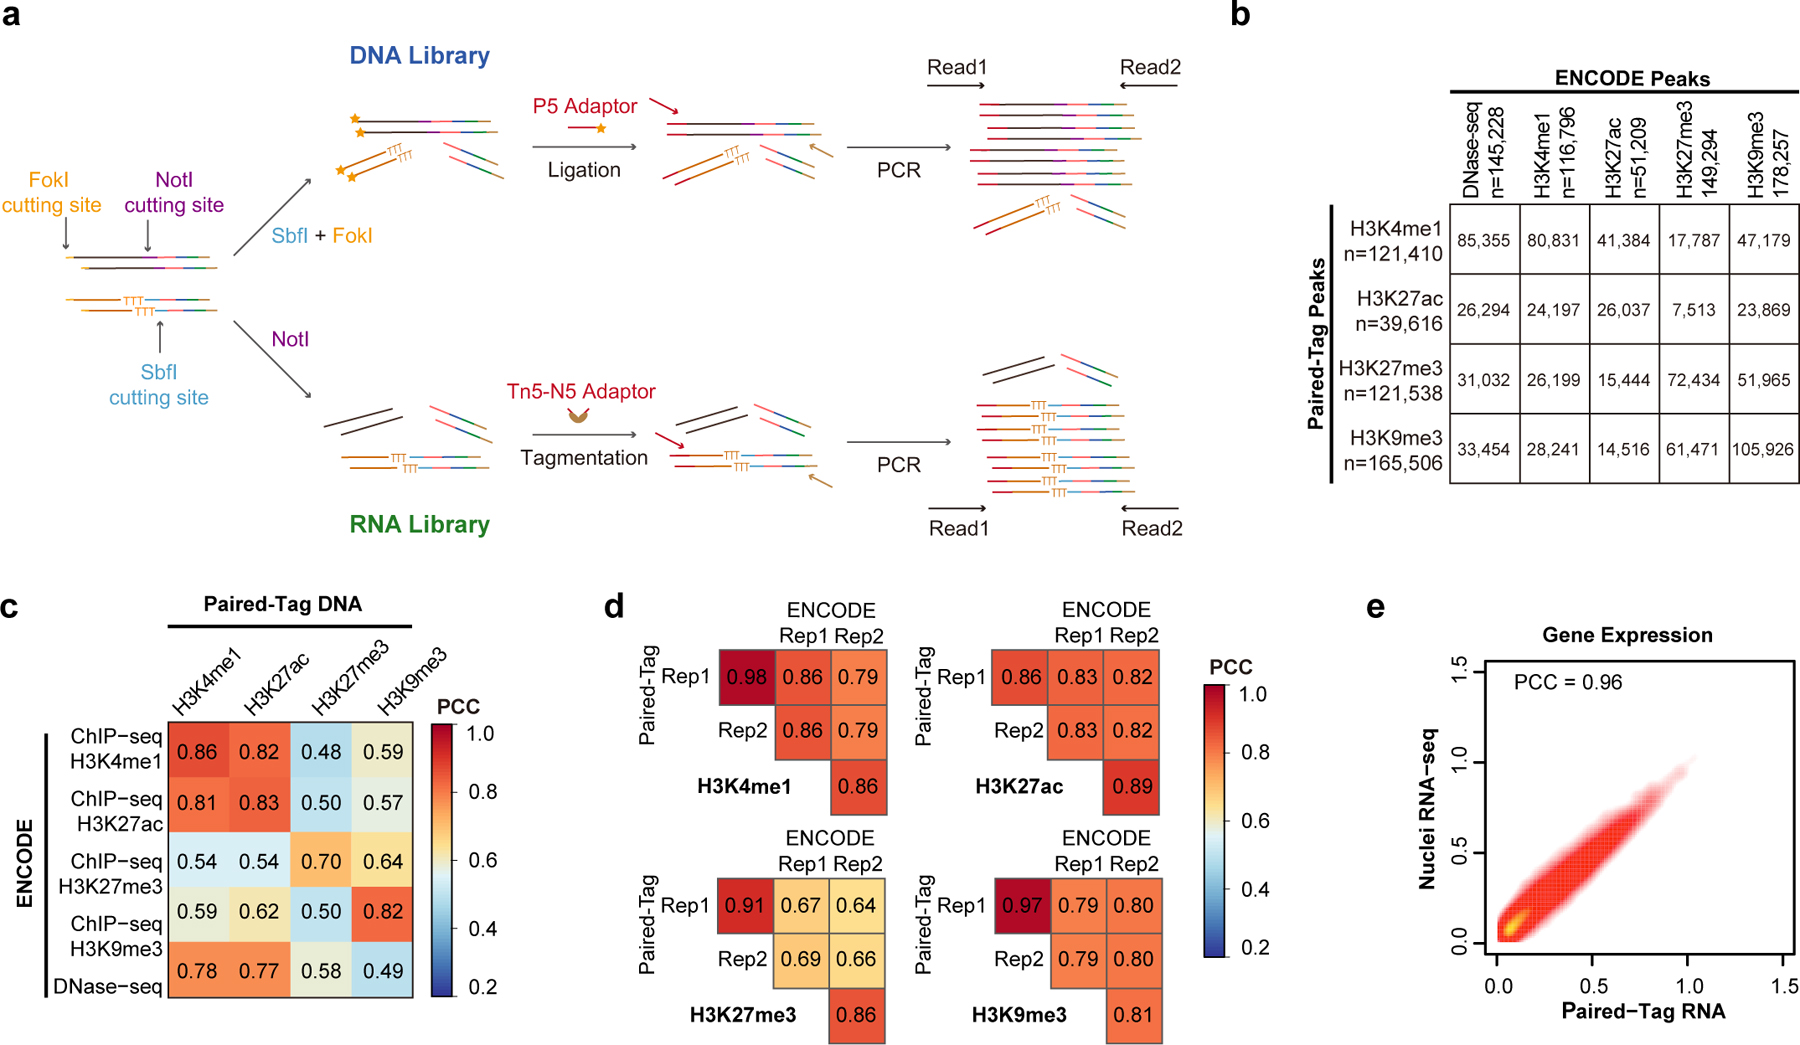
a, Schematics for 2nd adaptor tagging of DNA and RNA libraries. For DNA libraries, amplified products were digested with a type IIS restriction enzyme – FokI, and the cohesive end was then used to ligate the P5 adaptor. For RNA libraries, N5 adaptor was added by tagmentation. b, Table showing the numbers of overlapped peaks across different histone marks between Paired-Tag and ENCODE ChIP-seq or DNase-seq datasets. The total numbers of peaks identified for each dataset are also indicated. c, d, Heatmaps showing the Pearson’s Correlation Coefficients of genome-wide reads distribution (in 10-kb bins) (c) between Paired-Tag datasets and ENCODE ChIP-seq or DNase-seq datasets, and (d) between replicates of Paired-Tag datasets and ENCODE ChIP-seq datasets from HeLa cells. e, Scatter plot showing the Pearson’s correlation coefficients of Paired-Tag RNA dataset and in-house generated nuclei RNA-seq from HeLa cells.
Extended Data Fig. 2. Performances of Paired-Tag in single-nucleus analysis from mouse brain.
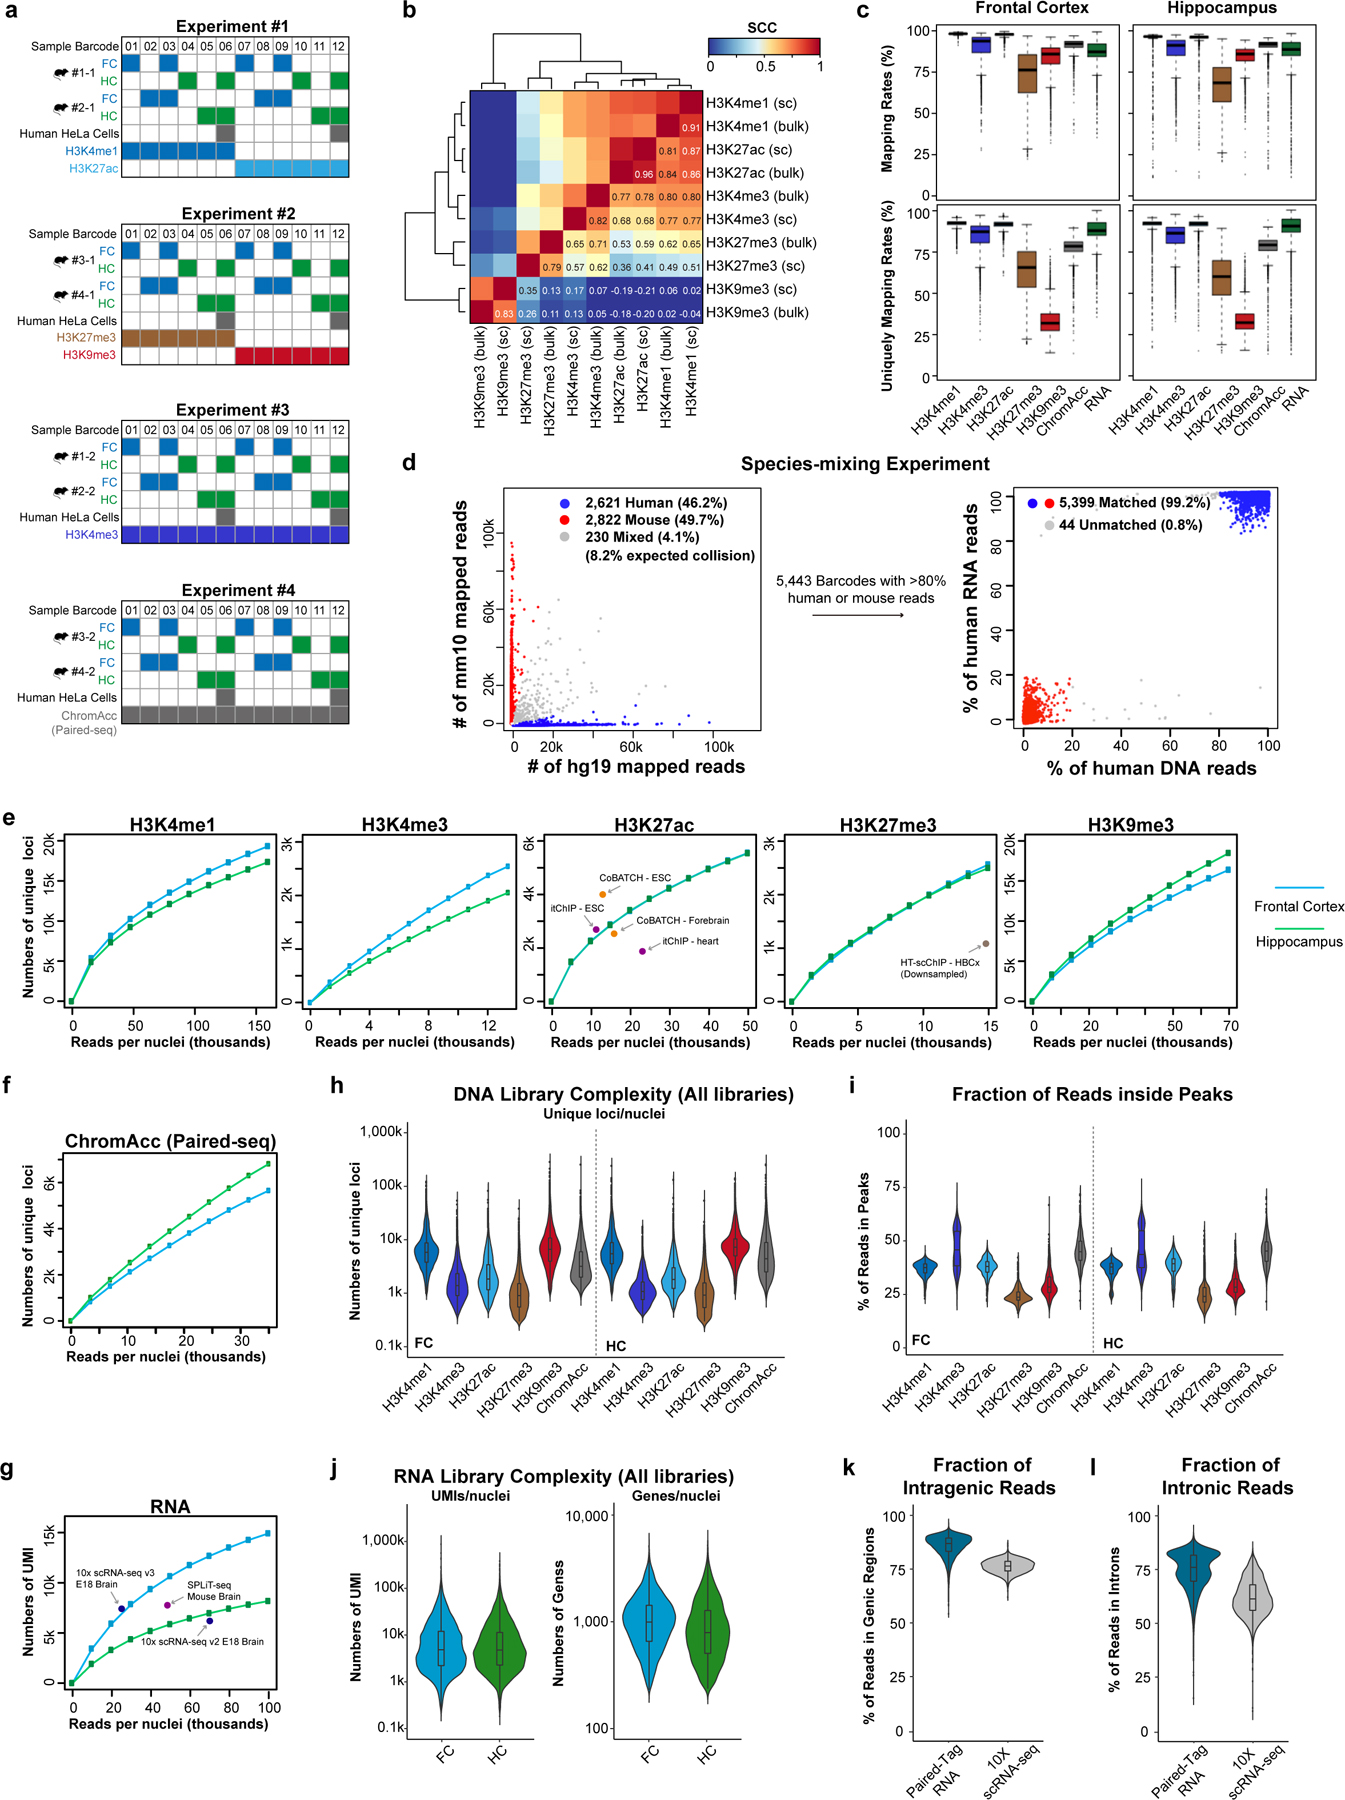
a, Schematics showing the sample multiplexing strategy in this study. Different samples or replicates were labeled by the 1st round of Paired-Tag cellular barcode (Sample Barcode) located in reverse transcription primers and transposome oligos. b, Heatmap showing the pair-wise Pearson’s correlation coefficients of genome-wide reads distribution for different histone marks from single-cell Paired-Tag datasets (indicated with “sc”, aggregated from all cells shown in Fig. 2a) and bulk datasets. c, Boxplots showing the mapping rates (upper panels) and the fraction of reads uniquely mapped to the reference genome (bottom panels) of DNA profiles of different histone marks and RNA profiles in frontal cortex and hippocampus. The boxes were drawn from lower quartile (Q1) to upper quartile (Q3) with the middle line denote the median, whiskers with maximum 1.5 IQR, outliers were indicated with dots. For Frontal Cortex, n = 7,781 (H3K4me1), 3,509 (H3K4me3), 7,584 (H3K27ac), 3,891 (H3K27me3), 6,560 (H3K9me3), 6,551 (ChromAcc) from dissections of 2 different mice s and n = 35,876 (RNA) from dissections of 4 different mice; for Hippocampus, n = 5,181 (H3K4me1), 3,956 (H3K4me3), 4,165 (H3K27ac), 2,643 (H3K27me3), 5,484 (H3K9me3), 7,544 (ChromAcc) from dissections of 2 different mice and n = 28,973 (RNA) from dissections of 4 different mice. d, Scatter plots showing the proportion of human and mouse RNA reads in each cell (left panel) and the fraction of human reads in DNA and RNA libraries for each cell (right panel) in the species-mixing experiment. Barcodes with less than 80% reads from the same species were identified as mixed cells, the 230 mixed cells of RNA profiles (left panel) were excluded from plotting of the right panel. e, Numbers of unique loci per nucleus for deeply sequenced H3K4me1, H3K4me3, H3K27ac, H3K27me3 and H3K9me3 DNA profiles down-sampled to different levels. f, Numbers of unique loci per nucleus for deeply sequenced Paired-seq DNA profiles down-sampled to different levels. g, Numbers of UMI per nucleus for the deeply sequenced RNA sub-library down-sampled to different levels. For comparison, the numbers of unique loci per cell from the stand-alone high-throughput scChIP-seq assays and the numbers of UMI per cell from scRNA-seq assays were also shown, indicated by dots with labels. h, Violin plots showing the numbers of unique loci mapped per nucleus for all sequenced DNA libraries (average 35k sequenced reads/nuclei with ~40–60% PCR duplication rates). Median numbers, H3K4me1: 5,770 and 5,443, H3K4me3: 1,392 and 1,081, H3K27ac: 1,842 and 1,803, H3K27me3: 904 and 925, H3K9me3: 6,563 and 7,182, chromatin accessibility: 3,170 and 4,381, for frontal cortex and hippocampus, respectively. i, Violin plots showing the fraction of reads inside peaks for different histone marks and brain regions. For Frontal Cortex, n = 7,781 (H3K4me1), 3,509 (H3K4me3), 7,584 (H3K27ac), 3,891 (H3K27me3), 6,560 (H3K9me3), 6,551 (ChromAcc) from dissections of 2 different mice; for Hippocampus, n = 5,181 (H3K4me1), 3,956 (H3K4me3), 4,165 (H3K27ac), 2,643 (H3K27me3), 5,484 (H3K9me3), 7,544 (ChromAcc) from dissections of 2 different mice. j, Violin plots showing the numbers of UMI and genes detected per nucleus for all sequenced RNA libraries (average 30k sequenced reads/nuclei with ~40–60% PCR duplication rates). Median numbers, 4,215 and 3,568 RNA UMI per nucleus for frontal and hippocampus, respectively. k,l, Violin plots showing the (k) fraction of reads mapped to annotated gene regions (GENCODE GRCm38.p6) and (l) fraction of intronic reads for Paired-Tag RNA datasets and 10X scRNA-seq datasets (10k Brain Cells from an E18 Mouse, V3). n = 35,876 (Frontal Cortex) and 28,973 (Hippocampus) from dissections of 4 different mice. For (h-l), the violin plots were drawn from lower quartile (Q1) to upper quartile (Q3) with the middle line denote the median, whiskers with maximum 1.5 IQR, outliers were indicated with dots.
Extended Data Fig. 3. Annotation of cell types by Paired-Tag transcriptomic profiles.
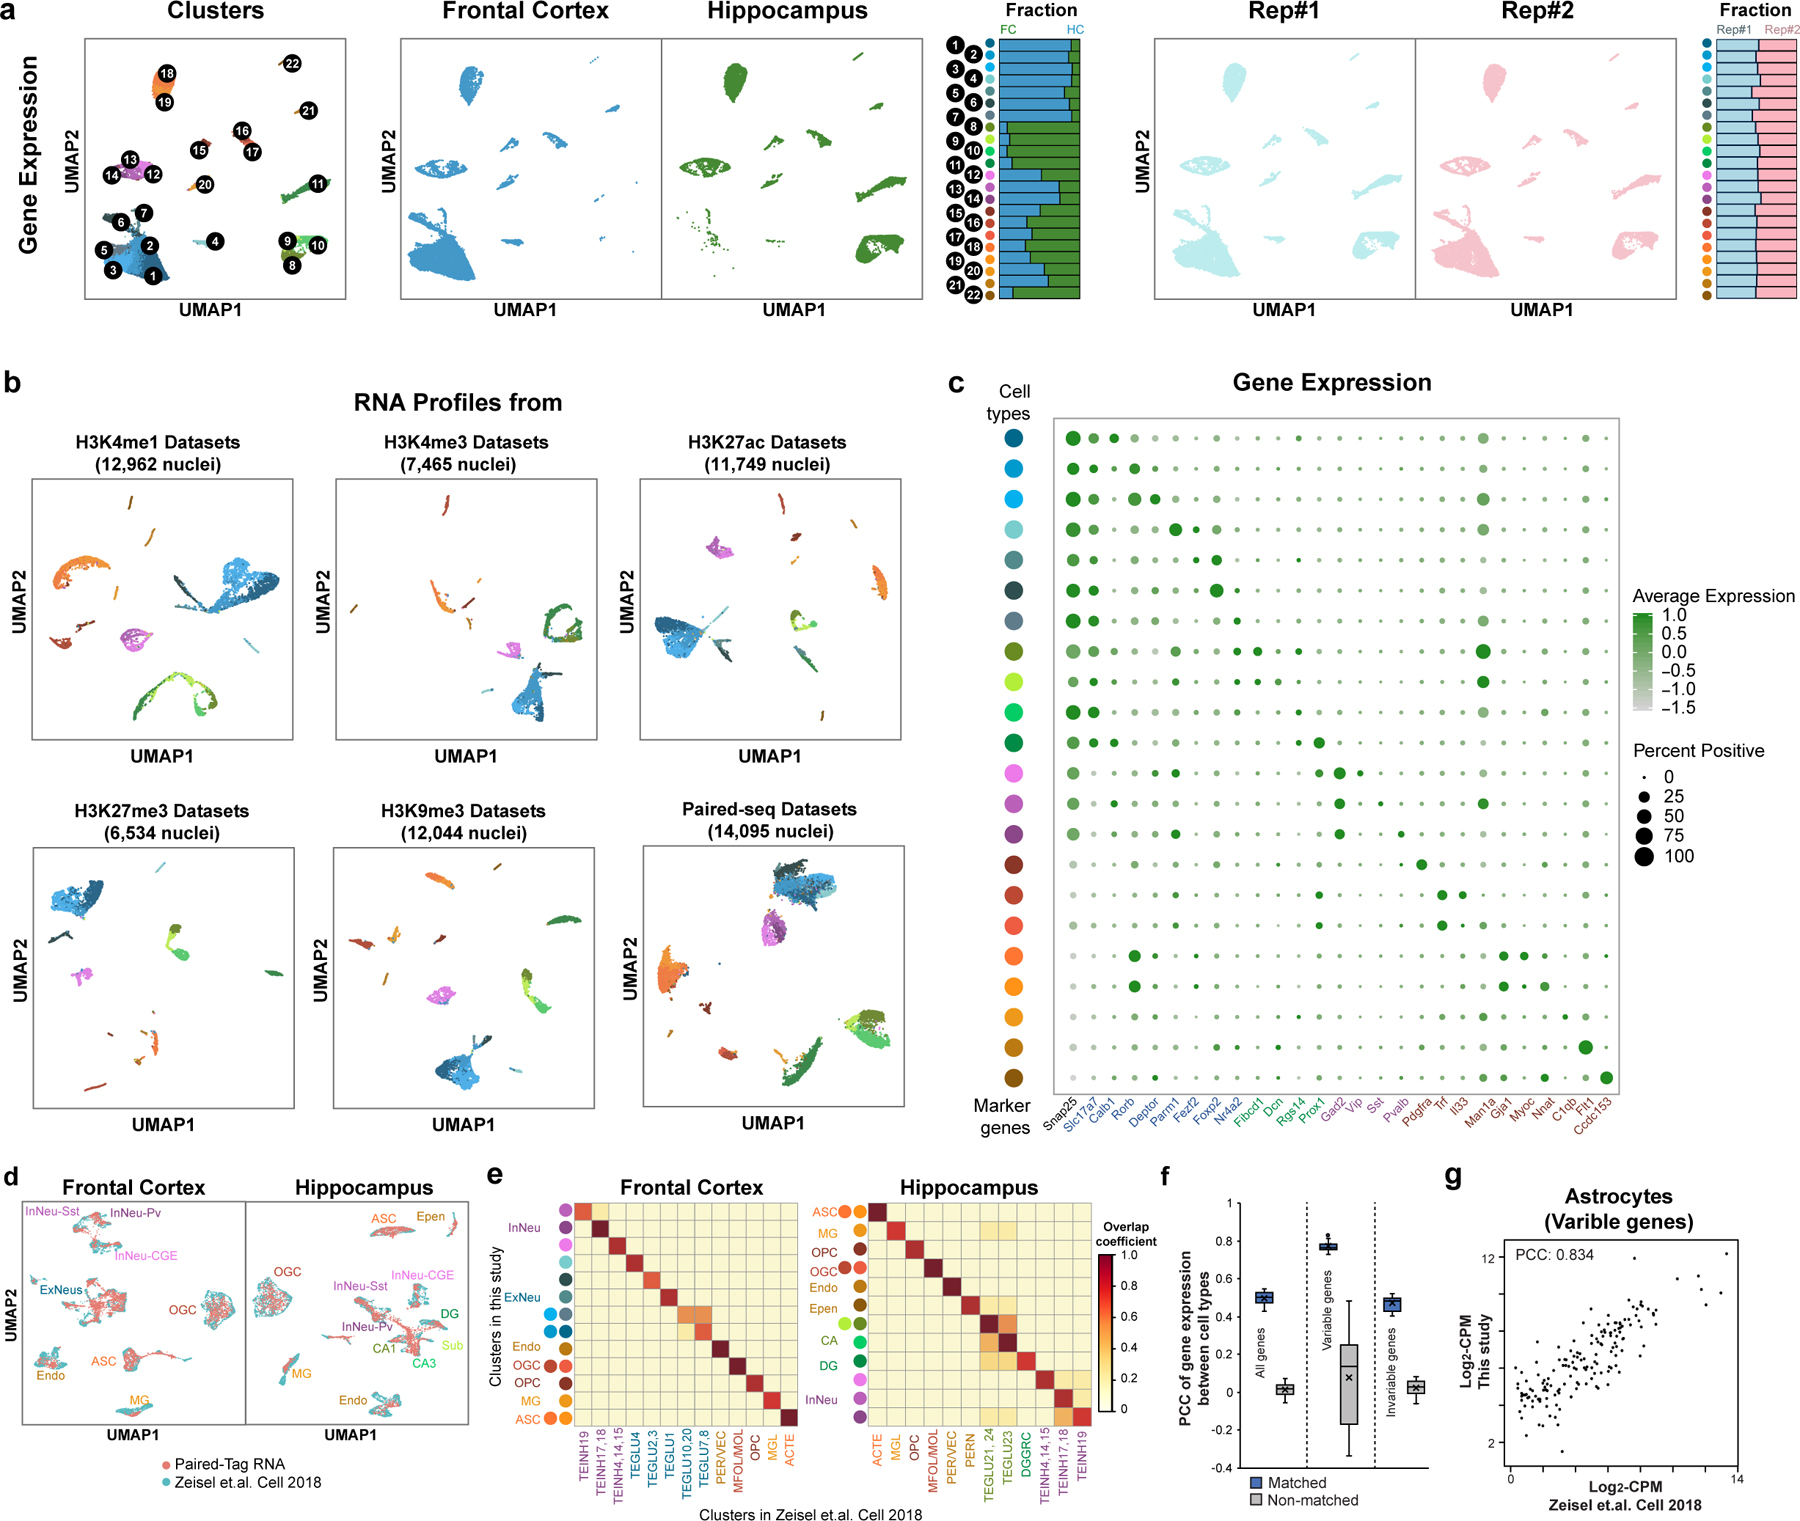
a, UMAP embedding of Paired-Tag transcriptomic profiles and stacked bar plots showing the fraction of cells from different regions or replicates (dissections from different mice) in each cell type. b, UMAP embedding of transcriptomic profiles from individual Paired-Tag and Paired-seq datasets. The color of cell types was the same as in Fig.1d. c, Dot plots showing the expression of marker genes for each mouse brain cell type measured from Paired-Tag RNA profiles. The size of the dots represents the fraction of cells positively detect the transcripts and the color of the dots represents the average. d, UMAPs showing the co-embedding of single-nucleus gene expression from Paired-Tag RNA profiles and the previously published scRNA-seq datasets of the same tissues. e, Heatmaps showing the confusion matrices of the overlap between cell type annotations based on Paired-Tag RNA profiles and from the previously published scRNA-seq datasets. The circles left side indicating RNA clusters and were colored according to Fig.1d. f, Boxplots showing the Pearson’s correlation coefficients for all genes, variable genes and invariable genes for matched and non-matched cell types between Paired-Tag RNA profiles and the previously published scRNA-seq. The boxes were drawn from lower quartile (Q1) to upper quartile (Q3) with the middle line denote the median, whiskers with maximum 1.5 IQR, outliers were indicated with dots. n = 22 cell types. g, Scatter plot showing the expression levels of variable genes in Astrocytes measured by Paired-Tag RNA profiles and the published scRNA-seq datasets.
Extended Data Fig. 4. Histone marks-based single-cell clustering.
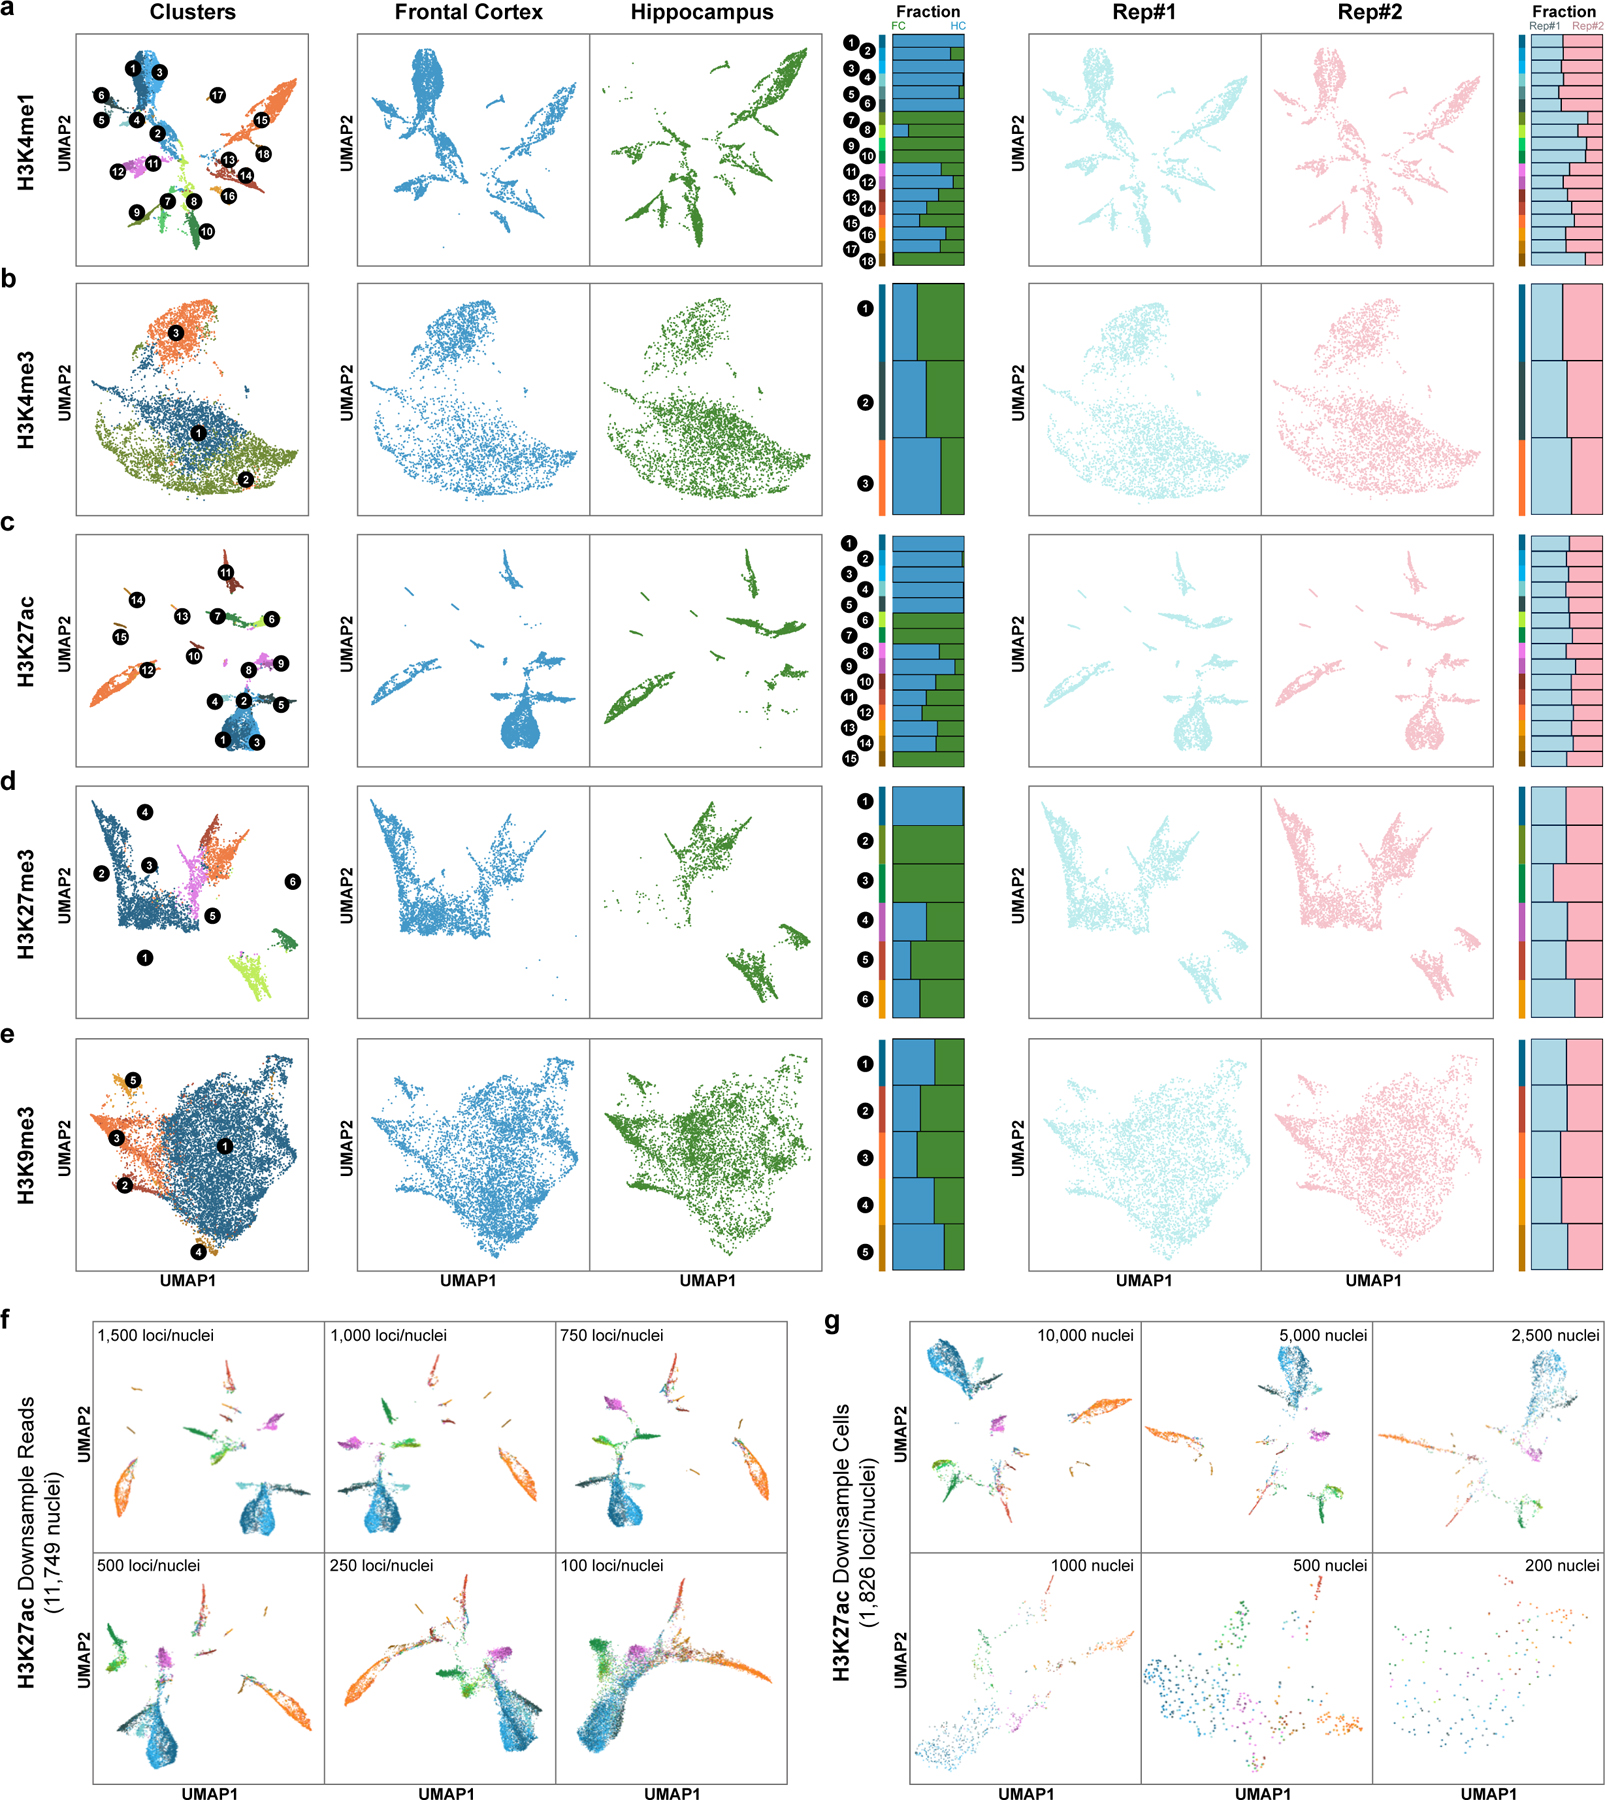
a-e, UMAP embeddings based on (a) H3K4me1, (b) H3K4me3, (c) H3K27ac, (d) H3K27me3 and (e) H3K9me3 DNA profiles and stacked bar plots showing the fraction of cells from each region or replicate. f, UMAP embeddings based on Paired-Tag H3K27ac DNA profiles down-sampled to different sequencing depth (11,749 nuclei, 100 – 1,500 loci/nuclei). g, UMAP embeddings based on Paired-Tag H3K27ac DNA profiles of different numbers of sub-sampled nuclei (median 1,826 loci/nuclei, 200 – 10,000 nuclei). For visualization, cells were colored according to clustering results from Fig. 1d.
Extended Data Fig. 5. Gene expression and promoter epigenetic states.

a, Violin plots showing reads densities of the five histone marks in Group II-a and III-b promoters. Colors represent cell types the same as in (e). Group II-a promoters were repressed by H3K27me3 in all cell types; genes in III-b were activated by H3K27ac in neuron cells, with comparable H3K27me3 levels in all cell groups. b, Boxplots showing the expression levels of genes grouped by their promoter DNA reads densities for different histone marks. The boxes were drawn from lower quartile (Q1) to upper quartile (Q3) with the middle line denote the median, whiskers with maximum 1.5 IQR, outliers were indicated with dots. n = 2,900 genes for the first 5 groups and n = 2,898 for the 6th group of each histone modification. c, Heatmap showing the Spearman’s correlation coefficients of gene expression and promoter histone modification levels within each cell type. d, Genome browser view of aggregated Paired-Tag profiles showing the three Olfr gene clusters in chr7 was silenced by H3K9me3. e, 3D-scatter plot showing the PCA embedding of aggregated RNA profiles. PC1 differs neuron cells from glial cells and PC2 mainly separates different non-neuron cell types. f, Scatter plot showing the loadings of the first 2 PCs for each gene. Genes from group II-b and III-d were colored in brown and blue, respectively. g, UMAP embedding of 4,659 OPC and Oligodendrocytes nuclei used for pseudotime analysis. h, Expression of marker genes alone the pseudotime.
Extended Data Fig. 6. Histone modification states in mouse neuron cell types.
a, Stacked bar plots showing the fraction of genomic regions for CREs of each group in Fig. 4a and b. b, Line plots showing the densities of CREs from different groups around CpG islands. c, Scatter plot showing the Spearman’s correlation coefficients of TF motif enrichment and TF gene expression across cell types. TFs with significant positive correlations (FDR < 0.05) between expression and motif enrichment for both H3K4me1 and H3K27ac were colored in red. d, Heatmap showing the emission probability of each histone mark across the 8 chromatin states identified by chromHMM. e, Heatmap showing the fold enrichment of the 8 chromatin states around transcription start sites of FC L2/3 cell cluster.
Extended Data Fig. 7. Identification of putative CRE-gene pairs.

a, Bar charts showing the fraction of predicted H3K27ac- and H3K27me3- associated cCRE-gene pairs supported by the CEMBA datasets. P-value, two-tailed Fisher’s exact test. b-e, Bar charts showing the numbers of cCREs per targeted genes for (b) H3K27ac- and (c) H3K27me3- associated cCRE-gene pairs, and the numbers of predicted targeted genes per cCRE for (d) H3K27ac- and (e) H3K27me3- associated cCRE-gene pairs. f, Representative genome browser view of Gad2 gene locus, both H3K27ac- and H3K27me3-associated cCREs were shown. TSS-proximal region is indicated with green box and cCREs are marked with blue (H3K27ac-specific), brown (H3K27me3-specific) or purple (shared) boxes. g, Top enriched de novo TF motifs and GO terms of cCREs in H3K27ac-specific, shared and H3K27me3-specific pairs. h, Stacked bar plots showing the fraction of genomic regions for cCREs with potential active and repressive functions. P-value, two-tailed Fisher’s exact test. i,j, Bar charts showing the distribution of the distance between cCRE and TSS of predicted target genes from (i) H3K27ac- and (j) H3K27me3- associated cCRE-gene pairs. k, Spearman’s correlations coefficients between reads densities of cCREs and promoters of putative target genes across cell types for H3K4me1 and H3K9me3. P-value, two-tailed Wilcoxon signed-rank test. The boxes were drawn from lower quartile (Q1) to upper quartile (Q3) with the middle line denote the median, whiskers with maximum 1.5 IQR. n = 22 cell types. l, Heatmap showing the histone modification levels at cCREs with potential repressive roles in expression of putative target gene. cCRE were grouped using K-means clustering based on histone modification levels. m, Heatmap showing the expression levels of corresponding putative target genes of cCREs in (l). n, Top enriched Gene Ontology terms for genes in (m) and the top enriched de novo motifs for cCREs from each group in (l).
Supplementary Material
Supplementary Tables 8. TF motif enrichment - gene expression correlation. This table listed Spearman’s correlation coefficients between motif enrichment (chromVAR deviations) and gene expression (RPKM) across clusters for 342 transcription factors.
Supplementary Tables 10. Predicted target genes by groups. This table listed the predicted target genes from both H3K27ac- and H3K27me3- associated pairs for each group in Fig.5.
Supplementary Tables 1. Paired-Tag primer sequences. This table shows the primer and barcode sequences used in Paired-Tag experiments.
Supplementary Tables 9. Predicted cCRE-gene pairs. This table listed the predicted H3K27ac- and H3K27me3- associated cCRE-gene pairs in Fig.5.
Supplementary Tables 3. Marker genes by clusters. This table shows the differentially expressed genes between the clusters obtained from Paired-Tag RNA profiles. P-value: two-sided Wilcoxon Rank Sum test and adjusted by Bonferroni correction using all features in the dataset.
Supplementary Tables 4. Promoters by groups. This table listed the genes of different groups classified by epigenetic states of the corresponding promoters described in Fig.3.
Supplementary Tables 5. Gene Ontology analysis of genes from different groups. This table summarized the Gene Ontology analysis results for genes from each group in Fig.3. P-value: one-sided Binomial test.
Supplementary Tables 2. Nuclei metadata. This table shows the sequencing quality, mapping status, clustering and annotation information of single nuclei in this study.
Supplementary Tables 7. Known Motifs Enrichment analysis of CREs from different groups. This table summarized the enrichment of known motifs for CREs from each group in Fig.4. P-value: one-sided Binomial test.
Supplementary Tables 6. cis-Regulatory elements by groups. This table listed the CREs of different groups classified by their epigenetic states described in Fig.4.
Acknowledgments
We thank B. Li for bioinformatic support, S. Kuan for assistant in DNA sequencing. We thank QB3 MacroLab for the ProteinA-Tn5 enzyme. We thank S. Preissl, X. Hou, H. Huang, M. Yu and J. Song for discussion. This study was funded by 1U19 MH114831–02, U01MH121282, R01AG066018 and the Ludwig Institute for Cancer Research (to B.R.), 1K99HG011483–01 to C.Z., and R01MH112763 (to M.M.B.). This publication includes data generated at the UC San Diego IGM Genomics Center utilizing an Illumina NovaSeq 6000 that was purchased with funding from a National Institutes of Health SIG grant (#S10 OD026929).
Footnotes
Editor recognition statement: Lei Tang was the primary editor on this article and managed its editorial process and peer review in collaboration with the rest of the editorial team.
Competing interests
B.R. is a co-founder and consultant for Arima Genomics, Inc, and co-founder of Epigenome Technologies, Inc. B.R. and C.Z. are listed as inventors of a provisional patent titled “PARALLEL ANALYSIS OF INDIVIDUAL CELLS FOR RNA EXPRESSION AND DNA FROM TARGETED TAGMENTATION BY SEQUENCING”.
References
- 1.Stadhouders R, Filion GJ & Graf T Transcription factors and 3D genome conformation in cell-fate decisions. Nature 569, 345–354, doi: 10.1038/s41586-019-1182-7 (2019). [DOI] [PubMed] [Google Scholar]
- 2.Johnson DS, Mortazavi A, Myers RM & Wold B Genome-wide mapping of in vivo protein-DNA interactions. Science 316, 1497–1502, doi: 10.1126/science.1141319 (2007). [DOI] [PubMed] [Google Scholar]
- 3.Crawford GE et al. Genome-wide mapping of DNase hypersensitive sites using massively parallel signature sequencing (MPSS). Genome Res 16, 123–131, doi: 10.1101/gr.4074106 (2006). [DOI] [PMC free article] [PubMed] [Google Scholar]
- 4.Buenrostro JD, Giresi PG, Zaba LC, Chang HY & Greenleaf WJ Transposition of native chromatin for fast and sensitive epigenomic profiling of open chromatin, DNA-binding proteins and nucleosome position. Nat Methods 10, 1213–1218, doi: 10.1038/nmeth.2688 (2013). [DOI] [PMC free article] [PubMed] [Google Scholar]
- 5.Consortium EP et al. Expanded encyclopaedias of DNA elements in the human and mouse genomes. Nature 583, 699–710, doi: 10.1038/s41586-020-2493-4 (2020). [DOI] [PMC free article] [PubMed] [Google Scholar]
- 6.Tang F et al. mRNA-Seq whole-transcriptome analysis of a single cell. Nat Methods 6, 377–382, doi: 10.1038/nmeth.1315 (2009). [DOI] [PubMed] [Google Scholar]
- 7.Nagano T et al. Single-cell Hi-C reveals cell-to-cell variability in chromosome structure. Nature 502, 59–64, doi: 10.1038/nature12593 (2013). [DOI] [PMC free article] [PubMed] [Google Scholar]
- 8.Jin W et al. Genome-wide detection of DNase I hypersensitive sites in single cells and FFPE tissue samples. Nature 528, 142–146, doi: 10.1038/nature15740 (2015). [DOI] [PMC free article] [PubMed] [Google Scholar]
- 9.Cusanovich DA et al. Multiplex single cell profiling of chromatin accessibility by combinatorial cellular indexing. Science 348, 910–914, doi: 10.1126/science.aab1601 (2015). [DOI] [PMC free article] [PubMed] [Google Scholar]
- 10.Buenrostro JD et al. Single-cell chromatin accessibility reveals principles of regulatory variation. Nature 523, 486–490, doi: 10.1038/nature14590 (2015). [DOI] [PMC free article] [PubMed] [Google Scholar]
- 11.Rotem A et al. Single-cell ChIP-seq reveals cell subpopulations defined by chromatin state. Nat Biotechnol 33, 1165–1172, doi: 10.1038/nbt.3383 (2015). [DOI] [PMC free article] [PubMed] [Google Scholar]
- 12.Hainer SJ, Boskovic A, McCannell KN, Rando OJ & Fazzio TG Profiling of Pluripotency Factors in Single Cells and Early Embryos. Cell 177, 1319–1329 e1311, doi: 10.1016/j.cell.2019.03.014 (2019). [DOI] [PMC free article] [PubMed] [Google Scholar]
- 13.Harada A et al. A chromatin integration labelling method enables epigenomic profiling with lower input. Nat Cell Biol 21, 287–296, doi: 10.1038/s41556-018-0248-3 (2019). [DOI] [PubMed] [Google Scholar]
- 14.Kaya-Okur HS et al. CUT&Tag for efficient epigenomic profiling of small samples and single cells. Nat Commun 10, 1930, doi: 10.1038/s41467-019-09982-5 (2019). [DOI] [PMC free article] [PubMed] [Google Scholar]
- 15.Carter B et al. Mapping histone modifications in low cell number and single cells using antibody-guided chromatin tagmentation (ACT-seq). Nat Commun 10, 3747, doi: 10.1038/s41467-019-11559-1 (2019). [DOI] [PMC free article] [PubMed] [Google Scholar]
- 16.Ku WL et al. Single-cell chromatin immunocleavage sequencing (scChIC-seq) to profile histone modification. Nat Methods 16, 323–325, doi: 10.1038/s41592-019-0361-7 (2019). [DOI] [PMC free article] [PubMed] [Google Scholar]
- 17.Wang Q et al. CoBATCH for High-Throughput Single-Cell Epigenomic Profiling. Mol Cell 76, 206–216 e207, doi: 10.1016/j.molcel.2019.07.015 (2019). [DOI] [PubMed] [Google Scholar]
- 18.Ai S et al. Profiling chromatin states using single-cell itChIP-seq. Nat Cell Biol 21, 1164–1172, doi: 10.1038/s41556-019-0383-5 (2019). [DOI] [PubMed] [Google Scholar]
- 19.Grosselin K et al. High-throughput single-cell ChIP-seq identifies heterogeneity of chromatin states in breast cancer. Nat Genet 51, 1060–1066, doi: 10.1038/s41588-019-0424-9 (2019). [DOI] [PubMed] [Google Scholar]
- 20.Guo H et al. Single-cell methylome landscapes of mouse embryonic stem cells and early embryos analyzed using reduced representation bisulfite sequencing. Genome Res 23, 2126–2135, doi: 10.1101/gr.161679.113 (2013). [DOI] [PMC free article] [PubMed] [Google Scholar]
- 21.Mooijman D, Dey SS, Boisset JC, Crosetto N & van Oudenaarden A Single-cell 5hmC sequencing reveals chromosome-wide cell-to-cell variability and enables lineage reconstruction. Nat Biotechnol 34, 852–856, doi: 10.1038/nbt.3598 (2016). [DOI] [PubMed] [Google Scholar]
- 22.Zhu C et al. Single-Cell 5-Formylcytosine Landscapes of Mammalian Early Embryos and ESCs at Single-Base Resolution. Cell Stem Cell 20, 720–731 e725, doi: 10.1016/j.stem.2017.02.013 (2017). [DOI] [PubMed] [Google Scholar]
- 23.Wu X, Inoue A, Suzuki T & Zhang Y Simultaneous mapping of active DNA demethylation and sister chromatid exchange in single cells. Genes Dev 31, 511–523, doi: 10.1101/gad.294843.116 (2017). [DOI] [PMC free article] [PubMed] [Google Scholar]
- 24.Macosko EZ et al. Highly Parallel Genome-wide Expression Profiling of Individual Cells Using Nanoliter Droplets. Cell 161, 1202–1214, doi: 10.1016/j.cell.2015.05.002 (2015). [DOI] [PMC free article] [PubMed] [Google Scholar]
- 25.Klein AM et al. Droplet barcoding for single-cell transcriptomics applied to embryonic stem cells. Cell 161, 1187–1201, doi: 10.1016/j.cell.2015.04.044 (2015). [DOI] [PMC free article] [PubMed] [Google Scholar]
- 26.Preissl S et al. Single-nucleus analysis of accessible chromatin in developing mouse forebrain reveals cell-type-specific transcriptional regulation. Nat Neurosci 21, 432–439, doi: 10.1038/s41593-018-0079-3 (2018). [DOI] [PMC free article] [PubMed] [Google Scholar]
- 27.Lake BB et al. Integrative single-cell analysis of transcriptional and epigenetic states in the human adult brain. Nat Biotechnol 36, 70–80, doi: 10.1038/nbt.4038 (2018). [DOI] [PMC free article] [PubMed] [Google Scholar]
- 28.Luo C et al. Single-cell methylomes identify neuronal subtypes and regulatory elements in mammalian cortex. Science 357, 600–604, doi: 10.1126/science.aan3351 (2017). [DOI] [PMC free article] [PubMed] [Google Scholar]
- 29.Cao J et al. Joint profiling of chromatin accessibility and gene expression in thousands of single cells. Science 361, 1380–1385, doi: 10.1126/science.aau0730 (2018). [DOI] [PMC free article] [PubMed] [Google Scholar]
- 30.Chen S, Lake BB & Zhang K High-throughput sequencing of the transcriptome and chromatin accessibility in the same cell. Nat Biotechnol, doi: 10.1038/s41587-019-0290-0 (2019). [DOI] [PMC free article] [PubMed] [Google Scholar]
- 31.Zhu C et al. An ultra high-throughput method for single-cell joint analysis of open chromatin and transcriptome. Nat Struct Mol Biol 26, 1063–1070, doi: 10.1038/s41594-019-0323-x (2019). [DOI] [PMC free article] [PubMed] [Google Scholar]
- 32.Luo C et al. Single nucleus multi-omics links human cortical cell regulatory genome diversity to disease risk variants. bioRxiv, 2019.2012.2011.873398, doi: 10.1101/2019.12.11.873398 (2019). [DOI] [PMC free article] [PubMed] [Google Scholar]
- 33.Zhu C, Preissl S & Ren B Single-cell multimodal omics: the power of many. Nat Methods 17, 11–14, doi: 10.1038/s41592-019-0691-5 (2020). [DOI] [PubMed] [Google Scholar]
- 34.Rosenberg AB et al. Single-cell profiling of the developing mouse brain and spinal cord with split-pool barcoding. Science 360, 176–182, doi: 10.1126/science.aam8999 (2018). [DOI] [PMC free article] [PubMed] [Google Scholar]
- 35.Ernst J et al. Mapping and analysis of chromatin state dynamics in nine human cell types. Nature 473, 43–49, doi: 10.1038/nature09906 (2011). [DOI] [PMC free article] [PubMed] [Google Scholar]
- 36.Zeisel A et al. Molecular Architecture of the Mouse Nervous System. Cell 174, 999–1014 e1022, doi: 10.1016/j.cell.2018.06.021 (2018). [DOI] [PMC free article] [PubMed] [Google Scholar]
- 37.Magklara A et al. An epigenetic signature for monoallelic olfactory receptor expression. Cell 145, 555–570, doi: 10.1016/j.cell.2011.03.040 (2011). [DOI] [PMC free article] [PubMed] [Google Scholar]
- 38.Baroti T et al. Transcription factors Sox5 and Sox6 exert direct and indirect influences on oligodendroglial migration in spinal cord and forebrain. Glia 64, 122–138, doi: 10.1002/glia.22919 (2016). [DOI] [PubMed] [Google Scholar]
- 39.Li YE et al. An Atlas of Gene Regulatory Elements in Adult Mouse Cerebrum. bioRxiv, 2020.2005.2010.087585, doi: 10.1101/2020.05.10.087585 (2020). [DOI] [PMC free article] [PubMed] [Google Scholar]
- 40.Briata P et al. Transcriptional repression by the human homeobox protein EVX1 in transfected mammalian cells. J Biol Chem 270, 27695–27701, doi: 10.1074/jbc.270.46.27695 (1995). [DOI] [PubMed] [Google Scholar]
- 41.Katsuoka F et al. Small Maf compound mutants display central nervous system neuronal degeneration, aberrant transcription, and Bach protein mislocalization coincident with myoclonus and abnormal startle response. Mol Cell Biol 23, 1163–1174, doi: 10.1128/mcb.23.4.1163-1174.2003 (2003). [DOI] [PMC free article] [PubMed] [Google Scholar]
- 42.Park NI et al. ASCL1 Reorganizes Chromatin to Direct Neuronal Fate and Suppress Tumorigenicity of Glioblastoma Stem Cells. Cell Stem Cell 21, 209–224 e207, doi: 10.1016/j.stem.2017.06.004 (2017). [DOI] [PubMed] [Google Scholar]
- 43.Yang N et al. Generation of pure GABAergic neurons by transcription factor programming. Nat Methods 14, 621–628, doi: 10.1038/nmeth.4291 (2017). [DOI] [PMC free article] [PubMed] [Google Scholar]
- 44.Lennard Richard ML, Nowling TK, Brandon D, Watson DK & Zhang XK Fli-1 controls transcription from the MCP-1 gene promoter, which may provide a novel mechanism for chemokine and cytokine activation. Mol Immunol 63, 566–573, doi: 10.1016/j.molimm.2014.07.013 (2015). [DOI] [PMC free article] [PubMed] [Google Scholar]
- 45.Meng G & Mei H Transcriptional Dysregulation Study Reveals a Core Network Involving the Progression of Alzheimer’s Disease. Front Aging Neurosci 11, 101, doi: 10.3389/fnagi.2019.00101 (2019). [DOI] [PMC free article] [PubMed] [Google Scholar]
- 46.Yu M & Ren B The Three-Dimensional Organization of Mammalian Genomes. Annu Rev Cell Dev Biol 33, 265–289, doi: 10.1146/annurev-cellbio-100616-060531 (2017). [DOI] [PMC free article] [PubMed] [Google Scholar]
- 47.Pliner HA et al. Cicero Predicts cis-Regulatory DNA Interactions from Single-Cell Chromatin Accessibility Data. Mol Cell 71, 858–871 e858, doi: 10.1016/j.molcel.2018.06.044 (2018). [DOI] [PMC free article] [PubMed] [Google Scholar]
- 48.Ngan CY et al. Chromatin interaction analyses elucidate the roles of PRC2-bound silencers in mouse development. Nat Genet 52, 264–272, doi: 10.1038/s41588-020-0581-x (2020). [DOI] [PMC free article] [PubMed] [Google Scholar]
- 49.Pang B & Snyder MP Systematic identification of silencers in human cells. Nat Genet 52, 254–263, doi: 10.1038/s41588-020-0578-5 (2020). [DOI] [PMC free article] [PubMed] [Google Scholar]
- 50.Wang Y, Lin L, Lai H, Parada LF & Lei L Transcription factor Sox11 is essential for both embryonic and adult neurogenesis. Dev Dyn 242, 638–653, doi: 10.1002/dvdy.23962 (2013). [DOI] [PubMed] [Google Scholar]
References:
- 51.Zhu C et al. High-throughput single-cell joint analysis of histone modifications and gene expression by Paired-Tag. ProtocolExchange, DOI: 10.21203/rs.3.pex-1301/v1 (2021). [DOI] [Google Scholar]
- 52.Cao J et al. The single-cell transcriptional landscape of mammalian organogenesis. Nature 566, 496–502, doi: 10.1038/s41586-019-0969-x (2019). [DOI] [PMC free article] [PubMed] [Google Scholar]
- 53.Mulqueen RM et al. Improved single-cell ATAC-seq reveals chromatin dynamics of <em>in vitro</em> corticogenesis. bioRxiv, 637256, doi: 10.1101/637256 (2019). [DOI] [Google Scholar]
- 54.Langmead B & Salzberg SL Fast gapped-read alignment with Bowtie 2. Nat Methods 9, 357–359, doi: 10.1038/nmeth.1923 (2012). [DOI] [PMC free article] [PubMed] [Google Scholar]
- 55.Langmead B, Trapnell C, Pop M & Salzberg SL Ultrafast and memory-efficient alignment of short DNA sequences to the human genome. Genome Biol 10, R25, doi: 10.1186/gb-2009-10-3-r25 (2009). [DOI] [PMC free article] [PubMed] [Google Scholar]
- 56.Dobin A & Gingeras TR Mapping RNA-seq Reads with STAR. Curr Protoc Bioinformatics 51, 11 14 11–19, doi: 10.1002/0471250953.bi1114s51 (2015). [DOI] [PMC free article] [PubMed] [Google Scholar]
- 57.Stuart T et al. Comprehensive Integration of Single-Cell Data. Cell 177, 1888–1902 e1821, doi: 10.1016/j.cell.2019.05.031 (2019). [DOI] [PMC free article] [PubMed] [Google Scholar]
- 58.Korsunsky I et al. Fast, sensitive and accurate integration of single-cell data with Harmony. Nat Methods 16, 1289–1296, doi: 10.1038/s41592-019-0619-0 (2019). [DOI] [PMC free article] [PubMed] [Google Scholar]
- 59.Leland McInnes JH, Nathaniel Saul, Lukas Großberger. UMAP: Uniform Manifold Approximation and Projection. Journal of Open Source Software 3, 861 (2018). [Google Scholar]
- 60.Fang R et al. SnapATAC: A Comprehensive Analysis Package for Single Cell ATAC-seq. bioRxiv, 615179, doi: 10.1101/615179 (2020). [DOI] [Google Scholar]
- 61.Schep AN, Wu B, Buenrostro JD & Greenleaf WJ chromVAR: inferring transcription-factor-associated accessibility from single-cell epigenomic data. Nat Methods 14, 975–978, doi: 10.1038/nmeth.4401 (2017). [DOI] [PMC free article] [PubMed] [Google Scholar]
- 62.Heinz S et al. Simple combinations of lineage-determining transcription factors prime cis-regulatory elements required for macrophage and B cell identities. Mol Cell 38, 576–589, doi: 10.1016/j.molcel.2010.05.004 (2010). [DOI] [PMC free article] [PubMed] [Google Scholar]
- 63.Khan A et al. JASPAR 2018: update of the open-access database of transcription factor binding profiles and its web framework. Nucleic Acids Res 46, D260–D266, doi: 10.1093/nar/gkx1126 (2018). [DOI] [PMC free article] [PubMed] [Google Scholar]
- 64.Robinson MD, McCarthy DJ & Smyth GK edgeR: a Bioconductor package for differential expression analysis of digital gene expression data. Bioinformatics 26, 139–140, doi: 10.1093/bioinformatics/btp616 (2010). [DOI] [PMC free article] [PubMed] [Google Scholar]
- 65.Ernst J & Kellis M Chromatin-state discovery and genome annotation with ChromHMM. Nat Protoc 12, 2478–2492, doi: 10.1038/nprot.2017.124 (2017). [DOI] [PMC free article] [PubMed] [Google Scholar]
Associated Data
This section collects any data citations, data availability statements, or supplementary materials included in this article.
Supplementary Materials
Supplementary Tables 8. TF motif enrichment - gene expression correlation. This table listed Spearman’s correlation coefficients between motif enrichment (chromVAR deviations) and gene expression (RPKM) across clusters for 342 transcription factors.
Supplementary Tables 10. Predicted target genes by groups. This table listed the predicted target genes from both H3K27ac- and H3K27me3- associated pairs for each group in Fig.5.
Supplementary Tables 1. Paired-Tag primer sequences. This table shows the primer and barcode sequences used in Paired-Tag experiments.
Supplementary Tables 9. Predicted cCRE-gene pairs. This table listed the predicted H3K27ac- and H3K27me3- associated cCRE-gene pairs in Fig.5.
Supplementary Tables 3. Marker genes by clusters. This table shows the differentially expressed genes between the clusters obtained from Paired-Tag RNA profiles. P-value: two-sided Wilcoxon Rank Sum test and adjusted by Bonferroni correction using all features in the dataset.
Supplementary Tables 4. Promoters by groups. This table listed the genes of different groups classified by epigenetic states of the corresponding promoters described in Fig.3.
Supplementary Tables 5. Gene Ontology analysis of genes from different groups. This table summarized the Gene Ontology analysis results for genes from each group in Fig.3. P-value: one-sided Binomial test.
Supplementary Tables 2. Nuclei metadata. This table shows the sequencing quality, mapping status, clustering and annotation information of single nuclei in this study.
Supplementary Tables 7. Known Motifs Enrichment analysis of CREs from different groups. This table summarized the enrichment of known motifs for CREs from each group in Fig.4. P-value: one-sided Binomial test.
Supplementary Tables 6. cis-Regulatory elements by groups. This table listed the CREs of different groups classified by their epigenetic states described in Fig.4.
Data Availability Statement
The sequencing data obtained in this study have been deposited to the NCBI Gene Expression Omnibus (GEO) (http://www.ncbi.nlm.nih.gov/geo/) under accession number GSE152020. The processed data can be accessed from the web portal (http://catlas.org/pairedTag). All other data are available upon request.
CEMBA datasets were available from NEMO (https://nemoanalytics.org) with the accession number of RRID SCR_016152.
ENCODE (https://www.encodeproject.org/) datasets were downloaded with the accession numbers: H3K4me1 (ENCSR000APW), H3K27ac (ENCSR000AOC), H3K27me3 (ENCSR000DTY), H3K9me3 (ENCSR000AQO), DNase-seq (ENCSR959ZXU).
The other external datasets were downloaded from NCBI Gene Expression Omnibus (GEO) (http://www.ncbi.nlm.nih.gov/geo/), with the accession numbers: SPLiT-seq (GSE110823), CoBATCH (GSE129335), itChIP (GSE109762) and HT-scChIP-seq (GSE117309).
10X scRNA-seq datasets were downloaded from 10x genomics website (https://www.10xgenomics.com/).