

Summary
Bariatric surgery is the most effective treatment for type 2 diabetes and is associated with changes in gut metabolites. Previous work uncovered a gut-restricted TGR5 agonist with anti-diabetic properties – cholic acid-7-sulfate (CA7S) – that is elevated following sleeve gastrectomy (SG). Here, we elucidate a microbiome-dependent pathway by which SG increases CA7S production. We show that a microbial metabolite, lithocholic acid (LCA), is increased in murine portal veins post-SG and by activating the vitamin D receptor, induces hepatic mSult2A1/hSULT2A expression to drive CA7S production. An SG-induced shift in the microbiome increases gut expression of the bile acid transporters Asbt and Ostα, which in turn facilitate selective transport of LCA across the gut epithelium. Cecal microbiota transplant from SG animals is sufficient to recreate the pathway in germ-free (GF) animals. Activation of this gut-liver pathway leads to CA7S synthesis and GLP-1 secretion, causally connecting a microbial metabolite with the improvement of diabetic phenotypes.
Graphical Abstract
eTOC Blurb
Bariatric surgery’s anti-diabetic effects are linked to microbiome through unknown mechanisms. Chaudhari et al. show that selective transport of the microbial metabolite LCA from the gut to the liver after bariatric surgery activates hepatic VDR, thereby inducing expression of bile acid sulfotransferase SULT2A, which produces the anti-diabetic molecule CA7S.
Introduction
Bariatric surgery is currently the most effective and durable treatment for obesity-related type 2 diabetes (T2D). Sleeve gastrectomy (SG) is the most frequently performed bariatric surgery in the United States (Abbasi, 2017). Even though maximal weight-loss occurs one year post-surgery, many patients experience near-immediate resolution in their diabetic phenotypes following SG (Heshmati et al., 2019). The molecular mechanisms underlying this early and rapid amelioration in diabetes remains largely unknown. Clinical research has identified three major changes that occur consistently following surgery: 1. an increase in levels of GLP-1, a circulating incretin hormone; 2. changes in the bile acid (BA) repertoire; and 3. changes in gut microbiome composition (Wang et al., 2019). Previous studies have documented overall changes to BA pools post-surgery (Kohli et al., 2013; Patti et al., 2009; Pournaras et al., 2012). Recently, we have demonstrated the importance of studying changes in levels of individual BAs after bariatric surgery (Chaudhari et al., 2020). We identified a specific BA, cholic acid-7-sulfate (CA7S), that is increased in both murine cecal contents and feces of human patients post-SG. We determined that CA7S is a potent agonist of the G protein-coupled receptor TGR5 (GPBAR1) and induces GLP-1 secretion. When administered to diet-induced obese (DIO) mice, CA7S increases insulin secretion and induces systemic glucose clearance. However, the origin of increased production of CA7S post-SG is unknown. Moreover, there are still no known causal links between SG, the microbiome, and subsequent amelioration of T2D.
Changes to gut microbial community composition following surgery can influence metabolic outcomes (Medina et al., 2017; Tremaroli et al., 2015). Specifically, SG changes the relative abundance of certain gut bacteria, and in particular, leads to an increase in the abundance of species known to improve diabetes and obesity phenotypes (Ryan et al., 2014). Fecal transplants from human patients and mice post-bariatric surgery confer metabolic benefits to obese mice, including improved glucose tolerance, insulin sensitivity, and weight-loss (Liu et al., 2018; Ryan et al., 2014). Importantly, antibiotic-mediated disruption of the intestinal microbiota abolishes the effectiveness of SG in mice (Jahansouz et al., 2018). These findings raise the possibility that gut bacteria are causally involved in beneficial metabolic changes post-SG.
Here we demonstrate that a specific bacterial metabolite, lithocholic acid (LCA), influences host metabolism by inducing synthesis of CA7S in human hepatocytes and the murine liver. We found that the amount of LCA transported from the gut to the liver via the portal vein is increased in mice following SG. We show that LCA activates the vitamin D receptor (VDR) and induces cholic acid (CA) sulfonation both in vitro in human hepatocytes and in vivo in mice, revealing a potential mechanism by which gut bacteria ‘communicate’ with the host in the enterohepatic axis. We demonstrate that LCA-mediated synthesis of CA7S in human hepatocytes can induce GLP-1 secretion in human enteroendocrine cells, providing a mechanistic link between BA changes observed post-SG and the metabolic benefits of this surgery. Cecal microbiota transplant (CMT) from post-SG mice into germ-free (GF) recipient mice resulted in increased transport of LCA into the portal vein and increased levels of CA7S in the cecum compared to CMT from post-sham animals. These data suggest that a shift in the microbiome post-SG results in increased flux through pathway responsible for the production of the anti-diabetic metabolite CA7S.
Results
Production of cholic acid-7-sulfate (CA7S) and induction of GLP-1 requires a microbiome
To determine if the microbiome plays a role in production of CA7S, SG or sham surgery was performed on antibiotic-treated or untreated diet-induced obese (DIO) mice. Mice were euthanized six weeks post-surgery to measure early post-operative changes (Figure 1A). BA levels in tissues were quantified using Ultra-high Performance Liquid Chromatography-Mass Spectrometry (UPLC-MS). Consistent with our previous observations, SG mice displayed higher levels of CA7S in their cecal contents post-surgery compared to shams (Figure 1B). However, treatment of mice with antibiotics prior to surgery abolished the SG-mediated increase in CA7S levels (Figure 1C). Notably, the overall levels of CA7S were significantly lower in the antibiotic-treated cohort compared to the untreated mice (Figure 1B,C). These results led us to hypothesize that a microbiome is necessary for production of CA7S in mice. To investigate this question, we quantified CA7S in conventional DIO mice, antibiotic-treated DIO mice, or GF DIO mice. Remarkably, we observed that the levels of CA7S in the antibiotic-treated and GF mouse intestines were 100- to 200-fold lower than the CA7S levels in fully-colonized mice (Figure 1D). CA7S levels were undetectable in the livers of antibiotic-treated and GF mice (Figure 1E). These results indicate that a microbiome is required for robust production of CA7S.
Figure 1. Sleeve Gastrectomy (SG)-mediated increase in levels of CA7S and GLP-1 requires a microbiome.

(A) Schematic of SG and sham surgery in diet-induced obese (DIO) mice treated with or without antibiotics (Abx.).
(B,C) CA7S levels in cecal contents of mice subjected to SG or Sham surgeries treated with or without antibiotics (Abx.) (B, Sham n=7, SG n=6, *p=0.01; C, n=5 in each group, ns=not significant p=0.26, Welch’s t test).
(D,E) CA7S levels in cecal contents (D) and liver (E) of conventional DIO mice were significantly higher than antibiotic-treated (+ Abx.) or GF DIO mice (Cecum: DIO, n=10, DIO + Abx., n=9, DIO; GF, n=8, DIO vs. DIO + Abx. ****p<1.00x10⁻⁴, DIO vs. DIO;GF ****p<1.00x10⁻⁴; Liver: DIO, n=9, DIO + Abx., n=9, DIO; GF, n=8; DIO vs. DIO + Abx. ***p=2.00x10⁻⁴, DIO vs. DIO; GF ***p=5.00x10⁻⁴, one-way ANOVA followed by Dunnett’s multiple comparisons test).
(F,G) GLP-1 levels in systemic circulation of mice subjected to SG or Sham surgeries treated with or without antibiotics. (Data not marked with asterisk(s) are not significant. For F, Sham n=3, SG n=6, *p=0.01; for G, n=5 in each group, p=0.26, Welch’s t test).
(H) The mammalian sulfotransferase enzyme SULT2A (mSULT2A in mice and hSULT2A in humans) catalyzes the conversion of the primary bile acid cholic acid (CA) to cholic acid-7-sulfate (CA7S).
(I) qRT-PCR quantification of mSult2A isoforms reported to sulfate bile acids in the murine liver. Expression levels were normalized to 18S (data not marked with asterisk(s) are not significant. n=11 in each group, mSult2A1 *p=0.04, mSult2A2 p=0.92, mSult2A8 p=0.78, Welch’s t test).
(J) As measured by qRT-PCR, the hepatic expression of mSult2A1 was significantly higher in DIO mice than DIO + Abx. mice and DIO;GF mice. Expression levels were normalized to mouse ribosomal 18S (DIO, n=9, DIO + Abx., n=9, DIO;GF, n=8; DIO vs. DIO + Abx. ****p<1x10⁻⁴, DIO vs. DIO;GF ****p<1x10⁻⁴, one-way ANOVA followed by Dunnett’s multiple comparisons test).
All data are presented as mean ± SEM.
CA7S triggers the activation of TGR5 and subsequently GLP-1 secretion to improve glucose tolerance in vivo (Chaudhari et al., 2020). GLP-1 is a major mediator of diabetes remission post-SG (Kaska et al., 2016; Larraufie et al., 2019). Consistent with our previous studies, we observed an increase in circulating levels of GLP-1 in DIO mice that were subjected to SG (Chaudhari et al., 2020) (Figure 1F). However, treatment of DIO mice with antibiotics pre- and post-SG ablated the SG-mediated increase in GLP-1 secretion (Figure 1G). This result suggests that a microbiome is required to induce SG-mediated GLP-1 secretion in vivo.
The microbiome induces the synthesis of CA7S by the mammalian liver
We next sought to investigate whether the microbiome synthesizes or modifies CA7S directly. To determine if the microbiome in sham or SG mice are capable of synthesizing CA7S, we cultured bacteria from cecal stools of these mice in the presence of CA and analyzed the resultant bacterial cultures by UPLC-MS (Figure S1A). Consistent with previous reports, we did not observe CA7S synthesis by sham or SG cecal bacteria following incubation for 7 days (Figure S1B) (Alnouti, 2009; Wahlstrom et al., 2016). Culturing bacteria in the presence of CA7S for 7 days resulted in no observable hydrolysis of CA7S to CA, suggesting that CA7S is not desulfated by gut bacteria (Figure S1C). Bacteria can also produce CA7S by deconjugating tauro-conjugated cholic acid-7-sulfate (TCA7S), the host-produced, taurine-conjugated form of CA7S (Marion et al., 2019) (Figure S2). As expected, we observed deconjugation of TCA7S to CA7S by cecal bacteria (Figures S1D, S2). However, we did not observe a significant difference in deconjugation efficiency between sham and SG bacteria (Figure S1D). Moreover, quantification of TCA7S in mouse cecal stool and liver using quadruple time-of-flight MS (QTOF-MS) showed no significant difference in TCA7S levels between the sham and SG cohorts (Figure S1E). Together, these data suggest that neither microbial production of CA7S nor microbial breakdown of TCA7S accounts for the increase in CA7S levels observed in SG mice.
Sulfonation of BAs primarily occurs in the mammalian liver via BA-sulfotransferase enzymes or SULTs (Figure 1H) (Alnouti, 2009). Three isoforms of BA-SULTs have been identified in mice (mSULT2A1, mSULT2A2, and mSULT2A8) and one isoform in humans (hSULT2A) that specifically sulfate BAs (Alnouti, 2009; Dawson and Setchell, 2017; Feng et al., 2017). Post-SG mouse livers exhibited higher expression levels of the mSult2A1 isoform than sham livers, while there were no differences in expression of the mSult2A2 or mSult2A8 isoforms (Figure 1I, refer Table S1 for all qPCR primer sequences). Therefore, increased expression of mSult2A1 in mouse livers post-SG likely contributes to increased CA7S production in SG mice. The expression levels of mSult2A1 were significantly reduced in antibiotic-treated and GF mouse livers compared to DIO mice (Figure 1J). These results suggest that a microbiome is required for the production of CA7S from CA by mSULT2A1 in the liver.
Portal vein BAs induce expression of the liver sulfotransferase mSult2A1/hSULT2A
BAs tightly regulate their own synthesis and sulfonation via enterohepatic recirculation (Alnouti, 2009). Based on the finding that a microbiome is required for production of CA7S, we investigated whether bacterially modified BAs transported to the liver through the portal vein are causally involved in CA7S production. We performed BA profiling on portal veins harvested from sham and SG mice that were treated with antibiotics or untreated prior to surgery (Figure 2A). Total BA levels in the portal veins of mice post-SG did not differ significantly from sham controls in both groups (Figure 2B,C). To test whether post-SG portal vein BAs can induce expression of the BA sulfotransferase and whether this induction is dependent on the microbiome, we generated in vitro pools of BAs that mimicked the average physiological ratios observed in conventional and antibiotic-treated sham and SG portal veins (Figure 2D,E). We then tested the ability of these reconstituted BA pools to induce expression of the hSULT2A in human liver HepG2 cells (Alnouti, 2009). We found that conventional SG portal vein BAs significantly induced hSULT2A expression in vitro compared to the conventional sham BA pools, while hSULT2A expression was significantly reduced when cells were incubated with antibiotic-treated sham portal BAs compared to untreated sham portal BAs (Figure 2D-F). We observed similar induction of mSult2A1 expression when murine liver cells (Hepa 1-6) were incubated with the SG pool of portal BAs compared to the sham pool (Figure S3A). Strikingly, we found that BA pools from antibiotic-treated SG mice did not induce hSULT2A expression compared to antibiotic-treated shams at all concentrations tested (Figure 2E). These results suggest that BAs recirculated from the intestine to the liver via the portal vein post-SG can induce expression of hSULT2A in liver cells and that this induction is microbiome-dependent.
Figure 2. Portal vein BAs induce expression of hSULT2A1 in hepatocytes in vitro.

(A) Schematic of portal vein BA analysis in indicated groups of mice.
(B) Portal vein BAs in DIO mice 6 weeks post-Sham and SG (n=21 in each group; data not marked with asterisk(s) are not significant). All bile acids with measurable concentrations above the limit of detection are shown. Lithocholic acid (LCA) was the only bile acid whose levels were significantly increased post-SG (*p=0.01). (Total bile acids, p=0.51, α/βMCA, alpha-muricholic acid and beta-muricholic acid, p=0.35, Tα/βMCA, tauro-alpha- and tauro-beta-muricholic acid, p=0.08; TCA, tauro-cholic acid, p=0.20; TCDCA, tauro-chenodeoxycholic acid, p=0.07; TωMCA, tauro-omega-muricholic acid, p=0.11; CA, cholic acid, p=0.78; CDCA, chenodeoxycholic acid, p=0.45; TDCA, tauro-deoxycholic acid, p=0.45; Welch’s t test).
(C) Portal vein BAs in DIO mice treated with antibiotics post-sham and SG (n=5 in each group; data not marked with asterisk(s) are not significant. LCA, CA, TDCA, and CDCA were undetectable in portal veins of both groups. (Total bile acids, p=0.81, α/βMCA, alpha-muricholic acid and beta-muricholic acid, p=0.43; Tα/βMCA, tauro-alpha- and tauro-beta-muricholic acid, p=0.93; TCA, tauro-cholic acid, p=0.36; TCDCA, tauro-chenodeoxycholic acid, p=0.23; TωMCA, tauro-omega-muricholic acid, p=0.98; CA, cholic acid; CDCA, chenodeoxycholic acid; TDCA, tauro-deoxycholic acid; LCA, lithocholic acid, not detected (n.d.), Welch’s t test).
(D-F) Concentrated pools of bile acids mimicking the mean physiological ratios of individual portal vein bile acids measured in conventional sham and SG and antibiotic-treated sham and SG mice were generated in vitro in DMSO. HepG2 cells were treated with dilutions of these pools (total bile acid concentrations of 100 μM, 500 μM, and 1000 μM). (D) As measured by qRT-PCR, the expression of hSULT2A was increased in conventional SG PV BA-treated cells compared to conventional sham PV BA-treated cells. For each concentration, expression of sham hSULT2A was normalized to 1. hSULT2A expression was normalized to human GAPDH (≥3 biological replicates per condition, SG PV bile acids, 100 μM *p=0.01, 500 μM *p=0.02, 1000 μM **p=1.00x10⁻³, Welch’s t test). (E) There were no significant differences in hSULT2A expression in cells incubated with Abx-treated SG and sham PV BA pools. For each concentration, expression of sham hSULT2A was normalized to 1. hSULT2A expression was normalized to human GAPDH (≥3 biological replicates per condition, SG-Abx. PV bile acids, ns=not significant, 100 μM p=0.82, 500 μM p=0.37, 1000 μM p=0.60, Welch’s t test). (F) As measured by qRT-PCR, the expression of hSULT2A was increased in conventional sham PV BA-treated cells and decreased in antibiotic sham PV BA-treated cells relative to DMSO control. hSULT2A expression was normalized to human GAPDH (≥3 biological replicates per condition, data not marked with asterisk(s) are not significant, 100 μM DMSO vs. Sham **p=5.60x10⁻³; 100 μM DMSO vs. Sham-Abx. p=0.82; 100 μM Sham vs. Sham-Abx. ***p=1.00x10⁻⁴; 500 μM DMSO vs. Sham p=0.29; 500 μM DMSO vs. Sham-Abx. p=0.98; 500 μM Sham vs. Sham-Abx. *p=0.04; 1000 μM DMSO vs. Sham *p=0.03; 1000 μM DMSO vs. Sham-Abx. p=0.97; 1000 μM Sham vs. Sham-Abx. **p=2.30x10⁻³, two-way ANOVA followed by Dunnett’s multiple comparisons test).
All data are presented as mean ± SEM.
The microbial metabolite LCA induces expression of mSult2A1/hSULT2A via the Vitamin D receptor (VDR)
Portal vein BA profiling revealed differences between antibiotic-treated mice compared to untreated, fully colonized mice (Figure 2B,C). Specifically, four BAs – chenodeoxycholic acid (CDCA), tauro-deoxycholic acid (TDCA), cholic acid (CA), and lithocholic acid (LCA) – were present in the portal veins of conventional sham and SG mice but undetectable in the portal veins of antibiotic-treated mice (Figure 2B,C). To identify which of these BA(s) can induce expression of mSult2A1/hSULT2A, we tested the ability of these four molecules to induce expression of hSULT2A in HepG2 cells. LCA induced hSULT2A expression in a dose-dependent manner, while CDCA, TDCA, and CA did not induce hSULT2A expression at all concentrations tested (Figure 3A). We observed similar induction of mSult2A1 expression when murine liver cells (Hepa 1-6) were incubated with LCA (Figure S3B). LCA is a microbiome-derived secondary BA. These results are therefore consistent with our observation that mSult2A1 expression requires a microbiome. Moreover, using portal vein BA profiling, we observed that LCA levels were significantly higher (~2.5-fold) in the portal veins of SG mice compared to sham mice (Figure 2B). Importantly, LCA was the only BA whose levels were significantly increased in portal veins post-SG (Figure 2B). Together, our results indicate that the microbial metabolite LCA is transported via the portal vein to the liver post-SG and induces expression of hepatic mSult2A1.
Figure 3. LCA induces expression of SULT via the Vitamin D receptor (VDR), resulting in production of CA7S and GLP-1 secretion.

(A) qRT-PCR quantification of hSULT2A expression level in HepG2 cells treated with indicated concentrations of CA, TDCA, CDCA, or LCA normalized to human GAPDH. LCA increased hSULT2A expression in a dose-dependent manner relative to DMSO control. (≥3 biological replicates per condition, data marked with asterisk(s) are only for induction of hSULT2A. CA, 0.1 μM **p=8.90x10⁻³, 1 μM **p=5.40x10⁻³, 10 μM **p=5.30x10⁻³, 100 μM **p=8.40x10⁻³; TDCA, 0.1 μM ****p=1.00x10⁻⁴, 1 μM ****p=1.00x10⁻⁴, 10 μM ****p=1.00x10⁻⁴, 100 μM ****p=1.00x10⁻⁴; CDCA, 0.1 μM **p=1.80x10⁻³, 1 μM **p=2.50x10⁻³, 10 μM **p=9.30x10⁻³, 100 μM p=0.21; LCA, 0.1 μM p=0.92, 1 μM p=0.95, 10 μM **p=5.86x10⁻³, 100 μM *p=0.04, one-way ANOVA followed by Dunnett’s multiple comparisons test).
(B) siRNA-mediated knockdown of VDR significantly reduced LCA-mediated induction of hSULT2A in HepG2 cells compared to negative control siRNA (≥3 biological replicates per condition, *p=0.01, Welch’s t test).
(C) Vdr expression levels in mouse livers were increased in SG compared to sham mice as determined by qRT-PCR. Expression was normalized to mouse ribosomal 18S (n=11 in each group; *p=0.02, Welch’s t test).
(D) Hepatic expression of Vdr was increased in DIO mice compared to DIO + Abx. mice and DIO; GF mice. Expression levels were normalized to mouse ribosomal 18S (DIO, n=9, DIO + Abx., n=10, DIO;GF, n=8; DIO vs. DIO + Abx. **p=3.50x10⁻³, DIO vs. DIO;GF **p=3.90x10⁻³, one-way ANOVA followed by Dunnett’s multiple comparisons test).
(E) CA7S levels were reduced in feces of Vdr-knockout (KO) mice compared to wild-type (WT) mice (female WT, n=4, Vdr-KO, n=7, *p=0.01, male WT, n=7, Vdr-KO, n=9, *p=0.01, Welch’s t test).
(F) Schematic of portal vein injection with LCA (GB=gallbladder).
(G,H) Quantitative real time PCR quantification of mSult2A1 (G) and Vdr (H) expression levels in mouse livers injected with LCA or PBS normalized to mouse ribosomal 18S (n=3; for (G) *p=0.02, for (H) *p=0.03, Welch’s t test).
(I) CA7S levels in the gallbladder of mice injected with LCA or PBS normalized to mouse ribosomal 18S (n=3; *p=0.02, Welch’s t test).
(J) Synthesis of CA7S in HepG2 cells requires the cofactor PAPS, is induced upon incubation with LCA, and is dependent on VDR. Vdr siRNA was used to knockdown Vdr expression. 48 hours post-knockdown, substrate CA and ligand LCA was added as indicated. CA7S production was quantified by UPLC-MS after 16 hours. (≥3 biological replicates per condition, data marked with asterisk(s) are only for production of CA7S; CA+LCA+PAPS vs. CA+PAPS **p=2.70x10⁻³, CA+LCA+PAPS vs. CA+LCA+PAPS+Vdr siRNA **p=1.60x10⁻³, one-way ANOVA followed by Dunnett’s multiple comparisons test).
(K) Schematic of co-culture study. Liver HepG2 cells were cultured in the basolateral chamber, while NCI-H716 enteroendocrine cells were cultured separately in transwell inserts, and combined to measure GLP-1 secretion for indicated treatments.
(L) Secretion of GLP-1 by NCI-H716 cells co-cultured with HepG2 cells was induced by addition of LCA, CA, and PAPS to liver cells and was reduced by siRNA-mediated knockdown of VDR in liver cells. (≥3 biological replicates per condition, data not marked by asterisk(s) are not significant, DMSO vs. CA p=0.96; DMSO vs. CA+PAPS p=0.26; DMSO vs. CA+LCA p=0.12; DMSO vs. CA+LCA+PAPS ****p<1.00x10⁻⁴; DMSO vs. CA+LCA+PAPS+VDR siRNA p=0.49; CA vs. CA+LCA+PAPS ***p=3.00x10⁻³; CA+LCA vs. CA+LCA+PAPS *p=0.04; CA+PAPS vs. CA+LCA+PAPS *p=0.01; CA+LCA+PAPS vs. CA+LCA+PAPS+VDR siRNA *p=0.02, one-way ANOVA followed by Dunnett’s multiple comparisons test).
All data are presented as mean ± SEM.
We next sought to identify the receptor(s) that facilitate LCA-mediated induction of SULT expression. LCA has been shown to bind certain nuclear hormone receptors, including the farnesoid X receptor (FXR or NR1H4), the pregnane X receptor (PXR or NR1l2), the vitamin D receptor (VDR), the constitutive androstane receptor (CAR or NR1l3), and the retinoid-related orphan receptors (RORα or RORA and RORγ or RORC), thereby inducing expression of SULTs (Fiorucci and Distrutti, 2015; Kakizaki et al., 2009; Runge-Morris et al., 2013). We took a candidate approach to investigate which receptor(s) is (are) responsible for LCA induction of hSULT2A. siRNA-mediated knockdown of VDR significantly reduced the LCA-dependent increase in hSULT2A expression in HepG2 cells, while knockdown of PXR, FXR, CAR, RORα, and RORγ did not significantly affect expression of hSULT2A (Figure 3B, S3C,D). VDR activation leads to increased VDR expression in hepatocytes (Han and Chiang, 2009). Hepatic Vdr expression was also higher in SG mice than in Sham mice (Figure 3C). In addition, Vdr expression levels were ~20-fold lower in GF mouse livers and were virtually undetectable in antibiotic-treated animals (Figure 3D). These data indicate that Vdr expression in the liver also requires the microbiome. Finally, BA analysis of Vdr-knockout mouse feces revealed that the levels of CA7S were significantly reduced compared to WT animals, demonstrating that VDR is required for production of CA7S in mice (Figure 3E).
To test whether the effects observed in antibiotic-treated animals could be due to off-target effects of antibiotics on mammalian cells, we measured cell viability in human and liver cells (HepG2 and Hepa 1-6 cells, respectively) and expression levels of VDR and hSULT2A in HepG2 cells incubated with physiological concentrations of the antibiotic cocktail administered to mice. No toxicity or differences in gene expression were noted, suggesting that the effects of antibiotics observed in mice were due to the depletion of the microbiome (Figure S3E,F). Further, correlation analysis revealed a significant association between portal LCA levels and hepatic expression of mSult2A1 and Vdr in SG mice (Figure S3G,H).
To further test whether the proposed LCA-VDR-SULT2A1-CA7S pathway is operable in vivo, we injected LCA (50 μM) directly into the portal vein of DIO mice (Figure 3F). This concentration is within an order of magnitude of the physiological concentration of LCA in SG mouse portal veins (Figure 2B). Portal injection with methylene blue resulted in distribution of the dye to all lobes of the liver, anatomically demonstrating that portal injection of LCA would result in bioavailability of the ligand to nearly all hepatocytes (Figure S4). Two hours after portal vein injection of LCA, the expression levels of mSult2A1 and Vdr in mouse liver were significantly increased (Figure 3G,H). Strikingly, we observed an increase in CA7S levels in the gallbladder, suggesting that LCA injection in the portal vein resulted in CA7S synthesis and subsequent accumulation in the gallbladder (Figure 3I). Together, our results demonstrate that LCA, a microbial metabolite, is transported from the gut to the liver by the portal vein and induces mSult2A1 expression and CA7S production in the liver. Our data also suggest that the observed increase in levels of CA7S following SG is mediated by LCA-induced activation of VDR.
LCA-triggered CA7S synthesis induces GLP-1 secretion in enteroendocrine cells
We hypothesized that the LCA-induced increase in expression of hSULT2A or mSult2A1 in human or murine hepatocytes, respectively, would lead to increased synthesis of CA7S, which in turn could induce GLP-1 secretion. As a first step toward testing this hypothesis, we investigated the synthesis of CA7S in vitro. Incubation of HepG2 cells with CA, the precursor of CA7S, led to an increase in uptake of CA in hepatocytes, but no detectable CA7S levels were observed (Figure 3J). The addition of PAPS, the cofactor required as a sulfonate donor for SULTs, led to production of CA7S in hepatocytes (Figure 3J). Addition of LCA led to a significant increase in CA7S production (Figure 3J). Further, siRNA-mediated knockdown of VDR abolished LCA-mediated increase in synthesis of CA7S, demonstrating that LCA requires VDR activation to induce expression of hSULT2A and production of CA7S by hepatocytes (Figure 3J).
We next tested the ability of CA7S synthesized by HepG2 cells to induce secretion of GLP-1 by human enteroendocrine L-cells (NCI-H716) in a transwell setting (Figure 3K). L cells in the lower gut secrete GLP-1 in response to TGR5 activation (Duboc et al., 2014). Incubation of NCI-H716 cells with HepG2 cells previously induced to synthesize CA7S led to a significant increase in GLP-1 secretion (Figure 3L). Finally, siRNA-mediated knockdown of VDR, which abolishes synthesis of CA7S, led to a decrease in GLP-1 secretion, suggesting that activation of VDR is necessary for CA7S-mediated induction of GLP-1 secretion (Figure 3L). These results suggest that the LCA-VDR-SULT pathway functions in the enterohepatic axis to induce production of CA7S and subsequently induce GLP-1 secretion.
LCA production is lower in mouse cecum and human feces post-SG
The primary BAs cholic acid (CA) and chenodeoxycholic acid (CDCA) are converted into deoxycholic acid (DCA) and lithocholic acid (LCA), respectively, via 7α-dehydroxylation by Clostridia cluster XIV bacteria (Ridlon et al., 2006) (Figure 4A). Because mice post-SG displayed higher levels of LCA in the portal vein, we hypothesized that more LCA was being synthesized by bacteria in the intestine of mice post-SG. Contrary to our hypothesis, we had observed a significant decrease in levels of LCA in the cecum of mice post-SG, while the levels of DCA and total BAs were unchanged (Chaudhari et al., 2020). We observed similar changes in stool samples from human patients that had undergone SG. Levels of the bacterially produced BA LCA were lower in patient feces post-SG, while no change in levels of DCA and total BAs were observed (Chaudhari et al., 2020). These results suggest that SG in both mice and humans leads to a reduction in levels of the bacterial metabolite LCA in the colon, in surprising contrast to the increase observed in the portal vein.
Figure 4. The production of the secondary bile acid LCA is decreased in mice and humans post-SG.

(A) Host-produced conjugated bile acids are released into the gut post-prandially and converted into secondary bile acids through the enzymatic activity of gut bacteria. Deconjugation by bacterial bile salt hydrolases followed by 7α-dehydroxylation by enzymes encoded by the bile acid inducible (bai) operon converts cholic acid (CA) and chenodeoxycholic acid (CDCA) into deoxycholic acid (DCA) and lithocholic acid (LCA), respectively.
(B) Schematic and timeline of sham and SG mouse cecal samples subjected to 16S sequencing.
(C) Stacked bar plot showing mean relative abundances of phylum-level taxa in mouse samples (UK = Unknown, Sham, n=15; SG, n=17).
(D) Relative abundance of Clostridiales in sham and SG mice (Sham, n=15; SG, n=17, p=0.16, ns=not significant, Welch’s t test).
(E) qRT-PCR quantification of baiCD gene cluster expression levels in sham and SG mouse cecal contents normalized to bacterial 16S ribosomal DNA (Sham, n=10, SG, n=14, *p=0.02, Welch’s t test).
(F) Schematic and timeline of human pre- and post-SG fecal samples subjected to 16S sequencing.
(G) Stacked bar plot showing mean relative abundances of phylum-level taxa in human samples (UK = Unknown, n=17 patients).
(H) Relative abundance of Clostridiales in pre- and post-SG human feces (n=17 patients, **p=4.80x10⁻³, paired t test).
All data are presented as mean ± SEM.
To investigate whether the decrease in gut LCA levels could be a result of a decrease in LCA-producing gut bacteria post-SG, we performed 16S rRNA sequencing on sham and SG mouse cecal contents. Consistent with previous studies, we found that mice post-SG displayed a shift in the microbiome, including an increase in the abundance of the phyla Bacteroidetes and Proteobacteria (Figure 4B,C, S5A) (Jahansouz et al., 2017; Magouliotis et al., 2017). This shift was independent of a significant change in bacterial copy number, Shannon diversity, or Chao species richness (Figure S5B) (McGavigan et al., 2017). Although the mean relative abundance of Clostridiales, members of which produce LCA, was lower in post-SG mice, the difference was not statistically significant (p=0.16, Figure 4D). Bacterial synthesis of LCA requires the action of a series of enzymes encoded by genes in the BA-inducible (bai) operon (Ridlon et al., 2006). A key enzyme in the LCA biosynthesis cascade is a 3-oxo- / 3-oxo-4,5-dehydro-BA oxidoreductase encoded by the baiCD gene within the bai operon (Figure 4A) (Funabashi et al., 2020). Analysis of mouse cecal contents revealed that there was a significant (~100-fold) decrease in expression of the baiCD gene in SG compared to sham animals (Figure 4E) (Wells et al., 2003).
We observed similar phyla-level shifts independent of changes in bacterial copy number, Shannon diversity, or Chao species richness in human pre- and post-SG fecal samples, results that are also consistent with previous studies (Figure 4F,G, S5C,D) (Damms-Machado et al., 2015; Magouliotis et al., 2017; Medina et al., 2017). In human patients, the relative abundance of Clostridiales was significantly lower in post-SG fecal samples (Figure 4H, S5C,D). Prior work has also shown that bariatric surgery leads to a reduction of Clostridia in the gut (Damms-Machado et al., 2015; Magouliotis et al., 2017; McGavigan et al., 2017; Medina et al., 2017). Together, our results demonstrate a shift in the microbiome following SG resulting in a decrease in the synthesis of LCA in the gut of mice and humans. Notably, these data show that the observed increase in the microbial metabolite LCA in portal veins of SG mice does not result from an increase in total synthesis of LCA by gut bacteria.
The BA transporters Asbt and Ostα are overexpressed in mouse ileum post-SG
Based on our observation that levels of LCA were increased in the portal vein post-SG but decreased in the gastrointestinal (GI) tract, we investigated the influence of BA transporters in facilitating selective transport of LCA into portal circulation. Active transport of BAs occurs primarily in the ileum and is mediated by the apical sodium-dependent BA transporter (ASBT or SLC10A2) for Na+-dependent transport; the organic anion transporting polypeptide (OATP or SLC01A2) for Na+-independent transport; and members of the ABC family of proteins, including the bile salt export pump (BSEP or ABCB11), the organic solute transporters (OSTα/β or SLC51A/B), and multidrug resistant proteins (MRP or ABCC1) for ATP-dependent transport (Dawson et al., 2009). Further, transport of BAs from the apical to basolateral side of the intestinal epithelium is facilitated by direct binding to the ileal BA-binding protein (I-BABP or FABP6) (Figure 5A) (Besnard et al., 2004). We quantified expression levels of these BA transporters in the distal ileum of sham and SG mice by qPCR and found that expression of Asbt and Ostα were significantly elevated in the ileum of mice post-SG compared to the sham cohort (Figure 5B). ASBT and OSTα predominantly mediate transport of BAs from the intestine to the portal vein, and previous studies have observed a similar increase in levels of Asbt post-SG (Ding et al., 2016). Therefore, SG appears to increase expression of proteins involved in BA transport into the portal vein.
Figure 5. Intestinal BA transport proteins ASBT and OSTα facilitate selective transport of LCA into the portal vein.

(A) Schematic of proteins involved in BA transport from the intestinal lumen into the portal vein.
(B) qRT-PCR quantification of BA transport protein expression levels in sham and SG mouse distal ileum normalized to mouse ribosomal 18S. The expression of Asbt (apical sodium-dependent bile acid transporter) and Ostα (organic solute transporter α) were significantly increased post-SG. (Sham, n=15; SG, n=17; Asbt **p=8.80x10⁻³, Ostα *p=0.04, Ostβ p=0.89, iBabp p=0.76, Bsep p=0.64, Mrp1 p=0.89, Mrp2 p=0.89, Mrp3 p=0.35, Oatp1 p=0.78, Oatp2 p=0.68, Oatp4 p=0.84, ns=not significant, Welch’s t test).
(C) SEM images of undifferentiated and differentiated Caco-2 cells in transwells. Scale bars indicate (L to R): 400 μm, 20 μm, and 4 μm.
(D) Schematic of BA transport study. Caco-2 cells differentiated in transwells were treated with a defined mixture of indicated BAs at 10 μM each, followed by measurement of BA transport to the basolateral chamber.
(E,F) Transport of indicated BAs from the apical chamber across differentiated Caco-2 cells into the basolateral chamber over 12 hours as measured by UPLC-MS. Area-under-the-curve graphs in (F) correspond to timecourses directly above in (E). siRNA-mediated knockdown of ASBT, OSTα, or ASBT+OSTα reduced transport of LCA and TCA, increased transport of DCA, and did not affect transport of CA, CDCA, βMCA, or TβMCA. Treatment with U0126 (50 μM), a small molecule that increases expression of ASBT, increased transport of LCA but not the other BAs tested. (≥3 biological replicates per condition, *p<0.05, #p<0.01 †p<1.00x10⁻³, data not marked are not significant; CA (ASBT) p=0.99, CA (OSTα) p=0.91, CA (ASBT+OSTα) p=0.97, CA (U0126) p=0.65; CDCA (ASBT) p=0.78, CDCA (OSTα) p=0.73, CDCA (ASBT+OSTα) p=0.73, CDCA (U0126) p=0.38; βMCA (ASBT) p=0.81, βMCA (OSTα) p=0.74, βMCA (ASBT+OSTα) p=0.81, βMCA (U0126) p=0.99; TβMCA (ASBT) p=0.99, TβMCA (OSTα) p=0.66, TβMCA (ASBT+OSTα) p=0.83, TβMCA (U0126) p=0.31; TCA (ASBT) *p=0.01, TCA (OSTα) †p=7.00x10⁻⁴, TCA (ASBT+OSTα) †p=1.70x10⁻⁴, TCA (U0126) †p=1.00x10⁻⁴; DCA (ASBT) †p=6.00x10⁻⁴, DCA (OSTα) *p=0.02, DCA (ASBT+OSTα) *p=0.04, DCA (U0126) p=0.08; LCA (ASBT) *p=0.03, LCA (OSTα) *p=0.02, LCA (ASBT+OSTα) *p=0.01, LCA (U0126) #p=2.80x10⁻³, one-way ANOVA followed by Turkey’s (HSD) post-hoc test).
All data are presented as mean ± SEM.
LCA is preferentially transported by ASBT in intestinal epithelial cells
Substrate specificity of ASBT has been studied for groups of BAs, but not extensively for individual BA molecules (Dawson et al., 2009; Martinez-Augustin and Sanchez de Medina, 2008). Previous research has found that BAs compete for binding ASBT, and that certain amino acid residues of ASBT have different binding affinities to specific BAs (Sun et al., 2006). In particular, ASBT transports dihydroxy BAs such as CDCA and DCA more efficiently than trihydroxy BAs such as TCA and CA (Craddock et al., 1998). However, LCA, a monohydroxy BA, was not studied in this context. Given our observation of increased LCA in the portal vein of SG mice, we hypothesized that an increase in expression of Asbt and Ostα induces active absorption of LCA from the intestine into portal circulation. To test this hypothesis, we measured transport of BAs in differentiated human intestinal Caco-2 cells that had been differentiated into a polarized monolayer with intercellular tight junctions and brush border microvilli (Figure 5C) (Ferruzza et al., 2012). This in vitro intestinal model system has been used to study transcytosis of small molecules through the intestinal epithelium (Tan et al., 2018; Chaudhari et al., 2020).
To test whether LCA is specifically transported through the gut epithelium, a defined mix of predominant gut BAs were added to the apical side of differentiated Caco-2 cells in transwells, and active transport to the basolateral compartment was measured at 12 hours and 24 hours using UPLC-MS (Figure 5D). We added abundant primary BAs found in the intestine of mice and humans (primary BAs: CA, CDCA, βMCA (beta-muricholic acid); secondary BAs: LCA and DCA; conjugated BAs: TCA (tauro-cholic acid) and TβMCA (tauro-beta-muricholic acid), at a concentration of 10 μM each to the apical side of the transwells (Figure 5D) (Martinez-Augustin and Sanchez de Medina, 2008). We found that total transport of LCA was significantly higher than that of DCA at 12 hours and 24 hours (Figure S6A), suggesting that individual BA molecules can have different transport kinetics. Next, we performed a time course analysis of BA transport over 12 hours to investigate if LCA is transported more efficiently at earlier time points. Similar to our previous results, LCA does not appear to be transported more efficiently than other BAs via an epithelial monolayer (Figure 5E,F). However, siRNA-mediated knockdown of ASBT and/or OSTα specifically abolished transport of LCA and TCA across the epithelial monolayer, suggesting that LCA and TCA require expression of ASBT and OSTα for transcytosis (Figure 5E,F, S6B,C). Furthermore, overexpression of ASBT by treatment of differentiated Caco-2 cells with the specific MEK inhibitor U0126 resulted in increased transport of LCA through the monolayer (Figure 5E,F, Figure S6B) (Ghosh et al., 2014). Importantly, no other BA exhibited an increase in transport following ASBT overexpression (Figure 5E,F, S6B,) (Ghosh et al., 2014). These results suggest that increased levels of ASBT and OSTα in the ileum of SG mice results in increased selective transport of LCA into the portal vein.
Lower levels of LCA post-SG result in increased expression of Asbt
To further investigate the unexpected observation that LCA levels were increased in murine portal veins but decreased in mouse cecum and human feces post-SG, we examined the impact of BAs on expression of ASBT, the predominant BA transporter (Craddock et al., 1998). BAs have been shown to modulate ASBT expression in intestinal cells (Xie et al., 2018). Unconjugated BAs, particularly secondary BAs LCA and DCA, inhibit ASBT expression in intestinal cells in vitro (Xie et al., 2018). Because SG mice harbor reduced LCA levels in cecal contents compared to shams (mean values of ~35 μM and ~75 μM, respectively)(Chaudhari et al., 2020), we hypothesized that this reduction in LCA promotes an increase in Asbt expression in SG (Figure 6A). To test this hypothesis, we incubated Caco-2 cells with in vitro pools of BAs that mimicked the average physiological concentrations observed in sham and SG cecal stool. We then tested the ability of these reconstituted BA pools to induce expression of the ASBT in Caco-2 cells. We found that SG cecal BAs significantly induced ASBT expression in vitro compared to the sham BA pools (Figure 6B). Further, incubation of Caco-2 cells with a physiologically relevant concentration of LCA (100 μM) significantly inhibited ASBT expression without affecting cell viability (Figure 6C, S6D. These results together suggest that, paradoxically, a drop in intestinal LCA levels after SG leads to increased Asbt expression and thus increased levels of LCA in the portal vein (Figure 6A).
Figure 6. LCA is sufficient to inhibit Asbt expression and induce production of CA7S.

(A) Schematic of sham and SG intestine BA transport modulated by the production of LCA by Clostridia. Levels of Clostridia and LCA production are higher in sham mice. LCA inhibits Asbt expression, resulting in less transport of LCA into the portal vein. In contrast, levels of Clostridia and LCA are lower in SG mice, allowing for higher expression of Asbt and increased transport of LCA from the gut to the liver in SG animals.
(B) The sham cecal pool of BAs inhibited expression of ASBT compared to the SG cecal pool of BAs (3 biological replicates per condition, Sham vs. SG cecal pool *p=0.02, one-way ANOVA followed by Dunnett’s multiple comparisons test
(C) LCA (100 μM) inhibited expression of ASBT in Caco-2 cells. (3 biological replicates per condition, *p=0.02, Welch’s t test).
(D) Schematic of GF mice administered 0.3% LCA (w/w) in chow for 1 week prior to harvesting tissues for analyses.
(E) LCA feeding led to accumulation of LCA in the proximal small intestine (SI), distal ileum (DI) and cecum of GF mice. (n=5 in each group, SI *p=0.04; DI *p=0.04; cecum **p=1.70x10⁻³, Welch’s t test).
(F) LCA inhibited expression of Asbt in SI and DI (n=5 in each group, SI p=0.11; DI *p=0.02, Welch’s t test).
(G) Introduction of LCA in GF mice induced CA7S production and accumulation in the gallbladder (GB) and the distal ileum (DI) (GB, GF n=3, GF+LCA n=4, **p=6.50x10⁻³; DI, n=5 in each group, *p=0.03, Welch’s t test).
(H) LCA feeding led to increased expression of mSult2A1 and Vdr in livers of mice fed 0.3% LCA in chow (n=5 in each group, mSult2A1 *p=0.04, Vdr p=0.09, Welch’s t test).
All data are presented as mean ± SEM.
Previous studies have shown that gut microbiota inhibit expression of Asbt (Out et al., 2015). Antibiotic-mediated depletion of gut bacteria results in increased expression of Asbt (Out et al., 2015). The antibiotic cocktail administered to our sham and SG mice did not affect cell viability or ASBT expression levels in vitro (Figure S6E). We found that GF mice have higher expression levels of intestinal Asbt compared to conventional DIO mice (Figure S6F). Based on our observation that the microbial metabolite LCA inhibits ASBT expression in vitro, we hypothesized that LCA administration is also sufficient to inhibit Asbt expression in vivo. To test this hypothesis, we administered 0.3% LCA in chow to GF mice for 7 days (Figure 6D). This treatment led to accumulation of LCA throughout the GI tract (Figure 6E). LCA feeding resulted in significant inhibition of Asbt expression in the lower GI tract (Figure 6F), demonstrating that LCA inhibits expression of Asbt in vivo.
Remarkably, although Asbt expression is inhibited in the lower GI tract, we found that introduction of LCA in the gut is sufficient to trigger the LCA-VDR-SULT pathway and induces production of CA7S (Figure 6G,H). This effect is likely due to the high concentration of LCA introduced (mean value of ~1100 μM in cecal contents, Figure 6E) and existing levels of ASBT present in the intestine that enables some transport of LCA to the liver despite suppression of Asbt gene expression. Notably, we observed accumulation of CA7S in the gallbladder and GI tract of GF mice fed with LCA (Figure 6G). LCA-fed mice displayed significantly higher levels of hepatic mSult2A1 expression (Figure 6H). The expression of Vdr was also increased compared to control mice although the difference was not statistically significant (Figure 6H). Thus, although LCA decreased Asbt expression in these animals, LCA feeding was able to induce CA7S biosynthesis by the liver. Together, these results indicate that LCA is sufficient to induce CA7S production in GF mice.
SG microbiota transplant recreates the CA7S pathway in GF animals
To test whether the SG microbiota can trigger an increase in portal LCA transport and the LCA-VDR-SULT pathway in vivo, we performed a cecal microbiota transplant (CMT) from sham and SG mice into GF animals. Cecal stool from sham and SG mice 6-weeks post-op were anaerobically homogenized and gavaged into GF mice fed a high-fat diet (Figure 7A). Two weeks after conventionalization, the sham-CMT and SG-CMT animals were euthanized. To examine whether the LCA production capability of the microbiota of recipient animals mirrored that of the donors, we measured microbial baiCD expression in the cecal stools of both cohorts. Similar to our previous observation, SG donors displayed significantly lower expression levels of baiCD compared to sham animals. This effect was also transferred to the respective CMT recipients (Figure 7B,C). SG-CMT animals exhibited lower levels of cecal LCA compared to sham-CMT, with no change in DCA or total BA levels, similar to our previous observations in sham and SG mice (Figure 7D) (Chaudhari et al., 2020). Together, these results suggest that we successfully conventionalized GF mice with the cecal microbiota of sham and SG mice.
Figure 7. SG microbiota transfer recreates the CA7S pathway in GF mice.

(A) Schematic of cecal microbial transplant (CMT). GF mice were fed a high-fat diet (HFD) for 5 days prior to CMT. Six weeks post-op sham and SG cecal stool were anaerobically homogenized and gavaged into GF animals. Two weeks post-gavage, mice were sacrificed, and their tissues were harvested for analyses.
(B,C) qRT-PCR quantification of baiCD gene cluster expression levels in donor sham and SG mouse cecal contents (B) and recipient sham-CMT and SG-CMT mouse cecal contents (C) normalized to bacterial 16S ribosomal DNA (Sham, n=4, SG, n=4, **p=7.00x10⁻³; Sham-CMT, n=10, SG-CMT, n=10, *p=0.01, Welch’s t test).
(D) LCA levels were reduced in cecal contents of SG-CMT compared to sham-CMT mice. DCA and total bile acid levels did not differ between the two groups (n=10 in each group; LCA, lithocholic acid *p=0.04; DCA, deoxycholic acid p=0.95; Total bile acids p=0.95, ns=not significant, Welch’s t test).
(E) qRT-PCR quantification of BA transport protein expression levels in sham-CMT and SG-CMT mouse distal ileum (DI) normalized to mouse ribosomal 18S. The expression of Asbt (apical sodium-dependent bile acid transporter) and Ostα (organic solute transporter α) were significantly increased in SG-CMT (n=10 in each group, Asbt *p=0.02; Ostα *p=0.02, Welch’s t test).
(F) Portal vein LCA in sham-CMT and SG-CMT mice. LCA was the only bile acid whose levels were significantly increased post-SG (n=10 in each group, LCA *p=0.03, Welch’s t test)
(G) qRT-PCR quantification of mSult2A1 and Vdr expression levels in sham-CMT and SG-CMT mouse livers normalized to mouse ribosomal 18S. mSult2A1 and Vdr expression was significantly increased in SG-CMT (n=10 in each group, mSult2A1 *p=0.02; Vdr *p=0.02, Welch’s t test)
(H) CA7S levels were increased in cecal contents of SG-CMT compared to sham-CMT mice. (n=10 in each group; CA7S, cholic acid-7-sulfate *p=0.04, Welch’s t test).
(I) SG-CMT (cecal microbial transplant) mice have higher levels of GLP-1 compared to Sham-CMT (n=10 in each group, p=0.25, not significant, Welch’s t test).
(J) qRT-PCR quantification of Tgr5 expression levels in sham-CMT and SG-CMT mouse distal ileum (DI) normalized to 18S. Tgr5 expression was significantly increased in SG-CMT (n=10 in each group, Tgr5 *p=0.03, Welch’s t test).
All data are presented as mean ± SEM.
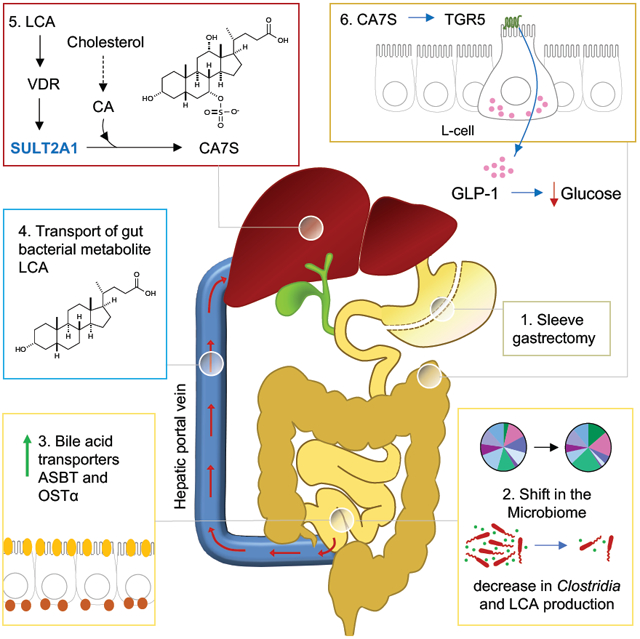
(K) Model for LCA-mediated induction of CA7S synthesis and downstream GLP-1 secretion post-SG. Sleeve gastrectomy (1) results in a shift in the microbiome, specifically a decrease in Clostridia and LCA production, thus inducing an increase of the BA transporters ASBT and OSTα in the intestine (2), which in turn selectively transport LCA into the portal vein (3); LCA is delivered to the liver, where this molecule agonizes VDR, thereby increasing the expression of hSULT2A/mSult2A1 and CA7S synthesis (4). CA7S is then stored in the gallbladder and secreted into the gut. In the colon, CA7S agonizes and increases expression of TGR5 in intestinal L cells, resulting in secretion of GLP-1 (5), an incretin hormone that exerts global glucoregulatory effects.
Next, we investigated whether CMT from SG mice recreated the LCA-VDR-SULT-CA7S pathway in vivo. Consistent with our in vitro results showing that LCA inhibits expression of Asbt and Ostα, SG-CMT mice exhibited significantly higher levels of Asbt and Ostα expression in the distal ileum compared to sham-CMT (Figure 7E). Further, we observed increased portal transport of LCA in SG-CMT mice compared to sham-CMT while both cohorts displayed comparable levels of other portal BAs (Figure 7F, S7). These data indicate that the SG microbiome induces increased LCA transport from the gut to the liver via the portal vein. Consistent with this observation and our previous in vitro and in vivo results, SG-CMT mice exhibited significantly higher levels of hepatic Vdr and mSult2A1 expression compared to sham-CMT (Figure 7G). We also observed a significant increase in CA7S levels in cecal contents of SG-CMT animals, demonstrating that SG microbiota is sufficient to trigger increased CA7S production compared to sham animals (Figure 7H). Our previous study demonstrated that accumulation of CA7S induces an increase in expression of Tgr5 in the lower GI tract and an increase in levels of circulating GLP-1 (Chaudhari et al., 2020). GLP-1 levels were ~50% higher in SG-CMT animals compared to sham-CMT, although the difference was not statistically significant (SG-CMT, mean=24 pg/ml; sham-CMT, mean=16.2 pg/ml, p=0.25, Figure 7I). While we had observed a significant increase in GLP-1 levels 6 weeks post-SG (Figure 1F) (Chaudhari et al., 2020), GLP-1 levels in CMT mice were measured 14 days post-cecal transplant. It is possible that more than 2 weeks is required for the microbiome to induce GLP-1 secretion via the CA7S pathway in ex-GF mice. Importantly, consistent with our previous study (Chaudhari et al., 2020), we observed a significant increase in Tgr5 expression in the distal ileum of SG-CMT animals compared to sham-CMT mice, indicating that the post-SG microbiome increased Tgr5 expression in the timeframe of this experiment (Figure 7J). Taken together, these data demonstrate that the microbiome is sufficient to trigger the LCA-VDR-SULT-CA7S pathway and subsequent Tgr5 induction (Figure 7K). More broadly, this study shows that a small molecule produced by the gut microbiota regulates a host metabolic pathway that likely contributes to amelioration of diabetes post-SG.
Discussion
Obesity and obesity-related type 2 diabetes are systemic metabolic diseases that affect multiple organs and whole-body homeostasis. Recent studies have found that obesity-related diseases have distinct metabolomic fingerprints, particularly associated with a shift in the microbiome and microbiome-derived metabolites (Gralka et al., 2015; Samczuk et al., 2018). Weight-loss surgeries have been shown to modify this obesity-related metabolomic fingerprint in a way that mimics the metabolome and microbiome associated with a healthy gut (Gralka et al., 2015; Medina et al., 2017; Samczuk et al., 2018; Tremaroli et al., 2015). Studying how weight-loss surgeries such as SG can molecularly and metabolically reprogram the body will facilitate the discovery of novel therapeutics that can mimic the effects of these surgical interventions.
In this study, we find that gut bacteria communicate with the host through the transport of a bacterially derived molecule from the gut to the liver via the portal vein. Gut metabolites transported via the portal vein constitute a significant portion of the molecular milieu to which the liver is exposed. In previous work, we identified CA7S, a gut-restricted TGR5 agonist that can improve hyperglycemia in vivo (Chaudhari et al., 2020). In this work, we have identified a microbiome-mediated mechanism that drives synthesis of CA7S in the liver by direct transport of microbially derived LCA into the portal vein via the BA transporters ASBT and OSTα. A recent study found that colonization of GF mice with human fecal microbiome led to a 4-fold increase in host-produced CA7S (Wahlstrom et al., 2017). Moreover, inhibition of BA transport in the portal vein has been shown to impair glucose tolerance, insulin sensitivity, and GLP-1 secretion (Shang et al., 2010). Therefore, the pathway described here suggests that exchange of microbial metabolites in the enterohepatic axis could be one of the contributing factors that mediates anti-diabetic benefits of bariatric surgery in animals with a functional microbiome (Jahansouz et al., 2018).
SULT2A(1) is a highly conserved hepatic sulfo-conjugating enzyme. Genome-wide association studies have identified that mutations in the SULT2A gene locus are linked to diabetes (Elam et al., 2009; Yalcin et al., 2013; Ye et al., 2010). The involvement of VDR in mediating LCA-induced synthesis of CA7S is also consistent with recent studies demonstrating the importance of VDR in obesity, type 2 diabetes, and bariatric surgery. Vitamin D deficiency and polymorphisms in the VDR gene have been linked to development of obesity and diabetes, while activation of VDR via administration of vitamin D has been shown to improve glucose homeostasis and result in weight-loss (Lespessailles and Toumi, 2017; Manchanda and Bid, 2012; Sisley et al., 2016). Vitamin D levels positively correlate with diabetes remission post-bariatric surgery (Lespessailles and Toumi, 2017). Our data suggest that VDR may be causally involved in the metabolic benefits of SG, and in particular, that activation of VDR signaling by LCA in the liver post-SG may contribute to the glucoregulatory effects of this surgery.
Our study suggests that an increase in Asbt expression could selectively increase transport of LCA in the portal vein. However, transcytosis in the gut epithelium is only one step in the overall enterohepatic circulation of BAs in the body. After absorption, BAs bind serum albumin in portal blood and are extracted from the blood by hepatocytes via BA transport proteins in the liver (Dawson et al., 2009). Among BAs, LCA has the greatest affinity for serum albumin which binds BAs for transport to the liver in the enterohepatic recirculation (Roda et al., 1982). The difference in extraction efficiencies of individual BAs from the portal blood into hepatocytes requires further investigation.
Our data indicate that the shift in the microbiome post-SG, specifically a decrease in Clostridia, results in a decrease in production of LCA that amplifies flux through a cross-organ pathway, ultimately resulting in increased production of the glucoregulatory compound CA7S. Remarkably, we observed that a CMT from SG mice recreated the LCA-VDR-SULT2A1-CA7S pathway in GF recipient mice. Specifically, SG-CMT resulted in an increase in LCA in the portal vein, an increase in expression of Vdr and mSult2A1 in the murine liver, and an increase in CA7S levels in the gallbladder. Moreover, the LCA-VDR-SULT2A-CA7S-GLP-1 pathway was operable in human intestinal and liver cells in vitro. Considering that similar to SG mice, human stool post-SG also displayed reduced Clostridia levels, decreased LCA levels, and increased CA7S levels, it is plausible that the LCA-VDR-SULT2A-CA7S-GLP-1 contributes to glucoregulatory benefits of SG in human patients. Future studies in SG patients may help establish that the pathway described herein is operable in humans, perhaps paving the way for future therapies to treat type 2 diabetes.
Finally, other bacterially produced or modified molecules that affect host metabolism and signaling are also directly transported via the portal vein to the liver, including short-chain fatty acids, vitamins, and carbohydrates (Wu et al., 2019). Recent work has demonstrated the role of the small intestinal microbiome in influencing production and absorption of these molecules (Kastl et al., 2020; Martinez-Guryn et al., 2018). Future investigations of small intestinal host-microbe interactions in the context of CA7S production specifically and SG more generally may provide further insights into the mechanistic basis for improved metabolic phenotypes following bariatric surgery. This study supplies evidence for one mechanism linking a functional microbiome and a microbial metabolite to host metabolism, illustrating the importance of studying metabolite transport and signaling in the enterohepatic axis.
STAR METHODS
RESOURCE AVAILABILITY
Lead Contact.
Further information and requests for resources and reagents should be directed to and will be fulfilled by the Lead Contact, A. Sloan Devlin (sloan_devlin@hms.harvard.edu).
Materials Availability.
All unique/stable reagents generated in this study are available from the Lead Contact with a completed Materials Transfer Agreement.
Data and Code Availability.
The 16S rDNA datasets analyzed in the manuscript are available through the NCBI under accession number PRJNA635168. All other data generated or analyzed during this study are included in this article and its Supplemental Information files. No custom code or mathematical algorithms were used in this study.
EXPERIMENTAL MODEL AND SUBJECT DETAILS
Mice.
Animals were age-, weight-, and sex-matched for all analyses. Diet induced obese (DIO), male, C57Bl/6J mice were purchased from Jackson Laboratory (Bar Harbor, ME) at 11 weeks of age for Sham and SG surgeries, and at 14 – 16 weeks of age for all other non-surgical experiments. All mice were purchased from the above vendor (Jackson Laboratory, Bar Harbor, ME) unless otherwise noted. Animals were housed under standard conditions in a climate-controlled environment with 12-hour light and dark cycles and reared on a high-fat diet (HFD, 60% Kcal fat; RD12492; Research Diets Inc., NJ). Animals were allowed to acclimate for at least 1 week prior to undergoing any procedures. Male and female Vdr-KO mice were bred by, and housed at, Massachusetts General Hospital in the Demay lab; control C57BL/6 WT mice were purchased from Jackson Laboratory. Cecal microbiota transplant (CMT) experiments were performed using male GF C57BL/6 mice, bred internally by, and maintained in gnotobiotic isolators at the Massachusetts Host-Microbiome Center. Animal surgeries, portal vein injection experiments, CMT experiments, and other DIO mouse studies were approved by the Institutional Animal Care and Use Committee (IACUC) of Brigham and Women’s Hospital. Vdr-KO studies were approved by the IACUC of Massachusetts General Hospital. GF mouse experiments for LCA feeding were approved by the IACUC at Harvard Medical School.
Bacterial culture.
Fresh sham and SG mouse cecal stools were collected in Eppendorf tubes and weighed before transfer to an anaerobic chamber (Coy Lab Products Airlock) with a gas mix of 5% hydrogen and 20% carbon dioxide (balance nitrogen). Approximately 100 mg of cecal stool was resuspended anaerobically in 10 mL of Cullen–Haiser Gut (CHG) media, which consists of brain heart infusion media (Bacto BHI, BD) supplemented with 1% BBL vitamin K1-hemin solution (BD), 1% trace minerals solution (ATCC), 1% trace vitamins solution (ATCC), 5% fetal bovine serum (FBS) (Hyclone), 1 g l−1 cellubiose, 1 g l−1 maltose and 1 g l−1 fructose (Hall et al., 2017).
Cell culture.
HepG2, NCI-H716, Hepa 1-6, and Caco-2 cells were obtained from American Type Culture Collection (Manassas, VA). Caco-2, HepG2, and Hepa 1-6 cells were maintained in Minimum Essential Medium (MEM) with GlutaMAX and Earle’s Salts (Gibco, Life Technologies, UK). NCI-H716 cells were maintained in RPMI 1640 with L-glutamine (GenClone, San Diego, CA). All cell culture media were supplemented with 10% fetal bovine serum (FBS), 100 units/mL penicillin, and 100 μg/mL streptomycin (GenClone). Cells were grown in FBS- and antibiotic-supplemented ‘complete’ media at 37 °C in an atmosphere of 5% CO2.
Human samples.
Institutional review board approval was obtained to prospectively collect human stool samples from patients prior to and after (mode 15 days; median 36 days; range 14 to 99 days) undergoing SG. Informed consent was obtained from each patient. For study enrollment, patients had to qualify for bariatric surgery. Exclusion criteria were as follows: 1) antibiotic use within 3 months of surgery, 2) use of immunosuppression, 3) pre-existing immunocompromised state, 4) chronic diarrhea, 5) ulcerative colitis or Crohn’s disease, 6) prior colon resection. Specimen were snap frozen in liquid nitrogen and stored at −80 °C until BA analysis was performed in a blinded fashion.
METHOD DETAILS
DIO GF animals.
Germ free mouse tissues were obtained from a previous study (Yao et al., 2018) (control group for the CLAMS experiment). Briefly, age- and weight-matched male GF C57BL/6 mice were maintained in gnotobiotic isolators at the Massachusetts Host-Microbiome Center for three weeks and then transferred to pre-sterilized CLAMS cages at Brigham and Women’s Hospital Metabolic Core facility for one week. Mice were fed a high-fat diet (D12492, Research Diets Inc., NJ) for the entire 4 week experiment.
In vivo antibiotic treatment.
11 week-old C57Bl/6J mice were reared on a high-fat diet (RD12492). After 1 week of acclimation, these DIO mice were weight matched into two groups – Sham or SG. Two days prior to surgery, mice were administered an antibiotic cocktail in drinking water – neomycin trisulfate (1g/L, Sigma Aldrich N5285, St. Louis, MO), metronidazole (0.25 g/L, Acros Organics, 210340050, NJ), vancomycin hydrochloride (0.5g/L, Acros Organics 210340050, NJ), and ampicillin (1 g/L, Sigma Aldrich A0166, St. Louis, MO). Water containing antibiotics was mixed with sterile water, brought to a pH of 7.4, and provided to mice ad libitum in light-protected bottles. This treatment was continued in the post-operative setting. The antibiotic-containing water was changed three times weekly. Stool pellets were collected prior to antibiotic initiation and at regular intervals post initiation and throughout the duration of the experiment.
Vdr-KO mouse feces.
The Vdr-KO line was generated in the Demay lab and bred in house at MGH for several years to ensure reproducibility of results when compared to similarly bred WT mice. To normalize the blood mineral ion levels in Vdr-KO−/− mice, these animals were fed a γ-irradiated rescue chow (TD96348, Teklad, Madison, WI) containing 2% calcium, 1.25% phosphorus, and 20% lactose with 2.2 IU vitamin D/g (Li et al., 1998). Feces were collected from mice that were ~8 weeks of age, snap-frozen in liquid nitrogen, and stored at −80 °C until further analysis.
Sleeve gastrectomy (SG) and sham procedures.
11-week-old DIO mice were weight-matched and randomized to receive either SG or sham operation. SG was performed through a 1.5 cm midline laparotomy under isoflurane anesthesia. The stomach was gently dissected free from its surrounding attachments, the vessels between the spleen and stomach (short gastric arteries) were divided, and a tubular stomach was created by removing 80% of the glandular and 100% of the non-glandular stomach with a linear-cutting surgical stapler. Sham operation consisted of a similar laparotomy, stomach dissection, vessel ligation, and manipulation of the stomach along the staple line equivalent. Mice were individually housed thereafter to allow for monitoring of food intake, weight, and behavior. SG and sham mice were maintained on Recovery Gel Diet (Clear H2O, Westbrook, ME) from 1 day prior through 6 days after surgery and then were restarted on HFD on the morning of post-operative day (POD) 7. The mice were maintained on HFD until sacrifice. Mice were sacrificed 5-7 weeks post-surgery. Sham and SG surgeries were performed in 4 cohorts of animals with n=4, 4, 4, and 9 per group in each cohort.
Portal injection.
DIO mice were purchased at 14-week age and housed as described in “Mice” above for 6 weeks. Animals were fasted for 4 hours on the day of the experiment. Six mice were matched into two groups based on fasting glucose levels. Under general anesthesia with isoflurane 1-2% and laparotomy, the portal vein was exposed. With a 30.5 G needle, 200 μL of 50 μM LCA solution or equivalent volume of PBS (which was corrected with DMSO to serve as the proper control) was injected into the anterior surface of the portal vein. Post-injection bleeding was controlled by local pressure for several seconds. The animals were kept under anesthesia. 120 minutes following injection, whole blood and tissues were harvested.
LCA feeding in chow to GF animals.
Age-matched 5- week-old male GF C57BL/6NCrl mice were purchased from Charles River Laboratory and maintained in flexible film isolators at Harvard Medical School. Mice were fed an autoclaved powdered meal with or without 0.3% LCA (w/w) in Isocages system (Tecniplast). Teklad Global 19% sterilizable rodent meal was evenly mixed with measured LCA, autoclaved for 60 minutes and provided in glass feeder jars and replenished when necessary. LCA feeding was performed for seven days after which mice were sacrificed and tissues were harvested by snap-freezing in liquid N2 for analysis. Two control mouse gallbladders and one from the LCA-fed mouse ruptured during harvest and were therefore excluded from analyses.
Cecal microbial transplant (CMT).
Six-week post-op sham and SG mice were sacrificed, and their ceca were tied on both ends prior to harvest to maintain microbiome integrity and an anaerobic environment. Ceca were transferred to an anaerobic chamber, untied, and suspended in 5 mL of PBS with 0.05% cysteine (C-6852, Sigma-Aldrich). Pooled sham or SG ceca (cecal stool and cecal tissue) were homogenized in a sterile glass homogenizer in an anaerobic chamber. The cecal slurry containing cecal bacteria was centrifuged at 700 g for 1 minute. Supernatant was collected for inoculation. CMT was performed as follows: age-matched male GF C57BL/6 mice were maintained in gnotobiotic isolators at the Massachusetts Host-Microbiome Center under a strict 12 hr light cycle and a constant temperature (21 ± 1°C) and humidity (55–65%). All experiments were conducted on 6-8-week-old male mice. Five days prior to inoculation, GF mice were started on a doubly-irradiated high-fat diet (D12492ii, 60% kcal fat, Research Diets Inc, NJ). Mice were inoculated, via oral gavage, with 200 μL of SG- or sham-derived inoculum. Conventionalized mice were maintained on doubly-irradiated HFD for 14 days. On day 14 post-CMT, mice were fasted for 4h prior to sacrifice. Tissues were harvested and snap-frozen in liquid N2 prior to analysis.
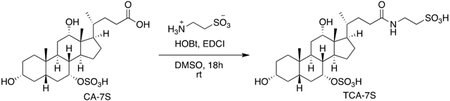
TCA7S synthesis.
Cholic acid-7-sulfate (15.0 mg, 0.03 mmol) was dissolved in 4 mL DMSO. Hydroxybenzotriazole (6.2 mg, 0.04 mmol) and EDCI (7.1 mg, 0.04 mmol) were then added and the mixture was stirred at 23 °C for 30 mins. Taurine (5.7 mg, 0.04 mmol) was added to the above solution and the resulting reaction mixture was stirred at 23 °C for 18 h. The mixture was then concentrated on a rotary evaporator. The crude mixture was purified using a C18 column on a Teledyne ISCO CombiFlash Rf system. The semi-pure fractions were further purified by silica gel chromatography (gradient of 5% to 100% methanol / dichloromethane) to provide the pure compound (1.8 mg, 10%) as a white solid.
TCA-7S.
TLC (Methanol): Rf = 0.1; 1H NMR (500 MHz, CDCl3): δ 4.47 (s, 1H), 4.35 (d, J = 3.5 Hz, 1H), 3.83 (s, 1H), 3.49 (t, J = 7.5 Hz, 2H), 2.89 (t, J = 7.0 Hz, 2H), 2.19-2.13 (m, 4H), 2.05-1.94 (m, 4H), 1.77-1.67 (m, 6H), 1.58-1.49 (m, 5H), 1.34-1.31 (m, 4H), 1.21-1.18 (m, 4H), 0.93-0.92 (m, 5H), 0.83 (s, 3H), 0.61 (s, 3H); HRMS (m/z): [(M – 1) – H]− calcd. for C26H45NO10S2, 594.212; found, 594.241. (See Figure S2 for 1H NMR Spectrum.)
In vitro testing of CA7S metabolism by cecal gut bacteria.
Mouse cecal stools resuspended in anaerobic media (see “Bacterial Culture” above) were vortexed to produce a homogenous slurry. Cecal stool in media were then transferred to culture tubes inside the anaerobic chamber and bile acid substrates were added at indicated concentrations. Cecal bacteria were grown in the anaerobic chamber at 37 °C for 7 days. On day 7, the entire bacterial culture was acidified to pH = 1 using 6 M HCl in MeOH. Cultures were then vortexed and centrifuged at 4 °C for 30 min at 15,000 rpm. The supernatant was diluted 1:1 in 50% MeOH/water and centrifuged again at 4 °C for 30 min at 15000 rpm. The supernatant was transferred into mass spectrometry vials and injected onto the UPLC-MS.
Bile acid analysis.
Bile acid analyses were performed using a previously reported method (Yao et al., 2018).
Reagents.
Stock solutions of all bile acids were prepared by dissolving compounds in molecular biology grade DMSO (VWR International, Radnor, PA). These solutions were used to establish standard curves. CA7S was purchased from Cayman Chemicals (Ann Arbor, MI. Cat. No. 9002532) and WuXi PharmaTech (Cayman) Inc (China). Glycholic acid (GCA) (Sigma) was used as the internal standard for measurements in mouse tissues. HPLC grade solvents were used for preparing and running UPLC-MS samples.
Extraction.
Mouse cecal, fecal, liver, and human fecal samples (approximately 50 mg each) were collected in pre-weighed lysis tubes. To collect intact mouse gallbladders, upon entry into the abdomen, the liver was reflected cephalad to expose the gallbladder. The gallbladder was then slowly and carefully dissected off of the liver bed. The cystic duct was then ligated, and the gallbladder was removed and immediately weighed. To collect intact portal veins, the viscera were reflected to the left to expose the portal vein. Mesenteric fat enveloping the portal vein was carefully dissected off. The portal vein was then ligated both proximally and distally and weighed immediately. Gallbladders and portal veins were then transferred to lysis tubes for bile acid extraction. The lysis tubes contained ceramic beads to allow for homogenization (Precellys lysing kit tough micro-organism lysing VK05 tubes for cecal, fecal samples, gallbladder, and portal veins; tissue homogenizing CKMix tubes for liver samples; Bertin technologies, Montigny-le-Bretonneux, France). 400 μL of MeOH (MeOH) containing 10 μM internal standard was added to cecal, liver, and human feces, 100 μL of MeOH containing 10 μM internal standard was added to intact gallbladder and portal vein tissues and the tubes were homogenized in a MagNA Lyser (6000 speed for 90 s*2, 7000 speed for 60 s). Cell culture media was diluted 1:1 in MeOH. All MeOH-extracted samples were centrifuged at 4 °C for 30 min at 15,000 rpm. The supernatant was diluted 1:1 in 50% MeOH/water and centrifuged again at 4 °C for 30 min at 15000 rpm. The supernatant was transferred into mass spec vials and injected into the UPLC-MS or QTOF-MS.
QTOF-MS analysis.
TCA7S could not be detected using the Agilent 6130; a UPLC equipped with an Agilent 6530 Q-TOF was used to detect TCA7S. Samples were injected onto a Phenomenex Kinetex 2.1 μm, C18 100 Å, 100 × 2.1 mm column and eluted using a linear gradient of 10% B to 100% B over 13 minutes at a flowrate of 300μL/min (A = H2O + 0.1% formic acid, and B = acetonitrile + 0.1% formic acid). MS parameters are as follows: negative ESI, Capillary voltage – 3500 V, Fragmentor – 120V, Skimmer – 65 V, Oct1 RF Vpp – 750. Drying gas = 325°C, 10 L/min, 40 psi.
Total bile acids were then calculated by adding all detected and measured bile acids. The limits of detection for individual bile acids were determined using commercially available standards solubilized in 1:1 MeOH/water and are as follows: CA7S, 0.05 picomol/μL; α/βMCA, 0.03 picomol/μL; Tα/βMCA, 0.01 picomol/μL; TωMCA, 0.01 picomol/μL; CA, 0.04 picomol/μL; TCA, 0.01 picomol/μL; UDCA, 0.04 picomol/μL; TUDCA, 0.01; CDCA, 0.04 picmol/μL; TCDCA, 0.01 picomol/μL; TDCA, 0.01 picomol/μL; LCA, 0.03 picomol/μL; isoLCA, 0.07 picomol/μL; 3-oxo-LCA, 0.05 picomol/μL; DCA, 0.04 picomol/μL; 3-oxo-CA, 0.04 picomol/μL; 3-oxo-CDCA, 0.4 picomol/μL; 7-oxo-CDCA, 0.03 picomol/μL; 7-oxo-TCDCA, 0.03 picomol/μL. All standards were purchased from Sigma, Steraloids, or Cayman Chemicals. TCA7S was synthesized in-house as described. Note that CA7S and cholic acid-3-sulfate can be distinguished based on retention time using the QTOF-MS method described herein. TCA7S and TCA3S can be distinguished based on retention time using the QTOF-MS method described herein.
16S rRNA sequencing.
16s rRNA sequencing was performed using a previously published method (Adhikari et al., 2020). Briefly, sham and SG mouse cecal, and pre- and post-human fecal microbiota DNA was isolated by using ZymoBIOMICS 96 DNA Kit (ZymoBIOMICS) according to the manufacturer’s instructions. The variable region 4 of the 16S rRNA genes was amplified using primers: Forward 5′- TATGGTAATTGTGTGCCAGCMGCCGCGGTAA-3′ Reverse 5′- AGTCAGTCAGCCGGACTACHVGGGTWTCTAAT-3′. Quality of the amplified DNA products was checked and roughly 120 ng of each DNA product was pooled together to generate an aggregated library for Illumina MiSeq sequencing. Demultiplexed FASTQ files were generated by the Illumina MiSeq software using default parameters and quality control was done by the pipeline at the Massachusetts Host-Microbiome Center. The resulting FASTQ sequences were then quality-filtered and analyzed by following QIIME_mothur_DADA2 (Callahan et al., 2016; Caporaso et al., 2010; Schloss et al., 2009; Weber et al., 2018). OTUs were picked with 97% sequence similarity. The phylogenetic affiliation of each OTUs were aligned to the Greengenes reference database and 99% ID. Data was analyzed using the online Nephele software by NIH (https://nephele.niaid.nih.gov/) (Weber et al., 2018).
In vitro antibiotic treatment.
Based on the assumption that a mouse weighs approximately 30 g drinks 8 mL water/day (Bachmanov et al., 2002), we calculated that the antibiotic-treated sham and SG mice drank 6 mL water/day on average. Next, based on the bioavailability of the antibiotics used (ampicillin, 1 g/L bioavailability = 50 %; vancomycin, 0.5 g/L bioavailability = 0.5 %; metronidazole, 0.25 g/L bioavailability = 90 %; and neomycin, 1 g/L bioavailability = 3 %) (Fukushima et al., 2015; Lamp et al., 1999), we calculated the amount of daily antibiotic exposure to which mouse tissues would be exposed:
Cells were incubated in media containing 3 mg ampicillin, 0.015 mg vancomycin, 1.35 mg metronidazole, and 0.18 mg neomycin (along with the standard 100 units/mL penicillin, and 100 μg/mL streptomycin) for 16 hours prior to cell viability assay or RNA extraction for qPCR.
Cell viability assay.
Cells were treated with BAs or antibiotics in complete media. For BA treatments, DMSO concentration was kept constant and used as a negative control. Cells were incubated with compounds overnight at 37 °C in a 5 % CO2 atmosphere. Cell viability was measured using Cell Titer-Glo Luminescent Cell Viability Assay (G7570, Promega, WI) according to manufacturer’s instructions. Luminescence was measured using a Flex Station III plate reader (Molecular Devices, San Jose, CA) at the ICCB-Longwood Screening Facility at HMS. Luminescence reading was normalized to the control and plotted as relative cell viability.
Caco-2 cell differentiation.
Undifferentiated Caco-2 cells were seeded in 24-well plate transwells (0.4 μM pore size, Costar) at 200,000 cells per transwell. For apical vs basolateral bile acid treatments, 200,000 Caco-2 cells were mixed with 50,000 NCI-H716 cells in 6-well plate transwells (0.4 μM pore size, Costar) to mimic the ratio of epithelial cells to enteroendocrine cells in the human colon (Cristina et al., 1978). Media was changed on days 4, 8, 12, 16, and 18 to differentiate Caco-2 cells in vitro (Lea, 2015). On day 21, fully differentiated and polarized cells were validated for epithelial integrity by FITC-dextran permeability assay prior to treatment with bile acids. Briefly, differentiated Caco-2 epithelial integrity was assayed by measuring passive diffusion of 4 kDa FITC-Dextran (Sigma Aldrich) added at a concentration of 5 μM to the apical chamber in 100 μL PBS, while the basolateral chamber contained 500 μL PBS. Diffusion from the apical to basolateral side was measured by fluorescence reading in PBS on the basolateral side of the transwell system using a SpectraMax M5 plate reader (Molecular Devices, San Jose, CA) at the ICCB-Longwood Screening Facility at HMS. Fluorescence reading was normalized to the control. Only transwells with a low fluorescence reading were used in transcytosis experiments.
Electron microscopy.
Caco-2 cells seeded on transwells were washed in PBS prior to fixation in FGP (Formaldehyde-Glutaraldehyde-Picric acid) fixative. Samples were fixed overnight in a mixture of 1.25% formaldehyde, 2.5 % glutaraldehyde, and 0.03% picric acid in 0.1 M sodium cacodylate buffer, pH 7.4. FGP fixative was diluted in PBS 1:1 before applying to the apical and basolateral chamber of transwells. Fixed samples were stored at 4 °C until further processing and imaging by the Electron Microscopy Core at Harvard Medical School. The fixed tissues were washed with 0.1 M sodium cacodylate buffer and post fixed with 1% osmium tetroxide in 0.1 M sodium cacodylate buffer for 2 hours. Tissues were then rinsed in ddH20 and dehydrated through a series of ethanol (30%, 50%, 70%, 95%, (2x)100%) for 15 minutes per solution. Dehydrated tissues were dried using HMDS. They were placed in a 1:1 solution of HMDS:100% EtOH for 1 hour. They were then twice submerged in 100% MHDS for 30 minutes. Samples were then left to air dry overnight. They were mounted on aluminum stages with carbon dots and coated with platinum (5 nm). The dried tissues were observed in a Hitachi S-4700 Field Emission Scanning Electron Microscope (FE-SEM) at an accelerating voltage of 5kV.
In vitro bile acid treatments.
NCI-H716 cells were seeded in cell culture plates or transwells coated with Matrigel (Corning, NY. Cat. No. 356234) diluted in Hank’s Balanced Salt Solution (HBSS, Gibco) according to manufacturer’s instructions. The cells were allowed to grow for 2 days in complete RPMI media. On the day of the treatment, cells were rinsed gently with low serum (0.5% FBS) RPMI 1640 medium without antibiotics. Bile acids were diluted in dimethyl sulfoxide (DMSO, VWR International) and added to cells in the low serum media (0.5% FBS, RPMI 1640) without antibiotics. The concentration of DMSO was kept constant throughout the treatments and used as a negative control. Cells were incubated at 37 °C in an atmosphere of 5% CO2 for 2 hours. After the incubation period, cell culture media was collected in Eppendorf tubes containing 1% trifluoroacetic acid (TFA, Sigma) in sterile purified water (GenClone) to make a final TFA concentration of 0.1% and frozen at −80 °C for further GLP-1 measurements. Cells on cell culture plates were placed on ice and gently washed with PBS (GenClone). Cells used for GLP-1 measurements were treated with ice-cold cell lysis solution of 1% TFA, 1N hydrochloric acid, 5% formic acid, and 1% NaCl (all from Sigma), scraped off of the Matrigel coating, and collected in lysing tubes with ceramic beads (Precellys lysing kit tough micro-organism lysing VK05 tubes). Cells were thereafter lysed in a MagNA Lyser and stored at −80 °C for further analysis. Concentrated pools of BAs (100x concentration of physiological means) were generated in DMSO, mimicking the ratios of individual BAs measured using UPLC-MS. Cells were treated with diluted BA pools in complete media for 12 to 16 hours. Cells used for RNA extraction were treated with TRIzol (Ambion, Life Technologies, Thermo Fisher Scientific, Waltham, MA) and stored at −80 °C for further analysis.
Bile acid transport assay.
Differentiated Caco-2 cells (day 21 to 25 of differentiation) in transwells were treated with 40 nM siRNA and/or 50 μM U0126 (Sigma) for 48 hours prior to transcytosis assay. Bile acids were added for the indicated amounts of time (15 min to 24 hours) in HBSS with GCA as an internal standard. Transcytosis of bile acids was measured by drying basolateral media in a speed vac followed by resuspending media in 1:1 MeOH/water, transferred into mass spectrometry vials and injected onto the UPLC-MS. Cells were harvested for RNA extraction using TRIzol.
CA7S synthesis in HepG2 cells.
HepG2 cells were cultured in T182 flasks (Genesee) until confluency. VDR or negative siRNA was performed as described in the ‘Plasmid and transient transfections’ section. 48 hours after siRNA treatment, 250 μM cholic acid (CA), 10 μM PAPS (adenosine 3′-phosphate 5′-phosphosulfate, Sigma), and 100 μM lithocholic acid (LCA) were added as indicated in HBSS media and incubated overnight. The next day, media was collected and centrifuged at 4 °C for 30 min at 15,000 rpm. The supernatant was diluted 1:1 in 50% MeOH/water and centrifuged again at 4 °C for 30 min at 15000 rpm. The supernatant was transferred into mass spectrometry vials and injected onto the UPLC-MS.
Plasmids and transient transfections.
siRNAs were purchased from Santa Cruz Biotechnology, Dallas, TX, and negative siRNA from Ambion. 40 nM siRNA was used to transfect cells in antibiotic- and serum-free media using Opti-MEM and Lipofectamine 2000 according to manufacturer’s instructions. After siRNA transfection, cells were incubated in antibiotic- and serum-free media for 24 hours. The next day, a second siRNA transfection was performed and incubated overnight prior to further treatment. Cells were harvested for qPCR base quantification of siRNA efficiency using TRIzol.
GLP-1 measurements.
Total GLP-1 peptide measurements were performed using the GLP-1 EIA Kit (Sigma, Cat. No. RAB0201) according to manufacturer’s instructions. Mouse serum samples, NCI-H716 cell lysates, and cell culture media samples were stored at −80 °C and thawed on ice prior to performance ELISA assay. 20 μL of mouse serum samples were used directly in the GLP-1 ELISA assay. Cell culture media were centrifuged at 12000 rpm, and the supernatant was directly used in the GLP-1 ELISA assay. Cell lysates were subjected to peptide purification using Sep Pak C18 Classic columns (Waters Corporation, Milford, MA). The column was pretreated with a solution of 0.1% TFA in 80% isopropyl alcohol (EMD Millipore) and equilibrated with 0.1% TFA in water. Cell lysates were loaded onto the column and washed with 0.1% TFA in 80% isopropyl alcohol. The peptides were eluted in 0.1% TFA in 80% isopropyl alcohol. The eluate was concentrated by drying under vacuum and resuspended in 0.1% TFA in water. Water was used as ‘blank’ reading for serum GLP-1 ELISA, while 0.1% TFA in water was used as ‘blank’ for cell culture media and purified cell lysate ELISAs. Excess samples were stored at −80°C for later analyses. Total GLP-1 amounts in the cell culture media (secreted) and cell lysates were calculated using a standard curve provided in the EIA kit.
HepG2 and NCI-H716 co-culture.
HepG2 cells were cultured in 24-well plates (Genesee). VDR or negative siRNA was performed as described in the ‘Plasmid and transient transfections’ section. 48 hours after siRNA treatment, 250 μM cholic acid (CA), 10 μM PAPS (adenosine 3′-phosphate 5′-phosphosulfate, Sigma), and 100 μM lithocholic acid (LCA) were added as indicated in HBSS media and incubated overnight. The next day, NCI-H716 cells cultured for 2 days in 24-well transwells with Matrigel were ‘bathed’ in HepG2 media treated as indicted. After a 2 hour incubation, the media in the apical and basolateral chamber, and the NCI-H76 cells were collected and treated as described above for GLP-1 measurement.
RNA extraction and qPCR.
Cells frozen in TRIzol (Ambion) were collected in Rnase-free Eppendorf tubes and vortexed for 30 seconds. Tissues were collected in Precellys tubes with ceramic beads and TRIzol, followed by homogenization in a MagNA Lyser (Roche, Switzerland). Differentiated cells in transwells were scraped and collected in Precellys tubes with ceramic beads. Tubes were kept on ice whenever possible. Chloroform was added (200 μL chloroform/1 mL TRIzol) and vortexed for 30 seconds. Tubes were centrifuged at 12,000 rpm for 15 min at 4 °C. The clear top layer was transferred to new Rnase-free Eppendorf tubes containing 2-propanol and inverted to mix (500 μL 2-propanol/1ml TRIzol). Tubes were centrifuged at 12,000 rpm for 10 min at 4 °C. The pellet was washed with 70% EtOH and centrifuged at 14,000rpm for 5 minutes at 4 °C. The RNA pellet was air-dried and resuspended in Rnase-free H2O (GenClone). cDNA synthesis was performed using the High Capacity cDNA Reverse Transcription Kit (Applied Biosystems, Invitrogen, Foster City, CA). qPCR was performed using the LightCycler 480 SYBR Green I Mater (Roche, Switzerland) in a 384-well format using the LightCycler 480 System (Roche), or the QuantStudio 7 (ThermoFisher) at the ICCB-Longwood Screening Facility at Harvard Medical School based on instrument availability. Cq values above 45 were considered as not detected (n.d.). The 2-ΔΔCt method was used to calculate the relative change in gene expression. Data was then normalized to controls or the average for comparison between groups.
QUANTIFICATION AND STATISTICAL ANALYSIS
Data was quantified using software linked to indicated instruments and plotted in GraphPad Prism 7. Statistical analyses were performed using GraphPad Prism and Microsoft Excel software. Statistical significance was assessed using Welch’s t tests, paired t tests, one-way ANOVA followed by Dunnett’s multiple comparisons tests, one-way ANOVA followed by Turkey’s (HSD) post-hoc tests, or two-way ANOVA followed by Turkey’s (HSD) post-hoc tests wherever appropriate. The statistical tests used, exact p values, and sample sizes are indicated in each figure legend. No replicate was left out of analysis unless due to a technical error indicated in the figure legend or methods.
ADDITIONAL RESOURCES
16S Sequencing data.
16S sequencing data for mouse sham and SG cecal, and human pre- and post-SG fecal samples has been submitted into NCBI-SRA, BioProject ID PRJNA635168.
Supplementary Material
KEY RESOURCES TABLE
| REAGENT or RESOURCE | SOURCE | IDENTIFIER |
|---|---|---|
| Experimental Models: Cell lines | ||
| Human Caco-2 | ATCC | Cat. No. HTB-37 |
| Human HepG2 | ATCC | Cat. No. HB-8085 |
| Mouse Hepa 1-6 | ATCC | Cat. No. CRL-1830 |
| Human NCI-H716 | ATCC | Cat. No. CCL-251 |
| 16S sequencing data for mouse sham and SG cecal, and human pre- and post-SG fecal samples | NCBI-SRA | BioProject ID PRJNA635168 |
| Experimental Models: Animals | ||
| Diet-induced obese mice | Jackson Labs | https://www.jax.org/ |
| GF mice (tissue analysis and cecal microbial transplant) | This study | https://metagenomics.partners.org/ |
| GF C57BL/6NCrl mice (LCA feeding) | This study | Huh Lab, HMS |
| Vdr-KO and WT animals | This study | Demay Lab, MGH |
| Sham and SG animals | This study | Sheu Lab, BWH |
| Experimental Models: Human samples | ||
| Human patient pre-SG and post-SG feces samples | This study | Sheu Lab, BWH |
| Critical Commercial Assays | ||
| Cell Titer-Glo Luminescent Cell Viability Assay | Promega | Cat. No. G7570 |
| GLP-1 ELISA kit | Sigma | Cat. No. RAB0201 |
| Deposited Data | ||
| 16S Sequencing data - SG and sham mouse cecal, and pre-SG and post-SG human fecal microbiome analysis | NCBI-SRA | BioProject ID PRJNA635168 |
| Recombinant DNA | ||
| Human VDR siRNA | Santa Cruz Biotechnology | Cat. No. sc-106692 |
| Human PXR siRNA | Santa Cruz Biotechnology | Cat. No. sc-44057 |
| Human FXR siRNA | Santa Cruz Biotechnology | Cat. No. sc-38848 |
| Human CAR siRNA | Santa Cruz Biotechnology | Cat. No. sc-29908 |
| Human RORα siRNA | Santa Cruz Biotechnology | Cat. No. sc-38862 |
| Human RORγ siRNA | Santa Cruz Biotechnology | Cat. No. sc-38880 |
| Oligonucleotide primer sequences | This study; (Wells et al., 2003) | Table S1; doi: 10.1016/s0009-8981(03)00115-3 |
| Software and Algorithms | ||
| Nephele - 16S sequencing analysis | (Weber et al., 2018) | https://nephele.niaid.nih.gov/about/ |
| GraphPad Prism 7 | Commercial Software | https://www.graphpad.com/scientific-software/prism/ |
| Other | ||
| Animal diet - HFD, DIO mice | Research Diets Inc | Cat. No. D12492 |
| Animal diet - HFD, GF mice | Research Diets Inc | Cat. No. D12492ii |
| Animal diet - Standard Chow, GF mice | PicoLab Diet | Cat. No. 5053 |
| Animal diet - Rescue Chow, WT and Vdr-KO mice | Teklad | Cat. No. TD96348 |
Highlights.
Microbiome elicits CA7S, an anti-diabetic molecule increased post-sleeve gastrectomy (SG)
Microbial metabolite LCA is selectively transported to the liver via the portal vein
LCA activates Vitamin D Receptor to induce SULT2A, which produces CA7S in the liver
Microbial transplant from SG mice into GF mice triggers this gut-liver pathway
Acknowledgements
We thank members of the Devlin, Sheu, Clardy, and Tavakkoli labs (Harvard Medical School-HMS) for helpful discussions. We would like to acknowledge the Blacklow and Kruse labs for help with equipment and reagents, and the BWH mouse facility. We thank Matthew Henke for help with QTOF-MS analysis. GF mouse experiments were performed with the generous support of the Massachusetts Host-Microbiome Center, supported by grant P30DK034854. We thank the HMS ICCB-Longwood Screening Facility, the HMS Electron Microscopy core, Lynn Bry, Vladimir Yeliseyev, and Alex Banks for technical support and advice. We are grateful to the human patients who participated in this study. This work was supported by a KL2 award from Harvard Catalyst (4Kl2TR001100-04) (E.G.S.), a pilot grant from Boston Area Diabetes and Endocrinology Research Center (BADERC) (NIH/NIDDK P30 DK057521) (E.G.S.), an NIH MIRA grant (R35 GM128618) (A.S.D.), a Blavatnik Biomedical Accelerator at Harvard University grant (A.S.D.), a Quadrangle Fund for the Advancement and Seeding of Translational Research at Harvard Medical School (Q-FASTR) grant (A.S.D. and E.G.S.), an American Heart Association Postdoctoral Fellowship (S.N.C.), a HMS Department of Biological Chemistry and Molecular Pharmacology Fellowship (S.N.C), an American College of Surgeons fellowship (D.A.H.), an NIH T32 training grant (D.A.H. and J.N.L), a HMS Christopher Walsh Fellowship (L.Y), and a DRC P&F program grant from the Joslin Diabetes Center (P30DK036836) (A.H.V).
Footnotes
Declaration of Interests
CA7S is a subject of patents held by HMS and BWH on which S.N.C., D.A.H., E.G.S., and A.S.D. are inventors. A.S.D. is a consultant for Takeda Pharmaceuticals and HP Hood. E.G.S. is a consultant for Vicarious Surgical, Inc. and was previously on the scientific advisory board of Kitotech, Inc.
References
- Abbasi J (2017). Unveiling the "Magic" of Diabetes Remission After Weight-Loss Surgery. JAMA 317, 571–574. [DOI] [PubMed] [Google Scholar]
- Adhikari AA, Seegar TCM, Ficarro SB, McCurry MD, Ramachandran D, Yao L, Chaudhari SN, Ndousse-Fetter S, Banks AS, Marto JA, et al. (2020). Development of a covalent inhibitor of gut bacterial bile salt hydrolases. Nat Chem Biol 16, 318–326. [DOI] [PMC free article] [PubMed] [Google Scholar]
- Alnouti Y (2009). Bile Acid sulfation: a pathway of bile acid elimination and detoxification. Toxicol Sci 108, 225–246. [DOI] [PubMed] [Google Scholar]
- Bachmanov AA, Reed DR, Beauchamp GK, and Tordoff MG (2002). Food intake, water intake, and drinking spout side preference of 28 mouse strains. Behav Genet 32, 435–443. [DOI] [PMC free article] [PubMed] [Google Scholar]
- Besnard P, Landrier JF, Grober J, and Niot I (2004). [Is the ileal bile acid-binding protein (I-BABP) gene involved in cholesterol homeostasis?]. Med Sci (Paris) 20, 73–77. [DOI] [PubMed] [Google Scholar]
- Callahan BJ, McMurdie PJ, Rosen MJ, Han AW, Johnson AJ, and Holmes SP (2016). DADA2: High-resolution sample inference from Illumina amplicon data. Nat Methods 13, 581–583. [DOI] [PMC free article] [PubMed] [Google Scholar]
- Caporaso JG, Kuczynski J, Stombaugh J, Bittinger K, Bushman FD, Costello EK, Fierer N, Pena AG, Goodrich JK, Gordon JI, et al. (2010). QIIME allows analysis of high-throughput community sequencing data. Nat Methods 7, 335–336. [DOI] [PMC free article] [PubMed] [Google Scholar]
- Chaudhari SN, Harris DA, Aliakbarian H, Luo JN, Henke MT, Subramaniam R, Vernon AH, Tavakkoli A, Sheu EG, and Devlin AS (2020). Bariatric surgery reveals a gut-restricted TGR5 agonist with anti-diabetic effects. Nat Chem Biol. [DOI] [PMC free article] [PubMed] [Google Scholar]
- Craddock AL, Love MW, Daniel RW, Kirby LC, Walters HC, Wong MH, and Dawson PA (1998). Expression and transport properties of the human ileal and renal sodium-dependent bile acid transporter. Am J Physiol 274, G157–169. [DOI] [PubMed] [Google Scholar]
- Cristina ML, Lehy T, Zeitoun P, and Dufougeray F (1978). Fine structural classification and comparative distribution of endocrine cells in normal human large intestine. Gastroenterology 75, 20–28. [PubMed] [Google Scholar]
- Damms-Machado A, Mitra S, Schollenberger AE, Kramer KM, Meile T, Konigsrainer A, Huson DH, and Bischoff SC (2015). Effects of surgical and dietary weight loss therapy for obesity on gut microbiota composition and nutrient absorption. Biomed Res Int 2015, 806248. [DOI] [PMC free article] [PubMed] [Google Scholar]
- Dawson PA, Lan T, and Rao A (2009). Bile acid transporters. J Lipid Res 50, 2340–2357. [DOI] [PMC free article] [PubMed] [Google Scholar]
- Dawson PA, and Setchell KDR (2017). Will the real bile acid sulfotransferase please stand up? Identification of Sult2a8 as a major hepatic bile acid sulfonating enzyme in mice. J Lipid Res 58, 1033–1035. [DOI] [PMC free article] [PubMed] [Google Scholar]
- Ding L, Sousa KM, Jin L, Dong B, Kim BW, Ramirez R, Xiao Z, Gu Y, Yang Q, Wang J, et al. (2016). Vertical sleeve gastrectomy activates GPBAR-1/TGR5 to sustain weight loss, improve fatty liver, and remit insulin resistance in mice. Hepatology 64, 760–773. [DOI] [PMC free article] [PubMed] [Google Scholar]
- Duboc H, Tache Y, and Hofmann AF (2014). The bile acid TGR5 membrane receptor: from basic research to clinical application. Dig Liver Dis 46, 302–312. [DOI] [PMC free article] [PubMed] [Google Scholar]
- Elam MB, Cowan GS Jr., Rooney RJ, Hiler ML, Yellaturu CR, Deng X, Howell GE, Park EA, Gerling IC, Patel D, et al. (2009). Hepatic gene expression in morbidly obese women: implications for disease susceptibility. Obesity (Silver Spring) 17, 1563–1573. [DOI] [PubMed] [Google Scholar]
- Feng L, Yuen YL, Xu J, Liu X, Chan MY, Wang K, Fong WP, Cheung WT, and Lee SS (2017). Identification and characterization of a novel PPARalpha-regulated and 7alpha-hydroxyl bile acid-preferring cytosolic sulfotransferase mL-STL (Sult2a8). J Lipid Res 58, 1114–1131. [DOI] [PMC free article] [PubMed] [Google Scholar]
- Ferruzza S, Rossi C, Scarino ML, and Sambuy Y (2012). A protocol for differentiation of human intestinal Caco-2 cells in asymmetric serum-containing medium. Toxicol In Vitro 26, 1252–1255. [DOI] [PubMed] [Google Scholar]
- Fiorucci S, and Distrutti E (2015). Bile Acid-Activated Receptors, Intestinal Microbiota, and the Treatment of Metabolic Disorders. Trends Mol Med 21, 702–714. [DOI] [PubMed] [Google Scholar]
- Fukushima K, Okada A, Hayashi Y, Ichikawa H, Nishimura A, Shibata N, and Sugioka N (2015). Enhanced oral bioavailability of vancomycin in rats treated with long-term parenteral nutrition. Springerplus 4, 442. [DOI] [PMC free article] [PubMed] [Google Scholar]
- Funabashi M, Grove TL, Wang M, Varma Y, McFadden ME, Brown LC, Guo C, Higginbottom S, Almo SC, and Fischbach MA (2020). A metabolic pathway for bile acid dehydroxylation by the gut microbiome. Nature 582, 566–570. [DOI] [PMC free article] [PubMed] [Google Scholar]
- Ghosh A, Chen F, Banerjee S, Xu M, and Shneider BL (2014). c-Fos mediates repression of the apical sodium-dependent bile acid transporter by fibroblast growth factor-19 in mice. Am J Physiol Gastrointest Liver Physiol 306, G163–171. [DOI] [PMC free article] [PubMed] [Google Scholar]
- Gralka E, Luchinat C, Tenori L, Ernst B, Thurnheer M, and Schultes B (2015). Metabolomic fingerprint of severe obesity is dynamically affected by bariatric surgery in a procedure-dependent manner. Am J Clin Nutr 102, 1313–1322. [DOI] [PubMed] [Google Scholar]
- Hall AB, Yassour M, Sauk J, Garner A, Jiang X, Arthur T, Lagoudas GK, Vatanen T, Fornelos N, Wilson R, et al. (2017). A novel Ruminococcus gnavus clade enriched in inflammatory bowel disease patients. Genome Med 9, 103. [DOI] [PMC free article] [PubMed] [Google Scholar]
- Han S, and Chiang JY (2009). Mechanism of vitamin D receptor inhibition of cholesterol 7alpha-hydroxylase gene transcription in human hepatocytes. Drug Metab Dispos 37, 469–478. [DOI] [PMC free article] [PubMed] [Google Scholar]
- Heshmati K, Harris DA, Aliakbarian H, Tavakkoli A, and Sheu EG (2019). Comparison of early type 2 diabetes improvement after gastric bypass and sleeve gastrectomy: medication cessation at discharge predicts 1-year outcomes. Surg Obes Relat Dis 15, 2025–2032. [DOI] [PubMed] [Google Scholar]
- Jahansouz C, Staley C, Bernlohr DA, Sadowsky MJ, Khoruts A, and Ikramuddin S (2017). Sleeve gastrectomy drives persistent shifts in the gut microbiome. Surg Obes Relat Dis 13, 916–924. [DOI] [PubMed] [Google Scholar]
- Jahansouz C, Staley C, Kizy S, Xu H, Hertzel AV, Coryell J, Singroy S, Hamilton M, DuRand M, Bernlohr DA, et al. (2018). Antibiotic-induced Disruption of Intestinal Microbiota Contributes to Failure of Vertical Sleeve Gastrectomy. Ann Surg. [DOI] [PubMed] [Google Scholar]
- Kakizaki S, Takizawa D, Tojima H, Yamazaki Y, and Mori M (2009). Xenobiotic-sensing nuclear receptors CAR and PXR as drug targets in cholestatic liver disease. Curr Drug Targets 10, 1156–1163. [DOI] [PubMed] [Google Scholar]
- Kaska L, Sledzinski T, Chomiczewska A, Dettlaff-Pokora A, and Swierczynski J (2016). Improved glucose metabolism following bariatric surgery is associated with increased circulating bile acid concentrations and remodeling of the gut microbiome. World J Gastroenterol 22, 8698–8719. [DOI] [PMC free article] [PubMed] [Google Scholar]
- Kastl AJ Jr., Terry NA, Wu GD, and Albenberg LG (2020). The Structure and Function of the Human Small Intestinal Microbiota: Current Understanding and Future Directions. Cell Mol Gastroenterol Hepatol 9, 33–45. [DOI] [PMC free article] [PubMed] [Google Scholar]
- Kohli R, Bradley D, Setchell KD, Eagon JC, Abumrad N, and Klein S (2013). Weight loss induced by Roux-en-Y gastric bypass but not laparoscopic adjustable gastric banding increases circulating bile acids. J Clin Endocrinol Metab 98, E708–712. [DOI] [PMC free article] [PubMed] [Google Scholar]
- Lamp KC, Freeman CD, Klutman NE, and Lacy MK (1999). Pharmacokinetics and pharmacodynamics of the nitroimidazole antimicrobials. Clin Pharmacokinet 36, 353–373. [DOI] [PubMed] [Google Scholar]
- Larraufie P, Roberts GP, McGavigan AK, Kay RG, Li J, Leiter A, Melvin A, Biggs EK, Ravn P, Davy K, et al. (2019). Important Role of the GLP-1 Axis for Glucose Homeostasis after Bariatric Surgery. Cell Rep 26, 1399–1408 e1396. [DOI] [PMC free article] [PubMed] [Google Scholar]
- Lea T (2015). Caco-2 Cell Line. In The Impact of Food Bioactives on Health: in vitro and ex vivo models, Verhoeckx K, Cotter P, Lopez-Exposito I, Kleiveland C, Lea T, Mackie A, Requena T, Swiatecka D, and Wichers H, eds. (Cham (CH)), pp. 103–111. [PubMed] [Google Scholar]
- Lespessailles E, and Toumi H (2017). Vitamin D alteration associated with obesity and bariatric surgery. Exp Biol Med (Maywood) 242, 1086–1094. [DOI] [PMC free article] [PubMed] [Google Scholar]
- Li YC, Amling M, Pirro AE, Priemel M, Meuse J, Baron R, Delling G, and Demay MB (1998). Normalization of mineral ion homeostasis by dietary means prevents hyperparathyroidism, rickets, and osteomalacia, but not alopecia in vitamin D receptor-ablated mice. Endocrinology 139, 4391–4396. [DOI] [PubMed] [Google Scholar]
- Liu H, Hu C, Zhang X, and Jia W (2018). Role of gut microbiota, bile acids and their cross-talk in the effects of bariatric surgery on obesity and type 2 diabetes. J Diabetes Investig 9, 13–20. [DOI] [PMC free article] [PubMed] [Google Scholar]
- Magouliotis DE, Tasiopoulou VS, Sioka E, Chatedaki C, and Zacharoulis D (2017). Impact of Bariatric Surgery on Metabolic and Gut Microbiota Profile: a Systematic Review and Meta-analysis. Obes Surg 27, 1345–1357. [DOI] [PubMed] [Google Scholar]
- Manchanda PK, and Bid HK (2012). Vitamin D receptor and type 2 diabetes mellitus: Growing therapeutic opportunities. Indian J Hum Genet 18, 274–275. [DOI] [PMC free article] [PubMed] [Google Scholar]
- Marion S, Studer N, Desharnais L, Menin L, Escrig S, Meibom A, Hapfelmeier S, and Bernier-Latmani R (2019). In vitro and in vivo characterization of Clostridium scindens bile acid transformations. Gut Microbes 10, 481–503. [DOI] [PMC free article] [PubMed] [Google Scholar]
- Martinez-Augustin O, and Sanchez de Medina F (2008). Intestinal bile acid physiology and pathophysiology. World J Gastroenterol 14, 5630–5640. [DOI] [PMC free article] [PubMed] [Google Scholar]
- Martinez-Guryn K, Hubert N, Frazier K, Urlass S, Musch MW, Ojeda P, Pierre JF, Miyoshi J, Sontag TJ, Cham CM, et al. (2018). Small Intestine Microbiota Regulate Host Digestive and Absorptive Adaptive Responses to Dietary Lipids. Cell Host Microbe 23, 458–469 e455. [DOI] [PMC free article] [PubMed] [Google Scholar]
- McGavigan AK, Garibay D, Henseler ZM, Chen J, Bettaieb A, Haj FG, Ley RE, Chouinard ML, and Cummings BP (2017). TGR5 contributes to glucoregulatory improvements after vertical sleeve gastrectomy in mice. Gut 66, 226–234. [DOI] [PMC free article] [PubMed] [Google Scholar]
- Medina DA, Pedreros JP, Turiel D, Quezada N, Pimentel F, Escalona A, and Garrido D (2017). Distinct patterns in the gut microbiota after surgical or medical therapy in obese patients. PeerJ 5, e3443. [DOI] [PMC free article] [PubMed] [Google Scholar]
- Out C, Patankar JV, Doktorova M, Boesjes M, Bos T, de Boer S, Havinga R, Wolters H, Boverhof R, van Dijk TH, et al. (2015). Gut microbiota inhibit Asbt-dependent intestinal bile acid reabsorption via Gata4. J Hepatol 63, 697–704. [DOI] [PMC free article] [PubMed] [Google Scholar]
- Patti ME, Houten SM, Bianco AC, Bernier R, Larsen PR, Holst JJ, Badman MK, Maratos-Flier E, Mun EC, Pihlajamaki J, et al. (2009). Serum bile acids are higher in humans with prior gastric bypass: potential contribution to improved glucose and lipid metabolism. Obesity (Silver Spring) 17, 1671–1677. [DOI] [PMC free article] [PubMed] [Google Scholar]
- Pournaras DJ, Glicksman C, Vincent RP, Kuganolipava S, Alaghband-Zadeh J, Mahon D, Bekker JH, Ghatei MA, Bloom SR, Walters JR, et al. (2012). The role of bile after Roux-en-Y gastric bypass in promoting weight loss and improving glycaemic control. Endocrinology 153, 3613–3619. [DOI] [PMC free article] [PubMed] [Google Scholar]
- Ridlon JM, Kang DJ, and Hylemon PB (2006). Bile salt biotransformations by human intestinal bacteria. J Lipid Res 47, 241–259. [DOI] [PubMed] [Google Scholar]
- Roda A, Cappelleri G, Aldini R, Roda E, and Barbara L (1982). Quantitative aspects of the interaction of bile acids with human serum albumin. J Lipid Res 23, 490–495. [PubMed] [Google Scholar]
- Runge-Morris M, Kocarek TA, and Falany CN (2013). Regulation of the cytosolic sulfotransferases by nuclear receptors. Drug Metab Rev 45, 15–33. [DOI] [PMC free article] [PubMed] [Google Scholar]
- Ryan KK, Tremaroli V, Clemmensen C, Kovatcheva-Datchary P, Myronovych A, Karns R, Wilson-Perez HE, Sandoval DA, Kohli R, Backhed F, et al. (2014). FXR is a molecular target for the effects of vertical sleeve gastrectomy. Nature 509, 183–188. [DOI] [PMC free article] [PubMed] [Google Scholar]
- Samczuk P, Ciborowski M, and Kretowski A (2018). Application of Metabolomics to Study Effects of Bariatric Surgery. J Diabetes Res 2018, 6270875. [DOI] [PMC free article] [PubMed] [Google Scholar]
- Schloss PD, Westcott SL, Ryabin T, Hall JR, Hartmann M, Hollister EB, Lesniewski RA, Oakley BB, Parks DH, Robinson CJ, et al. (2009). Introducing mothur: open-source, platform-independent, community-supported software for describing and comparing microbial communities. Appl Environ Microbiol 75, 7537–7541. [DOI] [PMC free article] [PubMed] [Google Scholar]
- Shang Q, Saumoy M, Holst JJ, Salen G, and Xu G (2010). Colesevelam improves insulin resistance in a diet-induced obesity (F-DIO) rat model by increasing the release of GLP-1. Am J Physiol Gastrointest Liver Physiol 298, G419–424. [DOI] [PubMed] [Google Scholar]
- Sisley SR, Arble DM, Chambers AP, Gutierrez-Aguilar R, He Y, Xu Y, Gardner D, Moore DD, Seeley RJ, and Sandoval DA (2016). Hypothalamic Vitamin D Improves Glucose Homeostasis and Reduces Weight. Diabetes 65, 2732–2741. [DOI] [PMC free article] [PubMed] [Google Scholar]
- Sun AQ, Balasubramaniyan N, Chen H, Shahid M, and Suchy FJ (2006). Identification of functionally relevant residues of the rat ileal apical sodium-dependent bile acid cotransporter. J Biol Chem 281, 16410–16418. [DOI] [PubMed] [Google Scholar]
- Tan HY, Trier S, Rahbek UL, Dufva M, Kutter JP, and Andresen TL (2018). A multi-chamber microfluidic intestinal barrier model using Caco-2 cells for drug transport studies. PLoS One 13, e0197101. [DOI] [PMC free article] [PubMed] [Google Scholar]
- Tremaroli V, Karlsson F, Werling M, Stahlman M, Kovatcheva-Datchary P, Olbers T, Fandriks L, le Roux CW, Nielsen J, and Backhed F (2015). Roux-en-Y Gastric Bypass and Vertical Banded Gastroplasty Induce Long-Term Changes on the Human Gut Microbiome Contributing to Fat Mass Regulation. Cell Metab 22, 228–238. [DOI] [PMC free article] [PubMed] [Google Scholar]
- Wahlstrom A, Kovatcheva-Datchary P, Stahlman M, Khan MT, Backhed F, and Marschall HU (2017). Induction of farnesoid X receptor signaling in germ-free mice colonized with a human microbiota. J Lipid Res 58, 412–419. [DOI] [PMC free article] [PubMed] [Google Scholar]
- Wahlstrom A, Sayin SI, Marschall HU, and Backhed F (2016). Intestinal Crosstalk between Bile Acids and Microbiota and Its Impact on Host Metabolism. Cell Metab 24, 41–50. [DOI] [PubMed] [Google Scholar]
- Wang W, Cheng Z, Wang Y, Dai Y, Zhang X, and Hu S (2019). Role of Bile Acids in Bariatric Surgery. Front Physiol 10, 374. [DOI] [PMC free article] [PubMed] [Google Scholar]
- Weber N, Liou D, Dommer J, MacMenamin P, Quinones M, Misner I, Oler AJ, Wan J, Kim L, Coakley McCarthy M, et al. (2018). Nephele: a cloud platform for simplified, standardized and reproducible microbiome data analysis. Bioinformatics 34, 1411–1413. [DOI] [PMC free article] [PubMed] [Google Scholar]
- Wells JE, Williams KB, Whitehead TR, Heuman DM, and Hylemon PB (2003). Development and application of a polymerase chain reaction assay for the detection and enumeration of bile acid 7alpha-dehydroxylating bacteria in human feces. Clin Chim Acta 331, 127–134. [DOI] [PubMed] [Google Scholar]
- Wu WK, Hsu CC, Sheen LY, and Wu MS (2019). Measurement of gut microbial metabolites in cardiometabolic health and translational research. Rapid Commun Mass Spectrom. [DOI] [PubMed] [Google Scholar]
- Xie G, Wang X, Jiang R, Zhao A, Yan J, Zheng X, Huang F, Liu X, Panee J, Rajani C, et al. (2018). Dysregulated bile acid signaling contributes to the neurological impairment in murine models of acute and chronic liver failure. EBioMedicine 37, 294–306. [DOI] [PMC free article] [PubMed] [Google Scholar]
- Yalcin EB, More V, Neira KL, Lu ZJ, Cherrington NJ, Slitt AL, and King RS (2013). Downregulation of sulfotransferase expression and activity in diseased human livers. Drug Metab Dispos 41, 1642–1650. [DOI] [PMC free article] [PubMed] [Google Scholar]
- Yao L, Seaton SC, Ndousse-Fetter S, Adhikari AA, DiBenedetto N, Mina AI, Banks AS, Bry L, and Devlin AS (2018). A selective gut bacterial bile salt hydrolase alters host metabolism. Elife 7. [DOI] [PMC free article] [PubMed] [Google Scholar]
- Ye ZQ, Niu S, Yu Y, Yu H, Liu BH, Li RX, Xiao HS, Zeng R, Li YX, Wu JR, et al. (2010). Analyses of copy number variation of GK rat reveal new putative type 2 diabetes susceptibility loci. PLoS One 5, e14077. [DOI] [PMC free article] [PubMed] [Google Scholar]
Associated Data
This section collects any data citations, data availability statements, or supplementary materials included in this article.
Supplementary Materials
Data Availability Statement
The 16S rDNA datasets analyzed in the manuscript are available through the NCBI under accession number PRJNA635168. All other data generated or analyzed during this study are included in this article and its Supplemental Information files. No custom code or mathematical algorithms were used in this study.