

Key Points
Question
What are the temporal associations among higher body mass index (BMI) and chronic inflammation and/or hyperinsulinemia?
Findings
In this systematic review and meta-analysis of 5603 participants in 112 cohorts from 60 studies, the association between period 1 (preceding) levels of fasting insulin and period 2 (subsequent) BMI was positive and significant: for every unit of SD change in period 1 insulin level, there was an ensuing associated change in 0.26 units of SD in period 2 BMI.
Meaning
These findings suggest that adverse consequences currently attributed to obesity could be attributed to hyperinsulinemia (or another proximate factor).
Abstract
Importance
Obesity is associated with a number of noncommunicable chronic diseases and is purported to cause premature death.
Objective
To summarize evidence on the temporality of the association between higher body mass index (BMI) and 2 potential mediators: chronic inflammation and hyperinsulinemia.
Data Sources
MEDLINE (1946 to August 20, 2019) and Embase (from 1974 to August 19, 2019) were searched, although only studies published in 2018 were included because of a high volume of results. The data analysis was conducted between January 2020 and October 2020.
Study Selection and Measures
Longitudinal studies and randomized clinical trials that measured fasting insulin level and/or an inflammation marker and BMI with at least 3 commensurate time points were selected.
Data Extraction and Synthesis
Slopes of these markers were calculated between time points and standardized. Standardized slopes were meta-regressed in later periods (period 2) with standardized slopes in earlier periods (period 1). Evidence-based items potentially indicating risk of bias were assessed.
Results
Of 1865 records, 60 eligible studies with 112 cohorts of 5603 participants were identified. Most standardized slopes were negative, meaning that participants in most studies experienced decreases in BMI, fasting insulin level, and C-reactive protein level. The association between period 1 fasting insulin level and period 2 BMI was positive and significant (β = 0.26; 95% CI, 0.13-0.38; I2 = 79%): for every unit of SD change in period 1 insulin level, there was an ensuing associated change in 0.26 units of SD in period 2 BMI. The association of period 1 fasting insulin level with period 2 BMI remained significant when period 1 C-reactive protein level was added to the model (β = 0.57; 95% CI, 0.27-0.86). In this bivariable model, period 1 C-reactive protein level was not significantly associated with period 2 BMI (β = –0.07; 95% CI, –0.42 to 0.29; I2 = 81%).
Conclusions and Relevance
In this meta-analysis, the finding of temporal sequencing (in which changes in fasting insulin level precede changes in weight) is not consistent with the assertion that obesity causes noncommunicable chronic diseases and premature death by increasing levels of fasting insulin.
This systematic review and meta-analysis summarize evidence on the temporality of the association between higher body mass index and chronic inflammation and/or hyperinsulinemia.
Introduction
Obesity is associated with a number of noncommunicable chronic diseases (NCDs), such as type 2 diabetes, coronary disease, chronic kidney disease, and asthma. Although obesity is also purported to cause premature death, this association fails to meet several of the Bradford Hill criteria for causation.1,2 First, the putative attributable risk of death is small (<5%).3 Second, the dose-response gradient between body mass index (BMI) and mortality is U-shaped with overweight (and possibly obesity level I) as the minima.3 Third, evidence from animal models comes largely from mice that have been fed high-fat diets; unlike humans, these animals did not normally have fat as part of their typical diet, and thus the experiments are potentially not analogous to those in humans. Fourth, evidence that people with obesity live longer than their lean counterparts in populations with acute or chronic conditions and older age is remarkably consistent.4,5,6,7,8,9,10,11,12,13,14,15,16 Therefore, it is possible that rather than being a risk factor for NCDs, obesity is actually a protective response to the development of disease.
The putative links between obesity and adverse outcomes are often attributed to 2 potential mediators: chronic inflammation and hyperinsulinemia. These characteristics have been associated with several NCDs, including obesity as well as type 2 diabetes, cardiovascular disease,17 and chronic kidney disease.18 Existing data on the association of obesity with chronic inflammation and/or hyperinsulinemia are chiefly cross-sectional, making it difficult to confirm the direction of any causality. This systematic review and meta-analysis summarizes evidence on the temporality of the association between higher BMI and chronic inflammation and/or hyperinsulinemia. We hypothesized that changes in chronic inflammation and hyperinsulinemia would precede changes in higher BMI.
Methods
This systematic review and meta-analysis was conducted and reported according to Preferred Reporting Items for Systematic Reviews and Meta-analyses (PRISMA)19 and Meta-analysis of Observational Studies in Epidemiology (MOOSE)20 reporting guidelines. Research ethics board approval was not required because this is a systematic review of previously published research.
Data Sources and Searches
We performed a comprehensive search designed by a trained librarian (E.T.C.) to identify all longitudinal studies and randomized clinical trials (RCTs) that measured fasting insulin and/or an inflammation marker and weight with at least 3 commensurate time points. We included only primary studies published in the English language as full peer-reviewed articles. MEDLINE (1946 to August 20, 2019) and Embase (1974 to August 19, 2019) were searched; however, only studies published in 2018 were retained because of the high volume of results. No existing systematic reviews were found. The specific search strategies are provided in eTable 1 in the Supplement. The abstracts were independently screened by 2 reviewers (including N.W.). The full text of any study considered potentially relevant by 1 or both reviewers was retrieved for further consideration. The data analysis was conducted between January 2020 and October 2020.
Study Selection
Each potentially relevant study was independently assessed by 2 reviewers (N.W. and F.Y.) for inclusion in the review using the following predetermined eligibility criteria. Longitudinal studies and RCTs with men and nonpregnant and not recently pregnant women (≥18 years of age) and at least 3 time points with 1 or more weeks of follow-up in which fasting insulin levels or a marker of inflammation and some measure of weight were included in this review. Disagreements were resolved by consultation.
Data Extraction and Risk of Bias Assessment
Data from eligible studies were extracted by a single reviewer (N.W.). A second reviewer checked the extracted data for accuracy. The following properties of each study were recorded in a database: study characteristics (country, era of accrual, design, duration of follow-up, populations of interest, intervention where applicable, and sample size), age and sex of participants, and the measures of interest (numbers, means, and SDs) for all time points: (1) fasting insulin, the homeostatic model assessment index, or the quantitative insulin sensitivity check index; (2) concentrations of C-reactive protein (CRP), interleukin cytokines, or tumor necrosis factor; and (3) weight, BMI (calculated as weight in kilograms divided by height in meters squared), fat mass, or fat mass percentage.
Risk of bias was assessed using items from Downs and Black21: clear objective, adequate description of measures, sample size or power calculation, intention to treat study design (in those studies that assigned the intervention), adequate description of withdrawals, adequate handling of missing data, and adequate description of results. Source of funding was also extracted, given its potential to introduce bias.22
Statistical Analysis
Data were analyzed using Stata software, version 15.1 (StataCorp LLC). Missing SDs were imputed using interquartile ranges or using another SD from the same cohort.23 Data were extracted from graphs if required.
To determine a likely temporal sequencing of fasting insulin level or chronic inflammation with obesity, we compared the associations of period 2 insulin level or inflammation regressed on period 1 BMI and period 2 BMI regressed on period 1 insulin or inflammation. A stronger association would support a particular direction of effect.
For each measure of interest, the change in means was calculated between adjacent time points and divided by the number of weeks between the measures. This slope or per week change in measure was then standardized by dividing it by the pooled SD, giving a standardized slope. Because of expected diversity among studies, we decided a priori to combine the standardized slopes using a random-effects models. Period 2 standardized slopes of weight measures were regressed onto period 1 standardized slopes of insulin or inflammation measures and vice versa. We regressed measures of insulin post hoc on measures of inflammation and vice versa.
The type I error rate for meta-regressions was set at a 2-sided P < .05. Statistical heterogeneity was quantified using the τ2 statistic (between-study variance)24 and the I2 statistic. Differences in standardized slopes (βs) along with 95% CIs are reported.
We considered a number of sensitivity analyses. Because we included multiple standardized slopes at different intervals from the same studies (or same cohorts), we accounted for this nonindependence using a generalized linear model in which the family was gaussian and the link was identity, which allowed for nested random effects (results by intervals were nested within cohorts). To estimate between-study heterogeneity, the coefficients for the within-cohort SEs were constrained to 1. We also performed 2 subgroup analyses: whether the study population had undergone bariatric surgery and the numbers of weeks between time points (>12 vs ≤12 weeks), reasoning that if the effects of one measure of interest acted quickly on the other, then shorter intervals might demonstrate stronger associations. We explored post hoc models with 2 measures of interest as period 1 independent variables.
Results
Quantity of Research Available
The searches identified 1865 unique records identifying articles or abstracts published in 2018 (Figure 1). After the initial screening, the full texts of 813 articles were retrieved for detailed evaluation. Of these, 753 articles were excluded, resulting in 60 that met the selection criteria and 5603 enrolled participants (of whom 5261 were analyzed).25,26,27,28,29,30,31,32,33,34,35,36,37,38,39,40,41,42,43,44,45,46,47,48,49,50,51,52,53,54,55,56,57,58,59,60,61,62,63,64,65,66,67,68,69,70,71,72,73,74,75,76,77,78,79,80,81,82,83,84 We decided to exclude 12 studies of children and adolescents post hoc because these studies used different BMI measures. Disagreements about the inclusion of studies occurred in 2% of the articles (κ = 0.87).
Figure 1. Flow Diagram of Studies.

Characteristics of Studies
There were 26 RCTs, 4 nonrandomized clinical trials, 23 prospective cohort studies (3 nested within an RCT), and 7 retrospective cohort studies (Table 125,26,27,28,29,30,31,32,33,34,35,36,37,38,39,40,41,42,43,44,45,46,47,48,49,50,51,52,53,54,55,56,57,58,59,60,61,62,63,64,65,66,67,68,69,70,71,72,73,74,75,76,77,78,79,80,81,82,83,84). Of the studies, 58% began data collection in the 5 years before publication. The earliest study accrued participants starting in 2000. The durations of follow-up ranged from 1 to 60 months (median, 12 months). A total of 21 studies were from Western Europe,25,27,41,54,61,62,65,72,81,82,84 11 from North America,25,27,41,54,61,62,65,72,81,82,84 9 from East Asia,29,38,39,44,51,52,60,66,68 5 from South America,28,69,78,79,83 5 from Western Asia,28,69,78,79,83 and 3 each from Africa,35,50,76 the Pacific,26,42,75 and Eastern Europe.45,74,80
Table 1. Study and Study Population Characteristics.
| Source | Country | Year of study start | Design | Follow-up, mo | Population | Cohort(s) | Enrolled/analyzed | Mean age, y | Male, % |
|---|---|---|---|---|---|---|---|---|---|
| Abdel-Razik et al,35 2018 | Egypt | 2015 | RCT | 6 | NASH | Rifaximin and placebo | 25 and 25 | 40 and 38 | 36 and 28 |
| Abiad et al,37 2018 | Lebanon | 2015 | Prospective cohort | 12 | BMI ≥40 or >35 with a comorbidity and SG | PCOS and control | 6 and 19/16 | 24 and 28 | 0 |
| Arikawa et al,82 2018 | US | 2009 | RCT | 4 | BMI ≥27 after breast cancer | CR diet plus exercise and weight management counseling | 10/10 and 11/10 | 55 and 58 | 0 |
| Arnold et al,72 2018 | US | 2015 | Prospective cohort | 3 | BMI >30 | Decreased added sugars, increased fiber, and fish diet | 15/14 | 59 | 0 |
| Asle Mohammadi Zadeh et al,55 2018 | Iran | NR | RCT | 6 | T2D | Low-carbohydrate diet, low-fat diet, high-fat diet, and control | 11, 11, 11, and 9 | 47, 49, 45, and 45 | 100 |
| Baltieri et al,83 2018 | Brazil | 2015 | Prospective cohort | 12 | BMI ≥35 | RYGB | 19/13 | 37a | 0 |
| Bulatova et al,46 2018 | Jordan | 2012 | RCT | 6 | Prediabetes or T2D | Metformin and control | 42/26 and 49/27 | 51 and 51 | 22 and 3 |
| Carbone et al,67 2019b | Italy | 2007 | Retrospective cohort | 36 | RYGB or BPD with T2D | T2D remission and no T2D remission | 14 and 27 | 54a and 56a | 64 and 82 |
| Chen et al,29 2018 | China | 2012 | nRCT | 12 | T2D | Saxagliptin and metformin and acarbose and metformin | 51 and 51 | 64 and 64 | 47 and 47 |
| Cheung et al,42 2018 | Australia | NR | Prospective cohort | 36 | Prostate cancer | Cessation of androgen deprivation therapy and control | 34/27 and 29/19 |
68a and 71a | 100 |
| Chiappetta et al,73 2018 | Germany | 2014 | Retrospective cohort | 6 | BMI ≥40 or ≥35 with a comorbidity | SG, 1-anastomosis GB, and RYGB | 241, 68, and 159 |
44 | 32 |
| Dardzińska et al,74 2018 | Poland | NR | Prospective cohort | 12 | BMI >35 with no diabetes medication and no cardiovascular events | Mini-GB, SG, and RYGB | 12/9, 8/5, and 11/9 | 38 | 24 |
| De Luis, Calvo et al,34 2018 | Spain | NR | Prospective cohort | 36 | BMI ≥40 or >35 with a comorbidity after bariatric surgery | CCc rs266729 CG and GG rs266729 |
84 and 65 | 47 and 47 | 23 and 25 |
| De Luis, Izaola et al,49 2018 | Spain | NR | Prospective cohort | 36 | BMI ≥30 | Mediterranean CR diet then dietary counseling | 335 | 50 | 25 |
| De Luis, Pacheco et al,64 2018 | Spain | NR | Prospective cohort | 36 | BPD with no diabetes and BMI ≥40 | GGc rs670 and GA or AA rs670 | 46 and 17 | 48 and 47 | 13 and 18 |
| De Paulo et al,28 2018 | Brazil | 2015 | RCT | 8 | Aromatase inhibitor after breast cancer | Aerobic and resistance training and stretching and relaxation exercises | 18 and 18 | 63 and 67 | 0 |
| Demerdash et al,76 2018 | Egypt | 2011 | Prospective cohort | 24 | Obesity | SG | 92 | 43 | 30 |
| Derosa et al,40 2018 | Italy | NR | RCT | 12 | T2D and hypertension | Canrenone and hydrochlorothiazide | 92 and 90 | 53 and 53 | 52 and 49 |
| Dhillon et al,84 2018 | US | 2016 | RCT | 2 | College students (no diabetes or prediabetes) | Almond snacks and cracker snacks | 38 and 35 | 18 and 18 | 42 and 46 |
| Di Sebastiano et al,27 2018 | Canada | NR | Prospective cohort | 8 | Prostate cancer | Treated | 9 | 71 | 100 |
| Drummen et al,59 2018 (PREVIEW) | Netherlands | 2013 | Prospective cohort nested in RCT | 24 | BMI >25 and prediabetes | High-protein diet and moderate-protein diet | 12 and 13 | 58 and 54 | 50 and 58 |
| Esquivel et al,69 2018 | Argentina | 2009 | Prospective cohort | 12 | BMI >40 or >35 with a comorbidity | SG | 63/43 | 40 | 35 |
| Fortin et al,54 2018 | Canada | 2016 | RCT | 9 | T1D and metabolic syndrome | Mediterranean diet and low-fat diet | 14 and 14 | 52 and 50 | 47 and 64 |
| Fuller et al,26 2018 (DIABEGG) | Australia | 2013 | RCT | 6 | Prediabetes or T2D | High-egg diet and low-egg diet | 72/66 and 68/62 | 60 and 61 | 50 and 42 |
| Gadéa et al,56 2018 | France | 2011 | Prospective cohort | 6 | Breast cancer | Chemotherapy | 52 | 60a | 0 |
| Galbreath et al,62 2018 | US | NR | RCT | 3 | BMI >27 or body fat >35% | High-protein diet, high-carbohydrate diet, and control | 24/17, 24/18, and 24/19 | 66, 63, and 66 | 0 |
| Goday et al,77 2018 | Spain | 2010 | Retrospective cohort | 24 | SG and RYGB |
Helicobacter pylori eradication and control for SG and H pylori and eradication control for RYGB |
49 and 60 (SG) 50 and 70 (RYGB) |
44 and 46 (SG) and 42 and 42 (RYGB) |
37 and 22 (SG) and 22 and 16 (RYGB) |
| Guarnotta et al,36 2018 | Italy | 2013 | Prospective cohort | 12 | Cushing disease | Pasireotide | 12 | 40a | 17 |
| Hady et al,45 2018 | Poland | 2012 | RCT | 12 | Obesity | 32F bougie size in SG, 36F bougie size in SG, and 40F bougie size in SG |
40, 40, and 40 |
41, 43, and 45 |
38, 30, and 43 |
| Hanai et al,44 2018 | Japan | NR | RCT | 1 | Surgery for head and neck squamous cell carcinoma | EPA-enriched nutritional supplement and control | 13 and 14 | 62 and 66 | 62 and 57 |
| Hattori,66 2018 | Japan | 2016 | RCT | 12 | SGLT2 inhibitors in T2D | Empagliflozin and placebo | 51 and 51 | 57 and 58 | 75 and 80 |
| Kazemi et al,61 2018 | Canada | 2011 | RCT | 12 | PCOS | Low-glycemic index pulse-based diet and therapeutic lifestyle change diet | 47/31 and 48/30 | 27 and 27 | 0 |
| Keinänen et al,53 2018 | Finland | 2010 | Prospective cohort | 12 | First-episode psychosis | Treated | 95 | 25a | 68 |
| Krishnan et al,25 2018 | US | 2015 | RCT | 2 | BMI of 25-39.9 | 2010 American dietary guidelines diet and typical American diet | 28/22 and 24/22 | 47 and 47 | 0 |
| Lambert et al,79 2018 | Brazil | NR | Retrospective cohort | 12 | BMI >40 or BMI >35 with comorbidity or BMI >30 and T2D | RYGB and BPD | 108 | 44 | 42 |
| Lee et al,38 2018 | Singapore | 2009 | Retrospective cohort | 36 | Prediabetes | Bariatric surgery and control | 44 and 25 | 43 and 50 | 34 and 12 |
| Liang et al,52 2018 | Taiwan | 2008 | Prospective cohort | 60 | WC ≥90, MetS, no diabetes | Low-calorie diet | 40/18 | 46 | 100 |
| Liaskos et al,70 2018 | Greece | NR | nRCT | 6 | BMI >40 and no T2D | SG and RYGB | 43 and 28 | 38 and 38 | 21 and 25 |
| Liu et al,60 2018 | China | 2014 | Retrospective cohort | 12 | T2D and BMI ≥28 | RYGB | 45 | 44 | 100 |
| Madjd et al,33 2018 | Iran | 2014 | RCT | 18 | BMI of 27-40 | Diet beverages and water | 36 and 35 | 32 and 32 | 0 |
| Most et al,41 2018 (CALERIE 2) | US | 2007 | Prospective cohort nested in RCT | 24 | BMI of 22-27.9 plus ≥5% weight loss in CR 25% and <5% weight loss in ad libitum | 25% CR and control | 47/34 and 26/19 |
40 and 39 | 29 and 37 |
| Mraović et al,80 2018 | Serbia | 2014 | RCT | 10 | BMI ≥35 | 20% CR diet, 50% CR diet, and alternating 70% and 30% CR diet | 37, 30, and 30 | 31, 32, and 32 |
0 |
| Munukka et al,71 2018 | Finland | NR | Prospective cohort | 1 | BMI >27.5 with no major comorbidity | American College of Sports Medicine exercise program | 19/17 | 37 | 0 |
| Nicoletto et al,78 2018 | Brazil | 2014 | Prospective cohort | 12 | CKD | Kidney transplantation | 46 | 49 | 59 |
| Nilholm et al,30 2018 | Sweden | 2014 | Prospective cohort | 6 | T2D | Okinawan-based Nordic diet | 30 | 58 | 43 |
| Nishino et al,39 2018 | Japan | 2011 | RCT | 1 | Esophagectomy for esophageal cancer | Daikenchuto (TJ-100) and control | 19 and 20 | 68a and 61a | 89 and 80 |
| Patel et al,57 2018 | United Kingdom | NR | nRCT | 18 | BMI of 30-50 and T2D | Duodenal-jejunal sleeve bypass | 45 | 50 | 49 |
| Rajan-Khan et al,81 2018 | US | 2011 | RCT | 4 | BMI ≥25 | Mindfulness-based stress reduction and health education | 42 and 44 | 47 and 42 | 0 |
| Rubio-Almanza et al,32 2018 | Spain | 2000 | Retrospective cohort | 60 | Prediabetes or T2D and bariatric surgery | Prediabetes and T2D | 57/38 and 48/32 | 48 | 17 |
| Schübel et al,58 2018 (HELENA) | Germany | 2015 | RCT | 12 | BMI of 25-39.9 | 5:2 intermittent CR diet, continuous CR diet, and control | 49, 49, and 52 | 49, 51, and 51 | 51, 51, and 48 |
| Shah et al,65 2018 (EVADE CAD) | US | 2014 | RCT | 2 | Coronary artery disease | Vegan diet and AHA diet | 50 and 50 | 63a and 60a | 86 and 84 |
| Sherf-Dagan et al,31 2018 | Israel | 2014 | RCT | 12 | NAFLD after SG | Probiotic and placebo | 50/40 and 50/40 | 42 and 44 | 40 and 45 |
| Stolberg et al,48 2018 | Denmark | 2012 | RCT | 24 | RYGB | Moderate-intensity physical training and control | 32 and 28 | 43 and 43 | 34 and 25 |
| van Dammen et al,43 2018 | Netherlands | 2009 | RCT | 6 | BMI ≥29 and infertily | Lifestyle intervention and control | 290/289 and 287/285 | 30 and 30 | 0 |
| van Rijn et al,47 2018 | Netherlands | 2014 | Prospective cohort nested in RCT | 12 | BMI of 30-50 and T2D | Duodenal-jejunal bypass liner | 28 | 50a | 39 |
| Wilson et al,50 2018 | South Africa | 2005 | Prospective cohort | 2 | TB symptoms | Treated for TB and control | 295 and 93 | 34a | 56 |
| Witczak et al,63 2018 | United Kingdom | NR | Prospective cohort | 6 | BMI >40 and T2D or IGT | Bariatric surgery | 20 | 51 | 35 |
| Wormgoor et al,75 2018 | New Zealand | 2015 | RCT | 9 | T2D | HIIT and moderate-intensity continuous training | 12/11 and 11 | 52 and 53 | 100 |
| Yang et al,68 2018 | China | 2015 | nRCT | 12 | BMI >35 or ≥30 with a comorbidity | SG and RYGB | 32/10 and 28/10 | 32 and 32 | 50 and 50 |
| Zhang et al,51 2018 | China | 2015 | RCT | 6 | Dyslipidemia | Coenzyme Q10 and placebo | 51 and 50 | 52 and 50 | 28 and 36 |
Abbreviations: AHA, American Heart Association; BMI, body mass index (calculated as weight in kilograms divided by height in meters squared); BPD, biliopancreatic diversion surgery; CKD, chronic kidney disease; CR, calorie restriction; EPA, eicosapentaenoic acid; GB, gastric bypass; HIIT, high-intensity interval training; IGT, intolerance glucose test; MetS, metabolic syndrome; NAFLD, nonalcoholic fatty liver disease; NASH, nonalcoholic steatohepatitis; NR, not reported; nRCT, nonrandomized clinical trial; PCOS, polycystic ovary syndrome; RCT, randomized clinical trial; RYGB, Roux-en-Y gastric bypass; SG, sleeve gastrectomy; SGLT2, sodium-glucose transport protein 2; T1D, type 1 diabetes; T2D, type 2 diabetes; TB, tuberculosis; WC, waist circumference.
Median.
Published online in 2018.
AA, CC, CG, GA, and GG are alleles.
A total of 90% of the studies were in populations with metabolic disease or conditions associated with metabolic disease: obesity,25,32,33,34,37,41,43,45,47,48,49,52,57,58,59,60,62,63,64,67,68,69,70,71,72,73,74,76,77,79,80,81,82,83 diabetes or prediabetes,26,32,38,46,59 hypertension,40 coronary artery disease,65 dyslipidemia,51 chronic kidney disease,78 nonalcoholic fatty liver disease,31,35 Cushing disease,36 polycystic ovary syndrome,61 breast cancer,28,56,82 and aging (ie, college students84). Of the patients in these 54 studies, 22 (41%) had undergone bariatric surgery as the studied intervention (n = 14) or as part of the required eligibility criteria (n = 8). Other populations were subjected to operations or therapies that adversely cause lean mass loss and/or fat mass gain, such as prostate,27,42 esophageal,39 head and neck squamous cell44 cancers, and psychosis,53 or where the disease course itself (ie, tuberculosis) causes lean mass loss and/or fat mass gain.50
The 60 studies included 112 cohorts: 40 cohorts contained participants who had undergone bariatric surgery, 33 cohorts contained participants who were receiving diet therapies (all except 265,84 designed for weight loss or weight maintenance), 16 cohorts contained participants who received a medication or supplement, 7 cohorts contained participants who were following exercise regimens, 14 cohorts contained participants who were followed up for other reasons (ie, prostate cancer,27 kidney transplants,78 gene-associated obesity,34 diabetes vs prediabetes,32 polycystic ovary syndrome,61 and mindfulness intervention81), and 21 cohorts contained control participants (of which 4 cohorts contained participants who received placebo31,35,51,66). The size of the cohorts ranged from 5 to 335 participants (median, 32). The mean ages ranged from 18 to 71 years (median, 47 years). The percentage of men ranged from 0 to 100% (median, 35%).
The mean BMIs of the patients ranged from 23 to 54 (median, 38) (eTable 2 in the Supplement). Similarly, mean weight (median, 94 kg; range, 50-156 kg), fat mass (median, 32 kg; range, 20-47 kg), and percentage of body fat (median, 41%; range, 27%-53%) were high compared with general populations. Mean fasting insulin level (median, 13.53 μIU/mL; range, 4.32-27.79 μIU/mL [to convert to picomoles per liter, multiply by 6.945]), and the homeostatic model assessment index (median, 3.3; range, 0.9-12.9) were also high. Most of the mean CRP levels corresponded to a low-grade inflammation (median, 0.52 mg/dL; interquartile range, 0.21-0.75 mg/dL; range, 0.06-5.62 mg/dL [to convert to milligrams per liter, multiply by 10]). Mean interleukin 6 level ranged from 1.3 to 19.8 pg/mL (median, 3.4 pg/mL) and mean tumor necrosis factor α levels from 3.1 to 19.2 pg/mL (median, 12.4 pg/mL).
Risk of Bias Assessment
Studies were largely rated as low risk for description of the objectives (96.7%), the outcome measures (90.0%), and the results (98.3%) (Figure 2). Approximately half the studies were high risk because they lacked a sample size or power calculation (51.7%), they (in those studies that assigned the interventions) did not take an intention-to-treat approach (47.2%), they had a withdrawal rate greater than 20% or they did not adequately describe their withdrawals (50.0%), or they did not adequately explore the effect of missing data (50.0%). In addition, 38.3% of studies had an industry source of funding.
Figure 2. Risk of Bias Assessment.

Except for 3 items (clear objective, adequate description of measures, and adequate description of results), the assessments indicate several risks of bias.
BMI and Fasting Insulin Level
There were 90 pairs of standardized slopes from 56 cohorts and 35 studies that measured BMI and fasting insulin (Table 2). Most BMI and fasting insulin standardized slopes were negative (81% for BMI and 71% for fasting insulin), meaning that participants in most studies experienced decreases in BMI and insulin. The association between period 1 fasting insulin level and period 2 BMI was positive and significant (β = 0.26; 95% CI, 0.13-0.38; I2 = 79%) (Figure 3), indicating that for every unit of SD change in period 1 insulin, there was an associated change in 0.26 units of SD in period 2 BMI. The association between period 1 BMI and period 2 fasting insulin level was not significant (β = 0.01; 95% CI, –0.08 to 0.10; I2 = 69%) (Figure 3). The heterogeneities were large.
Table 2. Pooled Temporal Associations: Primary Analysisa.
| Dependent (Period 2) | Independent (Period 1) | No. of cohorts | β (95% CI) | I2/τ2 |
|---|---|---|---|---|
| BMI and insulin | ||||
| ΔBMI | ΔInsulin | 90 | 0.26 (0.13 to 0.38) | 79%/0.161 |
| ΔInsulin | ΔBMI | 90 | 0.01 (–0.08 to 0.10) | 69%/0.099 |
| BMI and CRP | ||||
| ΔBMI | ΔCRP | 57 | 0.23 (–0.09 to 0.55) | 83%/0.168 |
| ΔCRP | ΔBMI | 57 | 0.20 (0.04 to 0.36) | 53%/0.048 |
| Insulin and CRP | ||||
| ΔInsulin | ΔCRP | 42 | 0.19 (–0.04 to 0.42) | 49%/0.038 |
| ΔCRP | ΔInsulin | 42 | 0.29 (0.10 to 0.47) | 36%/0.023 |
Abbreviations: BMI, body mass index (calculated as weight in kilograms divided by height in meters squared); CRP, C-reactive protein; Δ, change.
Each row describes one model where change in a measure, specifically a standardized slope, of a later period (period 2) is regressed on a change in a different measure of an earlier period (period 1).
Figure 3. Bubble Plot of Temporal Associations Between Period 1 and Period 2 Changes.
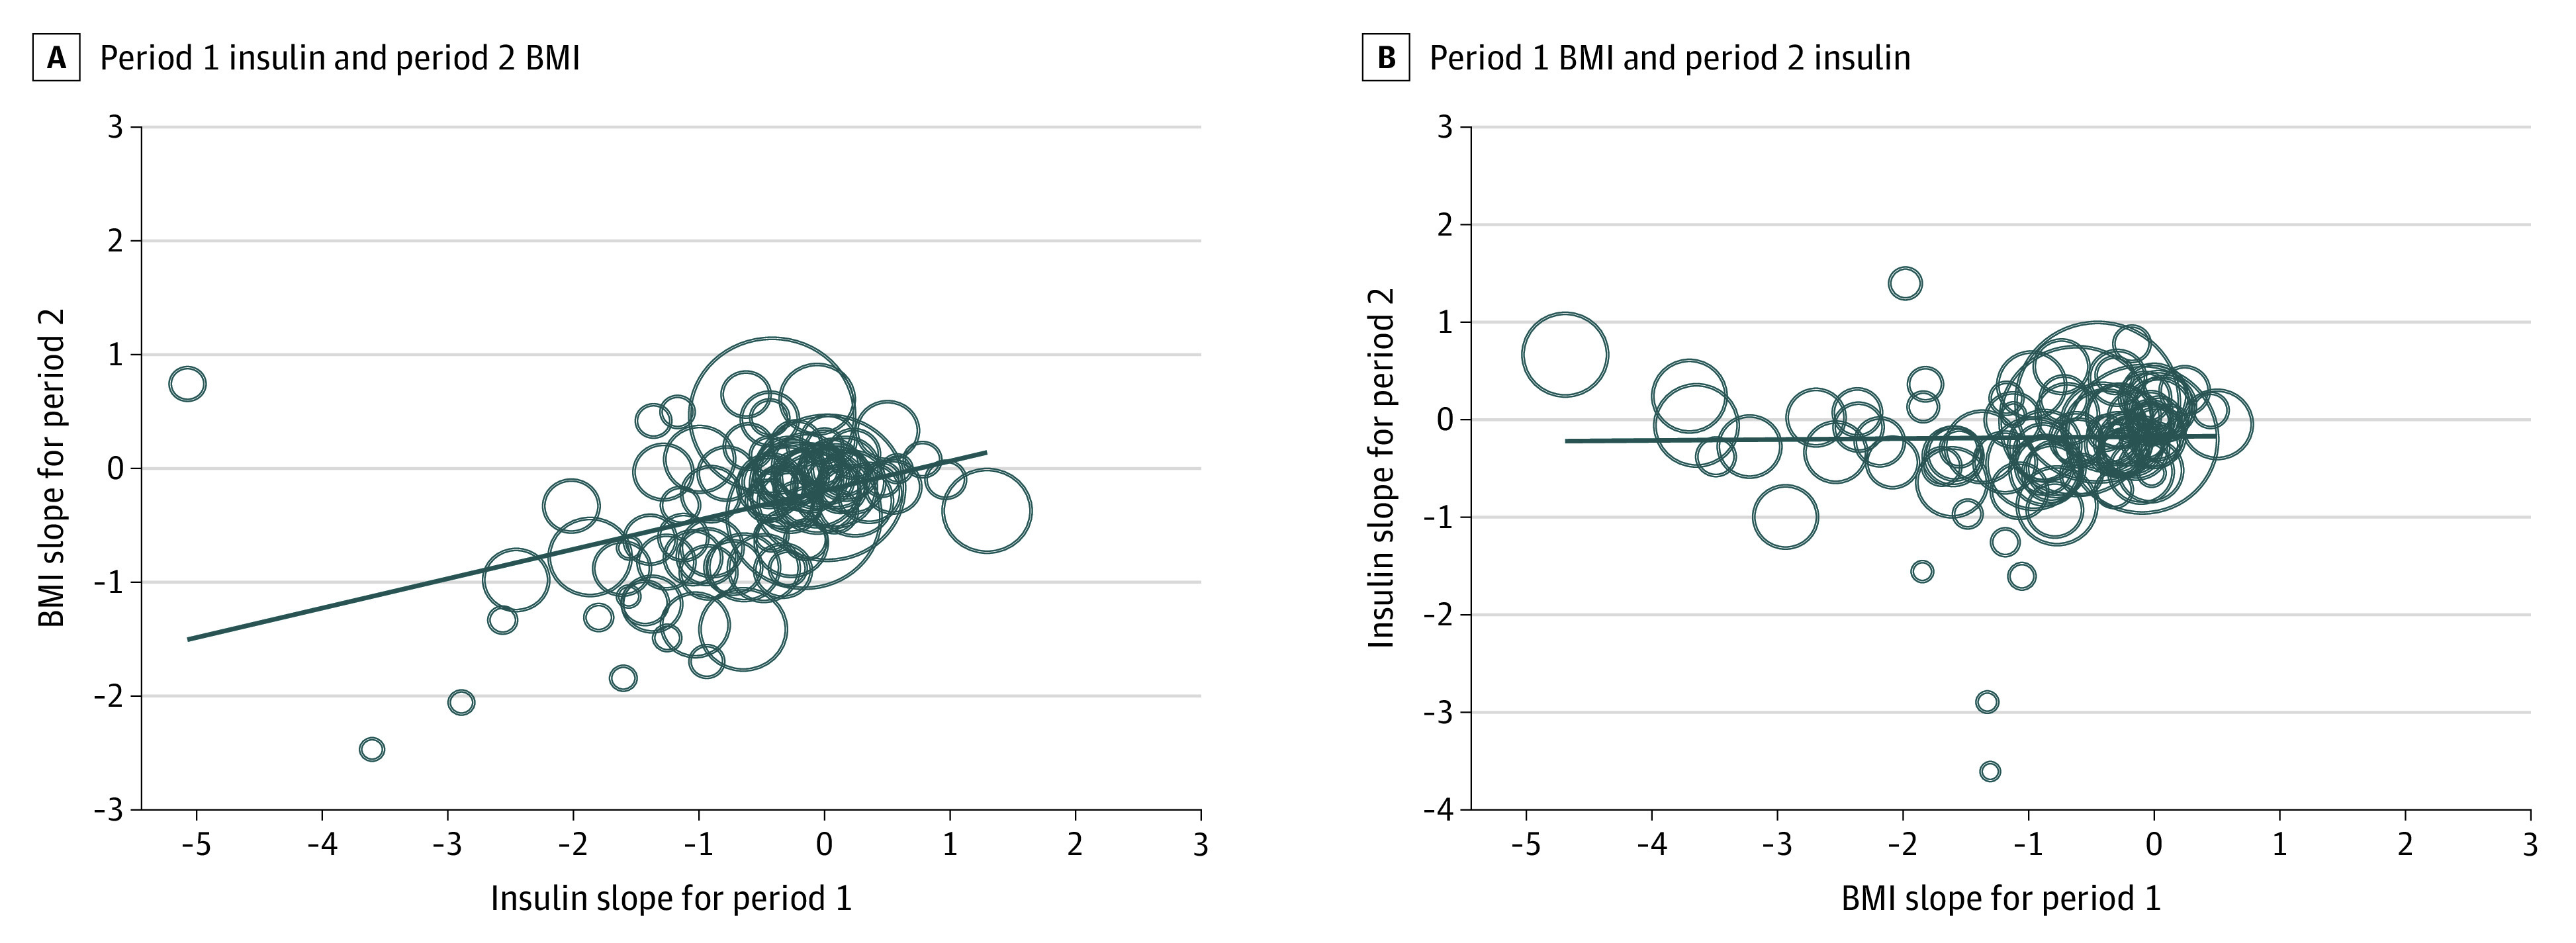
A, Period 2 change in body mass index (BMI) (or standardized slope) is regressed onto period 1 change in insulin. B, Period 2 change in insulin is regressed onto period 1 change in BMI. The flat trend line in panel B suggests no association between period 1 change in BMI and period 2 change in insulin. The diagonal trend line in panel A supports a positive and temporal association between period 1 change in insulin and period 2 change in BMI. The size of the circles is based on the inverse of the SE of each cohort.
The associations between insulin level and BMI increased in magnitude when studies that reported findings at 12 weeks or less were isolated from those that reported findings at greater than 12 weeks (eTable 3 in the Supplement). The magnitude of association between period 1 fasting insulin level and period 2 BMI was greater at 12 weeks or less than at greater than 12 weeks (β = 0.61; 95% CI, 0.38-0.84 vs β = 0.17; 95% CI, 0.05-0.30; I2 = 76%, P = .001). The association between period 1 fasting insulin level and period 2 BMI was present in participants who had undergone bariatric surgery but not in participants who had not undergone bariatric surgery (β = 0.31; 95% CI, 0.19-0.44 vs β = –0.12; 95% CI, –0.41 to 0.18; I2 = 76%, P = .007) (eTable 4 in the Supplement).
BMI and CRP
There were 57 pairs of standardized slopes from 39 cohorts and 22 studies that measured both BMI and CRP levels (Table 2). Most standardized slopes for BMI and CRP were negative (81% for BMI and 68% for CRP), suggesting that participants in most studies experienced decreases in BMI and CRP level. The association between period 1 CRP level and period 2 BMI was not significant (β = 0.23; 95% CI, –0.09 to 0.55; I2 = 83%). The association between period 1 BMI and period 2 CRP level was positive and significant (β = 0.20; 95% CI, 0.04-0.36; I2 = 53%), suggesting that for every unit of SD change in period 1 BMI, there was an associated change of 0.20 units of SD in period 2 CRP level. However, both β coefficients were positive and had similar magnitudes, and the β coefficient for BMI had larger heterogeneity.
The associations between BMI and CRP level increased in magnitude when the studies that reported findings at 12 weeks or less were isolated from those that reported findings at greater than 12 weeks, when period 2 BMI was regressed on period 1 CRP level (eTable 3 in the Supplement). Although not significantly so, the magnitude of the association between period 1 CRP level and period 2 BMI was greater at 12 weeks or less than at greater than 12 weeks (β = 0.72; 95% CI, 0.08-1.37 vs β = 0.14; 95% CI, –0.18 to 0.47; I2 = 81%, P = .09). In addition, the association between period 1 CRP level and period 2 BMI was present in participants who underwent bariatric surgery but not in participants who had not undergone bariatric surgery (β = 0.43; 95% CI, 0.10-0.76 vs β = –0.40; 95% CI, –0.93 to 0.13; I2 = 81%, P = .005) (eTable 4 in the Supplement).
Fasting Insulin and CRP
There were 42 pairs of standardized slopes from 27 cohorts and 16 studies that measured both fasting insulin and CRP levels (Table 2). Most fasting insulin and CRP standardized slopes were negative (74% of fasting insulin slopes and 63% of CRP slopes), suggesting that participants in most studies experienced decreases in insulin and CRP levels. The association between period 1 CRP level and period 2 fasting insulin level was not significant (β = 0.19; 95% CI, –0.04 to 0.42; I2 = 49%). The association between period 1 fasting insulin level and period 2 CRP level was positive and significant (β = 0.29; 95% CI, 0.10-0.47; I2 = 36%), suggesting that for every unit of SD change in period 1 insulin level, there was an associated change of 0.29 units of SD in period 2 CRP level. There was moderate heterogeneity. The subgroups did not significantly modify the associations between fasting insulin and CRP levels (eTables 2 and 3 in the Supplement).
Other Sensitivity Analyses
When we considered related measures of BMI (weight, fat mass, and fat percentage), homeostatic model assessment index, and the other inflammatory markers (ie, interleukin 6 and tumor necrosis factor α), the associations among these variables were similar to those for BMI or could not be calculated (eTable 5 in the Supplement). The results when adjusting for nonindependence when available were similar (eTable 6 in the Supplement)—1 of the 6 models did not converge likely because of overly identified models (too few data for the number of model parameters). When we considered 2 measures as independent variables, the association of period 1 insulin level on period 2 BMI remained significant when the period 1 CRP level remained in the model (β = 0.57; 95% CI, 0.27-0.86 and β = –0.07; 95% CI, –0.42 to 0.29; I2 = 81%) (eTable 7 in the Supplement).
Discussion
This systematic review and meta-analysis suggests that decreases in fasting insulin are more likely to precede decreasing weight than are decreases in weight to precede decreasing levels in fasting insulin. After accounting for the association between preceding levels of fasting insulin and the subsequent likelihood of weight gain, there was no evidence that inflammation preceded subsequent weight gain (eTable 7 in the Supplement). This temporal sequencing (in which changes in fasting insulin precede changes in weight) is not consistent with the assertion that obesity causes NCDs and premature death by increasing levels of fasting insulin.
Support From Other Studies
In patients with type 2 diabetes, RCTs have found that introducing exogenous insulin and sulfonylureas (which increase endogenous insulin production) compared with lower doses or no drug therapy produce increases in weight.85,86 Some patients with type 1 diabetes deliberately omit or reduce their insulin injections to lose weight.87 Similarly, reports after bariatric surgery consistently indicate that insulin levels decrease before weight decreases in patients undergoing bariatric surgery.88 Thus, the finding that changes in insulin levels tend to precede changes in weight rather than the other way around has been previously demonstrated in 3 different scenarios. To our knowledge, there is no clinical evidence demonstrating that weight gain or loss precedes increases or decreases in endogenous insulin.
Importance of the Findings
Obesity as a cause of premature death fails to meet several of the Bradford Hill criteria for causation: the strength of association is small3; the consistency of effect across older and/or ill populations favors obesity4,5,6,7,8,9,10,11,12,13,14,15,16; and the biological gradient is U-shaped, with overweight and obesity level 1 associated with the lowest risk3; and if hyperinsulinemia is to be considered the mediator, then the temporal sequencing is incorrect.
Insulin resistance, a cause and consequence of hyperinsulinemia,89 leads to type 2 diabetes and is associated with other adverse outcomes, such as myocardial infarction, chronic pulmonary disease, and some cancers,90,91 and may also be indicated in diabetic nephropathy.92 Despite the 3 scenarios described earlier, it is commonly believed that obesity leads to hyperinsulinemia.93,94,95 If the converse is true and hyperinsulinemia actually leads to obesity and its putative adverse consequences, then weight loss without concomitant decreases in insulin (eg, liposuction) would not be expected to address these adverse consequences. In addition, weight loss would not address risk in people with so-called metabolically healthy obesity, that is, those without insulin resistance.96
Of interest, insulin resistance is also present in lean individuals, in particular men and individuals of Asian descent.97 These 2 groups are at heightened risk for type 2 diabetes98 and cardiovascular disease, yet are more likely to be lean than women and individuals not of Asian descent. These observations are consistent with the hypothesis that hyperinsulinemia rather than obesity is driving adverse outcomes in this population. We speculate that the capacity to store the byproducts of excess glucose by increasing the size of fat cells (manifested as obesity) might delay the onset of type 2 diabetes and its consequences in some individuals, thus explaining the so-called obesity paradox of lower mortality among people with obesity. This idea, although not new,99 fits better with the emerging evidence. If this speculation is correct, assessing the capacity to store such by-products at the individual level may be a useful step toward personalized medicine.
Although it is possible that hyperinsulinemia per se is not the causal agent that leads to adverse outcomes (but is rather a marker for another more proximate factor), this would not change the lack of support for recommending weight loss among people with obesity. Rather, other markers should be investigated that, although correlated with obesity, are more strongly associated with premature mortality because they also exist in lean individuals. Therapies that lower insulin levels (eg, moderate diets with fewer simple carbohydrates and metformin) may be sustainable if an intermediate marker other than weight is targeted. Because the prevalence of obesity continues to increase worldwide, additional studies to confirm this hypothesis are urgently needed, not least because public health campaigns promoting weight loss are ineffective and lead to stigma100 among those with obesity.
Limitations
This study has limitations. First, the identified studies largely enrolled participants with chronic obesity undergoing weight loss interventions and measures of interest (eg, weight, insulin level, and CRP level) mostly decreased. The findings are limited to those individuals losing weight and, given the findings from the bariatric subgroup analysis, are likely driven by quick decreases in circulating insulin levels (eTable 4 in the Supplement). Second, the included populations mostly had baseline mean CRP levels between 1 and 10 mg/L (eTable 2 in the Supplement), suggesting a low grade of chronic inflammation normally associated with atherosclerosis and insulin resistance. A number of studies90,101,102,103,104 have highlighted a group of people characterized by CRP levels consistently greater than 10 mg/L. Although this higher grade of chronic inflammation is associated with obesity, few participants had insulin resistance, suggesting a distinct grouping.90 Third, this meta-analysis used summary-level rather than individual patient–level data and is therefore vulnerable to the ecologic fallacy. A prospective cohort study designed for weight loss or gain with very frequent measurements in a diverse population would contribute a stronger form of evidence. Fourth, the review was limited to studies published in 2018, and many of the studies indicate a significant risk of bias with respect to their stated goals. However, none of the studies were designed to measure temporal associations between the measures of interest, so these limitations in study conduct would not necessarily have led to bias with respect to the findings. Although the search was limited to a single publication year (2018) to reduce the workload associated with this review, there is no reason to expect that data from this year would differ from data published earlier or later.
Conclusions
The pooled evidence from this meta-analysis suggests that decreases in fasting insulin levels precede weight loss; it does not suggest that weight loss precedes decreases in fasting insulin. This temporal sequencing is not consistent with the assertion that obesity causes NCDs and premature death by increasing levels of fasting insulin. This finding, together with the obesity paradox, suggests that hyperinsulinemia or another proximate factor may cause the adverse consequences currently attributed to obesity. Additional studies to confirm this hypothesis are urgently needed.
eTable 1. Search Strategies
eTable 2. Study Population Characteristics
eTable 3. Pooled Temporal Associations: Subgroup Group Analysis ≤12 vs >12 Weeks
eTable 4. Pooled Temporal Associations: Subgroup Group Analysis Bariatric vs Non-bariatric Patients
eTable 5. Pooled Temporal Associations: Extended Analysis (All Measures)
eTable 6. Pooled Temporal Associations: Sensitivity Analysis Adjusting for Non-independence
eTable 7. Pooled Temporal Associations: Sensitivity Analysis Adjusting for Two Independent Variables
References
- 1.Hill AB. The environment and disease: association or causation? Proc R Soc Med. 1965;58:295-300. doi: 10.1177/003591576505800503 [DOI] [PMC free article] [PubMed] [Google Scholar]
- 2.Fedak KM, Bernal A, Capshaw ZA, Gross S. Applying the Bradford Hill criteria in the 21st century: how data integration has changed causal inference in molecular epidemiology. Emerg Themes Epidemiol. 2015;12:14. doi: 10.1186/s12982-015-0037-4 [DOI] [PMC free article] [PubMed] [Google Scholar]
- 3.Mehta NK, Chang VW. Mortality attributable to obesity among middle-aged adults in the United States. Demography. 2009;46(4):851-872. doi: 10.1353/dem.0.0077 [DOI] [PMC free article] [PubMed] [Google Scholar]
- 4.Hainer V, Aldhoon-Hainerová I. Obesity paradox does exist. Diabetes Care. 2013;36(suppl 2):S276-S281. doi: 10.2337/dcS13-2023 [DOI] [PMC free article] [PubMed] [Google Scholar]
- 5.Niedziela J, Hudzik B, Niedziela N, et al. The obesity paradox in acute coronary syndrome: a meta-analysis. Eur J Epidemiol. 2014;29(11):801-812. doi: 10.1007/s10654-014-9961-9 [DOI] [PMC free article] [PubMed] [Google Scholar]
- 6.Padwal R, McAlister FA, McMurray JJ, et al. ; Meta-analysis Global Group in Chronic Heart Failure (MAGGIC) . The obesity paradox in heart failure patients with preserved versus reduced ejection fraction: a meta-analysis of individual patient data. Int J Obes (Lond). 2014;38(8):1110-1114. doi: 10.1038/ijo.2013.203 [DOI] [PubMed] [Google Scholar]
- 7.Nie W, Zhang Y, Jee SH, Jung KJ, Li B, Xiu Q. Obesity survival paradox in pneumonia: a meta-analysis. BMC Med. 2014;12:61. doi: 10.1186/1741-7015-12-61 [DOI] [PMC free article] [PubMed] [Google Scholar]
- 8.Sun Y, Milne S, Jaw JE, et al. BMI is associated with FEV1 decline in chronic obstructive pulmonary disease: a meta-analysis of clinical trials. Respir Res. 2019;20(1):236. doi: 10.1186/s12931-019-1209-5 [DOI] [PMC free article] [PubMed] [Google Scholar]
- 9.Zhao Y, Li Z, Yang T, Wang M, Xi X. Is body mass index associated with outcomes of mechanically ventilated adult patients in intensive critical units? a systematic review and meta-analysis. PLoS One. 2018;13(6):e0198669. doi: 10.1371/journal.pone.0198669 [DOI] [PMC free article] [PubMed] [Google Scholar]
- 10.Jayedi A, Shab-Bidar S. Nonlinear dose-response association between body mass index and risk of all-cause and cardiovascular mortality in patients with hypertension: a meta-analysis. Obes Res Clin Pract. 2018;12(1):16-28. doi: 10.1016/j.orcp.2018.01.002 [DOI] [PubMed] [Google Scholar]
- 11.Shen N, Fu P, Cui B, Bu CY, Bi JW. Associations between body mass index and the risk of mortality from lung cancer: a dose-response PRISMA-compliant meta-analysis of prospective cohort studies. Medicine (Baltimore). 2017;96(34):e7721. doi: 10.1097/MD.0000000000007721 [DOI] [PMC free article] [PubMed] [Google Scholar]
- 12.Kwon Y, Kim HJ, Park S, Park YG, Cho KH. Body mass index-related mortality in patients with type 2 diabetes and heterogeneity in obesity paradox studies: a dose-response meta-analysis. PLoS One. 2017;12(1):e0168247. doi: 10.1371/journal.pone.0168247 [DOI] [PMC free article] [PubMed] [Google Scholar]
- 13.Schlesinger S, Siegert S, Koch M, et al. Postdiagnosis body mass index and risk of mortality in colorectal cancer survivors: a prospective study and meta-analysis. Cancer Causes Control. 2014;25(10):1407-1418. doi: 10.1007/s10552-014-0435-x [DOI] [PubMed] [Google Scholar]
- 14.Schmidt D, Salahudeen A. The obesity-survival paradox in hemodialysis patients: why do overweight hemodialysis patients live longer? Nutr Clin Pract. 2007;22(1):11-15. doi: 10.1177/011542650702200111 [DOI] [PubMed] [Google Scholar]
- 15.Weiss L, Melchardt T, Habringer S, et al. Increased body mass index is associated with improved overall survival in diffuse large B-cell lymphoma. Ann Oncol. 2014;25(1):171-176. doi: 10.1093/annonc/mdt481 [DOI] [PubMed] [Google Scholar]
- 16.Choi Y, Park B, Jeong BC, et al. Body mass index and survival in patients with renal cell carcinoma: a clinical-based cohort and meta-analysis. Int J Cancer. 2013;132(3):625-634. doi: 10.1002/ijc.27639 [DOI] [PubMed] [Google Scholar]
- 17.Ormazabal V, Nair S, Elfeky O, Aguayo C, Salomon C, Zuñiga FA. Association between insulin resistance and the development of cardiovascular disease. Cardiovasc Diabetol. 2018;17(1):122. doi: 10.1186/s12933-018-0762-4 [DOI] [PMC free article] [PubMed] [Google Scholar]
- 18.Xu H, Carrero JJ. Insulin resistance in chronic kidney disease. Nephrology (Carlton). 2017;22(suppl 4):31-34. doi: 10.1111/nep.13147 [DOI] [PubMed] [Google Scholar]
- 19.Moher D, Liberati A, Tetzlaff J, Altman DG; PRISMA Group . Preferred reporting items for systematic reviews and meta-analyses: the PRISMA statement. PLoS Med. 2009;6(7):e1000097. doi: 10.1371/journal.pmed.1000097 [DOI] [PMC free article] [PubMed] [Google Scholar]
- 20.Stroup DF, Berlin JA, Morton SC, et al. ; Meta-analysis Of Observational Studies in Epidemiology (MOOSE) Group . Meta-analysis Of Observational Studies in Epidemiology: a proposal for reporting. JAMA. 2000;283(15):2008-2012. doi: 10.1001/jama.283.15.2008 [DOI] [PubMed] [Google Scholar]
- 21.Downs SH, Black N. The feasibility of creating a checklist for the assessment of the methodological quality both of randomised and non-randomised studies of health care interventions. J Epidemiol Community Health. 1998;52(6):377-384. doi: 10.1136/jech.52.6.377 [DOI] [PMC free article] [PubMed] [Google Scholar]
- 22.Cho MK, Bero LA. The quality of drug studies published in symposium proceedings. Ann Intern Med. 1996;124(5):485-489. doi: 10.7326/0003-4819-124-5-199603010-00004 [DOI] [PubMed] [Google Scholar]
- 23.Wiebe N, Vandermeer B, Platt RW, Klassen TP, Moher D, Barrowman NJ. A systematic review identifies a lack of standardization in methods for handling missing variance data. J Clin Epidemiol. 2006;59(4):342-353. doi: 10.1016/j.jclinepi.2005.08.017 [DOI] [PubMed] [Google Scholar]
- 24.Borenstein M, Hedges LV, Higgins JPT, et al. Identifying and Quantifying heterogeneity. In: Introduction to Meta-Analysis: Wiley; 2009:123-124. doi: 10.1002/9780470743386 [DOI] [Google Scholar]
- 25.Krishnan S, Adams SH, Allen LH, et al. A randomized controlled-feeding trial based on the Dietary Guidelines for Americans on cardiometabolic health indexes. Am J Clin Nutr. 2018;108(2):266-278. doi: 10.1093/ajcn/nqy113 [DOI] [PubMed] [Google Scholar]
- 26.Fuller NR, Sainsbury A, Caterson ID, et al. Effect of a high-egg diet on cardiometabolic risk factors in people with type 2 diabetes: the Diabetes and Egg (DIABEGG) Studytrandomized weight-loss and follow-up phase. Am J Clin Nutr. 2018;107(6):921-931. doi: 10.1093/ajcn/nqy048 [DOI] [PubMed] [Google Scholar]
- 27.Di Sebastiano KM, Bell KE, Mitchell AS, Quadrilatero J, Dubin JA, Mourtzakis M. Glucose metabolism during the acute prostate cancer treatment trajectory: the influence of age and obesity. Clin Nutr. 2018;37(1):195-203. doi: 10.1016/j.clnu.2016.11.024 [DOI] [PubMed] [Google Scholar]
- 28.de Paulo TRS, Winters-Stone KM, Viezel J, et al. Effects of resistance plus aerobic training on body composition and metabolic markers in older breast cancer survivors undergoing aromatase inhibitor therapy. Exp Gerontol. 2018;111:210-217. doi: 10.1016/j.exger.2018.07.022 [DOI] [PubMed] [Google Scholar]
- 29.Chen K, Zhuo T, Wang J, et al. Saxagliptin upregulates nesfatin-1 secretion and ameliorates insulin resistance and metabolic profiles in type 2 diabetes mellitus. Metab Syndr Relat Disord. 2018;16(7):336-341. doi: 10.1089/met.2018.0010 [DOI] [PubMed] [Google Scholar]
- 30.Nilholm C, Roth B, Höglund P, et al. Dietary intervention with an Okinawan-based Nordic diet in type 2 diabetes renders decreased interleukin-18 concentrations and increased neurofilament light concentrations in plasma. Nutr Res. 2018;60:13-25. doi: 10.1016/j.nutres.2018.08.002 [DOI] [PubMed] [Google Scholar]
- 31.Sherf-Dagan S, Zelber-Sagi S, Zilberman-Schapira G, et al. Probiotics administration following sleeve gastrectomy surgery: a randomized double-blind trial. Int J Obes (Lond). 2018;42(2):147-155. doi: 10.1038/ijo.2017.210 [DOI] [PubMed] [Google Scholar]
- 32.Rubio-Almanza M, Cámara-Gómez R, Hervás-Marín D, Ponce-Marco JL, Merino-Torres JF. Cardiovascular risk reduction over time in patients with diabetes or pre-diabetes undergoing bariatric surgery: data from a single-center retrospective observational study. BMC Endocr Disord. 2018;18(1):90. doi: 10.1186/s12902-018-0317-4 [DOI] [PMC free article] [PubMed] [Google Scholar]
- 33.Madjd A, Taylor MA, Delavari A, Malekzadeh R, Macdonald IA, Farshchi HR. Effects of replacing diet beverages with water on weight loss and weight maintenance: 18-month follow-up, randomized clinical trial. Int J Obes (Lond). 2018;42(4):835-840. doi: 10.1038/ijo.2017.306 [DOI] [PubMed] [Google Scholar]
- 34.de Luis DA, Calvo SG, Pacheco D, Ovalle HF, Aller R. Adiponectin gene variant RS rs266729: relation to lipid profile changes and circulating adiponectin after bariatric surgery. Surg Obes Relat Dis. 2018;14(9):1402-1408. doi: 10.1016/j.soard.2018.06.006 [DOI] [PubMed] [Google Scholar]
- 35.Abdel-Razik A, Mousa N, Shabana W, et al. Rifaximin in nonalcoholic fatty liver disease: hit multiple targets with a single shot. Eur J Gastroenterol Hepatol. 2018;30(10):1237-1246. doi: 10.1097/MEG.0000000000001232 [DOI] [PubMed] [Google Scholar]
- 36.Guarnotta V, Pizzolanti G, Ciresi A, Giordano C. Insulin sensitivity and secretion and adipokine profile in patients with Cushing’s disease treated with pasireotide. J Endocrinol Invest. 2018;41(10):1137-1147. doi: 10.1007/s40618-018-0839-7 [DOI] [PubMed] [Google Scholar]
- 37.Abiad F, Khalife D, Safadi B, et al. The effect of bariatric surgery on inflammatory markers in women with polycystic ovarian syndrome. Diabetes Metab Syndr. 2018;12(6):999-1005. doi: 10.1016/j.dsx.2018.06.013 [DOI] [PubMed] [Google Scholar]
- 38.Lee PC, Tan HC, Pasupathy S, et al. Effectiveness of bariatric surgery in diabetes prevention in high-risk Asian individuals. Singapore Med J. 2018;59(9):472-475. doi: 10.11622/smedj.2018110 [DOI] [PMC free article] [PubMed] [Google Scholar]
- 39.Nishino T, Yoshida T, Goto M, et al. The effects of the herbal medicine Daikenchuto (TJ-100) after esophageal cancer resection, open-label, randomized controlled trial. Esophagus. 2018;15(2):75-82. doi: 10.1007/s10388-017-0601-9 [DOI] [PMC free article] [PubMed] [Google Scholar]
- 40.Derosa G, Gaudio G, Pasini G, D’Angelo A, Maffioli P. A randomized, double-blind clinical trial of canrenone vs hydrochlorothiazide in addition to angiotensin II receptor blockers in hypertensive type 2 diabetic patients. Drug Des Dev Ther. 2018;12:2611-2616. doi: 10.2147/DDDT.S151449 [DOI] [PMC free article] [PubMed] [Google Scholar]
- 41.Most J, Gilmore LA, Smith SR, Han H, Ravussin E, Redman LM. Significant improvement in cardiometabolic health in healthy nonobese individuals during caloric restriction-induced weight loss and weight loss maintenance. Am J Physiol Endocrinol Metab. 2018;314(4):E396-E405. doi: 10.1152/ajpendo.00261.2017 [DOI] [PMC free article] [PubMed] [Google Scholar]
- 42.Cheung AS, Tinson AJ, Milevski SV, Hoermann R, Zajac JD, Grossmann M. Persisting adverse body composition changes 2 years after cessation of androgen deprivation therapy for localised prostate cancer. Eur J Endocrinol. 2018;179(1):21-29. doi: 10.1530/EJE-18-0117 [DOI] [PubMed] [Google Scholar]
- 43.van Dammen L, Wekker V, van Oers AM, et al. ; LIFEstyle study group . Effect of a lifestyle intervention in obese infertile women on cardiometabolic health and quality of life: a randomized controlled trial. PLoS One. 2018;13(1):e0190662. doi: 10.1371/journal.pone.0190662 [DOI] [PMC free article] [PubMed] [Google Scholar]
- 44.Hanai N, Terada H, Hirakawa H, et al. Prospective randomized investigation implementing immunonutritional therapy using a nutritional supplement with a high blend ratio of ω-3 fatty acids during the perioperative period for head and neck carcinomas. Jpn J Clin Oncol. 2018;48(4):356-361. doi: 10.1093/jjco/hyy008 [DOI] [PubMed] [Google Scholar]
- 45.Hady HR, Olszewska M, Czerniawski M, et al. Different surgical approaches in laparoscopic sleeve gastrectomy and their influence on metabolic syndrome: a retrospective study. Medicine (Baltimore). 2018;97(4):e9699. doi: 10.1097/MD.0000000000009699 [DOI] [PMC free article] [PubMed] [Google Scholar]
- 46.Bulatova N, Kasabri V, Qotineh A, et al. Effect of metformin combined with lifestyle modification versus lifestyle modification alone on proinflammatory-oxidative status in drug-naïve pre-diabetic and diabetic patients: a randomized controlled study. Diabetes Metab Syndr. 2018;12(3):257-267. doi: 10.1016/j.dsx.2017.11.003 [DOI] [PubMed] [Google Scholar]
- 47.van Rijn S, Betzel B, de Jonge C, et al. The effect of 6 and 12 months duodenal-jejunal bypass liner treatment on obesity and type 2 diabetes: a crossover cohort study. Obes Surg. 2018;28(5):1255-1262. doi: 10.1007/s11695-017-2997-7 [DOI] [PMC free article] [PubMed] [Google Scholar]
- 48.Stolberg CR, Mundbjerg LH, Funch-Jensen P, Gram B, Bladbjerg EM, Juhl CB. Effects of gastric bypass surgery followed by supervised physical training on inflammation and endothelial function: a randomized controlled trial. Atherosclerosis. 2018;273:37-44. doi: 10.1016/j.atherosclerosis.2018.04.002 [DOI] [PubMed] [Google Scholar]
- 49.de Luis DA, Izaola O, Primo D, et al. Biochemical, anthropometric and lifestyle factors related with weight maintenance after weight loss secondary to a hypocaloric mediterranean diet. Ann Nutr Metab. 2017;71(3-4):217-223. doi: 10.1159/000484446 [DOI] [PubMed] [Google Scholar]
- 50.Wilson D, Moosa MS, Cohen T, Cudahy P, Aldous C, Maartens G. Evaluation of tuberculosis treatment response with serial C-reactive protein measurements. Open Forum Infect Dis. 2018;5(11):ofy253. doi: 10.1093/ofid/ofy253 [DOI] [PMC free article] [PubMed] [Google Scholar]
- 51.Zhang P, Yang C, Guo H, et al. Treatment of coenzyme Q10 for 24 weeks improves lipid and glycemic profile in dyslipidemic individuals. J Clin Lipidol. 2018;12(2):417-427.e5. doi: 10.1016/j.jacl.2017.12.006 [DOI] [PubMed] [Google Scholar]
- 52.Liang KW, Lee WJ, Lee IT, et al. Regaining body weight after weight reduction further increases pulse wave velocity in obese men with metabolic syndrome. Medicine (Baltimore). 2018;97(40):e12730 doi: 10.1097/MD.0000000000012730 [DOI] [PMC free article] [PubMed] [Google Scholar]
- 53.Keinänen J, Suvisaari J, Reinikainen J, et al. Low-grade inflammation in first-episode psychosis is determined by increased waist circumference. Psychiatry Res. 2018;270:547-553. doi: 10.1016/j.psychres.2018.10.022 [DOI] [PubMed] [Google Scholar]
- 54.Fortin A, Rabasa-Lhoret R, Lemieux S, Labonté ME, Gingras V. Comparison of a Mediterranean to a low-fat diet intervention in adults with type 1 diabetes and metabolic syndrome: a 6-month randomized trial. Nutr Metab Cardiovasc Dis. 2018;28(12):1275-1284. doi: 10.1016/j.numecd.2018.08.005 [DOI] [PubMed] [Google Scholar]
- 55.Asle Mohammadi Zadeh M, Kargarfard M, Marandi SM, Habibi A. Diets along with interval training regimes improves inflammatory and anti-inflammatory condition in obesity with type 2 diabetes subjects. J Diabetes Metab Disord. 2018;17(2):253-267. doi: 10.1007/s40200-018-0368-0 [DOI] [PMC free article] [PubMed] [Google Scholar]
- 56.Gadéa E, Thivat E, Dubray-Longeras P, et al. Prospective study on body composition, energy balance and biological factors changes in post-menopausal women with breast cancer receiving adjuvant chemotherapy including taxanes. Nutr Cancer. 2018;70(7):997-1006. doi: 10.1080/01635581.2018.1502330 [DOI] [PubMed] [Google Scholar]
- 57.Patel N, Mohanaruban A, Ashrafian H, et al. Endobarrier: a safe and effective novel treatment for obesity and type 2 diabetes? Obes Surg. 2018;28(7):1980-1989. doi: 10.1007/s11695-018-3123-1 [DOI] [PMC free article] [PubMed] [Google Scholar]
- 58.Schübel R, Nattenmüller J, Sookthai D, et al. Effects of intermittent and continuous calorie restriction on body weight and metabolism over 50 wk: a randomized controlled trial. Am J Clin Nutr. 2018;108(5):933-945. doi: 10.1093/ajcn/nqy196 [DOI] [PMC free article] [PubMed] [Google Scholar]
- 59.Drummen M, Dorenbos E, Vreugdenhil ACE, et al. Long-term effects of increased protein intake after weight loss on intrahepatic lipid content and implications for insulin sensitivity: a PREVIEW study. Am J Physiol Endocrinol Metab. 2018;315(5):E885-E891. doi: 10.1152/ajpendo.00162.2018 [DOI] [PubMed] [Google Scholar]
- 60.Liu F, Tu Y, Zhang P, Bao Y, Han J, Jia W. Decreased visceral fat area correlates with improved total testosterone levels after Roux-en-Y gastric bypass in obese Chinese males with type 2 diabetes: a 12-month follow-up. Surg Obes Relat Dis. 2018;14(4):462-468. doi: 10.1016/j.soard.2017.11.009 [DOI] [PubMed] [Google Scholar]
- 61.Kazemi M, McBreairty LE, Chizen DR, Pierson RA, Chilibeck PD, Zello GA. A comparison of a pulse-based diet and the therapeutic lifestyle changes diet in combination with exercise and health counselling on the cardio-metabolic risk profile in women with polycystic ovary syndrome: a randomized controlled trial. Nutrients. 2018;10(10):E1387. doi: 10.3390/nu10101387 [DOI] [PMC free article] [PubMed] [Google Scholar]
- 62.Galbreath M, Campbell B, LaBounty P, et al. Effects of adherence to a higher protein diet on weight loss, markers of health, and functional capacity in older women participating in a resistance-based exercise program. Nutrients. 2018;10(8):E1070. doi: 10.3390/nu10081070 [DOI] [PMC free article] [PubMed] [Google Scholar]
- 63.Witczak JK, Min T, Prior SL, Stephens JW, James PE, Rees A. Bariatric surgery is accompanied by changes in extracellular vesicle-associated and plasma fatty acid binding protein 4. Obes Surg. 2018;28(3):767-774. doi: 10.1007/s11695-017-2879-z [DOI] [PubMed] [Google Scholar]
- 64.de Luis DA, Pacheco D, Izaola O, Primo D, Aller R. The association of the rs670 variant of APOA1 gene with insulin resistance and lipid profile in morbid obese patients after a biliopancreatic diversion surgery. Eur Rev Med Pharmacol Sci. 2018;22(23):8472-8479. [DOI] [PubMed] [Google Scholar]
- 65.Shah B, Newman JD, Woolf K, et al. Anti-inflammatory effects of a vegan diet versus the American Heart Association-recommended diet in coronary artery disease trial. J Am Heart Assoc. 2018;7(23):e011367. doi: 10.1161/JAHA.118.011367 [DOI] [PMC free article] [PubMed] [Google Scholar]
- 66.Hattori S. Anti-inflammatory effects of empagliflozin in patients with type 2 diabetes and insulin resistance. Diabetol Metab Syndr. 2018;10:93. doi: 10.1186/s13098-018-0395-5 [DOI] [PMC free article] [PubMed] [Google Scholar]
- 67.Carbone F, Adami G, Liberale L, et al. Serum levels of osteopontin predict diabetes remission after bariatric surgery. Diabetes Metab. 2019;45(4):356-362. doi: 10.1016/j.diabet.2018.09.007 [DOI] [PubMed] [Google Scholar]
- 68.Yang J, Gao Z, Williams DB, et al. Effect of laparoscopic Roux-en-Y gastric bypass versus laparoscopic sleeve gastrectomy on fasting gastrointestinal and pancreatic peptide hormones: a prospective nonrandomized trial. Surg Obes Relat Dis. 2018;14(10):1521-1529. doi: 10.1016/j.soard.2018.06.003 [DOI] [PubMed] [Google Scholar]
- 69.Esquivel CM, Garcia M, Armando L, Ortiz G, Lascano FM, Foscarini JM. Laparoscopic sleeve gastrectomy resolves NAFLD: another formal indication for bariatric surgery? Obes Surg. 2018;28(12):4022-4033. doi: 10.1007/s11695-018-3466-7 [DOI] [PubMed] [Google Scholar]
- 70.Liaskos C, Koliaki C, Alexiadou K, et al. Roux-en-Y gastric bypass is more effective than sleeve gastrectomy in improving postprandial glycaemia and lipaemia in non-diabetic morbidly obese patients: a short-term follow-up analysis. Obes Surg. 2018;28(12):3997-4005. doi: 10.1007/s11695-018-3454-y [DOI] [PubMed] [Google Scholar]
- 71.Munukka E, Ahtiainen JP, Puigbó P, et al. Six-week endurance exercise alters gut metagenome that is not reflected in systemic metabolism in over-weight women. Front Microbiol. 2018;9(2323):2323. doi: 10.3389/fmicb.2018.02323 [DOI] [PMC free article] [PubMed] [Google Scholar]
- 72.Arnold K, Weinhold KR, Andridge R, Johnson K, Orchard TS. Improving diet quality is associated with decreased inflammation: findings from a pilot intervention in postmenopausal women with obesity. J Acad Nutr Diet. 2018;118(11):2135-2143. doi: 10.1016/j.jand.2018.05.014 [DOI] [PubMed] [Google Scholar]
- 73.Chiappetta S, Schaack HM, Wölnerhannsen B, Stier C, Squillante S, Weiner RA. The impact of obesity and metabolic surgery on chronic inflammation. Obes Surg. 2018;28(10):3028-3040. doi: 10.1007/s11695-018-3320-y [DOI] [PubMed] [Google Scholar]
- 74.Dardzińska JA, Kaska Ł, Proczko-Stepaniak M, Szymańska-Gnacińska M, Aleksandrowicz-Wrona E, Małgorzewicz S. Fasting and postprandial acyl and desacyl ghrelin and the acyl/desacyl ratio in obese patients before and after different types of bariatric surgery. Wideochir Inne Tech Maloinwazyjne. 2018;13(3):366-375. doi: 10.5114/wiitm.2018.75868 [DOI] [PMC free article] [PubMed] [Google Scholar]
- 75.Wormgoor SG, Dalleck LC, Zinn C, Borotkanics R, Harris NK. High-intensity interval training is equivalent to moderate-intensity continuous training for short- and medium-term outcomes of glucose control, cardiometabolic risk, and microvascular complication markers in men with type 2 diabetes. Front Endocrinol (Lausanne). 2018;9(Aug):475. doi: 10.3389/fendo.2018.00475 [DOI] [PMC free article] [PubMed] [Google Scholar]
- 76.Demerdash HM, Sabry AA, Arida EA. Role of serotonin hormone in weight regain after sleeve gastrectomy. Scand J Clin Lab Invest. 2018;78(1-2):68-73. doi: 10.1080/00365513.2017.1413714 [DOI] [PubMed] [Google Scholar]
- 77.Goday A, Castañer O, Benaiges D, et al. Can Helicobacter pylori eradication treatment modify the metabolic response to bariatric surgery? Obes Surg. 2018;28(8):2386-2395. doi: 10.1007/s11695-018-3170-7 [DOI] [PubMed] [Google Scholar]
- 78.Nicoletto BB, Pedrollo EF, Carpes LS, et al. Progranulin serum levels in human kidney transplant recipients: a longitudinal study. PLoS One. 2018;13(3):e0192959. doi: 10.1371/journal.pone.0192959 [DOI] [PMC free article] [PubMed] [Google Scholar]
- 79.Lambert G, Lima MMO, Felici AC, et al. Early regression of carotid intima-media thickness after bariatric surgery and its relation to serum leptin reduction. Obes Surg. 2018;28(1):226-233. doi: 10.1007/s11695-017-2839-7 [DOI] [PubMed] [Google Scholar]
- 80.Mraović T, Radakovic S, Medic DR, et al. The effects of different caloric restriction diets on anthropometric and cardiometabolic risk factors in overweight and obese females. Vojnosanitetski Pregled. 2018;75(1):30-38. doi: 10.2298/VSP160408206M [DOI] [Google Scholar]
- 81.Rajan-Kahn N, Agito K, Shah J, et al. Mindfulness-based stress reduction in women with overweight or obesity: a randomized clinical trial. Obesity. 2017;25:1349-1359. doi: 10.1002/oby.21910 [DOI] [PMC free article] [PubMed] [Google Scholar]
- 82.Arikawa AY, Kaufman BC, Raatz SK, Kurzer MS. Effects of a parallel-arm randomized controlled weight loss pilot study on biological and psychosocial parameters of overweight and obese breast cancer survivors. Pilot Feasibility Stud. 2018;4(1):17. doi: 10.1186/s40814-017-0160-9 [DOI] [PMC free article] [PubMed] [Google Scholar]
- 83.Baltieri L, Cazzo E, de Souza AL, et al. Influence of weight loss on pulmonary function and levels of adipokines among asthmatic individuals with obesity: one-year follow-up. Respir Med. 2018;145:48-56. doi: 10.1016/j.rmed.2018.10.017 [DOI] [PubMed] [Google Scholar]
- 84.Dhillon J, Thorwald M, De La Cruz N, et al. Glucoregulatory and cardiometabolic profiles of almond vs. cracker snacking for 8 weeks in young adults: a randomized controlled trial. Nutrients. 2018;10(8):E960. doi: 10.3390/nu10080960 [DOI] [PMC free article] [PubMed] [Google Scholar]
- 85.Holman RR, Thorne KI, Farmer AJ, et al. ; 4-T Study Group . Addition of biphasic, prandial, or basal insulin to oral therapy in type 2 diabetes. N Engl J Med. 2007;357(17):1716-1730. doi: 10.1056/NEJMoa075392 [DOI] [PubMed] [Google Scholar]
- 86.UK Prospective Diabetes Study (UKPDS) Group . Intensive blood-glucose control with sulphonylureas or insulin compared with conventional treatment and risk of complications in patients with type 2 diabetes (UKPDS 33). Lancet. 1998;352(9131):837-853. doi: 10.1016/S0140-6736(98)07019-6 [DOI] [PubMed] [Google Scholar]
- 87.Diabetes UK. Our position statement on diabulimia. 2017. Accessed September 29, 2020. https://www.diabetes.org.uk/resources-s3/2017-10/Diabulimia%20Position%20statement%20Mar%202017.pdf
- 88.Abbasi J. Unveiling the “magic” of diabetes remission after weight-loss surgery. JAMA. 2017;317(6):571-574. doi: 10.1001/jama.2017.0020 [DOI] [PubMed] [Google Scholar]
- 89.Erion KA, Corkey BE. Hyperinsulinemia: a cause of obesity? Curr Obes Rep. 2017;6(2):178-186. doi: 10.1007/s13679-017-0261-z [DOI] [PMC free article] [PubMed] [Google Scholar]
- 90.Wiebe N, Stenvinkel P, Tonelli M. Associations of chronic inflammation, insulin resistance, and severe obesity with mortality, myocardial infarction, cancer, and chronic pulmonary disease. JAMA Netw Open. 2019;2(8):e1910456. doi: 10.1001/jamanetworkopen.2019.10456 [DOI] [PMC free article] [PubMed] [Google Scholar]
- 91.Crofts CAP, Zinn C, Wheldon MC, et al. Hyperinsulinemia: a unifying theory of chronic disease? Diabesity. 2015;1(4):34-43. doi: 10.15562/diabesity.2015.19 [DOI] [Google Scholar]
- 92.Gurley SB, Coffman TM. An IRKO in the Podo: impaired insulin signaling in podocytes and the pathogenesis of diabetic nephropathy. Cell Metab. 2010;12(4):311-312. doi: 10.1016/j.cmet.2010.09.007 [DOI] [PubMed] [Google Scholar]
- 93.Shulman GI. Ectopic fat in insulin resistance, dyslipidemia, and cardiometabolic disease. N Engl J Med. 2014;371(12):1131-1141. doi: 10.1056/NEJMra1011035 [DOI] [PubMed] [Google Scholar]
- 94.Samuel VT, Petersen KF, Shulman GI. Lipid-induced insulin resistance: unravelling the mechanism. Lancet. 2010;375(9733):2267-2277. doi: 10.1016/S0140-6736(10)60408-4 [DOI] [PMC free article] [PubMed] [Google Scholar]
- 95.Neeland IJ, Turer AT, Ayers CR, et al. Dysfunctional adiposity and the risk of prediabetes and type 2 diabetes in obese adults. JAMA. 2012;308(11):1150-1159. doi: 10.1001/2012.jama.11132 [DOI] [PMC free article] [PubMed] [Google Scholar]
- 96.Hinnouho GM, Czernichow S, Dugravot A, Batty GD, Kivimaki M, Singh-Manoux A. Metabolically healthy obesity and risk of mortality: does the definition of metabolic health matter? Diabetes Care. 2013;36(8):2294-2300. doi: 10.2337/dc12-1654 [DOI] [PMC free article] [PubMed] [Google Scholar]
- 97.Pandit K, Mukhopadhyay P, Chatterjee P, Majhi B, Chowdhury S, Ghosh S. Assessment of insulin resistance indices in individuals with lean and obese metabolic syndrome compared to normal individuals: a population based study. J Assoc Physicians India. 2020;68(10):29-33. [PubMed] [Google Scholar]
- 98.Public Health Agency of Canada . The Canadian Diabetes Risk Questionnaire. 2011. Accessed October 6, 2020. https://health.canada.ca/apps/canrisk-standalone/pdf/canrisk-en.pdf
- 99.von Noorden KH. Diabetes mellitus. In: Clinical Treatises on the Pathology and Therapy of Disorders of Metabolism and Nutrition. Vol XII. John Wright & Co. 1905:1904-1910. [Google Scholar]
- 100.Freeman L. A matter of justice: “fat” is not necessarily a bad word. Hastings Cent Rep. 2020;50(5):11-16. [DOI] [PubMed] [Google Scholar]
- 101.Aronson D, Bartha P, Zinder O, et al. Obesity is the major determinant of elevated C-reactive protein in subjects with the metabolic syndrome. Int J Obes Relat Metab Disord. 2004;28(5):674-679. doi: 10.1038/sj.ijo.0802609 [DOI] [PubMed] [Google Scholar]
- 102.Dhingra R, Gona P, Nam BH, et al. C-reactive protein, inflammatory conditions, and cardiovascular disease risk. Am J Med. 2007;120(12):1054-1062. doi: 10.1016/j.amjmed.2007.08.037 [DOI] [PMC free article] [PubMed] [Google Scholar]
- 103.Ishii S, Karlamangla AS, Bote M, et al. Gender, obesity and repeated elevation of C-reactive protein: data from the CARDIA cohort. PLoS One. 2012;7(4):e36062. doi: 10.1371/journal.pone.0036062 [DOI] [PMC free article] [PubMed] [Google Scholar]
- 104.Paepegaey AC, Genser L, Bouillot JL, Oppert JM, Clément K, Poitou C. High levels of CRP in morbid obesity: the central role of adipose tissue and lessons for clinical practice before and after bariatric surgery. Surg Obes Relat Dis. 2015;11(1):148-154. doi: 10.1016/j.soard.2014.06.010 [DOI] [PubMed] [Google Scholar]
Associated Data
This section collects any data citations, data availability statements, or supplementary materials included in this article.
Supplementary Materials
eTable 1. Search Strategies
eTable 2. Study Population Characteristics
eTable 3. Pooled Temporal Associations: Subgroup Group Analysis ≤12 vs >12 Weeks
eTable 4. Pooled Temporal Associations: Subgroup Group Analysis Bariatric vs Non-bariatric Patients
eTable 5. Pooled Temporal Associations: Extended Analysis (All Measures)
eTable 6. Pooled Temporal Associations: Sensitivity Analysis Adjusting for Non-independence
eTable 7. Pooled Temporal Associations: Sensitivity Analysis Adjusting for Two Independent Variables