

Abstract
Background
The prognostic importance of abdominal aortic calcification (AAC) viewed on noninvasive imaging modalities remains uncertain.
Methods and Results
We searched electronic databases (MEDLINE and Embase) until March 2018. Multiple reviewers identified prospective studies reporting AAC and incident cardiovascular events or all‐cause mortality. Two independent reviewers assessed eligibility and risk of bias and extracted data. Summary risk ratios (RRs) were estimated using random‐effects models comparing the higher AAC groups combined (any or more advanced AAC) to the lowest reported AAC group. We identified 52 studies (46 cohorts, 36 092 participants); only studies of patients with chronic kidney disease (57%) and the general older‐elderly (median, 68 years; range, 60–80 years) populations (26%) had sufficient data to meta‐analyze. People with any or more advanced AAC had higher risk of cardiovascular events (RR, 1.83; 95% CI, 1.40–2.39), fatal cardiovascular events (RR, 1.85; 95% CI, 1.44–2.39), and all‐cause mortality (RR, 1.98; 95% CI, 1.55–2.53). Patients with chronic kidney disease with any or more advanced AAC had a higher risk of cardiovascular events (RR, 3.47; 95% CI, 2.21–5.45), fatal cardiovascular events (RR, 3.68; 95% CI, 2.32–5.84), and all‐cause mortality (RR, 2.40; 95% CI, 1.95–2.97).
Conclusions
Higher‐risk populations, such as the elderly and those with chronic kidney disease with AAC have substantially greater risk of future cardiovascular events and poorer prognosis. Providing information on AAC may help clinicians understand and manage patients' cardiovascular risk better.
Keywords: abdominal aortic calcification, all‐cause mortality, cardiovascular events and deaths, chronic kidney disease, general population
Subject Categories: Imaging, Vascular Disease, Cardiovascular Disease, Epidemiology
Nonstandard Abbreviations and Acronyms
- AAC
abdominal aortic calcification
- ARD
absolute risk difference
- sROC
summary receiver operator characteristic
Clinical Perspective
What Is New?
We demonstrate that the presence and severity of abdominal aortic calcification detected using any imaging modality is an underappreciated measure of structural vascular disease that identifies people with substantially higher risk of clinical cardiovascular events and poorer long‐term prognosis.
What Are the Clinical Implications?
Fortuitous findings of abdominal aortic calcification in patients with no known disease or information on cardiovascular risk factors, should be considered to be an indication for diagnostic testing such as lipid assays, ECG, or further diagnostic imaging (ie, coronary artery calcification scores).
The presence of coronary artery calcification, an established marker of subclinical atherosclerosis, has been shown to predict future risk of cardiovascular events and mortality. 1 Calcifications in other extracoronary vascular beds such as the carotid, iliac, and abdominal aorta are also common, but fewer studies have investigated the prognostic importance of these calcified vascular lesions. Vascular calcification at these sites is often observed in high‐risk patients such as those with advanced age, diabetes mellitus, advanced atherosclerosis, or chronic kidney disease (CKD). A number of noninvasive, safe, and widely available modalities can be used to assess vascular calcification at these sites, particularly of the abdominal aorta. 2
The abdominal aorta is one of the first vascular beds where atherosclerotic calcification is observed, often preceding the development of coronary artery calcification. 3 , 4 Population‐based studies have found abdominal aortic calcification (AAC) occurs in ≈1 in 3 people aged 45 to 54 years and up to 9 in 10 people aged over 75 years. 5 For older patients with type 2 diabetes mellitus or CKD requiring dialysis, the prevalence ranges between 84% and 97%. 6 , 7 , 8 AAC can be assessed by computed tomography (CT) or lateral spine images from standard radiographs or dual‐energy x‐ray absorptiometry (DXA) machines. Associations between AAC and cardiovascular events were reported in a wide range of clinical settings such as middle‐aged to older men and women from the general population, 9 , 10 , 11 individuals with type 2 diabetes mellitus, 12 and patients with CKD. 6 Some, but not all, reports have suggested that the magnitude of risk for cardiovascular events, fatal cardiovascular events, and all‐cause mortality depends on the amount of AAC visible on imaging tests, with the greatest risk found in patients with the most advanced calcification. 9 , 13 , 14
However, these studies are relatively small and report on a limited number of clinically meaningful outcomes. To date, most systematic reviews and meta‐analyses have focused on a single clinical population, 15 , 16 and few attempts have been made to summarize and integrate data from all published studies to identify clinically important differences among studies, identify subsets of patients where AAC is more or less clinically important, and identify areas where more research is needed. As such, we undertook this systematic review and meta‐analysis.
We hypothesized that people with AAC would have a greater risk of cardiovascular events, fatal cardiovascular events, and poorer prognosis. Additionally, we sought to determine the strength of this association and whether this varied across different clinical settings using different imaging modalities and in populations with varying comorbid factors such as older age, sex, diabetes mellitus, smoking, hypertension, and dyslipidemia.
Methods
This systematic review and meta‐analysis was written and reported in adherence to the Meta‐analysis of Observational Studies in Epidemiology 17 reporting criteria. All data relevant to this study are available from the corresponding author upon reasonable request.
Inclusion and Exclusion Criteria
We included any cohort or case‐control study that reported the association between AAC and any cardiovascular outcomes such as coronary heart disease, cerebrovascular disease, heart failure, peripheral arterial disease and the like, or all‐cause mortality. We excluded cross‐sectional studies and reviews of existing literature.
Search Strategy and Process for Selecting Studies
A comprehensive literature search within MEDLINE and Embase databases was conducted to source all possibly relevant studies for review, without language restriction, until March 2018. Conference proceedings and abstracts were evaluated, and a hand search of reference lists was undertaken. The search terms were combined with the Boolean “AND” to find all potentially relevant studies. When >1 publication for a study was retrieved, articles with the most up‐to‐date and complete information were included, although additional unique data from all sources were considered and included when relevant. Examples of the search strategy are shown in Table S1. At least 2 investigators independently retrieved and assessed citations for eligibility, assessed the risk of bias, and extracted the data (K.L., P.S., H.S., or M.S.), and another investigator was sought when agreement could not be reached (J.R.L.).
Risk of Bias and Level of Evidence Assessment
The risk of bias was assessed using the Newcastle‐Ottawa Scale for case‐control and cohort studies and included the following domains: representativeness of the exposed population, appropriate selection and comparison of the study groups, adequate ascertainment of exposure, and whether the comparability of the cohorts was evaluated appropriately with detailed assessment of all outcomes within an appropriate follow‐up time. At least 2 investigators independently assessed risk of bias (K.L., M.S., H.S., or J.R.L.). Summary estimates of the confidence placed on the evidence were evaluated using the Grading of Recommendations Assessment Development and Evaluation of evidence about prognosis. Unlike Grading of Recommendations Assessment Development and Evaluation for clinical practice guidelines where observational evidence starts at low‐quality evidence and can then be rated up or down, the Grading of Recommendations Assessment Development and Evaluation for evidence about prognosis for observational studies starts with high‐quality evidence. These criteria are based on (1) 5 domains diminishing confidence (−1 for risk of bias, inconsistency, imprecision, indirectness, and publication bias) and (2) 2 situations increasing confidence (+1 or +2 for large–very large effect size and a +1 for a dose‐response gradient [increasing pooled relative risks for cardiovascular events and all‐cause mortality with increasing severity of AAC]). 18 Details of how the Grading of Recommendations Assessment Development and Evaluation assessments were performed are provided in Tables S2 and S3.
AAC Reporting
AAC was reported either quantitatively (computed tomography) or semiquantitatively (x‐ray and DXA). We used the group with the lowest reported AAC as the referent and combined all other reported groups (any or more advanced AAC) to calculate the absolute risk difference (ARD) and relative risk for any cardiovascular outcomes or all‐cause mortality. This approach was required because of different severity or distribution thresholds used to define categories of AAC (Tables S4 and S5). In secondary analyses, we analyzed studies that reported AAC by either (1) the absence versus the presence of AAC to determine the association between any AAC and outcomes or (2) studies that reported ≥3 categories of AAC for assessing whether a “dose‐response” gradient was evident. Where data for >3 categories of AAC were available, we collapsed the middle groups and assigned them as “moderate AAC.” To further address thresholds of AAC we used the R package for the meta‐analysis of diagnostic accuracy (“mada”) to calculate the bivariate summary receiver operator characteristic (sROC) curves with default parameters. 19 , 20 sROC converts paired sensitivity and specificity into a single measure of accuracy (diagnostic odds ratio). 20
Data Synthesis and Statistical Analysis
Where cardiovascular event data were reported in individual studies, pooled risk differences and risk ratios (RRs) with 95% CIs were calculated, from which a summary estimate was determined using DerSimonian‐Laird random‐effects models using Comprehensive Meta‐Analysis, Version 3. 21 We chose the random‐effects model over the fixed‐effects as a more conservative approach in the presence of heterogeneity. However, we also performed the main analyses using fixed effects. Heterogeneity was investigated using the I2 statistic. 22 , 23 We considered the I2 thresholds of <25%, 25% to 49%, 50% to 75%, and >75% to represent low, moderate, high, and very high heterogeneity, respectively. The likelihood of publication bias was evaluated by visual inspection of funnel plots and using the Egger regression test. 24 To understand how adjusting for traditional cardiovascular risk factors may affect the pooled results, we extracted adjusted estimates of risk from individual studies (hazard ratio or odds ratio) of the general population, see Table S6 for adjustments used in each study.
Subgroup Analysis and Meta‐Regression
We used subgroup analysis to investigate clinical heterogeneity (general population, CKD, or other and age of cohort <60, 60–69, and ≥70 years) and methodological heterogeneity (risk of bias of studies, imaging modality [radiograph, DXA, or CT] and duration of follow‐up <5, 5–9, ≥10 years). Meta‐regression was also conducted using a random effects model in the subgroup categories above and with the variables presented in Table 1 such as mean cohort systolic blood pressure, total cholesterol, and high‐density lipoprotein cholesterol.
Table 1.
Characteristics of Included Studies (n=46)
| Characteristic | n (%) |
|---|---|
| Year of publication | |
| Pre‐2011 | 15 (33) |
| 2011–2012 | 6 (13) |
| 2013–current | 25 (54) |
| Setting | |
| Chronic kidney disease | 26 (57) |
| General population | 12 (26) |
| Other | 8 (17) |
| Region | |
| United States | 8 (17) |
| Europe | 19 (41) |
| Asia | 15 (33) |
| Oceania | 3 (7) |
| Middle East | 1 (2) |
| Number of subjects | |
| <100 | 7 (15) |
| 100–500 | 24 (52) |
| ≥500 | 15 (33) |
| Years of follow‐up | |
| 1–3 | 19 (41) |
| >3–5 | 13 (28) |
| >5–10 | 10 (22) |
| >10 | 3 (7) |
| Not specified | 1 (2) |
| Test characteristics | |
| Modality of assessing abdominal aortic calcification | |
| X‐ray | 22 (48) |
| Quantitative computed tomography | 17 (37) |
| Dual energy X‐ray absorptiometry | 5 (11) |
| Ultrasound | 2 (4) |
| Demographic | |
| Mean age, y | |
| <60 | 18 (39) |
| 60–70 | 20 (43) |
| >70 | 6 (13) |
| Not specified | 2 (4) |
| Sex | |
| All male | 1 (2) |
| All female | 4 (9) |
| Mixed | 39 (85) |
| Not specified | 2 (4) |
| Prevalence of diabetes mellitus | |
| <10% | 13 (28) |
| ≥10% | 30 (65) |
| Not specified | 3 (7) |
| Proportion of current smokers | |
| <15% | 13 (28) |
| ≥15% | 16 (35) |
| Not specified | 17 (37) |
| Prevalence of hypertension | |
| <50% | 16 (35) |
| ≥50% | 17 (37) |
| Not specified | 13 (28) |
Results
Literature Search
Of the 458 potentially eligible publications, 52 studies (50 cohort studies and 2 case‐control studies; total number of individuals, 36 092) met the eligibility criteria. 6 , 8 , 9 , 10 , 11 , 12 , 13 , 14 , 68 Details of the individual studies are provided in Table 2. The interreviewer level of agreement regarding eligibility of included studies was very good (κ=0.97). Four cohorts had multiple eligible publications (Framingham Heart Study [n=4], Rotterdam Study [n=2], MINOS study [n=2] and PERF (Prospective Epidemiological Risk Factors) study [n=2]) for a total of 46 unique cohorts (Table 1 and Figure 1). A total of 32 publications (29 cohorts) provided extractable data for quantitative synthesis.
Table 2.
Overview of Studies Reporting the Association of AAC With Outcomes
| Study Reference | Design | End Points | Population | No. at Risk | Follow Up (y) | Imaging Modality | AA Segment | AAC Modeled as |
|---|---|---|---|---|---|---|---|---|
| General population | ||||||||
| Bolland 2010 11 | Two independent longitudinal studies | CVE, MI, CVA, sickle cell disease | W=Healthy postmenopausal women and middle‐aged and M=older men |
W‐1471 M‐323 |
W‐4.4 M‐3.3 |
DXA | L1‐L4 |
Present/absent AAC8‐continuous |
| Criqui 2014 9 , * | Longitudinal | Cardiovascular death, CVE, ACM | Men and women aged 45–84 y | 1974 | 5.5 | EBCT or MDCT | 8‐cm segment proximal to the aortic bifurcation (L2–L4) |
Agatston score ‐percentiles‐ 0–50th/51–75th/76–100th |
| Ganz 2012 25 | Longitudinal | Cardiovascular deaths, ACM | Postmenopausal women aged 45–70 y | 308 | 9.0 | X‐ray | L1–L4 |
Present/absent AAC24‐continous |
| Golestani 2010 26 | Nested case‐control | Cardiovascular death, CVE, MI, CVA | Consecutive patients referred for BMD testing between 2005 and 2007 | 489 | 2.6 | DXA | L1–L4 | AAC8—control/low/high |
| Hoffman 2016 27 | Longitudinal | CVE, CHD, ACM | Men aged ≥35 y and women aged ≥40 y | 3217 | 8.0 | MDCT | Above the iliac bifurcation and below the diaphragm (L1–L4) | Agatston score –quartiles and continuous |
| Hollander 2003 28 | Longitudinal | CVA | Men and women aged ≥55 y | 6913 | 6.1 | X‐ray | L1–L4 | Length of calcification (cm)—tertiles |
| Lewis 2018 10 | Longitudinal | CVE, cardiovascular death, ACM, CHD, CVA | Healthy women aged >70 | 1052 | 14.5 | DXA | L1–L4 | AAC24‐ present/absent, low/moderate/severe |
| Rodondi 2007 29 | Longitudinal | Cardiovascular death, ACM | Elderly white women aged ≥65 y | 2056 | 13.0 | X‐ray | ns | Present/absent |
| Schousboe 2008 14 | Nested case‐control | CVE | White women ≥75 y recruited from general practice registers | 732 | 4.0 | DXA | L1–L4 | AAC24—tertiles |
| Szulc 2008 30 | Longitudinal | ACM | Men aged 51–85 y | 781 | 10 | X‐ray | L1–L4 | Present/absent AAC24—tertiles |
| Wilson 2001 13 | Longitudinal | CVE, cardiovascular death, CHD | Framingham Heart Study free of CVD | 2515 | 22.0 | X‐ray | L1‐L4 | AAC24‐ tertiles |
| Witteman 1986 31 | Nested case‐control | Cardiovascular death | People ≥45 y | 415 | 9.0 | X‐ray | ns | Present/absent |
| Chronic kidney disease | ||||||||
| Blacher 2001 32 | Longitudinal | Cardiovascular death, ACM | Hemodialysis ≥3 mo | 110 | 4.4 | Ultrasound and x‐ray | 10‐cm segment above the iliac bifurcation (L1–L4) | Present/absent |
| Cho 2017 33 | Longitudinal | CVE | Hemodialysis >3 mo | 191 | 1.5 | X‐ray | L1–L4 | AAC24–low/high |
| Claes 2013 34 | Longitudinal | CVE | Single‐kidney transplant recipients (assessed at time of admission for transplant) | 253 | 3.0 | X‐ray | L1–L4 | AAC24‐none/mild/moderate‐severe, continuous |
| Disthabanchong 2018 35 | Longitudinal | ACM | Consecutive nondialysis patients with CKD stage 2–5, maintenance hemodialysis patients on kidney transplant waiting list and long‐term kidney transplant recipients | 419 | 5 | X‐ray | L1–L4 | AAC24 low/high |
| Djuric 2016 8 | Longitudinal | ACM | Hemodialysis >6 mo | 71 | 3.0 | CT | ns | Agatston score—2 groups selected based on ROC |
| Fusaro 2012 36 | Longitudinal | ACM | Hemodialysis >12 mo | 387 | 2.7 | X‐ray | L1–L4 | Present/abse |
| Gorriz 2015 37 | Longitudinal | Cardiovascular death, CVE, ACM | ≥18 y nondialysis patients with CKD stages 3–5 | 568 | 3.0 | X‐ray | L1–L4 | AAC24—low/high |
| Hanada 2010 38 | Longitudinal | CVE | ≥18 y non‐dialysis patients with CKD stage 3–5 | 83 | 4.0 | CT | 10‐cm segment above the iliac bifurcation (L1–L4) | AAC index—median AAC index |
| Hong 2013 39 | Retrospective | Cardiovascular death, ACM | Patients on hemodialysis with dialysis ≥3 times/wk for >3 mo | 217 | 2.2 | X‐ray | L2–L3 | Present/absent |
| Huang 2014 40 | Longitudinal | CVE, ACM | Peritoneal dialysis >2 mo and aged ≥20 y | 183 | 3.0 | MDCT | 4 consecutive slices above the iliac bifurcation | % calcified—2 groups based on ROC low/high |
| Imanishi 2014 41 | Longitudinal | CVE | Renal transplant recipients (assessed within 12 mo before transplant) | 61 | 5.0 | CT | 10‐cm segment above the iliac bifurcation (L1–L4) | AAC index—median AAC index |
| Kato 2003 42 | Longitudinal | Cardiovascular death, ACM | Stable patients on hemodialysis | 219 | 5.0 | CT | L2–L3 | AAC index—median AAC index |
| Kwon 2014 43 | Retrospective | CVE, ACM | Patients on chronic hemodialysis | 112 | 4.0 | X‐ray | L1–L4 | AAC24—quartiles, 2 groups based on ROC |
| Li 2016 44 | Longitudinal | Cardiovascular death, ACM | Patients on hemodialysis ≥3 mo | 164 | 4.5 | X‐ray | L1–L4 | Present/absent |
| Martino 2013 45 | Longitudinal | Cardiovascular death, ACM, CVE | All patients on peritoneal dialysis from October 2008 ‐January 2009 | 74 | 2.5 | X‐ray | L1–L4 | AAC24—tertiles |
| Munguia 2015 46 | Longitudinal | MACE, MACE or cardiovascular death, ACM | Renal transplant recipients (assessed before transplant) from July 2011 to September 2013 | 119 | 3.8 | X‐ray | L1–L4 | AAC24—3 groups |
| NasrAllah 2016 47 | Longitudinal | CVE, ACM | Patients on hemodialysis | 93 | 5.0 | X‐ray, CT | L1–L4 (X‐ray), | AAC24, upper AAC index, lower AAC index |
| Ohya 2011 48 | Longitudinal | Cardiovascular deaths, ACM | Patients on maintenance hemodialysis | 137 | 7.9 | CT | 10‐cm segment above the iliac bifurcation (L1–L4) | AAC index—median AAC index |
| Okuno 2007 49 | Longitudinal | Cardiovascular death, ACM | Patients on maintenance hemodialysis >3 mo | 515 | 4.3 | X‐ray | L1–L4 | Present/absent |
| Peeters 2017 50 | Longitudinal | CVE | Nondialysis patients with CKD | 280 | 2.4 | X‐ray | L1–L4 |
Present/absent AAC24‐ median |
| Tatami 2015 6 | Longitudinal | CVE, cardiovascular death, HF, MI, CVA, revascularization, ACM | Nondialysis patients with CKD | 347 | 3.5 | CT | Renal artery to iliac bifurcation (L2–L4) | AAC index—tertiles AAC index |
| Verbeke 2011 63 | Longitudinal | CVE/ACM | Patients aged ≥18 y undergoing maintenance hemodialysis or peritoneal dialysis | 1076 | 2.0 | X‐ray | L1–L4 | AAC24‐ |
| Vezzoli 2014 64 | Longitudinal | CVE | Patients with CKD at different stages including dialysis | 92 | 2.0 | DXA | L1–L4 | CVD‐2 groups ns why cutoff was chosen |
| Wang 2017 65 | Longitudinal | CVE | Patients with CKD at stages 3–5 | 161 | 1.3 | X‐ray | L1–4 | Present/absent |
| Yoon 2012 66 | Longitudinal | CVE/ACM | Patients undergoing maintenance hemodialysis | 128 | 1.4 | CT | ns | AAC index—tertiles AAC index |
| Yoon 2013 67 | Longitudinal | CVE/ACM | Patients undergoing peritoneal dialysis | 92 | 2.9 | CT | ns | AAC index—median AAC index |
| Other populations | ||||||||
| Allison 2012 68 , * | Longitudinal | Cardiovascular death, ACM | Individuals presenting for preventive medicine services | 4544 | 7.8 | CT | Diaphragm to the iliac bifurcation (L1–L4) |
Present/absent Agatston score‐continuous |
| Cox 2014 12 , * | Longitudinal | Cardiovascular death, ACM | Patients with type 2 diabetes mellitus | 699 | 8.4 | CT | 2.5‐cm proximal of the superior mesenteric artery‐2.5‐cm below the aortic bifurcation (L1–L5) | Agatston score ‐continuous |
| Davila 2006 51 | Longitudinal | CVE | Consecutive patients undergoing CT colonographic examinations | 467 | 3.1 | CT | 1 cm above the origin of the celiac axis to 1 cm below the iliac bifurcation (L1–L4/L5) | Agatston score –percentiles ≤75th/<75th |
| Harbaoui 2016 52 | Longitudinal | Cardiac death, CHF, ACM | Patients undergoing transcatheter aortic valve implantation surgery | 155 | 1.5 | CT | Aortic hiatus to the aortic bifurcation (L1–L4) | Total volume delineated calcifications‐ tertiles |
| Harbaugh 2013 53 | Longitudinal | Cardiovascular death, ACM | Patients who underwent elective general or vascular surgery between 2006 and 2009 | 1180 | 1.0 | CT | L1–L3 | % of the total wall area containing calcification—none/mild/significant |
| Niskanen 1990 54 | Unmatched case‐control | MI, peripheral artery disease | Middle‐aged patients with newly diagnosed type 2 diabetes mellitus and randomly selected controls | 277 | 5.0 | X‐ray | ns | Present/absent |
| Parr 2010 55 | Longitudinal | CVE | Patients from a vascular surgery clinic | 213 | 2.8 | CT | Lowest main renal artery to the iliac bifurcation (L2–L4) | Calcific deposit volume—mild, intermediate and severe |
| Zhang 2010 56 | Longitudinal | Cardiovascular death, ACM | Consecutive patients hospitalized in geriatric departments | 232 | 1.0 | Ultrasound | 10‐cm segment above the iliac bifurcation (L1–L4) | Present/absent |
| Levitzky 2008 57 | Framingham cohort, see Wilson for characteristics. | |||||||
| Samelson 2007 58 | Framingham cohort, see Wilson for characteristics. | |||||||
| Walsh 2002 59 | Framingham cohort, see Wilson for characteristics. | |||||||
| Estublier 2015 60 | MINOS cohort, see Szulc for characteristics. | |||||||
| van der Meer 2004 61 | Rotterdam cohort, see Hollander for characteristics. | |||||||
| Nielsen 2010 62 | See Ganz for characteristics. | |||||||
AAC24 indicates abdominal aortic calcification 24 scale scores; AAC8, abdominal aortic calcification 8 scale scores; ACM, all‐cause mortality; CHD, coronary heart disease; CHF, congestive heart failure; CT, computed tomography; CVA, cerebrovascular accident; CVE, cardiovascular event; DXA, images captured using a dual X‐ray absorptiometry machine; EBCT, electron beam computed tomography; L1–4, lumbar vertebrae 1–4; MACE, major adverse coronary event; MDCT, multidetector row spiral computed tomography; MI, myocardial infarction; ns, not specified; and ROC, receiver operating characteristic.
Area under the curve significantly larger when adding AAC to Framingham risk factors.
Figure 1. Study flow.
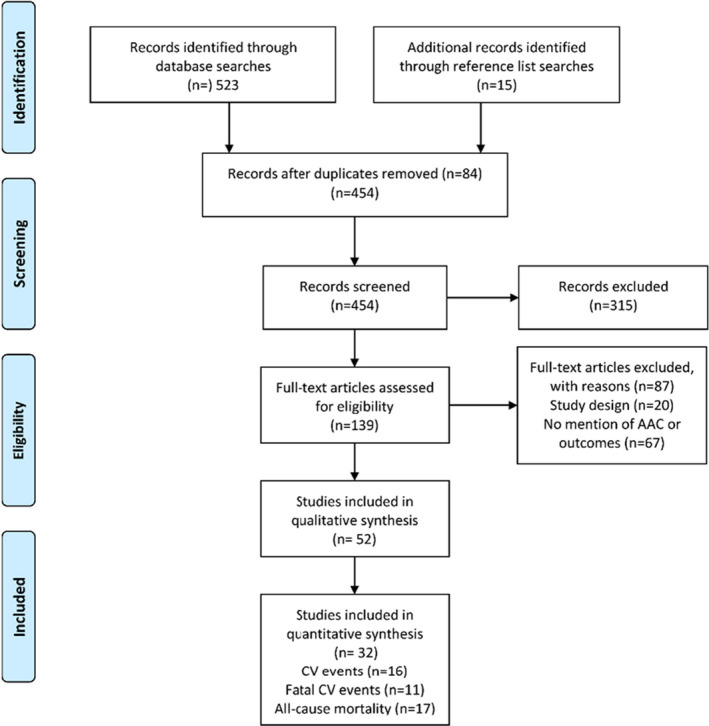
AAC indicates abdominal aortic calcification; and CV, cardiovascular.
Newcastle‐Ottawa Scale Risk of Bias
For the 52 cohort and case‐control studies, the overall risk of bias was considered low to moderate for comparability. For the selection and outcomes domains, the risk of bias was considered moderate to high. Detailed risk of bias assessment and results are presented in Data S1 and Figure S1.
Characteristics of Included Studies
Most studies were published in 2011 or later and represented cohorts of <500 people. Over half (57%) of the studies were in patients with CKD (estimated glomerular filtration rate <60 mL/min per 1.73 m2 to dialysis) and kidney transplant recipients, 26% were from the general population, 4% patients with diabetes mellitus, and 13% from other clinical settings (Table 1). AAC was evaluated by radiograph in 46% of studies, 37% by CT, 11% DXA, and 6% by ultrasound or 2 separate imaging modalities. Follow‐up time in the cohorts ranged from 1 to 22 years, with a median follow‐up time of 6.5 years.
Reporting of AAC
AAC was reported in a number of different ways for x‐rays and DXA (presence versus absence, AAC 8 scores, AAC 24 scores, or measured length of calcification). For CT, AAC was reported as presence versus absence, percentiles of the cohort, calcium scores, or AAC index, as outlined in Table 2. Cut points for individual studies that contributed data for incident events—cardiovascular events (n=16), fatal cardiovascular events (n=11), all‐cause mortality (n=17), cerebrovascular events (n=5), and coronary heart disease (n=6)—are shown in Table S4 (x‐ray and DXA) and Table S5 (CT). There were insufficient studies reporting AAC for all other cardiovascular outcomes. Absolute risk differences and relative risk differences for each individual study are presented in Table 3.
Table 3.
Absolute and Relative Risk in People With Any or More Advanced AAC for All Included Studies
| Study | Characteristics | Cardiovascular Events | Fatal Cardiovascular Events | All‐Cause Mortality | |||||
|---|---|---|---|---|---|---|---|---|---|
| Cohort Age, y | Follow‐Up, y | Test | % Events Low vs Mod‐High (ARD) | RR (95% CI) | % Events Low vs Mod‐High (ARD) | Relative Risk (95% CI) | % Events Low vs Mod‐High (ARD) | Relative Risk (95% CI) | |
| General population | |||||||||
| Bolland 2010 11 | 71 | 4 | DXA | 4.2 vs 9.2 (+5.0) | 2.19 (1.51–3.18) | … | … | … | … |
| Criqui 2014 9 | 65 | 6 | CT | 1.6 vs 6.8 (+5.2) | 4.19 (2.45–7.17) | 0.3 vs 2.7 (+2.4) | 9.00 (2.74–29.57) | 2.5 vs 8.1 (+5.6) | 3.20 (2.06–4.97) |
| Ganz 2012 25 | 60 | 9 | X‐ray | … | … | … | … | 7.3 vs 28.0 (+20.7) | 3.85 (2.10–7.04) |
| Golestani 2010 26 | 68 | 3 | DXA | 1.5 vs 8.5 (+7.0) | 5.55 (2.03–15.14) | … | … | … | … |
| Lewis 2018 10 | 75 | 15 | DXA | 33.4 vs 42.4 (+8.9) | 1.27 (1.06–1.52) | 13.9 vs 21.7 (+7.8) | 1.56 (1.13–2.14) | 29.6 vs 38.2 (+8.6) | 1.29 (1.06–1.57) |
| Rodondi 2007 29 | 72 | 13 | X‐ray | … | … | 10.6 vs 17.7 (+7.1) | 1.67 (1.29–2.15) | 26.8 vs 47.1 (+20.2) | 1.75 (1.52–2.02) |
| Schousboe 2008 14 | 80 | 4 | DXA | 44.1 vs 53.3 (+9.2) | 1.21 (1.02–1.43) | … | … | … | … |
| Szulc 2008 30 | 65 | 10 | X‐ray | … | … | … | … | 12.2 vs 34.2 (+22.0) | 2.80 (2.08–3.77) |
| Wilson 2001 13 , * | 61 | 22 | X‐ray | 36.3 vs 60.7 (+24.5) | 1.68 (1.53–1.84) | 15.2 vs 32.5 (+17.3) | 2.14 (1.81–2.52) | 65.1 vs 92.5 (+27.4) | 1.42 (1.35–1.49) |
| Witteman 1986 31 | 68 | 9 | X‐ray | … | … | 16.9 vs 25.3 (+8.5) | 1.50 (1.03–2.20) | … | … |
| Patients with CKD | |||||||||
| Cho 2017 33 | 60 | 2 | X‐ray | 6.4 vs 11.3 (+5.0) | 1.78 (0.69–4.61) | … | … | … | … |
| Claes 2013 34 | 54 | 3 | X‐ray | 1.0 vs 20.1 (+19.1) | 19.39 (2.77–143.65) | … | … | ||
| Djuric 2016 8 | 60 | 3 | CT | … | … | … | … | 13.0 vs 50.0 (+37.0) | 3.83 (1.29–11.43) |
| Fusaro 2012 36 | 64 | 3 | X‐ray | … | … | … | … | 9.3 vs 22.4 (+13.1) | 2.40 (1.15–5.01) |
| Hanada 2010 38 | 67 | 4 | CT | 14.6 vs 35.7 (+21.1) | 2.44 (1.05–5.67) | … | … | … | … |
| Hong 2013 39 | 60 | 2 | X‐ray | … | … | … | … | 5.0 vs 24.1 (+19.1) | 4.82 (1.77–13.10) |
| Munguia 2015 46 | 58 | 3 | X‐ray | 5.8 vs 22.0 (+16.2) | 3.83 (1.28–11.23) | … | … | 7.2 vs 14.0 (+6.8) | 1.93 (0.65–5.74) |
| NasrAllah 2017 47 | 43 | 5 | X‐ray, CT | … | … | … | … | 28.6 vs 44.4 (+15.9) | 1.56 (0.70–3.48) |
| Imanishi 2014 41 | 44 | 5 | CT | 0 vs 62.5 (+62.5) | 66.00 (3.98–1093.98) | … | … | … | … |
| Li 2016 44 | 59 | 5 | X‐ray | … | … | 2.0 vs 18.6 (+16.6) | 9.48 (1.31–68.55) | 7.8 vs 24.8 (+16.9) | 3.16 (1.17–8.54) |
| Ohya 2011 48 | 60 | 8 | CT | … | … | 14.9 vs 51.4 (+36.5) | 3.45 (1.86–6.38) | 37.3 vs 72.9 (+35.5) | 1.95 (1.39–2.75) |
| Okuno 2007 49 | 60 | 4 | X‐ray | … | … | 3.1 vs 11.7 (+8.6) | 3.74 (1.69–8.28) | 9.8 vs 27.8 (+18.0) | 2.83 (1.83–4.39) |
| Peeters 2016 50 | 61 | 2 | X‐ray | 4.3 vs 14.4 (+10.1) | 3.38 (1.40–8.17) | … | … | … | … |
| Tatami 2015 6 | 67 | 3 | CT | 4.3 vs 16.8 (+12.5) | 3.87 (1.57–9.55) | 0.8 vs 2.2 (+1.3) | 2.48 (0.29–20.97) | 5.2 vs 16.8 (+11.6) | 3.22 (1.41–7.39) |
| Vezzoli 2014 64 | ns | 2 | DXA | 11.5 vs 35.7 (+24.2) | 3.10 (1.22–7.87) | … | … | … | … |
| Other | |||||||||
| Allison 2012 68 | 57 | 7.8 | CT | … | … | 0.0 vs 1.4 (+1.4) | 15.41 (3.72–63.82) | 1.1 vs 5.8 (+4.7) | 5.49 (3.48–8.64) |
| Davila 2006 51 | 65 | 3.1 | CT | 0.1 vs 5.5 (+5.4) | 10.47 (2.21–49.70) | … | … | … | … |
| Harbaugh 2013 53 | 56 | 1.0 | CT | … | … | 0.5 vs 0.8 (+0.3) | 4.04 (0.58–28.34) | 4.7 vs 9.8 (+5.1) | 2.08 (1.20–3.63) |
| Parr 2010 55 | 69 | 2.8 | CT | 9.2 vs 26.4 (+17.1) | 2.86 (1.27–6.41) | … | … | … | … |
AAC indicates abdominal aortic calcification; ARD, absolute risk difference between no‐low and any‐advanced AAC; CKD, chronic kidney disease; CT, computed tomography; and DXA, dual X‐ray absorptiometry.
For all–cause mortality in the Framingham study, numbers were derived from Samelson et al. 58
Clinical Heterogeneity
A priori subgroup analyses (CKD versus general population) identified clinical heterogeneity attributable to the participants recruited (data not shown). This was confirmed in meta‐regression analyses where the type of population recruited potentially explained 32% to 50% of the observed between‐study heterogeneity for cardiovascular events (r 2=50%), fatal cardiovascular events (r 2=34%), and all‐cause mortality (r 2=32%). As there is no recommended approach when clinical heterogeneity is identified, 69 we decided post hoc to undertake all further analyses in studies of patients with CKD and the general population separately. There were insufficient numbers of studies (n=2) to meta‐analyze in the “other” populations for any outcome.
AAC, Cardiovascular Events, Fatal Cardiovascular Events, and All‐Cause Mortality in Studies From the General Population
Extractable data were available for 6 studies (n=8498) for cardiovascular events, 9 , 10 , 11 , 13 , 14 , 25 5 studies (n=8004) for fatal cardiovascular events, 9 , 10 , 13 , 29 , 31 and 6 studies (n=8662) for all‐cause mortality. 9 , 10 , 25 , 29 , 30 , 58 Compared with those with no or low AAC, people with any or more advanced AAC had higher pooled absolute risk differences for cardiovascular events (+9.9%; 95% CI, +4.1%–15.8%), fatal cardiovascular events (+8.6%; 95% CI, +2.3%–14.8%), and all‐cause mortality (+17.4%; 95% CI, +8.1%–26.6%). The summary table of evidence is provided in Table 4. Briefly, the pooled RRs were 1.83 (95% CI, 1.40–2.39) for cardiovascular events, 1.85 (95% CI, 1.44–2.39) for fatal cardiovascular events, and 1.98 (95% CI, 1.56–2.53) for all‐cause mortality (moderate‐quality evidence, all P<0.001). However, high (fatal cardiovascular events, I2=69%; cerebrovascular events, I2=60%; and coronary heart disease [CHD] events, I2=72%) to very high (cardiovascular events, I2=87%; and all‐cause mortality, I2=90%) between‐study heterogeneity was observed (Figure 2). Evidence of small‐study publication bias was identified for all‐cause mortality (P=0.044). The sROC curves generated suggest that AAC alone may provide moderate to good (area under the curve, 0.69–0.75) discriminative ability for cardiovascular events, fatal cardiovascular events, and deaths in this population (Figure 3A, 3C and 3E).
Table 4.
Summary of Findings Table
| Illustrative Comparative Risks | Relative Risk (95% CI) | No. Studies (No. People) | Quality of the Evidence (GRADE) | ||
|---|---|---|---|---|---|
| No or Low AAC | Any or More Advanced AAC | ||||
| General population* | |||||
| Cardiovascular events | 2/100 | 4/100 | 1.83 (1.40–2.39) | 6 (8498) | Moderate † |
| Fatal cardiovascular events | 0/100 | 1/100 | 1.85 (1.44–2.39) | 5 (8004) | Moderate † |
| All‐cause mortality | 3/100 | 6/100 | 1.98 (1.55–2.53) | 6 (8662) | Moderate † |
| Patients with chronic kidney disease ‡ | |||||
| Cardiovascular events | 4/100 | 14/100 | 3.47 (2.21–5.45) | 8 (1426) | Moderate † |
| Fatal cardiovascular events | 1/100 | 4/100 | 3.68 (2.32–5.84) | 4 (1163) | High † |
| All‐cause mortality | 5/100 | 12/100 | 2.40 (1.95–2.97) | 9 (2050) | High † |
Baseline risk calculated from Criqui et al 9 (n=1974), for cardiovascular events, fatal cardiovascular events, and all‐cause mortality. AAC assessed by CT in men and women with a mean age of 65 years with a mean follow up of 5.5 years.
Quality of evidence scoring based on GRADE for prognostic studies 1 for all outcomes presented in Tables S6 and S7.
Baseline risk calculated from the Tatami et al 6 (n=347), for cardiovascular events, fatal cardiovascular deaths, and all‐cause mortality. AAC assessed by CT in men and women with chronic kidney disease, a mean age of 67 years, and duration of follow‐up 3.5 years.
Figure 2. Association between abdominal aortic calcification (AAC) and cardiovascular disease events (CVD, A and B), fatal cardiovascular events (CV, C and D) and all‐cause mortality (E and F) in cohorts from the general population (left panels) or patients with chronic kidney disease (CKD) (right panels).
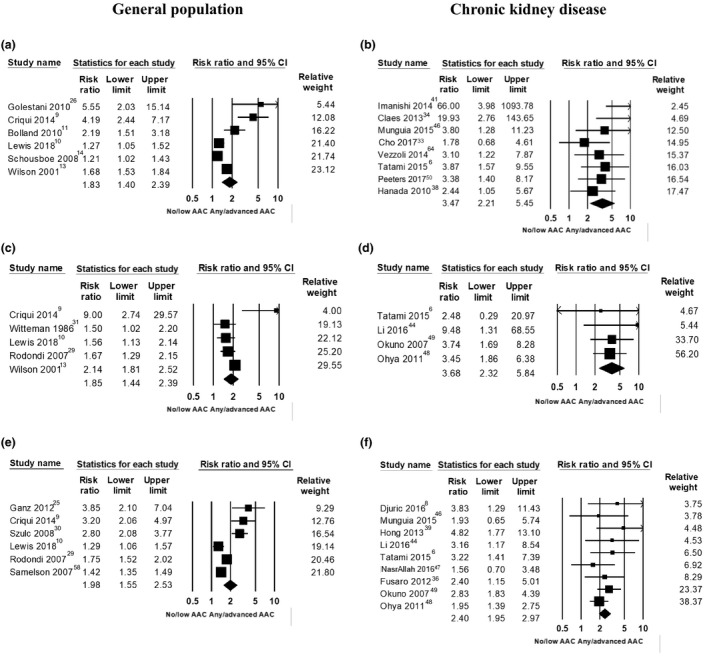
Figure 3. Summary ROC (sROC) showing the point estimate (area under the curve [AUC]) for the diagnostic accuracy of AAC to identify people at risk of cardiovascular events (A and B), fatal cardiovascular events (C and D) and all‐cause mortality (E and F) in cohorts from the general population (left panels) or patients with chronic kidney disease (CKD) (right panels).

Graphs are based on the paired sensitivity and false‐positive rates plotted together with a confidence region (circled area). Each triangle represents the summary sensitivity and false positive rate from a single cohort.
Studies Reporting by Presence of AAC and Increasing AAC Severity From the General Population
There were 4 studies that reported AAC by the absence and presence of AAC for cardiovascular events, 10 , 11 , 13 , 14 4 studies for fatal cardiovascular events, 10 , 13 , 29 , 31 and 5 studies for all‐cause mortality. 10 , 25 , 29 , 30 , 58 Increased absolute and relative risks were seen in people with any AAC (Table 5). Studies reporting ≥3 categories of AAC severity (cardiovascular events=5 studies, 9 , 10 , 13 , 14 , 26 fatal cardiovascular events=3 studies, 2 , 11 , 14 and all‐cause mortality=3 studies 9 , 10 , 13 ) had increased absolute and relative risks with increasing severity of AAC (Table 5).
Table 5.
Studies From the General Population With Different Thresholds
| AAC Group | Number of Cohorts (No. Events/No. Group) | Absolute Risk Difference (95% CI) | Relative Risk (95% CI) | I2 |
|---|---|---|---|---|
| Any detectable AAC | ||||
| Cardiovascular events | ||||
| No detectable AAC | 4 (485/2538) | 1 (referent) | 1 (referent) | |
| Any AAC | 4 (1361/3262) | +11.4 (+1.7 to +21.0) | 1.76 (1.32 to 2.34) | 81% |
| Fatal cardiovascular events | ||||
| No detectable AAC | 4 (293/2105) | 1 (referent) | 1 (referent) | |
| Any AAC | 4 (971/3933) | +10.4 (+4.4 to +16.3) | 1.77 (1.47 to 2.13) | 48% |
| All‐cause mortality | ||||
| No detectable AAC | 5 (899/2225) | 1 (referent) | 1 (referent) | |
| Any AAC | 5 (2606/4471) | +18.8 (+12.3 to +25.4) | 1.72 (1.40 to 2.11) | 84% |
| Increasing severity of AAC categories | ||||
| Cardiovascular events | ||||
| Lowest reported AAC group | 5 (638/2952) | 1 (referent) | 1 (referent) | |
| Middle/combined AAC group(s) | 5 (735/2029) | +6.5 (−0.2 to +13.3) | 1.40 (1.06 to 1.84) | 84% |
| Highest reported AAC group | 5 (814/1773) | +15.3 (+4.9 to +25.6) | 2.06 (1.48 to 2.88) | 90% |
| Fatal cardiovascular events | ||||
| Lowest reported AAC group | 3 (219/2400) | 1 (referent) | 1 (referent) | |
| Middle/combined AAC group(s) | 3 (314/1661) | +6.7 (−1.3 to +14.8) | 1.77 (1.24 to 2.52) | 66% |
| Highest reported AAC group | 3 (357/1472) | +12.0 (−0.5 to +24.5) | 2.61 (1.57 to 4.32) | 81% |
| All‐cause mortality | ||||
| Lowest reported AAC group | 3 (193/1674) | 1 (referent) | 1 (referent) | |
| Middle/combined AAC group(s) | 3 (244/1247) | +5.5 (+0.5 to +10.5) | 1.44 (1.13 to 1.84) | 32% |
| Highest reported AAC group | 3 (224/878) | +17.5 (+5.1 to +29.8) | 2.86 (1.30 to 6.28) | 93% |
| Coronary heart disease | ||||
| Lowest reported AAC | 4 (299/2725) | 1 (referent) | 1 (referent) | |
| Middle AAC group(s) | 4 (382/1576) | 5.6 (−0.4 to 11.6) | 1.58 (1.16 to 2.16) | 60% |
| Highest reported AAC | 4 (458/1531) | 10.7 (−1.3 to 22.8) | 2.70 (1.47 to 4.97) | 88% |
| Cerebrovascular disease | ||||
| Lowest reported AAC | 3 (105/2677) | 1 (referent) | 1 (referent) | |
| Middle AAC group(s) | 3 (163/2524) | 2.5 (1.4 to 3.5) | 1.72 (1.04 to 2.85) | 65% |
| Highest reported AAC | 3 (183/1971) | 6.0 (3.8 to 8.2) | 2.91 (1.51 to 5.62) | 79% |
AAC indicates abdominal aortic calcification.
AAC, CHD, and Cerebrovascular Disease in Studies From the General Population
Extractable data were available for 5 studies (n=7766) for CHD 9 , 10 , 11 , 13 , 26 and 4 studies (n=8943) for cerebrovascular disease. 10 , 11 , 26 , 28 People with any or more advanced AAC had higher pooled absolute risk differences for CHD (+7.4%; 95% CI, +2.0 to +12.8%) and cerebrovascular disease (+3.4%; 95% CI, +1.8 to +5.0%), compared with those with no or low AAC. The pooled RRs were 2.22 (95% CI, 1.57–3.15) for CHD events and 2.10 (95% CI, 1.41–3.12) for cerebrovascular events, Figure S2 (high‐quality evidence [Tables 2 and 5], both P<0.001), with moderate to high between‐study heterogeneity (60%–72%). Increasing absolute and relative risk with increasing severity of AAC were seen for CHD events (4 studies) and cerebrovascular events (3 studies) (Table 5).
Pooled Analysis of Adjusted Estimates of Risk
To understand how adjusting for traditional cardiovascular risk factors may affect the pooled results we undertook meta‐analyses using the reported adjusted estimates of risk from the individual studies (hazard ratio or odds ratio) interpreted as RR, using weighted random effects with similar results to the unadjusted analyses (Figure 4, Table 6).
Figure 4. Cardiovascular risk factor adjusted association between abdominal aortic calcification (AAC) and cardiovascular disease events (CVD) (A), fatal cardiovascular events (B), all‐cause mortality (C), coronary heart disease events (D), and cerebrovascular disease events (E) in cohorts from the general population.
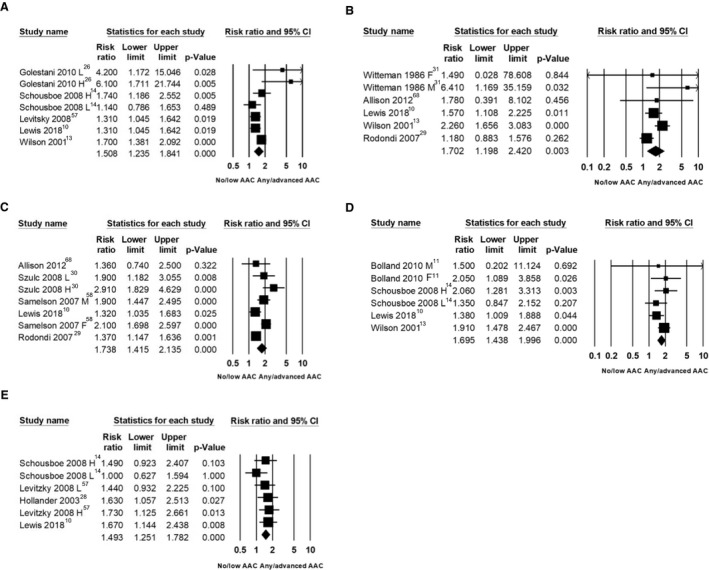
Adjusted measures of risk only presented in; F indicates female only; H, high AAC vs none/less advanced; L, low AAC vs none/less advanced; and M, male only.
Table 6.
Comparison of Unadjusted and Adjusted Estimates of Studies From the General Population
| Any Advanced AAC | Pooled Unadjusted Relative Risk (95% CI) | Pooled Adjusted Relative Risk (95% CI) |
|---|---|---|
| Cardiovascular events | 1.83 (1.40–2.39), I2=87% | 1.51 (1.24–1.84), I2=45% |
| Fatal cardiovascular events | 1.85 (1.44–2.39), I2=69% | 1.70 (1.20–2.42), I2=57% |
| All‐cause mortality | 1.98 (1.55–2.53), I2=90% | 1.74 (1.42–2.13), I2=70% |
| Coronary heart disease | 2.22 (1.57–3.15), I2=72% | 1.69 (1.44–2.00), I2=0% |
| Cerebrovascular disease | 2.10 (1.41–3.12), I2=60% | 1.49 (1.25–1.78), I2=0% |
AAC indicates abdominal aortic calcification.
Sources of Methodological and Statistical Heterogeneity
There was not statistically significant between‐study heterogeneity attributable to imaging modality (x‐ray, DXA, CT), threshold AAC (present/absent, other), mean cohort age (<60, 60–69, ≥70 years), and duration of follow‐up (<5, 5–9, ≥10 years; data not shown) (Figures S3, S4, and S5). Heterogeneity for cardiovascular and fatal cardiovascular events was potentially explained by mean cohort systolic blood pressure (42%–45%) and total cholesterol (4% and 13%) with greater RR differences seen in cohorts with lower mean systolic blood pressure and total cholesterol. For fatal cardiovascular events, imaging modality potentially explained 60% of the heterogeneity with no between‐group difference for studies using x‐rays (2 studies) or DXA (2 studies), while 1 study using CT had the greatest RR. All‐cause mortality studies with lower systolic blood pressure (39%) and shorter follow‐up time (11%) had higher RR, while 1 study in Oceania had a lower RR than studies in Europe and the United States (36%). Additionally, studies with a higher prevalence of participants with diabetes mellitus at baseline had greater RR differences, potentially explaining 42% of the between‐study heterogeneity.
AAC, Cardiovascular Events, Fatal Cardiovascular Events, and All‐Cause Mortality in Patients With Chronic Kidney Disease
Extractable data were available for 8 studies (n=1426) for cardiovascular events, 6 , 33 , 34 , 38 , 41 , 46 , 50 , 64 4 studies (n=1163) for fatal cardiovascular events, 6 , 44 , 48 , 49 and 9 studies (n=2050) for all‐cause mortality. 6 , 8 , 36 , 39 , 44 , 46 , 47 , 48 , 49 Compared with those with no or low AAC, people with any or more advanced AAC had higher pooled absolute risk differences for cardiovascular events (+15.1%; 95% CI, +9.1%–21.1%), fatal cardiovascular events (+13.4%; 95% CI, +3.8%–23.0%), and all‐cause mortality (+17.1%; 95% CI, +12.2%–22.0%). The pooled RRs were 3.47 (95% CI, 2.21–5.45) for cardiovascular events, 3.69 (95% CI, 2.32–5.85) for fatal cardiovascular events, and 2.41 (95% CI, 1.95–2.97) for all‐cause mortality (moderate [cardiovascular events]‐high [fatal cardiovascular events and all‐cause mortality] quality evidence [Table 2], all P<0.001), with no (fatal cardiovascular events and all‐cause mortality) to low (cardiovascular events, 29%; P=0.196, attributable to a single study 41 ) between‐study heterogeneity (Figure 2). Evidence of small‐study publication bias was identified for cardiovascular events (P=0.002). The sROC curves generated suggest that AAC alone may provide moderate to good (area under the curve, 0.64–0.83) discriminative ability for cardiovascular events, fatal cardiovascular events, and deaths in this population (Figure 3B, 3D, and 3F).
Comparison of Fixed Versus Random Effects
The main analyses were performed using both fixed and random effects for comparative purposes and are presented in Table S7.
Discussion
In this systematic review and meta‐analysis, we observed moderate‐ to high‐quality evidence that people with any or more advanced AAC had substantially higher absolute and relative risk for cardiovascular events, fatal cardiovascular events, and all‐cause mortality than people with no or less advanced AAC. The strongest associations were seen in patients with CKD and people from the general population with the most advanced AAC. Importantly, AAC alone had moderate to good discrimination (sROC, 0.6–0.8) for all outcomes, indicating that this may be a clinically useful predictor of future cardiovascular events, fatal cardiovascular events, and prognosis in patients with CKD and the general population. Thus, fortuitous findings of AAC in patients with no known data on cardiovascular risk factors should be considered to be an indication for further diagnostic testing, such as ECG, lipid assays, and so on.
Both a priori subgroup analysis and meta‐regression identified that the risk in people with AAC differed substantially between studies recruiting patients with CKD versus those recruiting from the general population. The strongest and most consistent associations were observed in patients with CKD. These findings may be attributable to a greater burden and progression of AAC in this patient group, differences in drivers of calcification, or higher selected thresholds of AAC, which was particularly evident for cardiovascular events. Irrespective of the reasons, these findings add further support to the current Kidney Disease Improving Global Outcomes clinical practice guidelines suggesting that when AAC is seen in patients with CKD stages G3a–G5D (estimated glomerular filtration rate <60 mL/min per 1.73 m2 to dialysis), these patients should be considered at the highest cardiovascular disease risk. 70
In cohorts recruited from the general population, people with any or more advanced AAC had twice the relative risk and 9% to 17% absolute risk difference for cardiovascular events, fatal cardiovascular events, and all‐cause mortality compared with those in the lowest reported AAC category. These very large absolute risk differences are likely attributable to the nature of the included cohorts, for example, elderly who are at high risk of these events. When meta‐analyzing the adjusted measures of risk, the pooled RR remained similar, supporting the concept that AAC may provide additional prognostic information to conventional risk factors. 9 , 27 , 57
While our sROC analyses demonstrated that AAC alone had moderate to good discrimination for all outcomes, it did not address whether the addition of AAC to established risk factors improves prognostication. A number of the larger studies from the general population have previously reported that the addition of AAC to conventional risk factors improves measures of discrimination for cardiovascular events, cardiovascular mortality, CHD events, and ischemic strokes. 9 , 57 In the Framingham offspring cohort, the inclusion of AAC led to a 12% improvement in net reclassification for both CHD and major cardiovascular events. 27 Taken together with the sROC analyses showing moderate to good discrimination, these findings suggest that the addition of AAC measures to Framingham risk factors are likely to improve discrimination for cardiovascular events.
In the general population, there was high between‐study heterogeneity for cardiovascular events, fatal cardiovascular events, and all‐cause mortality, suggesting that the summary estimates should be interpreted cautiously. This heterogeneity was potentially attributable to cohort differences in systolic blood pressure and total cholesterol, with AAC being more prognostic in people with lower systolic blood pressure and total cholesterol, confirming findings in individual studies. 14 , 71 This suggests that AAC may identify an as yet underappreciated high‐risk group not captured by conventional risk factors. When meta‐analyzing the adjusted measures of risk, heterogeneity was reduced for all outcomes.
Surprisingly, AAC imaging using x‐ray, DXA, or CT and thresholds of AAC were not a major source of between‐study heterogeneity for cardiovascular events or all‐cause mortality. However, CT imaging was for cardiovascular death in the general population because of a single study of lower‐risk individuals. 9 This suggests that low‐cost, widely available imaging modalities can be used to identify people at a clinically significantly increased risk of cardiovascular disease events and mortality. This is an important finding given the likely decline of standard radiographs, attributable to improvements in the image quality of DXA images at a fraction of the radiation dose of a standard radiograph and increasing access to CT as the radiation dose becomes lower.
There are a number of strengths of this meta‐analysis over the previous meta‐analysis in 2012. 71 Because of our broad inclusion criteria and more recent search, we identified substantially more studies than the previous meta‐analysis (n=4 studies for cardiovascular events and n=3 studies for fatal cardiovascular events). 71 Additionally, we used the number of people with an event within each group (unadjusted estimates) from studies rather than the adjusted estimates of the risk or hazard ratio where the interpretation and validity can be problematic when studies adjust for different baseline confounders. Additionally, we used subgroup analyses and meta‐regression to attempt to explain observed heterogeneity and identified a number of confounders that are likely to contribute to the observed heterogeneity. Finally, we undertook sROC analysis to determine the discriminative performance of AAC alone for future cardiovascular events, cardiovascular deaths, and all‐cause mortality. As such, this meta‐analysis can inform patients and their treating physicians about their likely future cardiovascular risk and prognosis when AAC is observed.
In regards to limitations, considerable differences between cut points of AAC, even within the same imaging modalities, make interpretation of the results challenging. As such, we cannot propose a potentially useful threshold based on the current meta‐analysis. Further individual patient level meta‐analyses within the same imaging modalities are needed. Second, small‐study publication bias was identified for cardiovascular events in the CKD population and all‐cause mortality in the general population and may have compromised the validity of our results. As such, the reported estimates should be considered tentatively. Finally, in some cases, study demographics may have influenced the imaging modality used; for example, younger cohorts from the general population were more likely to have CT or standard radiographs (range, 60–68 years), while DXA‐based imaging was predominantly in elderly women (range, 68–80 years) captured during bone density testing.
It is now clear that even in populations considered at high risk of cardiovascular disease but sometimes overlooked, such as the elderly and those with CKD, severe AAC identifies those at substantially higher absolute and relative risk. Potential uses for this information include aiding treatment decisions and increased patient awareness of disease risk and symptoms as a motivational tool for lifestyle decisions and changes, improving individual risk prediction and providing novel targets for new treatments.
In conclusion, future studies should focus on standardization of AAC assessment and reporting and investigate whether the knowledge of AAC improves primary prevention and clinical management strategies. Given that AAC can be quickly and easily captured using low to negligible radiation exposure compared with assessing coronary artery calcifications, it may complement existing early detection and primary prevention strategies for clinical cardiovascular disease.
Sources of Funding
The salary of Dr Lewis is supported by a National Heart Foundation of Australia Future Leader Fellowship (ID: 102817). Dr Kiel's time was supported by a grant from the National Institute of Arthritis, Musculoskeletal and Skin Diseases (R01 AR 41398). The salary of Dr Hodgson is supported by a National Health and Medical Research Council of Australia Senior Research Fellowship (ID 1116973). Dr Teixeira‐Pinto is partially supported by the NHMRC Program Grant BeatCKD (APP1092957). None of the funding agencies had any role in the conduct of the study; collection, management, analysis, or interpretation of the data; or preparation, review, or approval of the manuscript.
Disclosures
None.
Supporting information
Data S1
Tables S1–S7
Figures S1–S5
Acknowledgments
Dr Lewis had full access to all the data in the study and takes responsibility for the integrity of the data and the accuracy of the data analysis. Author contributions: Study concept and design: all authors. Acquisition of data: Drs Leow, Szulc, Shaikh, and Sawang. Analysis and interpretation of data: Drs Leow, Shaikh, Sawang, Szulc, Bondonno, Teixeira‐Pinto, Lim, Wong, Craig, and Lewis. Drafting of the manuscript: Drs Leow, Szulc, Lim, Wong, Craig, and Lewis. Critical revision of the manuscript for important intellectual content: all authors. Statistical analysis: Drs Lewis, Leow, Teixeira‐Pinto, Wong, and Craig. Administrative, technical, and material support: Drs Lewis, Leow, Sim, and Szulc. Study supervision: Drs Lewis, Lim, Wong, and Craig.
(J Am Heart Assoc. 2021;10:e017205. DOI: 10.1161/JAHA.120.017205.)
Supplementary Material for this article is available at https://www.ahajournals.org/doi/suppl/10.1161/JAHA.120.017205
For Sources of Funding and Disclosures, see pages 17 and 18.
References
- 1. Budoff MJ, Shaw LJ, Liu ST, Weinstein SR, Mosler TP, Tseng PH, Flores FR, Callister TQ, Raggi P, Berman DS. Long‐term prognosis associated with coronary calcification: observations from a registry of 25,253 patients. J Am Coll Cardiol. 2007;49:1860–1870. [DOI] [PubMed] [Google Scholar]
- 2. Szulc P. Abdominal aortic calcification: a reappraisal of epidemiological and pathophysiological data. Bone. 2016;84:25–37. [DOI] [PubMed] [Google Scholar]
- 3. Strong JP, Malcom GT, McMahan CA, Tracy RE, Newman WP III, Herderick EE, Cornhill JF. Prevalence and extent of atherosclerosis in adolescents and young adults: implications for prevention from the pathobiological determinants of atherosclerosis in youth study. JAMA. 1999;281:727–735. [DOI] [PubMed] [Google Scholar]
- 4. Allam AHA, Thompson RC, Eskander MA, Mandour Ali MA, Sadek A, Rowan CJ, Sutherland ML, Sutherland JD, Frohlich B, Michalik DE, et al. Is coronary calcium scoring too late? Total body arterial calcium burden in patients without known CAD and normal MPI. J Nucl Cardiol. 2018;25:1990–1998. [DOI] [PubMed] [Google Scholar]
- 5. Wong ND, Lopez VA, Allison M, Detrano RC, Blumenthal RS, Folsom AR, Ouyang P, Criqui MH. Abdominal aortic calcium and multi‐site atherosclerosis: the Multiethnic Study of Atherosclerosis. Atherosclerosis. 2011;214:436–441. [DOI] [PMC free article] [PubMed] [Google Scholar]
- 6. Tatami Y, Yasuda Y, Suzuki S, Ishii H, Sawai A, Shibata Y, Ota T, Shibata K, Niwa M, Morimoto R, et al. Impact of abdominal aortic calcification on long‐term cardiovascular outcomes in patients with chronic kidney disease. Atherosclerosis. 2015;243:349–355. [DOI] [PubMed] [Google Scholar]
- 7. Wagenknecht LE, Langefeld CD, Freedman BI, Carr JJ, Bowden DW. A comparison of risk factors for calcified atherosclerotic plaque in the coronary, carotid, and abdominal aortic arteries: the Diabetes Heart Study. Am J Epidemiol. 2007;166:340–347. [DOI] [PMC free article] [PubMed] [Google Scholar]
- 8. Djuric PS, Dimkovic N, Djuric Z, Schlieper G, Jankovic A, Pantelic M, Damjanovic T, Dragovic JT, Bulatovic A, Popovic J, et al. Prognostic significance of CT scans of abdominal aorta on mortality of hemodialysis patients, three year follow up. Nephrol Dial Transplant. 2016;31:1530–1531. [Google Scholar]
- 9. Criqui MH, Denenberg JO, McClelland RL, Allison MA, Ix JH, Guerci A, Cohoon KP, Srikanthan P, Watson KE, Wong ND. Abdominal aortic calcium, coronary artery calcium, and cardiovascular morbidity and mortality in the Multi‐Ethnic Study of Atherosclerosis. Arterioscler Thromb Vasc Biol. 2014;34:1574–1579. [DOI] [PMC free article] [PubMed] [Google Scholar]
- 10. Lewis JR, Schousboe JT, Lim WH, Wong G, Wilson KE, Zhu K, Thompson PL, Kiel DP, Prince RL. Long‐term atherosclerotic vascular disease risk and prognosis in elderly women with abdominal aortic calcification on lateral spine images captured during bone density testing: a prospective study. J Bone Miner Res. 2018;33:1001–1010. [DOI] [PMC free article] [PubMed] [Google Scholar]
- 11. Bolland MJ, Wang TK, van Pelt NC, Horne AM, Mason BH, Ames RW, Grey AB, Ruygrok PN, Gamble GD, Reid IR. Abdominal aortic calcification on vertebral morphometry images predicts incident myocardial infarction. J Bone Miner Res. 2010;25:505–512. [DOI] [PubMed] [Google Scholar]
- 12. Cox AJ, Hsu FC, Agarwal S, Freedman BI, Herrington DM, Carr JJ, Bowden DW. Prediction of mortality using a multi‐bed vascular calcification score in the Diabetes Heart Study. Cardiovasc Diabetol. 2014;13:160. [DOI] [PMC free article] [PubMed] [Google Scholar]
- 13. Wilson PWF, Kauppila LI, O'Donnell CJ, Kiel DP, Hannan M, Polak JM, Cupples LA. Abdominal aortic calcific deposits are an important predictor of vascular morbidity and mortality. Circulation. 2001;103:1529–1534. [DOI] [PubMed] [Google Scholar]
- 14. Schousboe JT, Taylor BC, Kiel DP, Ensrud KE, Wilson KE, McCloskey EV. Abdominal aortic calcification detected on lateral spine images from a bone densitometer predicts incident myocardial infarction or stroke in older women. J Bone Miner Res. 2008;23:409–416. [DOI] [PubMed] [Google Scholar]
- 15. Niu Q, Hong Y, Lee C‐H, Men C, Zhao H, Zuo L. Abdominal aortic calcification can predict all‐cause mortality and CV events in dialysis patients: a systematic review and meta‐analysis. PLoS One. 2018;13:e0204526. [DOI] [PMC free article] [PubMed] [Google Scholar]
- 16. Yao Z, Wang C, Zhang Q, Ma S, Gui B, Duan C. Prevalence of abdominal artery calcification in dialysis patients with end‐stage renal disease: a systematic review and meta‐analysis. Int Urol Nephrol. 2017;49:2061–2069. [DOI] [PubMed] [Google Scholar]
- 17. Stroup DF, Berlin JA, Morton SC, Olkin I, Williamson GD, Rennie D, Moher D, Becker BJ, Sipe TA, Thacker SB. Meta‐analysis of observational studies in epidemiology: a proposal for reporting. Meta‐analysis of Observational Studies in Epidemiology (MOOSE) group. JAMA. 2000;283:2008–2012. [DOI] [PubMed] [Google Scholar]
- 18. Iorio A, Spencer FA, Falavigna M, Alba C, Lang E, Burnand B, McGinn T, Hayden J, Williams K, Shea B, et al. Use of grade for assessment of evidence about prognosis: rating confidence in estimates of event rates in broad categories of patients. BMJ. 2015;350:h870. [DOI] [PubMed] [Google Scholar]
- 19. Reitsma JB, Glas AS, Rutjes AW, Scholten RJ, Bossuyt PM, Zwinderman AH. Bivariate analysis of sensitivity and specificity produces informative summary measures in diagnostic reviews. J Clin Epidemiol. 2005;58:982–990. [DOI] [PubMed] [Google Scholar]
- 20. Doebler K, Holling H. Meta‐Analysis of Diagnostic Accuracy with mada. 2017.
- 21. Rothstein H, Sutton A, Borenstein M. Software for publication bias. In Rothstein H, Sutton A, Borenstein M (eds.), Publication Bias in Meta‐Analysis: Prevention, Assessment and Adjustments. Hoboken, New Jersey, USA: Wiley; 2005:193–220. [Google Scholar]
- 22. Higgins JP, Thompson SG. Quantifying heterogeneity in a meta‐analysis. Stat Med. 2002;21:1539–1558. [DOI] [PubMed] [Google Scholar]
- 23. Higgins JP, Thompson SG, Deeks JJ, Altman DG. Measuring inconsistency in meta‐analyses. BMJ. 2003;327:557–560. [DOI] [PMC free article] [PubMed] [Google Scholar]
- 24. Egger M, Davey Smith G, Schneider M, Minder C. Bias in meta‐analysis detected by a simple, graphical test. BMJ. 1997;315:629–634. [DOI] [PMC free article] [PubMed] [Google Scholar]
- 25. Ganz M, de Bruijne M, Dam EB, Pettersen P, Karsdal MA, Christiansen C, Nielsen M. Distribution, size, and shape of abdominal aortic calcified deposits and their relationship to mortality in postmenopausal women. Int J Biomed Imaging. 2012;2012:459286. [DOI] [PMC free article] [PubMed] [Google Scholar]
- 26. Golestani R, Tio R, Zeebregts CJ, Zeilstra A, Dierckx RA, Boersma HH, Hillege HL, Slart RH. Abdominal aortic calcification detected by dual X‐ray absorptiometry: a strong predictor for cardiovascular events. Ann Med. 2010;42:539–545. [DOI] [PubMed] [Google Scholar]
- 27. Hoffmann U, Massaro JM, D'Agostino RB Sr, Kathiresan S, Fox CS, O'Donnell CJ. Cardiovascular event prediction and risk reclassification by coronary, aortic, and valvular calcification in the Framingham Heart Study. J Am Heart Assoc. 2016;5:e003144. DOI: 10.1161/JAHA.115.003144. [DOI] [PMC free article] [PubMed] [Google Scholar]
- 28. Hollander M, Hak AE, Koudstaal PJ, Bots ML, Grobbee DE, Hofman A, Witteman JC, Breteler MM. Comparison between measures of atherosclerosis and risk of stroke: the Rotterdam Study. Stroke. 2003;34:2367–2372. [DOI] [PubMed] [Google Scholar]
- 29. Rodondi N, Taylor BC, Bauer DC, Lui LY, Vogt MT, Fink HA, Browner WS, Cummings SR, Ensrud KE. Association between aortic calcification and total and cardiovascular mortality in older women. J Intern Med. 2007;261:238–244. [DOI] [PubMed] [Google Scholar]
- 30. Szulc P, Kiel DP, Delmas PD. Calcifications in the abdominal aorta predict fractures in men: MINOS study. J Bone Miner Res. 2008;23:95–102. [DOI] [PubMed] [Google Scholar]
- 31. Witteman JC, Kok FJ, van Saase JL, Valkenburg HA. Aortic calcification as a predictor of cardiovascular mortality. Lancet. 1986;2:1120–1122. [DOI] [PubMed] [Google Scholar]
- 32. Blacher J, Guerin AP, Pannier B, Marchais SJ, London GM. Arterial calcifications, arterial stiffness, and cardiovascular risk in end‐stage renal disease. Hypertension. 2001;38:938–942. [DOI] [PubMed] [Google Scholar]
- 33. Cho A, Lee Y‐K, Oh J, Yoon J‐W, Shin DH, Jeon HJ, Choi M‐J, Noh J‐W. The relationship between intradialytic hypotension and vascular calcification in hemodialysis patients. PLoS One. 2017;12:e0185846. [DOI] [PMC free article] [PubMed] [Google Scholar]
- 34. Claes KJ, Heye S, Bammens B, Kuypers DR, Meijers B, Naesens M, Vanrenterghem Y, Evenepoel P. Aortic calcifications and arterial stiffness as predictors of cardiovascular events in incident renal transplant recipients. Transpl Int. 2013;26:973–981. [DOI] [PubMed] [Google Scholar]
- 35. Disthabanchong S, Vipattawat K, Phakdeekitcharoen B, Kitiyakara C, Sumethkul V. Abdominal aorta and pelvic artery calcifications on plain radiographs may predict mortality in chronic kidney disease, hemodialysis and renal transplantation. Int Urol Nephrol. 2018;50:355–364. [DOI] [PubMed] [Google Scholar]
- 36. Fusaro M, Noale M, Viola V, Galli F, Tripepi G, Vajente N, Plebani M, Zaninotto M, Guglielmi G, Miotto D, et al. Vitamin K, vertebral fractures, vascular calcifications, and mortality: VItamin K Italian (VIKI) dialysis study. J Bone Miner Res. 2012;27:2271–2278. [DOI] [PubMed] [Google Scholar]
- 37. Górriz JL, Molina P, Cerverón MJ, Vila R, Bover J, Nieto J, Barril G, Martínez‐Castelao A, Fernández E, Escudero V, et al. Vascular calcification in patients with nondialysis CKD over 3 years. Clin J Am Soc Nephrol. 2015;10:654–666. [DOI] [PMC free article] [PubMed] [Google Scholar]
- 38. Hanada S, Ando R, Naito S, Kobayashi N, Wakabayashi M, Hata T, Sasaki S. Assessment and significance of abdominal aortic calcification in chronic kidney disease. Nephrol Dial Transplant. 2010;25:1888–1895. [DOI] [PubMed] [Google Scholar]
- 39. Hong D, Wu S, Pu L, Wang F, Wang J, Wang Z, Gao H, Zhang Y, Deng F, Li G, et al. Abdominal aortic calcification is not superior over other vascular calcification in predicting mortality in hemodialysis patients: a retrospective observational study. BMC Nephrol. 2013;14:120. [DOI] [PMC free article] [PubMed] [Google Scholar]
- 40. Huang J‐W, Lien Y‐C, Yang C‐Y, Liu K‐L, Wu C‐F, Yen C‐J, Wu C‐K, Lee J‐K, Ho S‐R, Wu H‐Y, et al. Osteoprotegerin, inflammation and dyslipidemia are associated with abdominal aortic calcification in non‐diabetic patients on peritoneal dialysis. Nutr Metab Cardiovasc Dis. 2014;24:236–242. [DOI] [PubMed] [Google Scholar]
- 41. Imanishi K, Hatakeyama S, Yamamoto H, Okamoto A, Imai A, Yoneyama T, Hashimoto Y, Koie T, Fujita T, Murakami R, et al. Post‐transplant renal function and cardiovascular events are closely associated with the aortic calcification index in renal transplant recipients. Transplant Proc. 2014;46:484–488. [DOI] [PubMed] [Google Scholar]
- 42. Kato A, Takita T, Maruyama Y, Kumagai H, Hishida A. Impact of carotid atherosclerosis on long‐term mortality in chronic hemodialysis patients. Kidney Int. 2003;64:1472–1479. [DOI] [PubMed] [Google Scholar]
- 43. Kwon HY, Lee OH, Kim MJ, Joo WC, Lee SY, Kim MJ, Song JH, Lee SW. The association between mortality and abdominal aortic calcification and relation between its progression and serum calcium concentration in chronic hemodialysis patients. Kidney Res Clin Pract. 2014;33:95–102. [DOI] [PMC free article] [PubMed] [Google Scholar]
- 44. Li LY, Dai HL, Zhang MF, Fang Y, Ni ZH. Value of abdominal aortic calcification for evaluating the prognosis of patients undergoing maintenance hemodialysis. [Chinese]. J Shanghai Jiaotong Univ (Med Sci). 2016;36:1034–1038. [Google Scholar]
- 45. Martino F, Di Loreto P, Giacomini D, Kaushik M, Rodighiero MP, Crepaldi C, Ronco C. Abdominal aortic calcification is an independent predictor of cardiovascular events in peritoneal dialysis patients. Ther Apher Dial. 2013;17:448–453. [DOI] [PubMed] [Google Scholar]
- 46. Munguia P, Caramelo R, Rubio MV, Sahdalá L, Arnaudas L, Paul J, Blasco Á, Lou LM, Aladren MJ, Sanjuan A, et al. Pre‐transplant assessment of vascular calcification as a risk factor of mortality, graft loss, and cardiovascular events in renal transplant recipients. Transplant Proc. 2015;47:2368–2370. [DOI] [PubMed] [Google Scholar]
- 47. NasrAllah MM, Nassef A, Elshaboni TH, Morise F, Osman NA, Sharaf El Din UA. Comparing different calcification scores to detect outcomes in chronic kidney disease patients with vascular calcification. Int J Cardiol. 2016;220:884–889. [DOI] [PubMed] [Google Scholar]
- 48. Ohya M, Otani H, Kimura K, Saika Y, Fujii R, Yukawa S, Shigematsu T. Vascular calcification estimated by aortic calcification area index is a significant predictive parameter of cardiovascular mortality in hemodialysis patients. Clin Exp Nephrol. 2011;15:877–883. [DOI] [PubMed] [Google Scholar]
- 49. Okuno S, Ishimura E, Kitatani K, Fujino Y, Kohno K, Maeno Y, Maekawa K, Yamakawa T, Imanishi Y, Inaba M, et al. Presence of abdominal aortic calcification is significantly associated with all‐cause and cardiovascular mortality in maintenance hemodialysis patients. Am J Kidney Dis. 2007;49:417–425. [DOI] [PubMed] [Google Scholar]
- 50. Peeters MJ, van den Brand JA, van Zuilen AD, Koster Y, Bots ML, Vervloet MG, Blankestijn PJ, Wetzels JF; MASTERPLAN Study Group . Abdominal aortic calcification in patients with CKD. J Nephrol. 2017;30:109–118. [DOI] [PMC free article] [PubMed] [Google Scholar]
- 51. Davila JA, Johnson CD, Behrenbeck TR, Hoskin TL, Harmsen WS. Assessment of cardiovascular risk status at CT colonography. Radiology. 2006;240:110–115. [DOI] [PubMed] [Google Scholar]
- 52. Harbaoui B, Montoy M, Charles P, Boussel L, Liebgott H, Girerd N, Courand PY, Lantelme P. Aorta calcification burden: towards an integrative predictor of cardiac outcome after transcatheter aortic valve implantation. Atherosclerosis. 2016;246:161–168. [DOI] [PubMed] [Google Scholar]
- 53. Harbaugh CM, Terjimanian MN, Lee JS, Alawieh AZ, Kowalsky DB, Tishberg LM, Krell RW, Holcombe SA, Wang SC, Campbell DA, et al. Abdominal aortic calcification and surgical outcomes in patients with no known cardiovascular risk factors. Ann Surg. 2013;257:774–781. [DOI] [PubMed] [Google Scholar]
- 54. Niskanen LK, Suhonen M, Siitonen O, Lehtinen JM, Uusitupa MI. Aortic and lower limb artery calcification in type 2 (non‐insulin‐dependent) diabetic patients and non‐diabetic control subjects. A five year follow‐up study. Atherosclerosis. 1990;84:61–71. [DOI] [PubMed] [Google Scholar]
- 55. Parr A, Buttner P, Shahzad A, Golledge J. Relation of infra‐renal abdominal aortic calcific deposits and cardiovascular events in patients with peripheral artery disease. Am J Cardiol. 2010;105:895–899. [DOI] [PubMed] [Google Scholar]
- 56. Zhang Y, Safar ME, Iaria P, Lieber A, Peroz J, Protogerou AD, Rajzbaum G, Blacher J. Cardiac and arterial calcifications and all‐cause mortality in the elderly: the PROTEGER study. Atherosclerosis. 2010;213:622–626. [DOI] [PubMed] [Google Scholar]
- 57. Levitzky YS, Cupples LA, Murabito JM, Kannel WB, Kiel DP, Wilson PW, Wolf PA, O'Donnell CJ. Prediction of intermittent claudication, ischemic stroke, and other cardiovascular disease by detection of abdominal aortic calcific deposits by plain lumbar radiographs. Am J Cardiol. 2008;101:326–331. [DOI] [PubMed] [Google Scholar]
- 58. Samelson EJ, Cupples LA, Broe KE, Hannan MT, O'Donnell CJ, Kiel DP. Vascular calcification in middle age and long‐term risk of hip fracture: the Framingham Study. J Bone Miner Res. 2007;22:1449–1454. [DOI] [PMC free article] [PubMed] [Google Scholar]
- 59. Walsh CR, Cupples LA, Levy D, Kiel DP, Hannan M, Wilson PW, O'Donnell CJ. Abdominal aortic calcific deposits are associated with increased risk for congestive heart failure: the Framingham Heart Study. Am Heart J. 2002;144:733–739. [DOI] [PubMed] [Google Scholar]
- 60. Estublier C, Chapurlat R, Szulc P. Association of severe disc degeneration with all‐cause mortality and abdominal aortic calcification assessed prospectively in older men: findings of a single‐center prospective study of osteoporosis in men. Arthritis Rheumatol. 2015;67:1295–1304. [DOI] [PubMed] [Google Scholar]
- 61. van der Meer IM, Bots ML, Hofman A, del Sol AI, van der Kuip DA, Witteman JC. Predictive value of noninvasive measures of atherosclerosis for incident myocardial infarction: the Rotterdam Study. Circulation. 2004;109:1089–1094. [DOI] [PubMed] [Google Scholar]
- 62. Nielsen M, Ganz M, Lauze F, Pettersen PC, de Bruijne M, Clarkson TB, Dam EB, Christiansen C, Karsdal MA. Distribution, size, shape, growth potential and extent of abdominal aortic calcified deposits predict mortality in postmenopausal women. BMC Cardiovasc Disord. 2010;10:56. [DOI] [PMC free article] [PubMed] [Google Scholar]
- 63. Verbeke F, Van Biesen W, Honkanen E, Wikstrom B, Jensen PB, Krzesinski JM, Rasmussen M, Vanholder R, Rensma PL; CORD Study Investigators . Prognostic value of aortic stiffness and calcification for cardiovascular events and mortality in dialysis patients: outcome of the calcification outcome in renal disease (CORD) study. Clin J Am Soc Nephrol. 2011;6:153–159. [DOI] [PMC free article] [PubMed] [Google Scholar]
- 64. Vezzoli G, Rubinacci A, Lazzaroni M, Soldati L. It's time for a practical method quantifying vascular calcification. J Transl Med. 2014;12:172. [DOI] [PMC free article] [PubMed] [Google Scholar]
- 65. Wang XR, Yuan L, Zhang JJ, Hao L, Wang DG. Serum sclerostin values are associated with abdominal aortic calcification and predict cardiovascular events in patients with chronic kidney disease stages 3–5D. Nephrology. 2017;22:286–292. [DOI] [PubMed] [Google Scholar]
- 66. Yoon HE, Chung S, Whang HC, Shin YR, Hwang HS, Chung HW, Park CW, Yang CW, Kim YS, Shin SJ. Abdominal aortic calcification is associated with diastolic dysfunction, mortality, and nonfatal cardiovascular events in maintenance hemodialysis patients. J Korean Med Sci. 2012;27:870–875. [DOI] [PMC free article] [PubMed] [Google Scholar]
- 67. Yoon HE, Park BG, Hwang HS, Chung S, Park CW, Yang CW, Kim YS, Shin SJ. The prognostic value of abdominal aortic calcification in peritoneal dialysis patients. Int J Med Sci. 2013;10:617–623. [DOI] [PMC free article] [PubMed] [Google Scholar]
- 68. Allison MA, Hsi S, Wassel CL, Morgan C, Ix JH, Wright CM, Criqui MH. Calcified atherosclerosis in different vascular beds and the risk of mortality. Arterioscler Thromb Vasc Biol. 2012;32:140–146. [DOI] [PubMed] [Google Scholar]
- 69. West SL, Gartlehner G, Mansfield AJ, Poole C, Tant E, Lenfestey N, Lux LJ, Amoozegar J, Morton SC, Carey TC, et al. Comparative Effectiveness Review Methods: Clinical Heterogeneity. Rockville, MD: Agency for Healthcare Research and Quality (US); 2010. Sep. Report No.: 10‐EHC070‐EF. [PubMed] [Google Scholar]
- 70. Ketteler M, Block GA, Evenepoel P, Fukagawa M, Herzog CA, McCann L, Moe SM, Shroff R, Tonelli MA, Toussaint ND. Executive summary of the 2017 KDIGO chronic kidney disease–mineral and bone disorder (CKD‐MBD) guideline update: what’s changed and why it matters. Kidney Int. 2017;92:26–36. [DOI] [PubMed] [Google Scholar]
- 71. Bastos Goncalves F, Voute MT, Hoeks SE, Chonchol MB, Boersma EE, Stolker RJ, Verhagen HJ. Calcification of the abdominal aorta as an independent predictor of cardiovascular events: a meta‐analysis. Heart. 2012;98:988–994. [DOI] [PubMed] [Google Scholar]
Associated Data
This section collects any data citations, data availability statements, or supplementary materials included in this article.
Supplementary Materials
Data S1
Tables S1–S7
Figures S1–S5