

Abstract
Background
In complex congenital heart disease patients such as those with tetralogy of Fallot, the right ventricle (RV) is subject to pressure overload, leading to RV hypertrophy and eventually RV failure. The mechanisms that promote the transition from stable RV hypertrophy to RV failure are unknown. We evaluated the role of mitochondrial bioenergetics in the development of RV failure.
Methods and Results
We created a murine model of RV pressure overload by pulmonary artery banding and compared with sham‐operated controls. Gene expression by RNA‐sequencing, oxidative stress, mitochondrial respiration, dynamics, and structure were assessed in pressure overload‐induced RV failure. RV failure was characterized by decreased expression of electron transport chain genes and mitochondrial antioxidant genes (aldehyde dehydrogenase 2 and superoxide dismutase 2) and increased expression of oxidant stress markers (heme oxygenase, 4‐hydroxynonenal). The activities of all electron transport chain complexes decreased with RV hypertrophy and further with RV failure (oxidative phosphorylation: sham 552.3±43.07 versus RV hypertrophy 334.3±30.65 versus RV failure 165.4±36.72 pmol/(s×mL), P<0.0001). Mitochondrial fission protein DRP1 (dynamin 1‐like) trended toward an increase, while MFF (mitochondrial fission factor) decreased and fusion protein OPA1 (mitochondrial dynamin like GTPase) decreased. In contrast, transcription of electron transport chain genes increased in the left ventricle of RV failure.
Conclusions
Pressure overload‐induced RV failure is characterized by decreased transcription and activity of electron transport chain complexes and increased oxidative stress which are associated with decreased energy generation. An improved understanding of the complex processes of energy generation could aid in developing novel therapies to mitigate mitochondrial dysfunction and delay the onset of RV failure.
Keywords: congenital heart disease, energy metabolism, mitochondria, oxidative stress, right ventricular pressure overload
Subject Categories: Animal Models of Human Disease, Basic Science Research, Metabolism, Myocardial Biology, Oxidant Stress
Nonstandard Abbreviations and Acronyms
- 4HNE
4‐hydroxynonenal
- ALDH2
aldehyde dehydrogenase 2
- DRP1
dynamin 1‐like
- Gadd45
growth arrest and DNA damage
- HRC
histidine‐rich calcium binding protein
- MFF
mitochondrial fission factor
- OPA1
mitochondrial dynamin like GTPase
- PAB
pulmonary artery banding
- VDAC1
voltage‐dependent anion‐selective channel protein 1
Clinical Perspective
What Is New?
Right ventricle (RV) failure is a major risk factor for mortality in patients with pulmonary hypertension and congenital heart disease.
We show for the first time that mitochondrial damage in RV hypertrophy is induced by oxidant stress attributable to lipid peroxidation by‐products such as 4HNE (4‐hydroxynonenal), which can decrease the function of the electron transport chain complexes leading to a decrease in mitochondrial energy generation and predispose to RV failure.
Interestingly, the left ventricle of RV failure hearts was characterized by increased transcription of genes involved in mitochondrial energy generation.
What Are the Clinical Implications?
An improved understanding of the mechanisms of mitochondrial dysfunction in RV hypertrophy and RV failure and the left ventricular response to the failing RV will aid in the development of novel therapeutic targets to improve mitochondrial energy generation and preserve long‐term RV function.
We have identified lipid peroxidation byproducts which could serve as potential therapeutic targets in pressure overload‐induced RV failure to improve mitochondrial energy generation and delay or prevent the onset of RV failure.
Congenital heart disease remains the most common birth defect and a significant cause of infant mortality. 1 In contrast to adult heart disease, which disproportionately involves the left ventricle, complex congenital heart disease such as tetralogy of Fallot, pulmonary atresia/intact ventricular septum, and hypoplastic left heart syndrome are subjected to right ventricular (RV) pressure overload, leading to RV hypertrophy and eventually RV failure. Although RV function is known to be a major predictor of survival, 2 , 3 , 4 the incidence and timing of RV dysfunction leading to RV failure varies 3 , 5 and current non‐invasive and invasive diagnostic modalities cannot predict which patients will progress towards RV failure, nor can they detect the preceding subclinical changes occurring on the molecular and cellular level. Further compounding this problem, standard left ventricular heart failure therapies (β‐blockers, angiotensin‐converting enzyme inhibitors, angiotensin II receptor blockers) fail to work in congenital heart disease‐associated RV failure. 6 , 7 , 8 , 9
Data from animal models of RV pressure overload have shown alterations in genes regulating extracellular matrix, cytoskeletal remodeling, reactive oxygen species production, antioxidant protection, angiogenesis, and myocardial bioenergetics. 10 , 11 , 12 We focused on the role of mitochondrial dysfunction since the heart relies heavily on mitochondrial energy production by oxidative phosphorylation. RV failure in animal models of pulmonary hypertension is known to be associated with a decrease in mitochondrial respiration, altered expression of genes involved in energy generation, and by the transition from fatty acid oxidation to glucose metabolism. However, it is not known whether RV pressure overload‐induced RV failure independent of pulmonary hypertension responds similarly. 13 , 14 , 15 Also, agents used to induce pulmonary hypertension in animal models may be direct cardiotoxins themselves which may render data generated from animal models of pulmonary hypertension inapplicable to other forms of RV pressure overload. There is also limited understanding of the activities of individual electron transport chain complexes, mitochondrial dynamics (mitochondrial biogenesis, fission, fusion), and oxidative stress on mitochondrial dysfunction in RV failure. 16 , 17 , 18 , 19 It is now recognized that physiological changes in 1 ventricle can affect the phenotype of the other ventricle such as RV pressure overload inducing electrophysiologic remodeling and fibrosis in the left ventricle. 20 , 21 , 22 While most studies have focused on the mechanical and morphological perturbations of the left ventricle attributable to RV pressure overload, little is known about the molecular basis of these changes. 23
We hypothesized that mitochondrial dysfunction begins in the stage of compensated RV hypertrophy and predisposes the RV to failure, and that mitochondrial function in the left ventricle is also affected. We used a murine model of pulmonary artery banding (PAB) 24 to induce RV pressure overload and evaluated the transcriptional changes occurring in the right and left ventricle and activity of electron transport chain complexes. An improved understanding of the complex processes of RV energetic remodeling could aid in developing novel diagnostic tools and therapeutics to mitigate mitochondrial dysfunction and delay the onset of RV failure.
Methods
The authors declare that all supporting data are available within this article and its online supplementary files.
Murine Model of RV Afterload Stress
We have previously reported on a murine model of PAB leading to RV hypertrophy and RV failure 10 (Figure 1A). We used male FVB mice aged 10 to 13 weeks for all experiments. Anesthesia was induced with 3% isoflurane and oxygen. Following tracheal intubation, anesthesia was maintained with 1.5% isoflurane and oxygen for the duration of the procedure. Via a right thoracotomy approach, a 7‐0 silk suture was tied around the main pulmonary artery to induce RV hypertrophy and RV failure. We studied mice in the following groups based on Doppler echocardiography on postoperative day 7: (1) “RV hypertrophy”: PAB gradient of >30 mm Hg (n=6), and (2) “RV failure”: PAB gradient >30 mm Hg and evidence of heart failure with lethargy, tachypnea, and ascites (n=7). RV hypertrophy and RV failure groups were compared with age‐matched, sham‐operated controls (n=6) that underwent identical surgical procedures with the exception of placement of the PAB. Animals with RV hypertrophy were sacrificed at 3 weeks, and RV failure at 1 week. Based on our previous work, the murine model of pulmonary artery banding results in a survival half‐time for the RV failure group versus RV hypertrophy group of 19.6 days versus 50.8 days. While both groups develop RV failure, the time to development of RV failure is variable. We therefore selected a time point when all the mice in the RV failure group uniformly develop RV failure, ie, 1 week and when all the mice in the RV hypertrophy group are stable with no evidence of RV failure, ie, 3 weeks. This ensured that all the mice were exposed to the pulmonary artery band for the same period of time before heart‐failure related mortality set in. 10
Figure 1. Pulmonary artery banding leads to right ventricular hypertrophy and failure.
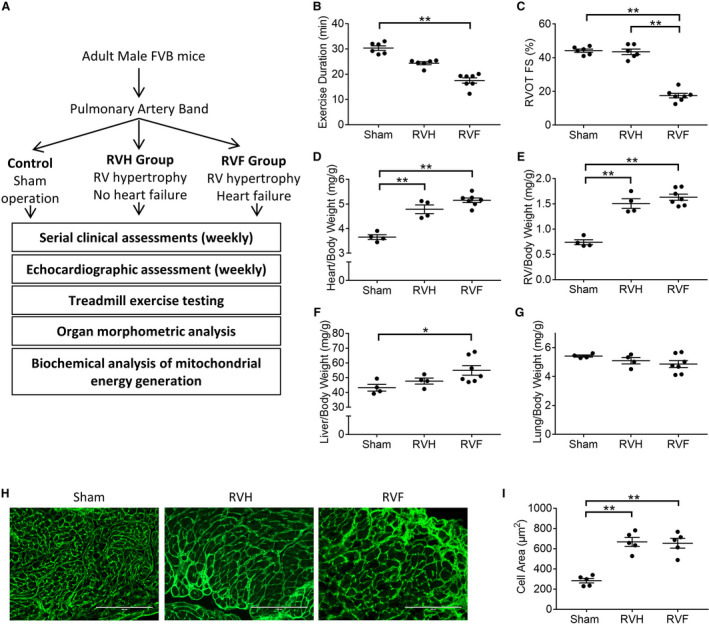
A, Assessment algorithm (B) right ventricle hypertrophy and right ventricle failure are characterized by decreasing exercise duration (n=6–7/group), (C) right ventricle failure is characterized by decreased shortening fraction (n=6–7/group). There is a progressive increase in (D) heart weight, (E) right ventricle weight, and (F) liver enlargement in right ventricle hypertrophy and right ventricle failure while (G) lung weight is unchanged (n=4–7/group). H and I, Wheat‐germ agglutinin staining (shown in green) demonstrates cardiomyocyte hypertrophy in right ventricle hypertrophy and right ventricle failure (n=5/group). Scale bars are 200 μm. Data are presented as mean±SEM. All data were analyzed with one‐way ANOVA, except for B, which was analyzed with Kruskal‒Wallis test. RV indicates right ventricle; RVF, RV failure; and RVH, RV hypertrophy. *P<0.05, **P<0.01.
Echocardiography
Sedated transthoracic echocardiography (1‐L oxygen and 1.5% isoflurane) was performed weekly on all mice using a Vivid 7 ultrasound system (GE, Boston, MA) with a 14 MHz probe. 11 Two‐dimensional echocardiography, color, and pulse‐wave Doppler, and M‐mode echocardiography were used to evaluate RV size and function, tricuspid regurgitation, PAB gradient, and left ventricular function.
Graded Treadmill Exercise
Exercise testing was performed 2 days before euthanasia with an Oxymax metabolic chamber and software (Columbus Instruments, Columbus, OH) using our previously described ramped exercise protocol. 25 Exercise testing continued until the mice showed signs of exhaustion by spending >50% of the time or 15 seconds consecutively on the shock grid.
Histopathology
Following organ harvesting, heart, lungs, and liver were weighed. Frozen cross‐sections of the heart were labeled with wheat‐germ agglutinin conjugate to determine myocyte cross‐sectional area and 100 cells were measured per sample (n=5/group). In a separate set of animals, the RV free wall was separated from the interventricular septum and left ventricle and used for RNA and protein expression, electron microscopy, and mitochondrial analysis described below.
RNA Sequencing
Bulk RNA sequencing was performed on mRNA isolated from the hearts from the following groups: (1) sham right ventricle, (2) sham left ventricle, (3) RV from the failing right ventricle, and (4) left ventricle from the same heart with RV failure (n=4/group). Total RNA from right and left ventricles were isolated using miRNeasy Mini Kit (217004; Qiagen, Germantown, MD) following the manufacturer's guidelines. The total RNA samples were poly(A)‐enriched and sequenced at the Genome Technology Access Center (Washington University, St. Louis, MO). Sequencing was performed using the Illumina HiSeq platform, yielding single end, 50 bp reads at 30 million reads per sample.
FastQC 26 v0.11.5 was used to provide quality control checks on the raw RNA‐Sequencing data. STAR 27 v2.5.3a was used to align the RNA‐Seq reads to the mouse reference genome (mm9). Cuffdiff 28 v2.2.1 statistical package was used to perform differential expression analysis for RNA‐Seq based on gene and transcript abundance measurements in terms of fragments per kilobase of transcript per million mapped reads, as previously described. R v3.3.1 statistical package and CummeRbund 29 v2.16.0 R/Bioconductor package were used for visualization of the various output files of the Cuffdiff differential expression analysis (Figures S1 and S2). Pathway and gene ontology analyses were performed through Advaita Bioinformatics (Ann Arbor, MI). The pathway analysis was performed using the Impact Analysis method, which assesses the over‐representation and perturbations of differentially expressed genes in a given pathway. 30 , 31 , 32 Details of the Impact Analysis method are enumerated in Data S1. Kyoto encyclopedia of genes and genomes pathway maps were generated by iPathwayGuide (www.advaitabio.com). 33 , 34 , 35
The RNA sequencing raw data are uploaded to Gene Expression Omnibus (https://www.ncbi.nlm.nih.gov/gds/) accession number: GSE152413.
Real‐Time Quantitative Polymerase Chain Reaction for RNA‐Sequencing Data Validation
Orthogonal validation was performed by using a new set of animals separate from those used for RNA sequencing. Gene expression were assessed in a one‐step real‐time quantitative polymerase chain reaction kit (204243; Qiagen), using β‐actin as the housekeeping gene. Primers used are listed in Table S1. Expression fold change was calculated using the 2−ΔΔCt method. 36
Mitochondrial Isolation
We isolated mitochondria from the RV free wall using a differential centrifugation method. The isolation steps were performed at 4°C. The tissue was finely dry‐minced, gently homogenized in 700 μL of cold isolation buffer (0.25 mol/L sucrose, 5 mmol/L HEPES, 1 mmol/L EDTA; pH 7.2) using a commercially available Teflon‐coated pestle drill and a glass tube. The homogenate was centrifuged at 600 rcf at 4°C for 3 minutes, and the supernatant was centrifuged at 10 000 rcf for 5 minutes. The resulting supernatant (cytosolic fraction) was collected and set aside, and the remaining mitochondrial pellet was gently resuspended in 1 mL of cold isolation buffer and again centrifuged at 10 000 rcf for 5 minutes. The pellet was gently resuspended in 100 μL of isolation buffer and stored at −80°C until use. Isolated mitochondrial purity was confirmed by the presence of the mitochondrial marker voltage‐dependent anion‐selective channel protein and the absence of the cytosolic marker Enolase as previously shown. 37
Western Blot
Standard Western blot techniques using denaturing and reducing conditions (SDS‐PAGE) were used to analyze protein expression in RV tissues both from whole‐tissue lysate and isolated mitochondria. The following antibodies were used: 4HNE (4‐hydroxynonenal); VDAC1 (Voltage‐dependent anion‐selective channel protein 1); DRP1 (dynamin 1‐like); MFF (mitochondrial fission factor); OPA1 (mitochondrial dynamin like GTPase). Enolase was used as the loading control. Details of the antibodies used are shown in Table S2.
Oxygen Consumption as a Measure of Mitochondrial Energy Generation
Using high resolution Oxygraph‐2K respirometer (Oroboros Instruments; Innsbruck, Austria), we assessed oxygen consumption in 5 mg of finely minced, fresh RV tissue. Leak respiration was assessed in the absence of exogenous ADP, where (1) malate and glutamate were used to evaluate complex I, nicotinamide adenine dinucleotide dehydrogenase activity, and (2) succinate was used to evaluate complex II, succinate dehydrogenase activity. Subsequently, ADP was added to evaluate State 3 respiration‐ATP synthase activity, representing the maximal physiological respiration or oxidative phosphorylation. Respiratory control ratio was calculated by dividing State 3 respiration by leak respiration. Quality control was performed using the following reagents: oligomycin for non‐phosphorylating respiration (State 4), carbonyl cyanide‐p‐trifluoromethoxyphenylhydrazone for uncoupled respiration, and antimycin A for confirming near‐abolishment of respiration in the absence of mitochondrial activity. The oxygen consumption rates are reported as O2 flux per volume (pmol/(s×mL)). Reagents used are shown in Table S3.
In our study, we have determined our assay buffer sufficiently permeabilized the sample tissues in the absence of permeabilizing reagents such as saponin. Entry of the mitochondrial substrates into the minced tissues was evidenced by (1) robust oxygen consumption after administration of mitochondrial substrates, and (2) State 3 respiration mediated by cell‐impermeable exogenous ADP was similar to uncoupled respiration, which is mediated by cell‐permeable carbonyl cyanide‐p‐trifluoromethoxyphenylhydrazone. In contrast, our preliminary test using Dulbecco phosphate buffered solution instead of the assay buffer demonstrated only negligible levels of oxygen consumption (Figure S3).
Mitochondrial DNA Copy Number Assay
Mitochondrial to nuclear DNA copy number ratio was assayed, following a previously established protocol. 38 DNA was isolated from RV tissues and compared with sham using Genomic‐tip 20/G (10223; Qiagen). Real time quantitative PCR was performed with primers for mitochondrial and nuclear DNA, 38 using PowerUp SYBR Green Master mix (A25742; Applied Biosystems; Foster City, CA). Mitochondrial DNA (mtDNA) that is not duplicated in the nuclear genome was measured, which was then compared with the nuclear DNA copy number, as measured by beta‐2 microglobulin.
Electron Microscopy
RV mitochondrial morphology was assessed using transmission electron microscopy (JEM 1400; JEOL; Peabody, MA). RV samples were fixed overnight (2% glutaraldehyde, 4% paraformaldehyde, 0.1 mol/L sodium cacodylate, pH 7.4) and stained with uranyl acetate and lead citrate for imaging. Intermyofibrillar mitochondrial morphology were analyzed by ImageJ (National Institutes of Health; Bethesda, MD). At least 250 mitochondria per sample were scored by a masked investigator, tracing all complete mitochondrial perimeters in each image. Cristae density was calculated by using the thresholding function in Fiji 39 to remove non‐cristae area within the mitochondria, then comparing these results with the area of each mitochondrion.
4HNE Treatment of Cardiomyocytes
HL1 cardiomyocytes were cultured in a humidified 5% CO2, 37°C incubator with complete Claycomb medium (51800C; Sigma‐Aldrich; St. Louis, MO) containing 10% FBS, 2 mmol/L GlutaMAX (35‐050‐061; ThermoFisher Scientific; Waltham, MA), 100 µmol/L norepinephrine (A0937; Sigma‐Aldrich), 300 nmol/L ascorbic acid (A7506; Sigma‐Aldrich), and 100 U/mL penicillin‐streptomycin (P4333; Sigma‐Aldrich). The HL1 cells were treated for 1 hour with 50 µmol/L of 4HNE (32100; Cayman Chemical; Ann Arbor, MI), where ethanol was used as the vehicle. 100 and 200 µmol/L 4HNE treated cells demonstrated decreased cell viability by 3,[4,5‐dimethylthiazol‐2‐ yl]‐2,5‐diphenyl‐tetrazolium bromide assay (Figure S4A) and mitochondrial swelling suggestive of imminent cell death while 50 µmol/L 4HNE treated cells did not (Figure S4B). Thus, to investigate the effect of 4HNE at a sublethal dose, 50 μmol/L 4HNE was used. The effect of 4HNE treatment on HL1 cardiomyocytes was similar to that seen in human induced pluripotent stem‐cell derived cardiomyocytes as we have previously shown. 37 We therefore used HL1 cardiomyocytes in this study since it is a readily accessible source of cardiomyocyte mitochondria of consistent quality.
Fluorescence Imaging and Quantification of Mitochondrial Morphometric Parameters
HL1 cells were treated with 4HNE and then treated with 50 nmol/L MitoTracker Red CMXRos and 1:2000 diluted Hoechst 33342 nuclear stain (I36007, ThermoFisher Scientific) for 15 minutes in hank's balanced salt solution. The cells were washed and fixed with 4% formaldehyde in PBS for 15 minutes at room temperature and imaged with a fluorescence microscope. Mitochondrial analysis was performed by an investigator masked to the sample identity. Fluorescence micrographs of mitochondria were quantified using FIJI 39 via custom macros; 15 to 18 pictures were analyzed per group. The micrographs were background‐subtracted with rolling‐ball radius of 5, followed by 10 pixels, then de‐noised via the Despeckle function and the signals were normalized with the Enhance Contrast function. The processed images were then subjected to a threshold cutoff to select the mitochondria, which were subsequently analyzed via the Analyze Particle function.
Statistical Analysis
Student t‐test was used for 2‐group comparison of normally distributed data. ANOVA was used for ≥3 group comparisons, performed on continuous, normally distributed data. D'Agostino and Pearson normality test was used for data with n≥8 and Shapiro‐Wilk normality test was used when n<8. Tukey multiple comparisons test was performed for calculating differences between each group. For non‐normal data, Kruskal‒Wallis test was used. Data are presented as mean±SEM. A P value of ≤0.05 was considered significant. All RNA‐sequencing data were analyzed based on the q values (false discovery rate‐corrected P values) and a ±1.5‐fold change cutoff. A q value of ≤0.05 was considered significant for all RNA‐sequencing data.
Study Approval
All procedures were performed in accordance with National Institutes of Health standards and were approved by the Administrative Panel on Laboratory Animal Care at Stanford University.
Results
RV Failure is Characterized by Impaired Exercise Capacity and Systolic Dysfunction
PAB was used to create RV pressure overload leading to RV hypertrophy and RV failure. Our PAB model demonstrates many of the findings seen in patients with congenital heart disease with RV hypertrophy and RV failure (Figure 1A). Exercise duration decreased with RV hypertrophy and further decreased with RV failure (sham [30.33±0.9] versus RV hypertrophy [24.35±0.6] versus RV failure [17.5±1.05] minutes; P≤0.001) (Figure 1B). RV outflow tract fractional shortening, an indicator of RV systolic function was preserved with RV hypertrophy and decreased with RV failure (sham [44.17±0.95%] versus RV hypertrophy [43.5±1.63%] versus RV failure [17.5±1.35%]; P<0.0001) (Figure 1C). In addition, decreased activity, tachypnea, and abdominal ascites were seen with RV failure. Tricuspid valve E/A ratio is increased in RV hypertrophy and failure indicating RV diastolic dysfunction (sham [0.86±0.1] versus RV hypertrophy [2.1±0.3] versus RV failure [1.9±0.4]; P≤0.01). Left ventricular shortening fraction was preserved (sham [45±1.9%] versus RV hypertrophy [48±2.1%] versus RV failure [49±2.7%]).
Organ Morphometrics
Following PAB, heart weight and RV weight increased with RV hypertrophy and RV failure, but liver weight was increased only in RV failure (Figure 1D through 1F). Lung weight was not increased (Figure 1G). Cardiomyocyte cell area increased in RV hypertrophy and RV failure (sham [283.4±22.11] versus RV hypertrophy [667.2±43.94] versus RV failure [653.6±48.32] μm2; P<0.0001) (Figure 1H and 1I).
Cytoskeletal and Profibrotic Pathways are Upregulated in RV Failure
Having confirmed the clinical fidelity of our PAB model in producing RV hypertrophy and RV failure, we next performed RNA‐sequencing to assess differential gene expression between sham RV and RV failure. Among the 23 947 genes analyzed, 1946 genes were differentially expressed with ±1.5‐fold change cutoff in sham RV versus RV failure. We identified gene upregulation clustered in the following pathways (Table 1): (1) extracellular matrix‐receptor interactions—collagens, fibronectins, and thrombospondins were the most highly expressed genes (Figure S5; q=2E‐5); (2) regulation of actin cytoskeleton—actin assembly regulators were the most highly expressed genes (Figure S6; q=1.8E‐4); (3) focal adhesion pathway—thrombospondins and cyclins were the most highly expressed genes (Figure S7; q=2.5E‐4) and (4) transforming growth factor‐β signaling—thrombospondin 1, transforming growth factor‐β and its receptors and bone morphogenetic protein‐4 were among the most highly expressed genes (Figure S8; q=5.7E‐3). Upregulation of many of these genes suggests a profibrotic milieu. Pathway analysis also identified downregulation of myosin light chain 2 and 7, suggesting defects in cardiac contractility.
Table 1.
Top 10 Dysregulated Pathways and Gene Ontology Terms in the Right Ventricle in Right Ventricle Failure
| Pathways | Gene Ontology | |||
|---|---|---|---|---|
| Name | Changes | Biological Processes | Molecular Functions | Cellular Components |
| Oxidative phosphorylation | ↓ | Response to stimulus | Extracellular matrix structural constituent | Extracellular region |
| ECM‐receptor interaction | ↑ | Movement of cell or subcellular component | Protein binding | Extracellular region part |
| Alzheimer disease | ↓ | Cell communication | Extracellular matrix structural constituent conferring tensile strength | Extracellular space |
| Proteoglycans in cancer | ↑ | Signaling | Signaling receptor binding | Cell periphery |
| Regulation of actin cytoskeleton | ↑ | Multicellular organismal process | Integrin binding | Collagen‐containing extracellular matrix |
| Parkinson disease | ↓ | Response to chemical | Receptor ligand activity | Extracellular matrix |
| Protein digestion and absorption | ↑ | Signal transduction | Receptor regulator activity | Plasma membrane |
| Thermogenesis | ↓ | Regulation of multicellular organismal process | Growth factor binding | Plasma membrane part |
| Focal adhesion | ↑ | Regulation of localization | Cell adhesion molecule binding | Plasma membrane region |
| Huntington disease | ↓ | Regulation of response to stimulus | Insulin‐like growth factor binding | Cell surface |
RNA sequencing of RV myocardium from RV pressure overload‐induced RV failure identified the following significantly dysregulated pathways (q≤0.0035); Gene Ontology‐Biological Processes (q≤3.78E‐11); Gene Ontology‐Molecular Functions (q≤0.00047); Gene Ontology‐Cellular Components (q≤6.34E‐08). The maximum q value of the 10 pathways and gene ontology terms has been shown. ↑ indicates upregulated; ↓, downregulated, ECM, extracellular matrix; and RV, right ventricle.
Electron Transport Chain Genes are Downregulated in RV Failure
Pathway analysis revealed downregulation of oxidative phosphorylation as the most significantly affected pathway (Table 1). Genes involved in oxidative phosphorylation were the most significantly downregulated genes in RV failure (Figure 2A and 2B; q=2E‐6). The expression of multiple electron transport chain genes was decreased, including subunits of complex I, nicotinamide adenine dinucleotide dehydrogenase; complex II, succinate dehydrogenase; complex III, cytochrome c reductase; complex IV, cytochrome c oxidase; and complex V, ATP synthase. Concomitantly, the expression of V‐type ATPase, which is a proton pump that uses the energy from ATP hydrolysis to generate a proton gradient, a function that is the opposite of ATP synthases, was increased. Pathways related to Alzheimer disease, Parkinson disease, and Huntington disease were also highly downregulated with many of the genes in these pathways related to cell communication and regulation of the response to stimuli.
Figure 2. Oxidative phosphorylation genes are downregulated in pressure overload‐induced right ventricle (RV) failure but upregulated in the left ventricle (LV) of RV failure.
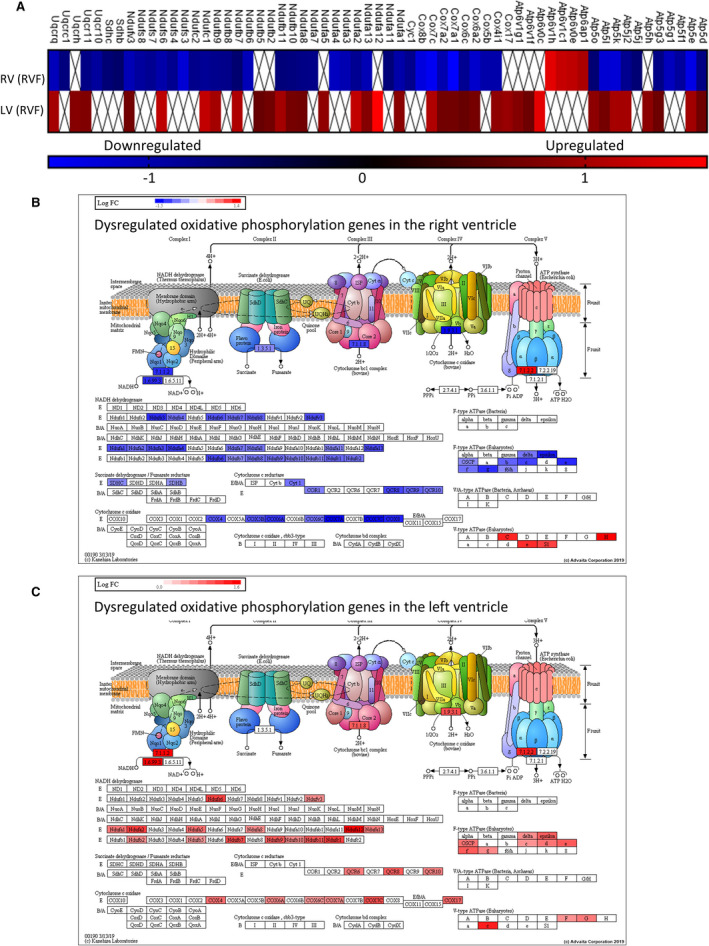
A, Oxidative phosphorylation genes dysregulated in RV failure (vs Sham RV) were compared with genes dysregulated in the LV (vs Sham LV) of RV failure hearts (n=4/group). Complex I, II, III, and V genes and cytochrome oxidase genes are downregulated in RV failure. ☒ indicates omitted values due to the cutoff set at ±0.6 log2 fold difference. The scale unit is log2 fold change. RV failure vs Sham RV q value=2.0E‐6 and LV of RV failure vs Sham LV q value=1.46E‐8. Graphical representations of the site of dysregulated oxidative phosphorylation genes in (B) RV failure and (C) LV of RV failure hearts. Blue—downregulated, Red—upregulated. The figures for (B and C) were obtained with iPathwayGuide (www.advaitabio.com) using OXPHOS pathway data from the kyoto encyclopedia of genes and genomes resource, pathway #00190. 33 , 34 , 35 LV indicates left ventricle; and RV, right ventricle.
Bioenergetic and Contractile Pathways are Upregulated in the Left Ventricle in RV Failure
To evaluate whether the downregulation of electron transport chain genes was restricted to the pressure loaded, failing RV, we also assessed gene expression in the left ventricle of RV failure hearts in which left ventricular systolic function was unchanged compared with sham animals, as previously mentioned. 887 genes were differentially expressed with ±0.6 log2 fold change cutoff in sham left ventricle versus left ventricle from RV failure. Pathway analysis highlighted upregulation of ribosome (Figure S9; q=1.20E‐13), oxidative phosphorylation, hypoxia inducible factor‐1 signaling, thermogenesis, and genes related to non‐alcoholic fatty liver disease, Parkinson disease, Huntington disease, and Alzheimer disease (Table 2). These findings are also corroborated by allocation of regulated genes to Gene Ontology terms, as most of the top dysregulated terms are related to protein translation and bioenergetics. Other affected pathways include increases in ATG8 (autophagy‐related protein 8) and Gadd45 (growth arrest and DNA damage‐inducible 45 protein), which are involved in autophagy and oxidative stress resistance/DNA repair processes, respectively (forkhead box signaling; Figure S10; q=1.1E‐3), decrease in insulin receptor, and its downstream target IRS‐1 (insulin receptor substrate‐1 protein) (insulin resistance; Figure S11; q=0.003), and upregulation of pathways involved in cardiac muscle contraction with increase in troponin C and myosin (Figure S12; q=0.0053). Oxidative phosphorylation was the most significantly perturbed pathway in both the RV and the left ventricle (Figure 2A). In the failing RV versus sham RV, genes involved in oxidative phosphorylation were downregulated (Figure 2B; q=2.0E‐6). In contrast, the left ventricle from RV failure versus sham left ventricle showed an upregulation of 36 electron transport chain genes (Figure 2C, q=1.46E‐8).
Table 2.
Top 10 Dysregulated Pathways and Gene Ontology Terms in the Left Ventricle in Right Ventricle Failure
| Pathways | Gene Ontology | |||
|---|---|---|---|---|
| Name | Changes | Biological Processes | Molecular Functions | Cellular Components |
| Ribosome | ↑ | Translation | Structural constituent of ribosome | Cytosolic ribosome |
| Oxidative phosphorylation | ↑ | Peptide metabolic process | Structural molecule activity | Extracellular space |
| Non‐alcoholic fatty liver disease | ↑ | Peptide biosynthetic process | rRNA binding | Ribosome |
| Parkinson disease | ↑ | Amide biosynthetic process | Translation factor activity, RNA binding | Cytosolic part |
| Huntington disease | ↑ | Cellular amide metabolic process | Neurotransmitter receptor activity | Extracellular region part |
| Alzheimer disease | ↑ | Multicellular organismal process | Extracellular matrix structural constituent | Cytosolic small ribosomal subunit |
| Forkhead box signaling pathway | ↑ | Regulation of multicellular organismal process | Protein‐containing complex binding | Ribosomal subunit |
| HIF‐1 signaling pathway | Mixed | ATP metabolic process | Translation initiation factor activity | Collagen‐containing extracellular matrix |
| Insulin resistance | ↓ | Ribosomal small subunit assembly | Proton transmembrane transporter activity | Extracellular region |
| Thermogenesis | ↑ | Purine nucleoside monophosphate metabolic process | Extracellular matrix binding | Extracellular matrix |
RNA sequencing of left ventricular myocardium from RV pressure overload‐induced RV failure identified the following significantly dysregulated pathways (q≤0.004); Gene Ontology‐Biological Processes (q≤0.0007); Gene Ontology‐Molecular Functions (q≤0.01); Gene Ontology‐Cellular Components (q≤6.35E‐09). The maximum q value of the 10 pathways and gene ontology terms has been shown. ↑ indicates upregulated; ↓, downregulated. HIF‐1, hypoxia inducible factor‐1; and RV, right ventricle.
Mitochondrial Antioxidant Defense Genes and Mitochondria‐Mediated Antiapoptotic Genes are Downregulated in RV Failure
We next evaluated genes which play a critical role in mitigating mitochondrial oxidant stress as a potential mechanism for the downregulation of electron transport chain genes (Figure 3A). Mitochondrial antioxidant defenses via aldehyde dehydrogenase 2 showed significantly decreased gene expression in RV failure versus sham (37.4% decrease; q=0.0007), while superoxide dismutase 2 was unchanged (q=0.406). Heme oxygenase 1, an oxidative stress marker trended toward being increased (51.8% increase; q=0.088). Mitochondrial housekeeping genes VDAC1 and citrate synthase expression did not change in RV failure versus sham (VDAC1, q=0.599; citrate synthase, q=0.522). Maintenance of calcium homeostasis and repressing mitochondria‐mediated apoptotic and necrotic cell death pathways via HRC (histidine‐rich calcium binding protein) showed significantly decreased gene expression in RV failure versus sham (43.6% decrease; q=0.0007). These data were corroborated by real‐time quantitative polymerase chain reaction data in which all the above genes were significantly decreased while heme oxygenase 1 was significantly increased in RV failure versus sham (Figure 3B). The increase in oxidative stress was also confirmed with Western blot by probing for 4HNE‐adduction of proteins, a marker of lipid peroxidation and a potent form of oxidative stress (Figure 3C and 3D; sham [1.00±0.13] versus RV failure [2.26±0.17]; P=0.0006). These data demonstrate increased oxidant stress, decreased antioxidant defenses, and increased cell death pathways in RV failure.
Figure 3. Right ventricle (RV) failure is characterized by increased oxidative stress.
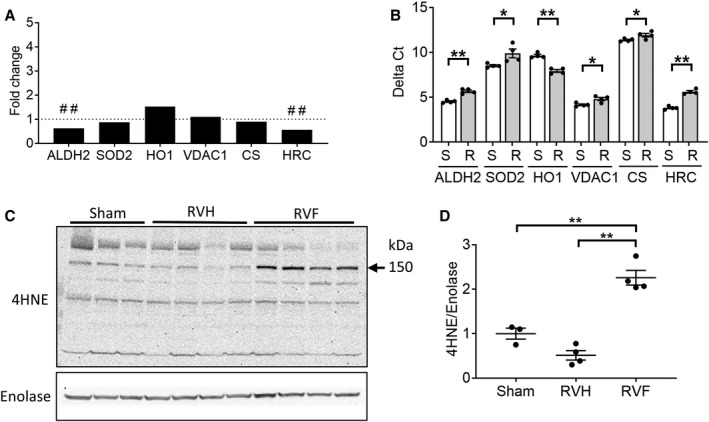
A, RV failure compared with sham‐operated RV controls demonstrated deceased expression in antioxidant defense genes (aldehyde dehydrogenase 2, superoxide dismustase 2), increased expression of the oxidative stress marker, heme oxygenase 1, decreased expression of the repressor of mitochondrial apoptosis (HRC [histidine rich calcium binding protein]) while the expression of mitochondrial housekeeping genes (voltage‐dependent anion channel, citrate synthase) were unchanged (n=4/group). B, The same genes were validated by real‐time quantitative polymerase chain reaction and demonstrated decreased expression of aldehyde dehydrogenase 2, superoxide dismutase 2, and HRC and increased expression of heme oxygenase 1 in RV failure compared with sham‐operated RV controls using t‐test (n=4/group). Raw data are shown as Delta Ct=Ct (target gene)−Ct (β‐actin housekeeping gene). A decrease in delta Ct denotes an increase in expression. C and D, Protein expression of 4HNE (4‐hydroxynonenal), a marker of oxidative stress, was increased in RV failure using one‐way ANOVA, (n=3–4/group). Data are presented as mean±SEM. 4HNE indicates 4‐hydroxynonenal; ALDH2, aldehyde dehydrogenase 2; CS, citrate synthase; HO1, heme oxygenase 1; HRC, histidine rich calcium binding protein; RV, right ventricle; RVF, RV failure; RVH, RV hypertrophy; SOD2, superoxide dismutase 2; and VDAC1, voltage‐dependent anion‐selective channel protein 1. ##q<0.01, *P<0.05, **P<0.01.
Myocardial Oxygen Consumption is Impaired in RV Hypertrophy and RV Failure
We next assessed RV myocardial oxygen consumption to evaluate the functional consequences of downregulated electron transport chain genes and increase in oxidant stress in RV hypertrophy and RV failure. We used high resolution respirometry and evaluated oxygen consumption as a marker of mitochondrial respiratory capacity and ATP generation. There was a decrease in oxygen consumption across all electron transport chain complexes with RV hypertrophy and a further decrease with RV failure. Leak respiration indicates oxygen consumption without energy generation attributable to proton leakage in the mitochondria. Complex I‐mediated leak respiration declined progressively with RV hypertrophy and RV failure (sham [117.60±6.42] versus RV hypertrophy [94.28±6.54] versus RV failure [66.86±6.34] pmol/(s×mL); P=0.0001), and complex I‐ and complex II‐mediated leak respiration only trended toward a decrease with RV hypertrophy but significantly decreased in RV failure (sham [191.96±9.26] versus RV hypertrophy [165.03±7.31] versus RV failure [117.02±9.99] pmol/(s×mL); P<0.0001) (Figure 4A through 4C). The rate of oxidative phosphorylation (ADP‐mediated ATP synthesis) progressively declined with RV hypertrophy and failure (sham 552.30±43.07 versus RV hypertrophy 334.35±30.65 versus RV failure 165.43±36.72 pmol/(s×mL); P<0.0001) (Figure 4D). The respiratory control ratio, which compares the ADP‐mediated maximal respiration (State 3) against leak respiration, is a measure of mitochondrial energy generation and coupling of the electron transport chain to oxidative phosphorylation. The respiratory control ratio also trended toward a decrease in RV hypertrophy and significantly decreased in RV failure (sham [3.88±0.20] versus RV hypertrophy [3.10±0.21] versus RV failure [2.47±0.33] pmol/(s×mL); P=0.0007) (Figure 4E). These data demonstrate that RV hypertrophy, and especially RV failure, show a decrease in the rate of mitochondrial energy generation.
Figure 4. Mitochondrial energy generation is impaired in right ventricle (RV) hypertrophy and RV failure.
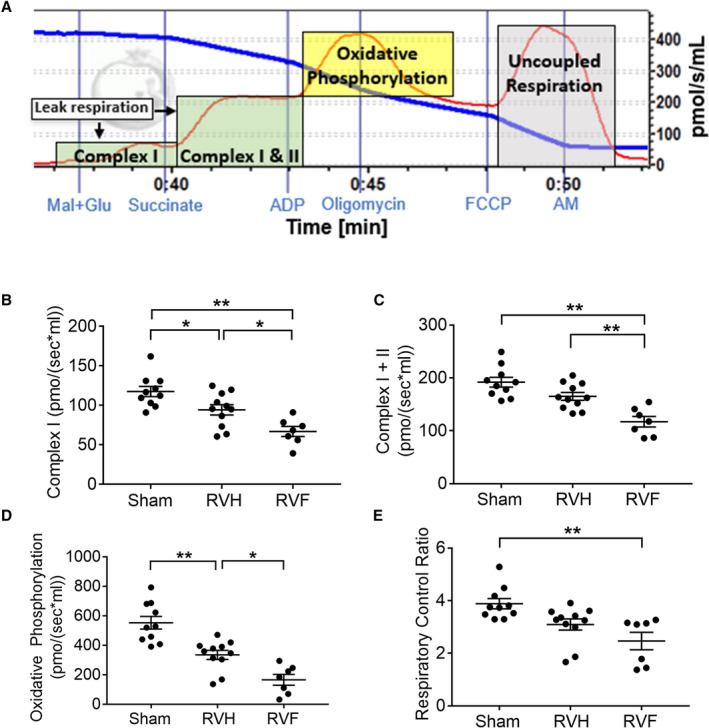
We used a high‐resolution Oxygraph2K respirometer to measure oxygen consumption in RV myocardium. A, A representative oxygen consumption [pmol/s per mL] tracing is shown for myocardial tissue (red curve). The blue curve represents oxygen concentration in the assay chamber. We evaluated oxygen consumption rates attributable to leak respiration during substrate usage by complex I, nicotinamide adenine dinucleotide dehydrogenase and complex II, succinate dehydrogenase (green shades), and because of oxidative phosphorylation by complex V, ATP synthase (yellow shade). RV hypertrophy and RV failure are characterized by a decrease in (B and C) leak respiration, (D) oxidative phosphorylation, and (E) respiratory control ratio, (n=7–11/group). Data are presented as mean±SEM. One‐way ANOVA was used for all data, except for E, which used Kruskal‒Wallis test. AM indicates antimycin A; FCCP, carbonyl cyanide‐p‐trifluoromethoxyphenylhydrazone; Mal+Glu, malate and glutamate; RV, right ventricle; RVF, right ventricular failure; and RVH, RV hypertrophy. *P<0.05, **P<0.01.
Mitochondrial Fission and Fusion Proteins Increase in RV Hypertrophy and Decrease in RV Failure
We next assessed mitochondrial fission and fusion in RV hypertrophy and RV failure. The gene expression of mitochondrial dynamics proteins was assessed by RNA sequencing, which showed that DRP1 expression trended toward an increase (25.4% increase; q=0.24), while MFF (59.5% increase; q=0.01) and OPA1 (mitochondrial dynamin like GTPase) (87.8% increase; q=0.001) expression increased in RV failure. Fission proteins DRP1 and MFF were increased by 32% (P=0.058) and 61% (P=0.011) in RV hypertrophy but subsequently decreased by 39.4% (P=0.0062) and 58% (P=0.0005) in RV failure, respectively (Figure 5A through 5C). Similarly, both long (fusion) and short (non‐fusion) isoforms of protein OPA1 were increased in RV hypertrophy (long isoforms: 86.4%; P=0.0073) but subsequently decreased in RV failure (long isoforms: 62.4; P=0.0007) (Figure 5D and 5E). Therefore, the expression of mitochondrial dynamics proteins is increased in RV hypertrophy followed by a decrease in RV failure.
Figure 5. Mitochondrial dynamics are decreased in right ventricle (RV) failure.
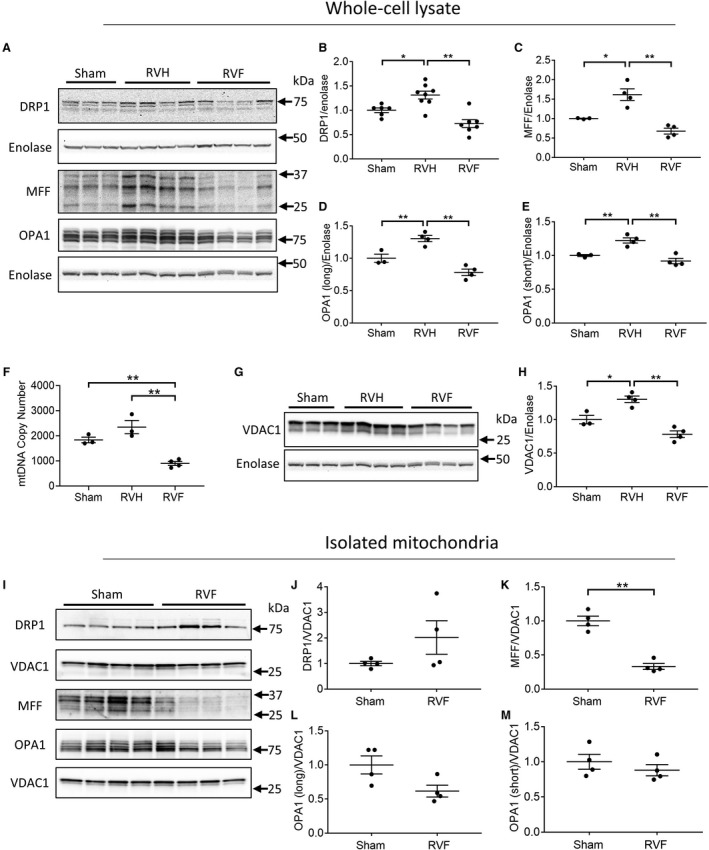
A, Representative Western blot gels of mitochondrial dynamics proteins in sham, RV hypertrophy, and RV failure; (B through E) The expression of mitochondrial dynamics proteins increases in RV hypertrophy and decreases in RV failure, as demonstrated by the expression of (B and C) fission proteins DRP1 (dynamin 1‐like) and MFF (mitochondrial fission factor) and (D and E) fusion proteins OPA1 (mitochondrial dynamin like GTPase), long and short isoform (n=3–8/group). F, Mitochondrial biogenesis measured by the mitochondrial to nuclear DNA ratio was stable in RV hypertrophy and decreased in RV failure (n=3–4/group). G and H, Mitochondrial mass measured by VDAC1 (voltage‐dependent anion‐selective channel protein 1) expression increased in RV hypertrophy and decreased in RV failure (n=3–4/group). I, Representative Western blot gels of mitochondrial dynamics proteins from isolated mitochondria. J through M, The expression of mitochondrial dynamics proteins in isolated mitochondria demonstrated (J) no change in DRP1 expression, (K and L) a decrease in MFF and OPA1 long isoform expression, and (M) no change in OPA1 short isoform expression. Data are presented as mean±SEM. One‐way ANOVA was used for (B through H), and Student t‐test was used for (J through M). DRP1 indicates dynamin 1‐like; MFF, mitochondrial fission factor; mtDNA, mitochondrial DNA; OPA1, mitochondrial dynamin like GTPase; RV, right ventricle; RVF, RV failure; RVH, RV hypertrophy; and VDAC1, voltage‐dependent anion‐selective channel protein 1. *P<0.05, **P<0.01.
We next assessed whether changes in mitochondrial dynamics proteins are related to changes in mitochondrial mass. Mitochondrial biogenesis measured by the mtDNA copy number was maintained for RV hypertrophy and decreased in RV failure (sham [1833±112.6] versus RV hypertrophy [2345±262.2] versus RV failure [897±77.4]; P=0.0008) (Figure 5F). Similarly, mitochondrial mass measured by VDAC1, increased in RV hypertrophy and decreased in RV failure (sham [1.00±0.06] versus RV hypertrophy [1.30±0.05] versus RV failure [0.78±0.05]; P=0.0003) (Figure 5G and 5H). This suggests that the changes in mitochondrial dynamics proteins in RV hypertrophy and RV failure were secondary to the changes in mitochondrial mass. To further assess whether mitochondrial dynamics proteins were indeed decreased in RV failure, we assessed mitochondrial dynamics protein expression in isolated mitochondria (Figure 5I through 5M). We demonstrate a trend toward an increase in DRP1 expression but a decrease in MFF expression by 66% (P=0.0002) and OPA1 (long isoform) expression by 40% (P=0.051) similar to total protein data. Thus, a decrease in mitochondrial mass, both an increase and a decrease in mitochondrial fission proteins and a decrease in mitochondrial fusion proteins characterize mitochondrial dynamics in RV failure.
RV Failure is Characterized by Smaller Mitochondria Compared With RV Hypertrophy
Mitochondrial morphology was evaluated via transmission electron microscopy (Figure 6A). Mitochondrial size distribution trended toward an increase with RV hypertrophy and decrease with RV failure (Figure 6B and 6C), possibly suggesting increased fission in RV failure. However, because of the heterogeneity in mitochondrial morphology within each sample, significant changes in overall median mitochondrial area, circularity, and perimeter could not be detected in RV hypertrophy and RV failure (Figure 6D through 6F). In addition, the overall mitochondrial cristae density was not decreased in RV hypertrophy and RV failure (Figure 6G).
Figure 6. Right ventricle (RV) hypertrophy is characterized by larger mitochondria while RV failure is characterized by smaller mitochondria.
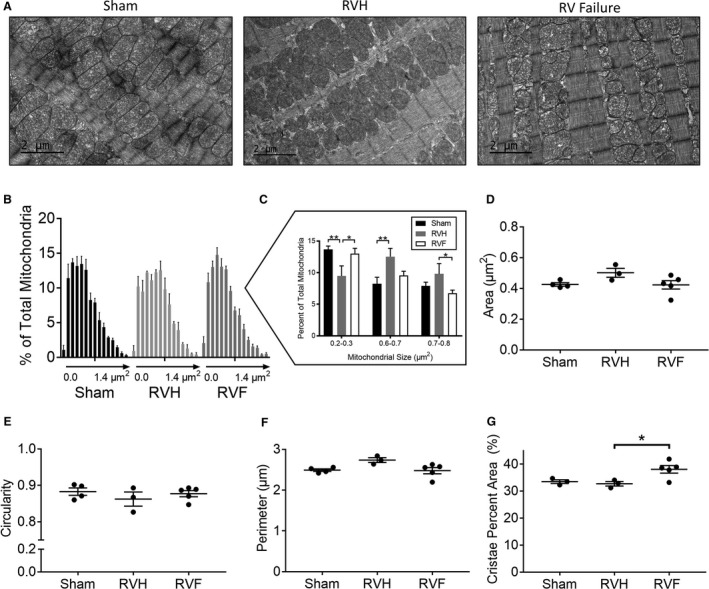
A, Representative electron microscopy images from sham, RV hypertrophy, and RV failure. (B) Histogram of mean mitochondrial area in each group. Each data point represents increments in mitochondrial area of 0.1 μm2 from left to right. (C) Mitochondrial area distribution compared between each group demonstrates a greater percent of larger mitochondria in RV hypertrophy compared with RV failure. There was no change in the overall median mitochondrial (D) area, (E) circularity, (F) perimeter, and (G) mitochondrial cristae density between Sham, RV hypertrophy, and RV failure. n=3 to 6/group, 250 mitochondria assessed/group. Scale bars are 2 μm. Data are presented as mean±SEM and analyzed using one‐way ANOVA. RVF indicates right ventricular failure; and RVH, right ventricular hypertrophy. *P<0.05, **P<0.01.
4HNE Acutely Disrupts Mitochondrial Morphology
To determine whether increased lipid peroxidation in RV failure plays a role in mediating mitochondrial dysfunction, we treated HL1 cardiomyocytes with 4HNE (1 hour) and assessed mitochondrial size, shape, and structure (Figure 7A). Fifty μmol/L 4HNE increased mitochondrial number (Figure 7B) and decreased mitochondrial area (Figure 7C), suggesting increased fission. In addition, 4HNE treatment decreased mitochondrial solidity (increased ruffling of the outer mitochondrial membrane), suggesting membrane damage (Figure 7D), and 4HNE also decreased mitochondrial circularity (Figure 7E), indicating elongated morphology. 4HNE resulted in disruption of the mitochondrial network and connectivity.
Figure 7. Acute 4HNE (4‐hydroxynonenal) treatment leads to loss of mitochondrial network and connectivity.
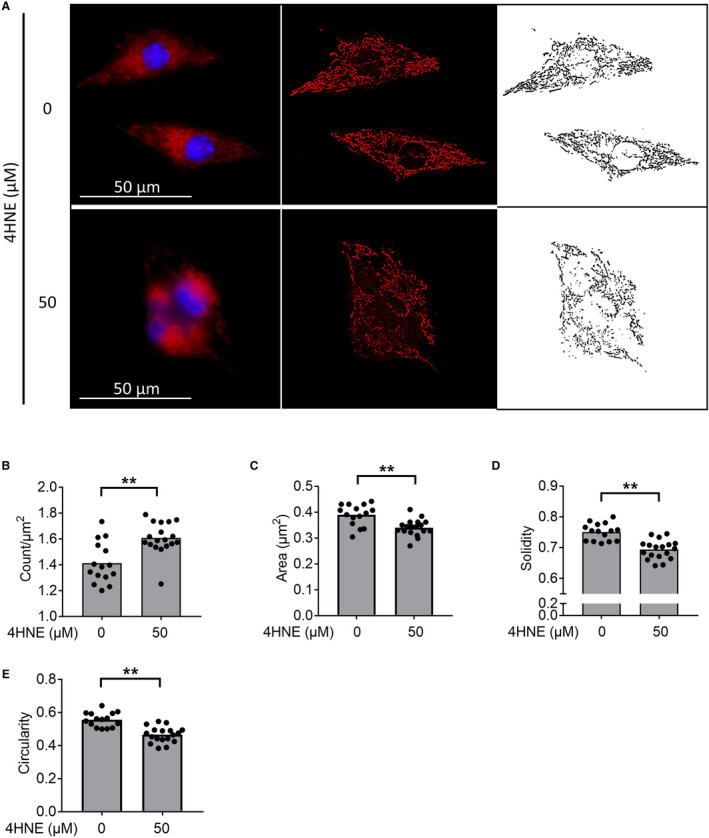
Cardiomyocytes treated for 1 hour with 4HNE, followed by staining with Mitotracker Red CMXROS (red) and Hoechst 33342 (blue) for mitochondria and nuclear staining, respectively. A, Representative pictures, and their processing for the mitochondrial analysis are shown. The originals are shown in the first column, background‐subtracted versions in the second, and thresholded images in the third. B and C, 4HNE treatment increases the mitochondrial count while decreasing the mitochondrial area. D and E, 4HNE decreased the solidity and circularity. Scale bars are 50 μm. n=15 to 18/group. Data are presented as mean±SEM. Student t‐test was used for all data, except for (B), which used Kruskal‒Wallis test. 4HNE indicates 4‐hydroxynonenal. **P<0.01.
Discussion
In patients with complex congenital heart disease such as those with tetralogy of Fallot, pulmonary atresia/intact ventricular septum, and hypoplastic left heart syndrome, the right ventricle is subject to pressure overload, leading to RV hypertrophy and eventually RV failure. We developed a murine model of RV pressure overload which replicates the RV afterload stress seen in patients with congenital heart disease and evaluated transcriptional changes and mitochondrial function. RV hypertrophy and failure were characterized by decreased transcription and activity of electron transport chain complexes, increased oxidative stress, altered mitochondrial dynamics, and decreased mitochondrial energy generation. Interestingly, the left ventricle of RV failure hearts was characterized by increased transcription of genes involved in mitochondrial energy generation. An improved understanding of the mechanisms of mitochondrial dysfunction in RV hypertrophy and RV failure and the left ventricular response to the failing RV will aid in the development of novel therapeutic targets to improve mitochondrial energy generation and preserve long‐term RV function.
Although RV failure is a major risk factor for mortality in patients with pulmonary hypertension and congenital heart disease, the underlying cellular mechanisms leading to RV failure are poorly understood. 11 The human heart is a highly oxidative organ and is thus particularly vulnerable to oxidative damage. 40 In the heart, mitochondria are the main source and target of oxidative stress, in particular lipid peroxidation. 41 , 42 In the pressure overloaded RV, derangements have been described in mitochondria, oxidant stress, and cell death pathways, 11 , 43 the combination of which could predispose the RV to a more rapid progression to failure. 10 , 12 , 44 Others have reported a decrease in superoxide dismutase and glutathione peroxidase activity even during compensated hypertrophy, perhaps predisposing the RV to oxidative stress‐induced damage at an earlier stage. 14 , 45 Increased oxidative stress has also been shown in RV pressure overload attributable to pulmonary hypertension. 46 , 47 Similarly, we show a decrease in transcription of antioxidant enzymes and increased transcription of oxidative stress markers.
The role of reactive lipid peroxidation byproducts, a potent form of oxidative stress, in promoting pathological conditions has been well‐established in several diseases including atherosclerosis, diabetes mellitus, Alzheimer disease, 42 aging and in ischemia/reperfusion injury, and is uniformly detrimental to cardiac function. 16 , 17 , 18 Lipid peroxidation can damage the lipid bilayer of the mitochondria, leading to loss of the electron transport chain gradient and impaired oxidative phosphorylation. 48 Of these, 4HNE is especially reactive and able to form covalent adducts with other macromolecules to inhibit their function. 49 We show for the first time that RV failure is characterized by increased 4HNE, which may in part be responsible for decreased transcription and activity of electron transport chain complexes, leading to decreased mitochondrial energy generation.
RV pressure overload is known to inhibit mitochondrial energy generation 14 , 25 , 50 and oxidative stress is known to impair mitochondrial DNA and biogenesis in ischemic heart disease and in Alzeimer disease. 51 , 52 Unique from these papers, we used high resolution respirometry to evaluate individual electron transport chain complexes. We show that mitochondrial energy generation is impaired even during compensated hypertrophy when mitochondrial biogenesis is still maintained, and energy generation further declines as mitochondrial biogenesis falls during RV failure. This suggests that adverse bioenergetic remodeling occurs even during compensated hypertrophy and may predispose the heart to failure. Furthermore, we show a decrease in uncoupled respiration and respiratory control ratio despite reduced leak respiration, indicating that the attenuation of mitochondrial energy generation is driven by an overall progressive decrease in the electron transport chain activity. It is now becoming increasingly clear in patients with RV pressure overload that RV diastolic dysfunction sets in early with the development of hypertrophy long before the development of RV failure and can lead to exercise intolerance. 53 While RV systolic function is expected to remain stable or increase during RV hypertrophy, RV diastolic function, which is also an active, energy dependent process is impaired during RV hypertrophy and may be reflected in the impaired mitochondrial energy generation which further decreases with the onset of RV failure.
Lipid peroxidation damages mitochondrial membranes, leading to impaired mitochondrial fission and fusion in a dose‐dependent manner in neurons and in ischemic heart disease that may further contribute to decreased oxygen consumption. 54 , 55 , 56 Excessive mitochondrial fission in heart failure is known to inhibit bioenergetics by disrupting mitochondrial network to avert efficient sharing of mitochondrial contents. 57 Increased fission has also been shown in RV failure in experimental pulmonary hypertension in whole cell lysates. 58 , 59 , 60 While our transmission electron microscopy data in RV failure show smaller mitochondria, suggesting increased fission, the isolated mitochondrial dynamics protein data show both a trend toward an increase (DRP1) and a decrease (MFF) in fission proteins with a decrease in fusion proteins (OPA). Since the balance in mitochondrial dynamics determines the ultimate mitochondrial morphology, we conclude that fission is overall increased. 61 Mechanistically, we show that 4HNE can promote mitochondrial fission and may contribute to the mitochondrial network disruption leading to decreased energy generation in RV failure.
Cao et al 62 report perturbations in extracellular receptor interaction and focal adhesion pathways in the failing RV, similar to our data. They also report significant dysregulation in inflammatory pathways without any dysregulation in myocardial bioenergetics. However, Cao et al had a PAB in place for only 1 hour compared with our model of pressure overload‐induced RV failure where the PAB was in place for 1 to 3 weeks which may account for the differences. This suggests that the RV response to acute and chronic pressure overload differ. Many of the pro‐fibrotic pathways we describe have been reported in monocrotaline‐induced RV failure. 63 However, monocrotaline toxicity extends beyond pulmonary vasoconstriction, to interstitial fibrosis as well as myocarditis. 64 , 65 Other models of drug‐induced pulmonary hypertension also have the possibility of off‐target effects acting directly on the cardiac mitochondria and therefore may not accurately recapitulate the stress on the RV because of RV outflow tract obstruction as seen in congenital heart disease. 14 , 66
RV pressure overload has been reported to disturb left ventricular physiology, such as atrophic remodeling, 67 intraventricular asynchrony, 68 and systolic and diastolic dysfunction because of left ventricular myocardial interstitial edema and fibrosis. 69 , 70 RV failure attributable to experimental pulmonary hypertension has been shown to increase biventricular fission. 59 We now show for the first time that while pressure overload‐induced RV failure impairs transcription of oxidative phosphorylation genes in the RV, it promotes transcription of the same genes in the left ventricle, perhaps in an attempt to maintain the hyperdynamic left ventricular function. With increasing RV pressure overload, the interventricular septum begins to shift into the left ventricle during systole, alters left ventricular geometry, thereby compromising left ventricular filling and can even cause left ventricular outflow tract obstruction, all of which can lead to decreased cardiac output. The left ventricle responds by increasing heart rate and fractional shortening to maintain cardiac output. This physiology is similar to that seen in patients with progressive RV pressure overload. We hypothesize that this increase in left ventricular demand because of adverse ventricular‐ventricular interactions accounts for the increased left ventricular energy demands and upregulation of genes involved in oxidative phosphorylation. In fact, transcription of genes involved in the electron transport chain is the most highly regulated pathway in the left ventricle of RV failure.
Conclusions
RV failure is a major risk factor for mortality in patients with pulmonary hypertension and congenital heart disease. However, the underlying cellular mechanisms leading to RV failure are poorly understood. We show decreased transcription and activity of individual electron transport chain complexes in RV failure along with an increase in 4HNE induced oxidant stress and a decrease in antioxidant defenses. These factors may work in concert to impair mitochondrial energy generation, promoting the development of RV failure. Thus, lipid peroxidation byproducts could serve as potential therapeutic targets in pressure overload‐induced RV failure to improve mitochondrial energy generation and delay or prevent the onset of RV failure. As surgical techniques for repair of complex congenital heart lesions continue to improve, long‐term survival and quality of life will increasingly depend on our ability to preserve long‐term RV function.
Sources of Funding
The JEOL JEM1400 electron microscope at the Cell Sciences Imaging Facility of Stanford University was funded by a National Institutes of Health Shared Instrumentation grant (William Talbot, PI; installation date, 01/2011) and by the American Recovery and Reinvestment Act award 1S10RR026780‐01 from the National Center for Research Resources. The article contents are solely the responsibility of the authors and do not necessarily represent the official views of the National Center for Research Resources or the National Institutes of Health. K08 HL127277‐01 National Institutes of Health was given to Reddy; Reddy Foundation grant to Reddy; Department of Defense PR151448 to Bernstein and Reddy; Stanford MCHRI Cardiovascular Institute Seed grant to Reddy.
Disclosures
None.
Supporting information
Data S1
Tables S1–S3
Figures S1–S12
Acknowledgments
We thank Helen Lu for the analysis of the electron microscopy data.
Data curation and formal analysis were done by Dr Ramesh V. Nair, Director of Bioinformatics, Bioinformatics‐as‐a‐Service (BaaS) under the Genetics Bioinformatics Service Center (GBSC), a Stanford School of Medicine service center operated by the Department of Genetics.
(J Am Heart Assoc.2021;10:e017835. DOI: 10.1161/JAHA.120.017835.)
Supplementary Material for this article is available at https://www.ahajournals.org/doi/suppl/10.1161/JAHA.120.017835
For Sources of Funding and Disclosures, see page 17.
References
- 1. Hoffman JI, Kaplan S. The incidence of congenital heart disease. J Am Coll Cardiol. 2002;39:1890–1900. DOI: 10.1016/S0735-1097(02)01886-7. [DOI] [PubMed] [Google Scholar]
- 2. Altmann K, Printz BF, Solowiejczyk DE, Gersony WM, Quaegebeur J, Apfel HD. Two‐dimensional echocardiographic assessment of right ventricular function as a predictor of outcome in hypoplastic left heart syndrome. Am J Cardiol. 2000;86:964–968. DOI: 10.1016/S0002-9149(00)01131-0. [DOI] [PubMed] [Google Scholar]
- 3. Bogaard HJ, Abe K, Vonk Noordegraaf A, Voelkel NF. The right ventricle under pressure: cellular and molecular mechanisms of right‐heart failure in pulmonary hypertension. Chest. 2009;135:794–804. DOI: 10.1378/chest.08-0492. [DOI] [PubMed] [Google Scholar]
- 4. Fine NM, Chen L, Bastiansen PM, Frantz RP, Pellikka PA, Oh JK, Kane GC. Outcome prediction by quantitative right ventricular function assessment in 575 subjects evaluated for pulmonary hypertension. Circ Cardiovasc Imaging. 2013;6:711–721. DOI: 10.1161/CIRCIMAGING.113.000640. [DOI] [PubMed] [Google Scholar]
- 5. Haddad F, Hunt SA, Rosenthal DN, Murphy DJ. Right ventricular function in cardiovascular disease, part I. Anatomy, physiology, aging, and functional assessment of the right ventricle. Circulation. 2008;117:1436–1448. [DOI] [PubMed] [Google Scholar]
- 6. Winter MM, Bouma BJ, Groenink M, Konings TC, Tijssen JG, van Veldhuisen DJ, Mulder BJ. Latest insights in therapeutic options for systemic right ventricular failure: a comparison with left ventricular failure. Heart. 2009;95:960–963. DOI: 10.1136/hrt.2008.156265. [DOI] [PubMed] [Google Scholar]
- 7. Szymanski P, Klisiewicz A, Hoffman P. Therapeutic options for systemic right ventricular failure. Heart. 2009;95:1950–1951. DOI: 10.1136/hrt.2009.179952. [DOI] [PubMed] [Google Scholar]
- 8. Shaddy RE, Boucek MM, Hsu DT, Boucek RJ, Canter CE, Mahony L, Ross RD, Pahl E, Blume ED, Dodd DA, et al. Carvedilol for children and adolescents with heart failure: a randomized controlled trial. JAMA. 2007;298:1171–1179. DOI: 10.1001/jama.298.10.1171. [DOI] [PubMed] [Google Scholar]
- 9. Hsu DT, Zak V, Mahony L, Sleeper LA, Atz AM, Levine JC, Barker PC, Ravishankar C, McCrindle BW, Williams RV, et al. Enalapril in infants with single ventricle: results of a multicenter randomized trial. Circulation. 2010;122:333–340. DOI: 10.1161/CIRCULATIONAHA.109.927988. [DOI] [PMC free article] [PubMed] [Google Scholar]
- 10. Urashima T, Zhao M, Wagner R, Fajardo G, Farahani S, Quertermous T, Bernstein D. Molecular and physiological characterization of RV remodeling in a murine model of pulmonary stenosis. Am J Physiol Heart Circ Physiol. 2008;295:H1351–H1368. DOI: 10.1152/ajpheart.91526.2007. [DOI] [PMC free article] [PubMed] [Google Scholar]
- 11. Reddy S, Bernstein D. Molecular mechanisms of right ventricular failure. Circulation. 2015;132:1734. DOI: 10.1161/CIRCULATIONAHA.114.012975. [DOI] [PMC free article] [PubMed] [Google Scholar]
- 12. Piao L, Marsboom G, Archer SL. Mitochondrial metabolic adaptation in right ventricular hypertrophy and failure. J Mol Med. 2010;88:1011–1020. DOI: 10.1007/s00109-010-0679-1. [DOI] [PMC free article] [PubMed] [Google Scholar]
- 13. Assad TR, Hemnes AR. Metabolic dysfunction in pulmonary arterial hypertension. Curr Hypertens Rep. 2015;17:20. DOI: 10.1007/s11906-014-0524-y. [DOI] [PMC free article] [PubMed] [Google Scholar]
- 14. Gomez‐Arroyo J, Mizuno S, Szczepanek K, Tassell BV, Natarajan R, Remedios CGD, Drake JI, Farkas L, Kraskauskas D, Wijesinghe DS, et al. Metabolic gene remodeling and mitochondrial dysfunction in failing right ventricular hypertrophy secondary to pulmonary arterial hypertension. Circ Heart Fail. 2013;6:136–144. [DOI] [PMC free article] [PubMed] [Google Scholar]
- 15. Piao L, Fang Y‐H, Cadete VJJ, Wietholt C, Urboniene D, Toth PT, Marsboom G, Zhang HJ, Haber I, Rehman J, et al. The inhibition of pyruvate dehydrogenase kinase improves impaired cardiac function and electrical remodeling in two models of right ventricular hypertrophy: resuscitating the hibernating right ventricle. J Mol Med. 2010;88:47–60. DOI: 10.1007/s00109-009-0524-6. [DOI] [PMC free article] [PubMed] [Google Scholar]
- 16. Ide T, Tsutsui H, Kinugawa S, Utsumi H, Kang D, Hattori N, Uchida K, Arimura K‐I, Egashira K, Takeshita A. Mitochondrial electron transport complex I is a potential source of oxygen free radicals in the failing myocardium. Circ Res. 1999;85:357–363. DOI: 10.1161/01.RES.85.4.357. [DOI] [PubMed] [Google Scholar]
- 17. Srivastava S, Chandrasekar B, Bhatnagar A, Prabhu SD. Lipid peroxidation‐derived aldehydes and oxidative stress in the failing heart: role of aldose reductase. Am J Physiol Heart Circ Physiol. 2002;283:H2612–H2619. DOI: 10.1152/ajpheart.00592.2002. [DOI] [PubMed] [Google Scholar]
- 18. Lucas DT, Szweda LI. Cardiac reperfusion injury: aging, lipid peroxidation, and mitochondrial dysfunction. Proc Natl Acad Sci USA. 1998;95:510–514. [DOI] [PMC free article] [PubMed] [Google Scholar]
- 19. Ryan J, Dasgupta A, Huston J, Chen K‐H, Archer SL. Mitochondrial dynamics in pulmonary arterial hypertension. J Mol Med (Berl). 2015;93:229–242. DOI: 10.1007/s00109-015-1263-5. [DOI] [PMC free article] [PubMed] [Google Scholar]
- 20. Hardziyenka M, Campian ME, Verkerk AO, Surie S, van Ginneken ACG, Hakim S, Linnenbank AC, de Bruin‐Bon HACMR, Beekman L, van der Plas MN, et al. Electrophysiologic remodeling of the left ventricle in pressure overload‐induced right ventricular failure. J Am Coll Cardiol. 2012;59:2193–2202. DOI: 10.1016/j.jacc.2012.01.063. [DOI] [PubMed] [Google Scholar]
- 21. Friedberg MK, Redington AN. Right versus left ventricular failure. Circulation. 2014;129:1033–1044. DOI: 10.1161/CIRCULATIONAHA.113.001375. [DOI] [PubMed] [Google Scholar]
- 22. Dell'Italia LJ. The forgotten left ventricle in right ventricular pressure overload. J Am Coll Cardiol. 2011;57:929–930. DOI: 10.1016/j.jacc.2010.08.647. [DOI] [PubMed] [Google Scholar]
- 23. Stam K, Cai Z, van der Velde N, van Duin R, Lam E, van der Velden J, Hirsch A, Duncker DJ, Merkus D. Cardiac remodelling in a swine model of chronic thromboembolic pulmonary hypertension: comparison of right vs. left ventricle. J Physiol. 2019;597:4465–4480. [DOI] [PMC free article] [PubMed] [Google Scholar]
- 24. Neubauer S. The failing heart—an engine out of fuel. N Engl J Med. 2007;356:1140–1151. DOI: 10.1056/NEJMra063052. [DOI] [PubMed] [Google Scholar]
- 25. Reddy S, Zhao M, Hu D‐Q, Fajardo G, Katznelson E, Punn R, Spin JM, Chan FP, Bernstein D. Physiologic and molecular characterization of a murine model of right ventricular volume overload. Am J Physiol Heart Circ Physiol. 2013;304:H1314–H1327. DOI: 10.1152/ajpheart.00776.2012. [DOI] [PMC free article] [PubMed] [Google Scholar]
- 26. Andrews S. FastQC: a quality control tool for high throughput sequence data. 2010.
- 27. Dobin A, Davis CA, Schlesinger F, Drenkow J, Zaleski C, Jha S, Batut P, Chaisson M, Gingeras TR. STAR: ultrafast universal RNA‐seq aligner. Bioinformatics. 2013;29:15–21. DOI: 10.1093/bioinformatics/bts635. [DOI] [PMC free article] [PubMed] [Google Scholar]
- 28. Trapnell C, Hendrickson DG, Sauvageau M, Goff L, Rinn JL, Pachter L. Differential analysis of gene regulation at transcript resolution with RNA‐seq. Nat Biotechnol. 2012;31:46. DOI: 10.1038/nbt.2450. [DOI] [PMC free article] [PubMed] [Google Scholar]
- 29. Goff L, Trapnell C, Kelley D. CummeRbund: analysis, exploration, manipulation, and visualization of cufflinks high‐throughput sequencing data. R package version 2.16.0. 2013;2.
- 30. Draghici S, Khatri P, Tarca AL, Amin K, Done A, Voichita C, Georgescu C, Romero R. A systems biology approach for pathway level analysis. Genome Res. 2007;17:1537–1545. DOI: 10.1101/gr.6202607. [DOI] [PMC free article] [PubMed] [Google Scholar]
- 31. Tarca AL, Draghici S, Khatri P, Hassan SS, Mittal P, Kim JS, Kim CJ, Kusanovic JP, Romero R. A novel signaling pathway impact analysis. Bioinformatics. 2009;25:75–82. [DOI] [PMC free article] [PubMed] [Google Scholar]
- 32. Khatri P, Draghici S, Tarca AL, Hassan SS, Romero R. A system biology approach for the steady‐state analysis of gene signaling networks. In Rueda L, Mery D, Kittler J (eds.) Progress in Pattern Recognition, Image. Analysis and Applications. Springer; 2007:32–41. [Google Scholar]
- 33. Kanehisa M, Sato Y, Furumichi M, Morishima K, Tanabe M. New approach for understanding genome variations in KEGG. Nucleic Acids Res. 2019;47:D590–D595. [DOI] [PMC free article] [PubMed] [Google Scholar]
- 34. Kanehisa M, Goto S. KEGG: kyoto encyclopedia of genes and genomes. Nucleic Acids Res. 2000;28:27–30. [DOI] [PMC free article] [PubMed] [Google Scholar]
- 35. Kanehisa M. Toward understanding the origin and evolution of cellular organisms. Protein Sci. 2019;28:1947–1951. [DOI] [PMC free article] [PubMed] [Google Scholar]
- 36. Livak KJ, Schmittgen TD. Analysis of relative gene expression data using real‐time quantitative PCR and the 2(‐Delta Delta C(T)) Method. Methods. 2001;25:402–408. [DOI] [PubMed] [Google Scholar]
- 37. Hwang HV, Sandeep N, Paige SL, Ranjbarvaziri S, Hu D‐Q, Zhao M, Lan IS, Coronado M, Kooiker KB, Wu SM, et al. 4HNE impairs myocardial bioenergetics in congenital heart disease‐induced right ventricular failure. Circulation. 2020;142:1667–1683. [DOI] [PMC free article] [PubMed] [Google Scholar]
- 38. Malik AN, Czajka A, Cunningham P. Accurate quantification of mouse mitochondrial DNA without co‐amplification of nuclear mitochondrial insertion sequences. Mitochondrion. 2016;29:59–64. [DOI] [PubMed] [Google Scholar]
- 39. Schindelin J, Arganda‐Carreras I, Frise E, Kaynig V, Longair M, Pietzsch T, Preibisch S, Rueden C, Saalfeld S, Schmid B. Fiji: an open‐source platform for biological‐image analysis. Nat Methods. 2012;9:676. [DOI] [PMC free article] [PubMed] [Google Scholar]
- 40. Weiss RG, Gerstenblith G, Bottomley PA. ATP flux through creatine kinase in the normal, stressed, and failing human heart. Proc Natl Acad Sci USA. 2005;102:808–813. [DOI] [PMC free article] [PubMed] [Google Scholar]
- 41. Anderson EJ, Katunga LA, Willis MS. Mitochondria as a source and target of lipid peroxidation products in healthy and diseased heart. Clin Exp Pharmacol Physiol. 2012;39:179–193. DOI: 10.1111/j.1440-1681.2011.05641.x. [DOI] [PMC free article] [PubMed] [Google Scholar]
- 42. Negre‐Salvayre A, Auge N, Ayala V, Basaga H, Boada J, Brenke R, Chapple S, Cohen G, Feher J, Grune T, et al. Pathological aspects of lipid peroxidation. Free Radic Res. 2010;44:1125–1171. DOI: 10.3109/10715762.2010.498478. [DOI] [PubMed] [Google Scholar]
- 43. Reddy S, Zhao M, Hu DQ, Fajardo G, Hu S, Ghosh Z, Rajagopalan V, Wu JC, Bernstein D. Dynamic microRNA expression during the transition from right ventricular hypertrophy to failure. Physiol Genomics. 2012;44:562–575. DOI: 10.1152/physiolgenomics.00163.2011. [DOI] [PMC free article] [PubMed] [Google Scholar]
- 44. Friehs I, Moran AM, Stamm C, Colan SD, Takeuchi K, Cao‐Danh H, Rader CM, McGowan FX, del Nido PJ. Impaired glucose transporter activity in pressure‐overload hypertrophy is an early indicator of progression to failure. Circulation. 1999;100:II187–II193. DOI: 10.1161/01.CIR.100.suppl_2.II-187. [DOI] [PubMed] [Google Scholar]
- 45. Tsutsui H, Ide T, Hayashidani S, Suematsu N, Utsumi H, Nakamura R, Egashira K, Takeshita A. Greater susceptibility of failing cardiac myocytes to oxygen free radical‐mediated injury. Cardiovasc Res. 2001;49:103–109. DOI: 10.1016/S0008-6363(00)00197-8. [DOI] [PubMed] [Google Scholar]
- 46. Pichardo J, Palace V, Farahmand F, Singal PK. Myocardial oxidative stress changes during compensated right heart failure in rats. Mol Cell Biochem. 1999;196:51–57. [PubMed] [Google Scholar]
- 47. Mikhael M, Makar C, Wissa A, Le T, Eghbali M, Umar S. Oxidative stress and its implications in the right ventricular remodeling secondary to pulmonary hypertension. Front Physiol. 2019;10:1233. DOI: 10.3389/fphys.2019.01233. [DOI] [PMC free article] [PubMed] [Google Scholar]
- 48. Roede JR, Jones DP. Reactive species and mitochondrial dysfunction: mechanistic significance of 4‐hydroxynonenal. Environ Mol Mutagen. 2010;51:380–390. [DOI] [PMC free article] [PubMed] [Google Scholar]
- 49. Riahi Y, Cohen G, Shamni O, Sasson S. Signaling and cytotoxic functions of 4‐hydroxyalkenals. Am J Physiol Endocrinol Metab. 2010;299:E879–E886. DOI: 10.1152/ajpendo.00508.2010. [DOI] [PubMed] [Google Scholar]
- 50. Karamanlidis G, Bautista‐Hernandez V, Fynn‐Thompson F, del Nido P, Tian R. Impaired mitochondrial biogenesis precedes heart failure in right ventricular hypertrophy in congenital heart disease. Circ Heart Fail. 2011;4:707–713. [DOI] [PMC free article] [PubMed] [Google Scholar]
- 51. Pisano A, Cerbelli B, Perli E, Pelullo M, Bargelli V, Preziuso C, Mancini M, He L, Bates MGD, Lucena JR, et al. Impaired mitochondrial biogenesis is a common feature to myocardial hypertrophy and end‐stage ischemic heart failure. Cardiovasc Pathol. 2016;25:103–112. DOI: 10.1016/j.carpath.2015.09.009. [DOI] [PMC free article] [PubMed] [Google Scholar]
- 52. Wang X, Wang W, Li L, Perry G, Lee H‐G, Zhu X. Oxidative stress and mitochondrial dysfunction in Alzheimer's disease. Biochim Biophys Acta. 2014;1842:1240–1247. DOI: 10.1016/j.bbadis.2013.10.015. [DOI] [PMC free article] [PubMed] [Google Scholar]
- 53. Munkhammar P, Carlsson M, Arheden H, Pesonen E. Restrictive right ventricular physiology after tetralogy of Fallot repair is associated with fibrosis of the right ventricular outflow tract visualized on cardiac magnetic resonance imaging. Eur Heart J Cardiovasc Imaging. 2013;14:978–985. DOI: 10.1093/ehjci/jet009. [DOI] [PubMed] [Google Scholar]
- 54. Dodson M, Wani WY, Redmann M, Benavides GA, Johnson MS, Ouyang X, Cofield SS, Mitra K, Darley‐Usmar V, Zhang J. Regulation of autophagy, mitochondrial dynamics, and cellular bioenergetics by 4‐hydroxynonenal in primary neurons. Autophagy. 2017;13:1828–1840. DOI: 10.1080/15548627.2017.1356948. [DOI] [PMC free article] [PubMed] [Google Scholar]
- 55. Tsushima K, Bugger H, Wende AR, Soto J, Jenson GA, Tor AR, McGlauflin R, Kenny HC, Zhang Y, Souvenir R, et al. Mitochondrial reactive oxygen species in lipotoxic hearts induce post‐translational modifications of AKAP121, DRP1, and OPA1 that promote mitochondrial fission. Circ Res. 2018;122:58–73. DOI: 10.1161/CIRCRESAHA.117.311307. [DOI] [PMC free article] [PubMed] [Google Scholar]
- 56. Solesio ME, Prime TA, Logan A, Murphy MP, del Mar A‐J, Jordán J, Galindo MF. The mitochondria‐targeted anti‐oxidant MitoQ reduces aspects of mitochondrial fission in the 6‐OHDA cell model of Parkinson's disease. Biochim Biophys Acta. 2013;1832:174–182. DOI: 10.1016/j.bbadis.2012.07.009. [DOI] [PubMed] [Google Scholar]
- 57. Westermann B. Bioenergetic role of mitochondrial fusion and fission. Biochim Biophys Acta. 2012;1817:1833–1838. DOI: 10.1016/j.bbabio.2012.02.033. [DOI] [PubMed] [Google Scholar]
- 58. Tian L, Potus F, Wu D, Dasgupta A, Chen K‐H, Mewburn J, Lima P, Archer SL. Increased Drp1‐mediated mitochondrial fission promotes proliferation and collagen production by right ventricular fibroblasts in experimental pulmonary arterial hypertension. Front Physiol. 2018;9:828. DOI: 10.3389/fphys.2018.00828. [DOI] [PMC free article] [PubMed] [Google Scholar]
- 59. Xiong PY, Tian L, Dunham‐Snary KJ, Chen KH, Mewburn JD, Neuber‐Hess M, Martin A, Dasgupta A, Potus F, Archer SL. Biventricular increases in mitochondrial fission mediator (MID51) and proglycolytic pyruvate kinase (PKM2) isoform in experimental group 2 pulmonary hypertension‐novel mitochondrial abnormalities. Front Cardiovasc Med. 2018;5:195. DOI: 10.3389/fcvm.2018.00195. [DOI] [PMC free article] [PubMed] [Google Scholar]
- 60. Tian L, Neuber‐Hess M, Mewburn J, Dasgupta A, Dunham‐Snary K, Wu D, Chen K‐H, Hong Z, Sharp WW, Kutty S, et al. Ischemia‐induced Drp1 and Fis1‐mediated mitochondrial fission and right ventricular dysfunction in pulmonary hypertension. J Mol Med. 2017;95:381–393. DOI: 10.1007/s00109-017-1522-8. [DOI] [PMC free article] [PubMed] [Google Scholar]
- 61. Bernhardt D, Müller M, Reichert AS, Osiewacz HD. Simultaneous impairment of mitochondrial fission and fusion reduces mitophagy and shortens replicative lifespan. Sci Rep. 2015;5:7885. 10.1038/srep07885. [DOI] [PMC free article] [PubMed] [Google Scholar]
- 62. Cao Y, Li Y, Wu M, Song J, Zhang M, Duan Y, Jiang K, Zhou X, Zhang Y. RNA‐sequencing analysis of gene expression in a rat model of acute right heart failure. Pulm Circ. 2020;10:2045894019879396. DOI: 10.1177/2045894019879396. [DOI] [PMC free article] [PubMed] [Google Scholar]
- 63. Potus F, Hindmarch CCT, Dunham‐Snary KJ, Stafford J, Archer SL. Transcriptomic signature of right ventricular failure in experimental pulmonary arterial hypertension: deep sequencing demonstrates mitochondrial, fibrotic, inflammatory and angiogenic abnormalities. Int J Mol Sci. 2018;19:2730. DOI: 10.3390/ijms19092730. [DOI] [PMC free article] [PubMed] [Google Scholar]
- 64. Gomez‐Arroyo JG, Farkas L, Alhussaini AA, Farkas D, Kraskauskas D, Voelkel NF, Bogaard HJ. The monocrotaline model of pulmonary hypertension in perspective. Am J Physiol Lung Cell Mol Physiol. 2012;302:L363–L369. DOI: 10.1152/ajplung.00212.2011. [DOI] [PubMed] [Google Scholar]
- 65. Kreymborg KG, Uchida S, Gellert P, Schneider A, Boettger T, Voswinckel R, Wietelmann A, Szibor M, Weissmann N, Ghofrani AH, et al. Identification of right heart‐enriched genes in a murine model of chronic outflow tract obstruction. J Mol Cell Cardiol. 2010;49:598–605. DOI: 10.1016/j.yjmcc.2010.07.014. [DOI] [PubMed] [Google Scholar]
- 66. Bogaard HJ, Natarajan R, Henderson SC, Long CS, Kraskauskas D, Smithson L, Ockaili R, McCord JM, Voelkel NF. Chronic pulmonary artery pressure elevation is insufficient to explain right heart failure. Circulation. 2009;120:1951–1960. DOI: 10.1161/CIRCULATIONAHA.109.883843. [DOI] [PubMed] [Google Scholar]
- 67. Hardziyenka M, Campian ME, Reesink HJ, Surie S, Bouma BJ, Groenink M, Klemens CA, Beekman L, Remme CA, Bresser P, et al. Right ventricular failure following chronic pressure overload is associated with reduction in left ventricular mass: evidence for atrophic remodeling. J Am Coll Cardiol. 2011;57:921–928. DOI: 10.1016/j.jacc.2010.08.648. [DOI] [PubMed] [Google Scholar]
- 68. Marcus JT, Gan CT‐J, Zwanenburg JJM, Boonstra A, Allaart CP, Götte MJW, Vonk‐Noordegraaf A. Interventricular mechanical asynchrony in pulmonary arterial hypertension: left‐to‐right delay in peak shortening is related to right ventricular overload and left ventricular underfilling. J Am Coll Cardiol. 2008;51:750–757. DOI: 10.1016/j.jacc.2007.10.041. [DOI] [PubMed] [Google Scholar]
- 69. Krayenbuehl HP, Turina J, Hess O. Left ventricular function in chronic pulmonary hypertension. Am J Cardiol. 1978;41:1150–1158. DOI: 10.1016/0002-9149(78)90872-X. [DOI] [PubMed] [Google Scholar]
- 70. Davis KL, Mehlhorn U, Laine GA, Allen SJ. Myocardial edema, left ventricular function, and pulmonary hypertension. J Appl Physiol. 1995;78:132–137. DOI: 10.1152/jappl.1995.78.1.132. [DOI] [PubMed] [Google Scholar]
Associated Data
This section collects any data citations, data availability statements, or supplementary materials included in this article.
Supplementary Materials
Data S1
Tables S1–S3
Figures S1–S12