

Abstract
Background
The American Heart Association and Healthy People 2020 established objectives to reduce coronary heart disease (CHD) and stroke death rates by 20% by the year 2020, with 2007 as the baseline year. We examined county‐level achievement of the targeted reduction in CHD and stroke death rates from 2007 to 2017.
Methods and Results
Applying a hierarchical Bayesian model to National Vital Statistics data, we estimated annual age‐standardized county‐level death rates and the corresponding percentage change during 2007 to 2017 for those aged 35 to 64 and ≥65 years and by urban‐rural classification. For those aged ≥35 years, 56.1% (95% credible interval [CI], 54.1%–57.7%) and 39.8% (95% CI, 36.9%–42.7%) of counties achieved a 20% reduction in CHD and stroke death rates, respectively. For both CHD and stroke, the proportions of counties achieving a 20% reduction were lower for those aged 35 to 64 years than for those aged ≥65 years (CHD: 32.2% [95% CI, 29.4%–35.6%] and 64.1% [95% CI, 62.3%–65.7%]), respectively; stroke: 17.9% [95% CI, 13.9%–22.2%] and 45.6% [95% CI, 42.8%–48.3%]). Counties achieving a 20% reduction in death rates were more commonly urban counties (except stroke death rates for those aged ≥65 years).
Conclusions
Our analysis found substantial, but uneven, achievement of the targeted 20% reduction in CHD and stroke death rates, defined by the American Heart Association and Healthy People. The large proportion of counties not achieving the targeted reduction suggests a renewed focus on CHD and stroke prevention and treatment, especially among younger adults living outside of urban centers. These county‐level patterns provide a foundation for robust responses by clinicians, public health professionals, and communities.
Keywords: cerebrovascular disease/stroke, coronary heart disease, geography, mortality rate, trends
Subject Categories: Cerebrovascular Disease/Stroke, Cardiovascular Disease, Epidemiology
Nonstandard Abbreviations and Acronyms
- AHA
American Heart Association
- CI
credible interval
- HP2020
Healthy People 2020
Clinical Perspective
What Is New?
Using targets defined by Healthy People 2020 and the American Health Association 2020 Impact Goal, roughly half of US counties achieved the targeted national 20% reduction in coronary heart disease death rates, but only 40% of counties achieved the 20% reduction in stroke death rates.
Fewer counties achieved the targeted reductions in coronary heart disease and stroke mortality among adults aged 35 to 64 years than among adults aged ≥65 years, and fewer rural counties achieved a 20% reduction in death rates compared with urban counties.
What Are the Clinical Implications?
These results reinforce the critical need to preserve and improve cardiovascular health across the life course, especially among younger adults and populations living outside of urban centers.
Cardiovascular diseases (CVDs) are primary causes of mortality in the United States, with heart disease and stroke representing the first and fifth leading causes of death in 2018, respectively. 1 Among deaths attributable to heart disease in 2018, roughly 60% (or 360 000 deaths) were caused by coronary heart disease (CHD). 1 , 2 Over 140 000 additional deaths resulted from stroke. Two national initiatives, Healthy People 2020 (HP2020) and American Health Association (AHA) 2020 Impact Goals, were established to address this disease burden and advance efforts to improve cardiovascular health in the decade preceding 2020. 3 , 4 To that end, both initiatives included objectives aimed at reducing CHD and stroke mortality.
Since 1979, the Healthy People initiative has established nationwide health objectives for each decade. 3 HP2020 included 50 heart disease and stroke objectives, including a 20% reduction in the all‐ages CHD and stroke death rates to 103.4 and 43.5 deaths per 100 000 population, respectively, by 2020. 3 Similarly, in 2010, the AHA proposed the 2020 Impact Goal: “By 2020, to improve the cardiovascular health of all Americans by 20% while reducing deaths from cardiovascular diseases and stroke by 20%.” 4 Because CHD is a major preventable contributor to the overall CVD mortality burden in the United States, the AHA identified a 20% reduction in CHD death rates as a secondary metric. 4 Within the context of stagnating national declines in both CHD and stroke death rates since the establishment of these objectives, 1 , 5 , 6 , 7 , 8 , 9 preliminary analyses warned that many national objectives for CHD and stroke mortality were at risk of not being met. 5 , 10
Within these national trends, county‐level variations in recent heart disease and stroke death rates are more complex. 8 , 11 , 12 , 13 , 14 , 15 The highest county‐level death rates for both heart disease and stroke are concentrated in the southern United States and in rural counties, with the Stroke Belt containing the highest burden of stroke deaths. 15 , 16 , 17 Despite the national stagnation in declines, some counties have continued to experience strong declines in both heart disease and stroke mortality. 11 , 12 , 15 Conversely, many counties have experienced recent increases in heart disease and stroke death rates, reflecting a worsening disease burden. 8 , 11 , 12 , 15 Critically, these recent trends in CHD and stroke death rates have differed markedly by age group, with younger adults experiencing slower declines (and often county‐level increases) compared with older adults. 6 , 8 , 9 , 11 , 12 , 15
Within the framework established by the HP2020 and AHA 2020 Impact Goals national initiatives, exploration of disparities in CHD and stroke death rates by age group and geography can provide clinicians, public health professionals, researchers, and communities with data critical to identifying appropriate strategies to improve cardiovascular health. Therefore, these analyses estimated county‐level achievement of targeted 20% reductions in CHD and stroke death rates from 2007 to 2017 for adults aged 35 to 64 and ≥65 years.
METHODS
Mortality Data
We obtained annual death counts for CHD and stroke by county of residence and age group from 2007 through 2017 from the National Vital Statistics System of the National Center for Health Statistics. CHD deaths were defined as those for which the underlying cause of death was listed as International Classification of Diseases, Tenth Revision (ICD‐10), codes I20 to I25; stroke deaths were defined as those for which the underlying cause of death was listed as ICD‐10 codes I60 to I69.
The unit of analysis was the county. Given changes in county definitions during the study period (eg, the creation of new counties), we used a single set of 3136 counties based on the most recent county definitions. We used National Center for Health Statistics bridged‐race estimates for annual county‐level populations. 18
Statistical Analysis
Estimating County‐Level Death Rates
We estimated county‐level CHD and stroke death rates and 95% credible intervals (95% CIs) for the years 2007 through 2017 by 10‐year age groups using a Bayesian multivariate space‐time conditional autoregressive model for each outcome. Additional details of this model are presented below. We then estimated CHD and stroke death rates (per 100 000) for each year and county for those aged ≥35, 35 to 64, and ≥65 years, age standardized using 10‐year age groups to the 2000 US standard population (as defined by the 2 national initiatives). 3 , 4 To summarize the distributions of the estimated death rates across counties, we calculated the median, 10th, and 90th percentiles of death rates by outcome and age group.
Estimating and Categorizing Percentage Change in Death Rates
We calculated percentage change in death rates as the difference between the 2017 and 2007 rate, divided by the 2007 rate. These years represent the most recent 10‐year period for which data were available in January 2020. To summarize the distributions of estimated percentage change in death rates across counties, we calculated the median, 10th, and 90th percentiles of percentage change by outcome and age group.
We then categorized percentage change estimates into 1 of 3 categories of achievement status:
Achieved 20% reduction: Counties with at least a 20% reduction in death rates from 2007 to 2017 (ie, percentage change ≤−20%).
Less than 20% reduction: Counties with decreasing death rates from 2007 to 2017, but with a <20% reduction (ie, percentage change >−20% and <0%).
Increased: Counties that experienced increasing death rates from 2007 to 2017 (ie, percentage change ≥0%).
We calculated the percentage of counties and the percentage of the 2017 population living in counties for each category of achievement status. To further explore geographic patterns within these county‐level results, we stratified the results using the 2013 National Center for Health Statistics Urban‐Rural Classification Scheme for Counties. 19 This classification includes 6 levels based on the county's population and proximity to metropolitan areas, ranging from the most urban (large central metropolitan counties) to the most rural counties (noncore counties).
Bayesian Spatiotemporal Models
The Bayesian spatiotemporal model in this analysis has been applied extensively to estimate county‐level CVD mortality, including death rates attributable to stroke, CHD, and all diseases of the heart. 8 , 11 , 12 , 15 Statistical details of this Bayesian spatiotemporal model have been previously published. 20 , 21 This model is based on the popular Besag‐York‐Mollié conditional autoregressive model for spatially referenced count data. 22 It includes the number of deaths as the outcome variable and no independent variables. By iteratively estimating parameters using a Markov chain Monte Carlo algorithm and borrowing statistical strength across space, time, and demographic neighbors, this model generates more precise, reliable rates, even in the presence of small case counts and small populations. 20 , 23
The iterative estimation of parameters and the resulting posterior distributions provided another advantage in that they permit all calculations to incorporate uncertainty in the underlying data. We performed all calculations using posterior distributions defined by the Markov chain Monte Carlo iterations. Estimates of county‐level rates and percentage change presented in this article are the medians of those posterior distributions. Likewise, achievement status was determined as the status with the largest posterior probability. The calculations of percentage of counties by achievement status and percentage of the population living in those counties likewise accounted for uncertainty in the rate estimates by using the posterior distributions, rather than the point estimates.
All analyses were completed using user‐developed code in the R programming language. This code is available on request to the corresponding author. Because all data are publicly available through National Center for Health Statistics, institutional review board approval was not required.
Data Suppression
We considered the rate for a given age group in a given county to be unreliable if the CI width was larger than the point estimate or if the population for the given demographic group in the given year was <500 people. 24 If the estimated death rate for either 2007 or 2017 was unreliable, results for the given county and age group were suppressed. After using these suppression criteria, we included CHD death rates for 3110 (99.2% of counties), 3070 (97.9% of counties), and 2989 (95.3% of counties) counties for those aged ≥35, 35 to 64, and ≥65 years, respectively, and stroke death rates for 3109 (99.1% of counties), 3064 (97.7% of counties), and 2989 (95.3% of counties) counties for those aged ≥35, 35 to 64, and ≥65 years, respectively (Table).
Table 1.
County‐Level CHD and Stroke Death Rates, Percentage Change in Death Rates, and Categories of Achievement Status, by Age Group, 2007 and 2017, United States
| Variable | CHD | Stroke | ||||
|---|---|---|---|---|---|---|
| People Aged ≥35 y | People Aged 35–64 y | People Aged ≥65 y | People Aged ≥35 y | People Aged 35–64 y | People Aged ≥65 y | |
| No. of included counties* | 3110 | 3070 | 2989 | 3109 | 3064 | 2989 |
| County‐level death rate (per 100 000), median (10th to 90th percentile) | ||||||
| 2007 | 248.9 (177.6 to 347.8) | 62.6 (39.5 to 101.2) | 811.9 (584.2 to 1128.0) | 91.1 (71.5 to 119.0) | 14.2 (9.3 to 24.5) | 323.6 (255.5 to 415.9) |
| 2017 | 193.6 (134.8 to 283.2) | 55.8 (33.4 to 97.8) | 604.6 (431.2 to 860.9) | 76.0 (60.1 to 97.2) | 13.6 (8.9 to 23.0) | 264.9 (211.6 to 329.9) |
| County‐level percentage change, 2007–2017, median (10th to 90th percentile) | −22.2 (−36.4 to −3.5) | −10.6 (−29.4 to 15.0) | −25.7 (−39.1 to −7.4) | −17.3 (−26.8 to −5.8) | −4.8 (−18.4 to 11.1) | −18.7 (−28.9 to −6.7) |
| Counties, % (95% CI) | ||||||
| Achieved 20% reduction | 56.1 (54.1 to 57.7) | 32.2 (29.4 to 35.6) | 64.1 (62.3 to 65.7) | 39.8 (36.9 to 42.7) | 17.9 (13.9 to 22.2) | 45.6 (42.8 to 48.3) |
| <20% reduction | 33.3 (31.8 to 34.8) | 35.6 (34.0 to 37.2) | 28.4 (26.9 to 29.9) | 49.9 (47.5 to 52.0) | 42.6 (40.5 to 44.6) | 44.8 (42.5 to 46.8) |
| Increased | 10.7 (9.7 to 11.9) | 32.2 (29.5 to 34.7) | 7.6 (6.6 to 8.5) | 10.3 (8.9 to 12.0) | 39.4 (35.5 to 44.8) | 9.6 (8.2 to 11.1) |
| 2017 population, % (95% CI) | ||||||
| Achieved 20% reduction | 76.6 (75.0 to 77.8) | 47.0 (42.2 to 50.7) | 79.6 (78.2 to 81.0) | 28.0 (25.1 to 31.2) | 20.8 (15.0 to 27.4) | 32.3 (29.4 to 35.4) |
| <20% reduction | 19.4 (18.1 to 21.0) | 38.5 (34.4 to 42.9) | 17.1 (15.6 to 18.5) | 58.3 (54.4 to 62.0) | 51.2 (45.1 to 56.9) | 52.3 (48.5 to 55.4) |
| Increased | 4.0 (3.5 to 4.5) | 14.5 (12.7 to 16.5) | 3.3 (2.9 to 3.8) | 13.6 (11.4 to 16.4) | 28.0 (23.8 to 33.4) | 15.3 (12.8 to 17.9) |
CHD indicates coronary heart disease; and CI, credible interval.
Only counties with reliable rates and age group–specific population >500 were included. See Methods for additional details.
Supplemental Analyses by Race/Ethnicity
Given racial/ethnic disparities in CHD and stroke death rates and their recent trends, 2 , 5 , 6 we performed a supplemental analysis to examine patterns of achieving a 20% reduction in CHD and stroke death rates by race/ethnicity. Using the same Bayesian multivariate space‐time conditional autoregressive models, we calculated county‐level death rates for the following racial/ethnic groups: American Indian/Alaska native, Asian/Pacific Islander, Black, Hispanic, and White groups. Hispanic ethnicity included all races; all races excluded those of Hispanic ethnicity. We used the same denominators, age standardization, and data suppression criteria described above, resulting in the exclusion of many counties with small populations for some racial/ethnic groups.
RESULTS
CHD Death Rates
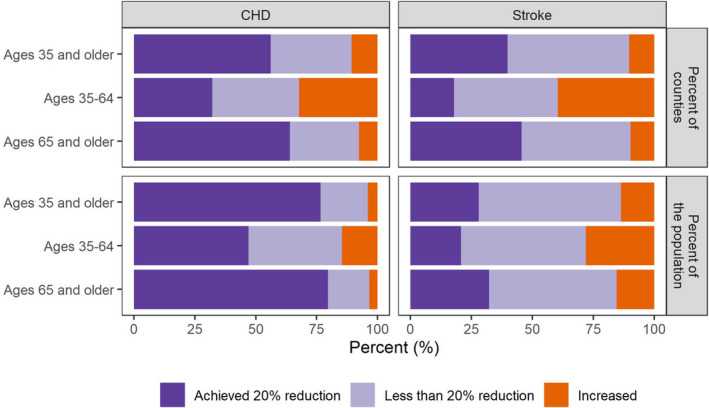
From 2007 to 2017, the median county‐level CHD death rate decreased from 2007 to 2017 across all age groups (aged ≥35 years: from 248.9 in 2007 to 193.6 in 2017 per 100 000; aged 35–64 years: from 62.6 in 2007 to 55.8 in 2017 per 100 000; aged ≥65 years: from 811.9 in 2007 to 604.6 in 2017 per 100 000; Table). The median county‐level percentage change in CHD death rates demonstrated reductions for all age groups, but failed to achieve the targeted 20% reduction for those aged 35 to 64 years (10.6% reduction) (Table). For those aged ≥35 years, 56.1% (95% CI, 54.1%–57.7%) of counties, representing 76.6% (95% CI, 75.0%–77.8%) of the population, achieved a 20% reduction in CHD death rates. The percentages of counties achieving a 20% reduction were lower for those aged 35 to 64 years than for those aged ≥65 years (32.2% [95% CI, 29.4%–35.6%] and 64.1% [95% CI, 62.3%–65.7%], respectively) (Table and Figure 1). Conversely, the percentages of counties with increasing death rates were higher for those aged 35 to 64 years than for those aged ≥65 years (32.2% [95% CI, 29.5%–34.7%] and 7.6% [95% CI, 6.6%–8.5%], respectively).
Figure 1. Percentage of counties and percentage of the population living in those counties by achievement status of coronary heart disease (CHD) and stroke death rates, United States, 2007 to 2017.
For those aged 35 to 64 and ≥65 years, the highest CHD death rates were concentrated in a band of counties stretching from Oklahoma through West Virginia (Figure 2). However, the spatial patterns of achieving the targeted 20% reduction were more geographically dispersed. Rural and less urban counties exhibited smaller proportions of counties achieving the 20% reduction and larger proportions of counties with increasing CHD death rates (Figure 3 and Table S1).
Figure 2. County‐level coronary heart disease (CHD) death rates, 2017, and achievement status for CHD death rates by age group, United States, 2007 to 2017.
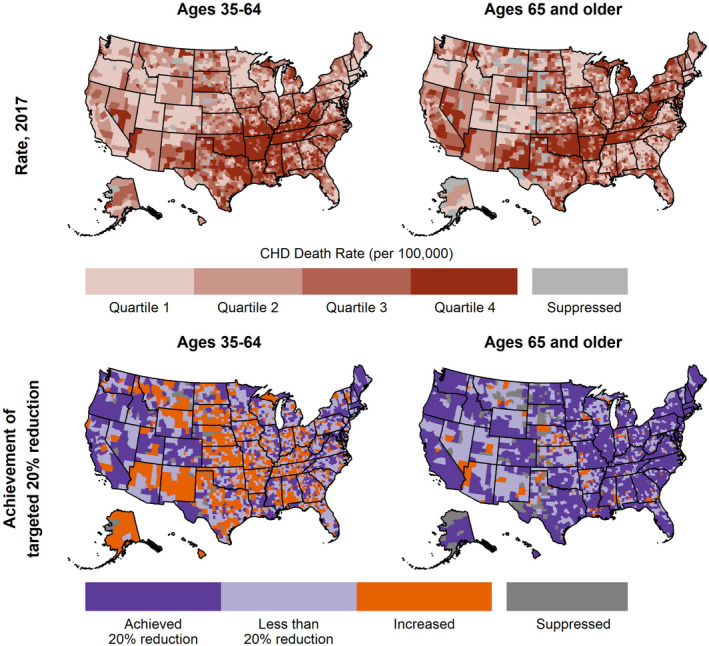
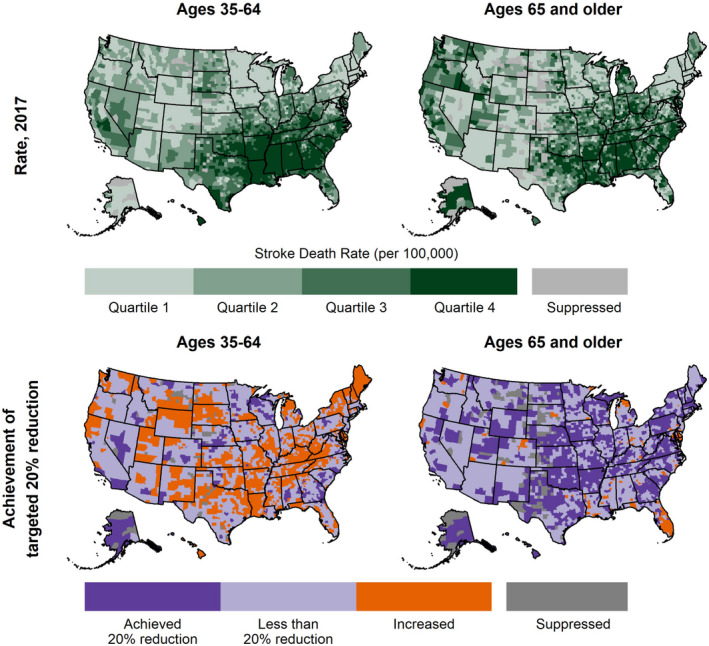
Figure 3. County‐level stroke death rates, 2017, and achievement status for stroke death rates by age group, United States, 2007 to 2017.
Stroke Death Rates
From 2007 to 2017, the median county‐level stroke death rate decreased across all age groups (aged ≥35 years: from 91.1 in 2007 to 76.0 in 2017 per 100 000; aged 35–64 years: from 14.2 in 2007 to 13.6 in 2017 per 100 000; aged ≥65 years: from 323.6 in 2007 to 264.9 in 2017 per 100 000) (Table). However, the median county‐level percentage change in stroke death rates for all age groups failed to reach a 20% reduction (17.3%, 4.8%, and 18.7% reduction for those aged ≥35, 35–64, and ≥65 years, respectively). For those aged ≥35 years, 39.8% (95% CI, 36.9%–42.7%) of counties, representing 28.0% (95% CI, 25.1%–31.2%) of the population, achieved a 20% reduction in stroke death rates. The proportions of counties achieving the targeted reduction were lower for those aged 35 to 64 years than for those aged ≥65 years (17.9% [95% CI, 13.9%–22.2%] and 45.6% [95% CI, 42.8%–48.3%], respectively) (Table and Figure 1). Conversely, the proportions of counties with increasing rates and the proportions of the population living in those counties were much higher for those aged 35 to 64 years than for those aged ≥65 years (39.4% [95% CI, 35.5%–44.8%] and 9.6% [95% CI, 8.2%–11.1%], respectively) (Table and Figure 1).
For those aged 35 to 64 and ≥65 years, the highest stroke death rates stretched from the southern Atlantic Coast through Arkansas and Louisiana (Figure 4), which forms the well‐established Stroke Belt. 16 , 17 However, counties that achieved the targeted 20% reduction were more geographically dispersed. By urban‐rural classification, for those aged 35 to 64 years, large central metropolitan counties had the highest percentage of counties achieving a 20% reduction, and all other urban‐rural classifications had similar percentages of counties (≈15%–20%) achieving a 20% reduction (Figure 3 and Table S1). This pattern was reversed for those aged ≥65 years, with large central metropolitan counties having the smallest percentage of counties achieving a 20% reduction and increasing percentages of counties as the urban‐rural classification becomes more rural.
Figure 4. Percentage of counties by achievement status for coronary heart disease (CHD) and stroke death rates, by age group and urban‐rural classification, United States, 2007 to 2017.
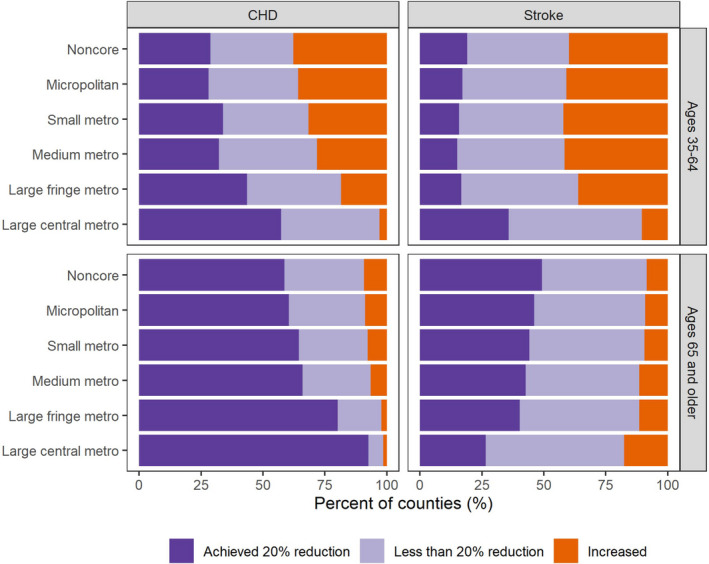
Data are shown in Table S1. Metro indicates metropolitan.
CHD and Stroke Death Rates by Race/Ethnicity
The patterns of achieving 20% reductions in CHD and stroke death rates by age group across race/ethnicity were similar to those observed for the total population (Tables S2 through S5). For each racial/ethnic group, the percentages of counties achieving a 20% decline in CHD and stroke death rates were smaller among those aged 35 to 64 years compared with those aged ≥65 years, but there were racial/ethnic differences. For CHD death rates, the percentages of counties achieving a 20% decline among Black populations and Hispanic populations were larger than among White populations for both age groups; for stroke death rates, the percentages for Black, Hispanic, and Asian/Pacific Islander populations were larger than White populations for those aged 35 to 64 years only.
DISCUSSION
Using targets defined by HP2020 and AHA 2020 Impact Goals, our county‐level analysis found that more than half of US counties achieved the targeted national 20% reduction in CHD death rates, but only 40% of counties achieved the 20% reduction in stroke death rates. We found variation in achieving the targeted reductions by age group and geography for both heart disease and stroke mortality. Specifically, the proportions of counties achieving targeted reductions in CHD and stroke mortality were smaller among adults aged 35 to 64 years than among adults aged ≥65 years. In addition, we found an urban‐rural disparity in county‐level achievement of mortality targets, with urban countries more frequently achieving a 20% reduction in death rates compared with rural counties (except for stroke death rates in those aged ≥65 years).
Disparities in county‐level achievement of the targeted 20% reduction in CHD and stroke death rates by age group (and the consistency of that pattern by race/ethnicity) reflect the recent national slowing of declines in CVD mortality, 2 , 5 , 9 which are concentrated among younger adults. 8 , 11 , 12 These recent trends break with preceding decades of declining national death rates and likely reflect cohort effects in which the growing population burden of traditional CVD risk factors has occurred at successively younger ages. 12 , 25 , 26 , 27 Consequently, younger adults have also experienced recent increases in both stroke hospitalization and associated stroke risk factors. 28 , 29 These results reinforce the critical need to preserve and improve cardiovascular health across the life course, especially given the preventable nature of cardiovascular events and the increased risk of those events when risk factors begin to accumulate before the age of 50 years. 4 , 30 , 31
Observed differences in achievement levels by county characteristics can inform a more focused response in communities that have not achieved the targeted 20% declines. As county‐level achievement of a 20% reduction was not confined to those parts of the country with the highest death rates (eg, the Stroke Belt), focusing prevention and treatment resources solely in counties with the highest burden may divert resources from counties with increasing death rates. In addition, the lack of achievement in less urban and rural counties may stem from documented differences in health status and access to care in regions outside urban areas. 32 , 33 , 34 These geographical disparities in CHD and stroke mortality trends further suggest that strictly clinical approaches may not fully address root causes. Efforts to improve death rates in counties that did not achieve a 20% reduction may require an additional focus on underlying social determinants of health. 35 , 36 , 37 , 38
The widespread lack of achievement of the targeted reductions supports the need for policies and programs at the national, state, and local levels aimed at CHD and stroke prevention and treatment. These responses should include evidence‐based strategies specific to younger adults and those living outside the most urban counties, and should use coordinated systems of care and macro‐level approaches that incorporate economic, political, and social environments. 35 , 36 , 37 , 38 , 39 , 40 Many national initiatives already promote such strategies and could serve as a platform for targeted local responses. For example, the US Centers for Disease Control and Prevention and the Centers for Medicare and Medicaid Services colead the Million Hearts 2022 initiative in collaboration with multiple partners, including the AHA. 40 , 41 This initiative, which includes adults aged 35 to 64 years as a priority population, aims to implement evidence‐based strategies to prevent 1 million acute cardiovascular events through the year 2022. 40 Likewise, the US Centers for Disease Control and Prevention's Paul Coverdell National Acute Stroke Program and the AHA's Get With The Guidelines program develop statewide partnerships to improve the quality of stroke care and coordinated systems of care to reduce stroke‐related death and disability. 42 , 43 The Target:BP initiative, a collaboration between AHA and the American Medical Association, mobilizes healthcare organizations to improve hypertension control through evidence‐based quality improvement interventions across multiple settings. 44 Finally, with the release of its 2030 Impact Goal, 45 AHA expressed a renewed focus on health equity and includes strategies that focus on reducing geographical and other disparities in leading causes of death in the United States (including CHD and stroke).
A key strength of this study is its application of a fully Bayesian spatiotemporal model to national surveillance data. By borrowing statistical strength across adjacent counties, age groups, and years, this model estimated rates that were more precise than other statistical methods, even in counties with small numbers of deaths. Consequently, we included more counties than would be possible with other statistical methods. 23 In addition, this analysis used national vital statistics data that include all recorded deaths.
A primary limitation of this study is the potential misclassification of deaths based on the use of death certificate data. However, the use of death certificates at the aggregate level for surveillance has been validated and is widely accepted. 46 Local variation in reporting heart disease as the underlying cause of death represents a potential source of bias, but the use of broad ICD‐10 categories for CHD and stroke reduces the potential for misclassification. 47
CONCLUSIONS
Our analysis of county‐level trends in CHD and stroke mortality found that approximately half of US counties achieved the targeted 20% reduction in CHD death rates set forward by the HP2020 and AHA 2020 Impact Goals initiatives, and only 40% of counties achieved the 20% reduction in stroke death rates. Large proportions of US counties either experienced increasing death rates or did not achieve a 20% reduction, highlighting a need for a continued focus on CHD and stroke prevention and treatment, especially among younger adults living outside of urban centers. Documenting these county‐level patterns in achieving the targeted 20% reductions in CHD and stroke mortality provides a foundation for robust responses by clinicians, public health professionals, and the communities they serve.
Sources of Funding
The Centers for Disease Control and Prevention supported this study. No external funding was used. The findings and conclusions in this report are those of the authors and do not necessarily represent the official position of the Centers for Disease Control and Prevention.
Disclosures
None.
Supporting information
Tables S1–S5
(J Am Heart Assoc. 2021;10:e019562. DOI: 10.1161/JAHA.120.019562.)
Supplementary Material for this article is available at https://www.ahajournals.org/doi/suppl/10.1161/JAHA.120.019562
For Sources of Funding and Disclosures, see page 9.
REFERENCES
- 1. Virani SS, Alonso A, Benjamin EJ, Bittencourt MS, Callaway CW, Carson AP, Chamberlain AM, Chang AR, Cheng S, Delling FN, et al. Heart disease and stroke statistics‐2020 update: a report from the American Heart Association. Circulation. 2020;141:e139–e596. [DOI] [PubMed] [Google Scholar]
- 2. Sidney S, Quesenberry CP Jr, Jaffe MG, Sorel M, Go AS, Rana JS. Heterogeneity in national U.S. mortality trends within heart disease subgroups, 2000–2015. BMC Cardiovasc Disord. 2017;17:192. DOI: 10.1186/s12872-017-0630-2. [DOI] [PMC free article] [PubMed] [Google Scholar]
- 3. Healthy People . [Internet]. Department of Health and Human Services, Office of Disease Prevention and Health Promotion. Washington, DC: U.S. 2020[cited June 1, 2020]. Available at: https://www.healthypeople.gov/2020/About‐Healthy‐People/History‐Development‐Healthy‐People‐2020.
- 4. Lloyd‐Jones DM, Hong Y, Labarthe D, Mozaffarian D, Appel LJ, Van Horn L, Greenlund K, Daniels S, Nichol G, Tomaselli GF, et al. Defining and setting national goals for cardiovascular health promotion and disease reduction. Circulation. 2010;121:586–613. DOI: 10.1161/CIRCULATIONAHA.109.192703. [DOI] [PubMed] [Google Scholar]
- 5. Sidney S, Quesenberry CP Jr, Jaffe MG, Sorel M, Nguyen‐Huynh MN, Kushi LH, Go AS, Rana JS. Recent trends in cardiovascular mortality in the United States and public health goals. JAMA Cardiol. 2016;1:594–599. DOI: 10.1001/jamacardio.2016.1326. [DOI] [PubMed] [Google Scholar]
- 6. Shiels MS, Chernyavskiy P, Anderson WF, Best AF, Haozous EA, Hartge P, Rosenberg PS, Thomas D, Freedman ND, de Gonzalez AB. Trends in premature mortality in the USA by sex, race, and ethnicity from 1999 to 2014: an analysis of death certificate data. Lancet. 2017;389:1043–1054. DOI: 10.1016/S0140-6736(17)30187-3. [DOI] [PMC free article] [PubMed] [Google Scholar]
- 7. Ma J, Ward EM, Siegel RL, Jemal A. Temporal trends in mortality in the United States, 1969–2013. JAMA. 2015;314:1731–1739. DOI: 10.1001/jama.2015.12319. [DOI] [PubMed] [Google Scholar]
- 8. Hall EW, Vaughan AS, Ritchey MD, Schieb L, Casper M. Stagnating national declines in stroke mortality mask widespread county‐level increases, 2010–2016. Stroke. 2019;50:3355–3359. DOI: 10.1161/STROKEAHA.119.026695. [DOI] [PMC free article] [PubMed] [Google Scholar]
- 9. Yang Q, Tong X, Schieb L, Vaughan A, Gillespie C, Wiltz JL, King SC, Odom E, Merritt R, Hong Y, et al. Vital signs: recent trends in stroke death rates—United States, 2000–2015. MMWR Morb Mortal Wkly Rep. 2017;66:933–939. DOI: 10.15585/mmwr.mm6635e1. [DOI] [PMC free article] [PubMed] [Google Scholar]
- 10. Pahigiannis K, Thompson‐Paul AM, Barfield W, Ochiai E, Loustalot F, Shero S, Hong Y. Progress toward improved cardiovascular health in the United States: healthy people 2020 heart disease and stroke objectives. Circulation. 2019;139:1957–1973. DOI: 10.1161/CIRCULATIONAHA.118.035408. [DOI] [PMC free article] [PubMed] [Google Scholar]
- 11. Vaughan AS, Ritchey MD, Hannan J, Kramer MR, Casper M. Widespread recent increases in county‐level heart disease mortality across age groups. Ann Epidemiol. 2017;27:796–800. DOI: 10.1016/j.annepidem.2017.10.012. [DOI] [PMC free article] [PubMed] [Google Scholar]
- 12. Vaughan AS, Schieb L, Quick H, Kramer MR, Casper M. Before the here and now: what we can learn from variation in spatiotemporal patterns of changing heart disease mortality by age group, time period, and birth cohort. Soc Sci Med. 2018;217:97–105. DOI: 10.1016/j.socscimed.2018.09.045. [DOI] [PMC free article] [PubMed] [Google Scholar]
- 13. Wilmot KA, O'Flaherty M, Capewell S, Ford ES, Vaccarino V. Coronary heart disease mortality declines in the United States from 1979 through 2011: evidence for stagnation in young adults, especially women. Circulation. 2015;132:997–1002. [DOI] [PMC free article] [PubMed] [Google Scholar]
- 14. Yaemsiri S, Alfier JM, Moy E, Rossen LM, Bastian B, Bolin J, Ferdinand AO, Callaghan T, Heron M. Healthy people 2020: rural areas lag in achieving targets for major causes of death. Health Aff (Millwood). 2019;38:2027–2031. DOI: 10.1377/hlthaff.2019.00915. [DOI] [PMC free article] [PubMed] [Google Scholar]
- 15. Vaughan AS, Schieb L, Casper M. Historic and recent trends in county‐level coronary heart disease death rates by race, gender, and age group, United States, 1979–2017. PLoS One. 2020;15:e0235839. DOI: 10.1371/journal.pone.0235839 [DOI] [PMC free article] [PubMed] [Google Scholar]
- 16. Lanska DJ, Kuller LH. The geography of stroke mortality in the United States and the concept of a stroke belt. Stroke. 1995;26:1145–1149. DOI: 10.1161/01.STR.26.7.1145. [DOI] [PubMed] [Google Scholar]
- 17. Howard G, Howard VJ. Twenty years of progress toward understanding the stroke belt. Stroke. 2020;51:742–750. DOI: 10.1161/STROKEAHA.119.024155. [DOI] [PubMed] [Google Scholar]
- 18. National Center for Health Statistics . US census populations with bridged race categories. 2017. Available at: https://www.cdc.gov/nchs/nvss/bridged_race.htm. Accessed June 1, 2020.
- 19. Ingram D, Franco S. 2013 NCHS urban–rural classification scheme for counties. Vital Health Stat 2. 2014;2:1–25. [PubMed] [Google Scholar]
- 20. Quick H, Casper M, Waller LA. A multivariate space‐time model for analysing county level heart disease death rates by race and sex. J R Stat Soc Ser C Appl Stat. 2017;67:291–304. DOI: 10.1111/rssc.12215. [DOI] [Google Scholar]
- 21. Quick H, Waller LA, Casper M. Multivariate spatiotemporal modeling of age‐specific stroke mortality. Ann Appl Stat. 2017;11:2170–2182. DOI: 10.1214/17-AOAS1068. [DOI] [Google Scholar]
- 22. Besag J, York J, Mollié A. Bayesian image restoration, with two applications in spatial statistics. Ann Inst Stat Math. 1991;43:1–20. DOI: 10.1007/BF00116466. [DOI] [Google Scholar]
- 23. Vaughan AS, Kramer MR, Waller LA, Schieb LJ, Greer S, Casper M. Comparing methods of measuring geographic patterns in temporal trends: an application to county‐level heart disease mortality in the United States, 1973 to 2010. Ann Epidemiol. 2015;25:329–335.e323. DOI: 10.1016/j.annepidem.2015.02.007. [DOI] [PMC free article] [PubMed] [Google Scholar]
- 24. Centers for Disease Control and Prevention . 2014 Technical notes United States cancer statistics. 2014. Available at: https://www.cdc.gov/cancer/uscs/pdf/uscs‐2014‐technical‐notes.pdf. Accessed June 1, 2020.
- 25. Kramer MR, Valderrama AL, Casper ML. Decomposing black‐white disparities in heart disease mortality in the United States, 1973–2010: an age‐period‐cohort analysis. Am J Epidemiol. 2015;182:302–312. DOI: 10.1093/aje/kwv050. [DOI] [PMC free article] [PubMed] [Google Scholar]
- 26. Pearson‐Stuttard J, Guzman‐Castillo M, Penalvo JL, Rehm CD, Afshin A, Danaei G, Kypridemos C, Gaziano T, Mozaffarian D, Capewell S, et al. Modeling future cardiovascular disease mortality in the United States: national trends and racial and ethnic disparities. Circulation. 2016;133:967–978. DOI: 10.1161/CIRCULATIONAHA.115.019904. [DOI] [PMC free article] [PubMed] [Google Scholar]
- 27. Yang Y. Trends in U.S. adult chronic disease mortality, 1960–1999: age, period, and cohort variations. Demography. 2008;45:387–416. DOI: 10.1353/dem.0.0000. [DOI] [PMC free article] [PubMed] [Google Scholar]
- 28. George MG, Tong X, Bowman BA. Prevalence of cardiovascular risk factors and strokes in younger adults. JAMA Neurol. 2017;74:695–703. DOI: 10.1001/jamaneurol.2017.0020. [DOI] [PMC free article] [PubMed] [Google Scholar]
- 29. Ramirez L, Kim‐Tenser MA, Sanossian N, Cen S, Wen G, He S, Mack WJ, Towfighi A. Trends in acute ischemic stroke hospitalizations in the United States. J Am Heart Assoc. 2016;5:e003233. DOI: 10.1161/JAHA.116.003233. [DOI] [PMC free article] [PubMed] [Google Scholar]
- 30. Lloyd‐Jones DM, Leip EP, Larson MG, D'Agostino RB, Beiser A, Wilson PW, Wolf PA, Levy D. Prediction of lifetime risk for cardiovascular disease by risk factor burden at 50 years of age. Circulation. 2006;113:791–798. DOI: 10.1161/CIRCULATIONAHA.105.548206. [DOI] [PubMed] [Google Scholar]
- 31. Mensah GA, Wei GS, Sorlie PD, Fine LJ, Rosenberg Y, Kaufmann PG, Mussolino ME, Hsu LL, Addou E, Engelgau MM, et al. Decline in cardiovascular mortality: possible causes and implications. Circ Res. 2017;120:366–380. DOI: 10.1161/CIRCRESAHA.116.309115. [DOI] [PMC free article] [PubMed] [Google Scholar]
- 32. Matthews KA, Croft JB, Liu Y, Lu H, Kanny D, Wheaton AG, Cunningham TJ, Khan LK, Caraballo RS, Holt JB, et al. Health‐related behaviors by urban‐rural county classification—United States, 2013. MMWR Surveill Summ. 2017;66:1–8. DOI: 10.15585/mmwr.ss6605a1. [DOI] [PMC free article] [PubMed] [Google Scholar]
- 33. Dwyer M, Rehman S, Ottavi T, Stankovich J, Gall S, Peterson G, Ford K, Kinsman L. Urban‐rural differences in the care and outcomes of acute stroke patients: systematic review. J Neurol Sci. 2019;397:63–74. DOI: 10.1016/j.jns.2018.12.021. [DOI] [PubMed] [Google Scholar]
- 34. Howard G, Kleindorfer DO, Cushman M, Long DL, Jasne A, Judd SE, Higginbotham JC, Howard VJ. Contributors to the excess stroke mortality in rural areas in the United States. Stroke. 2017;48:1773–1778. DOI: 10.1161/STROKEAHA.117.017089. [DOI] [PMC free article] [PubMed] [Google Scholar]
- 35. Adler NE, Glymour MM, Fielding J. Addressing social determinants of health and health inequalities. JAMA. 2016;316:1641–1642. DOI: 10.1001/jama.2016.14058. [DOI] [PubMed] [Google Scholar]
- 36. Brown AF, Ma GX, Miranda J, Eng E, Castille D, Brockie T, Jones P, Airhihenbuwa CO, Farhat T, Zhu L, et al. Structural interventions to reduce and eliminate health disparities. Am J Public Health. 2019;109:S72–S78. DOI: 10.2105/AJPH.2018.304844. [DOI] [PMC free article] [PubMed] [Google Scholar]
- 37. Yi H, Taylor LA, Tan AX, Coyle CE, Ndumele C, Rogan E, Canavan M, Curry LA, Bradley EH. Leveraging the social determinants of health: what works? PLoS One. 2016;11:e0160217. DOI: 10.1371/journal.pone.0160217. [DOI] [PMC free article] [PubMed] [Google Scholar]
- 38. Rose G. Rose's Strategy of Preventive Medicine. New York City, NY: Oxford University Press; 2008. [Google Scholar]
- 39. Zajacova A, Montez JK. Macro‐level perspective to reverse recent mortality increases. Lancet. 2017;389:991–992. DOI: 10.1016/S0140-6736(17)30186-1. [DOI] [PubMed] [Google Scholar]
- 40. Wright JS, Wall HK, Ritchey MD. Million hearts 2022: small steps are needed for cardiovascular disease prevention. JAMA. 2018;320:1857–1858. DOI: 10.1001/jama.2018.13326. [DOI] [PMC free article] [PubMed] [Google Scholar]
- 41. American Heart Association . About the million hearts collaboration. Available at: https://www.heart.org/en/professional/million‐hearts/about‐million‐hearts. Accessed June 1, 2020.
- 42. Labarthe DR, Biggers A, LaPier T, George MG; Paul Coverdell National Acute Stroke Registry . The Paul Coverdell National Acute Stroke Registry (PCNASR): a public health initiative. Am J Prev Med. 2006;31:S192–S195. DOI: 10.1016/j.amepre.2006.07.027. [DOI] [PubMed] [Google Scholar]
- 43. Smaha LA; American Heart Association . The American Heart Association get with the guidelines program. Am Heart J. 2004;148:S46–S48. DOI: 10.1016/j.ahj.2004.09.015. [DOI] [PubMed] [Google Scholar]
- 44. Target: Bp . Available at: https://targetbp.org/. Accessed June 1, 2020.
- 45. Angell SY, McConnell MV, Anderson CAM, Bibbins‐Domingo K, Boyle DS, Capewell S, Ezzati M, de Ferranti S, Gaskin DJ, Goetzel RZ, et al. The American Heart Association 2030 impact goal: a presidential advisory from the American Heart Association. Circulation. 2020;141:e120–e138. DOI: 10.1161/CIR.0000000000000758. [DOI] [PMC free article] [PubMed] [Google Scholar]
- 46. Coady S, Sorlie P, Cooper L, Folsom A, Rosamond W, Conwill D. Validation of death certificate diagnosis for coronary heart disease: the Atherosclerosis Risk in Communities (ARIC) study. J Clin Epidemiol. 2001;54:40–50. DOI: 10.1016/S0895-4356(00)00272-9. [DOI] [PubMed] [Google Scholar]
- 47. Ives DG, Samuel P, Psaty BM, Kuller LH. Agreement between nosologist and cardiovascular health study review of deaths: implications of coding differences. J Am Geriatr Soc. 2009;57:133–139. DOI: 10.1111/j.1532-5415.2008.02056.x. [DOI] [PMC free article] [PubMed] [Google Scholar]
Associated Data
This section collects any data citations, data availability statements, or supplementary materials included in this article.
Supplementary Materials
Tables S1–S5