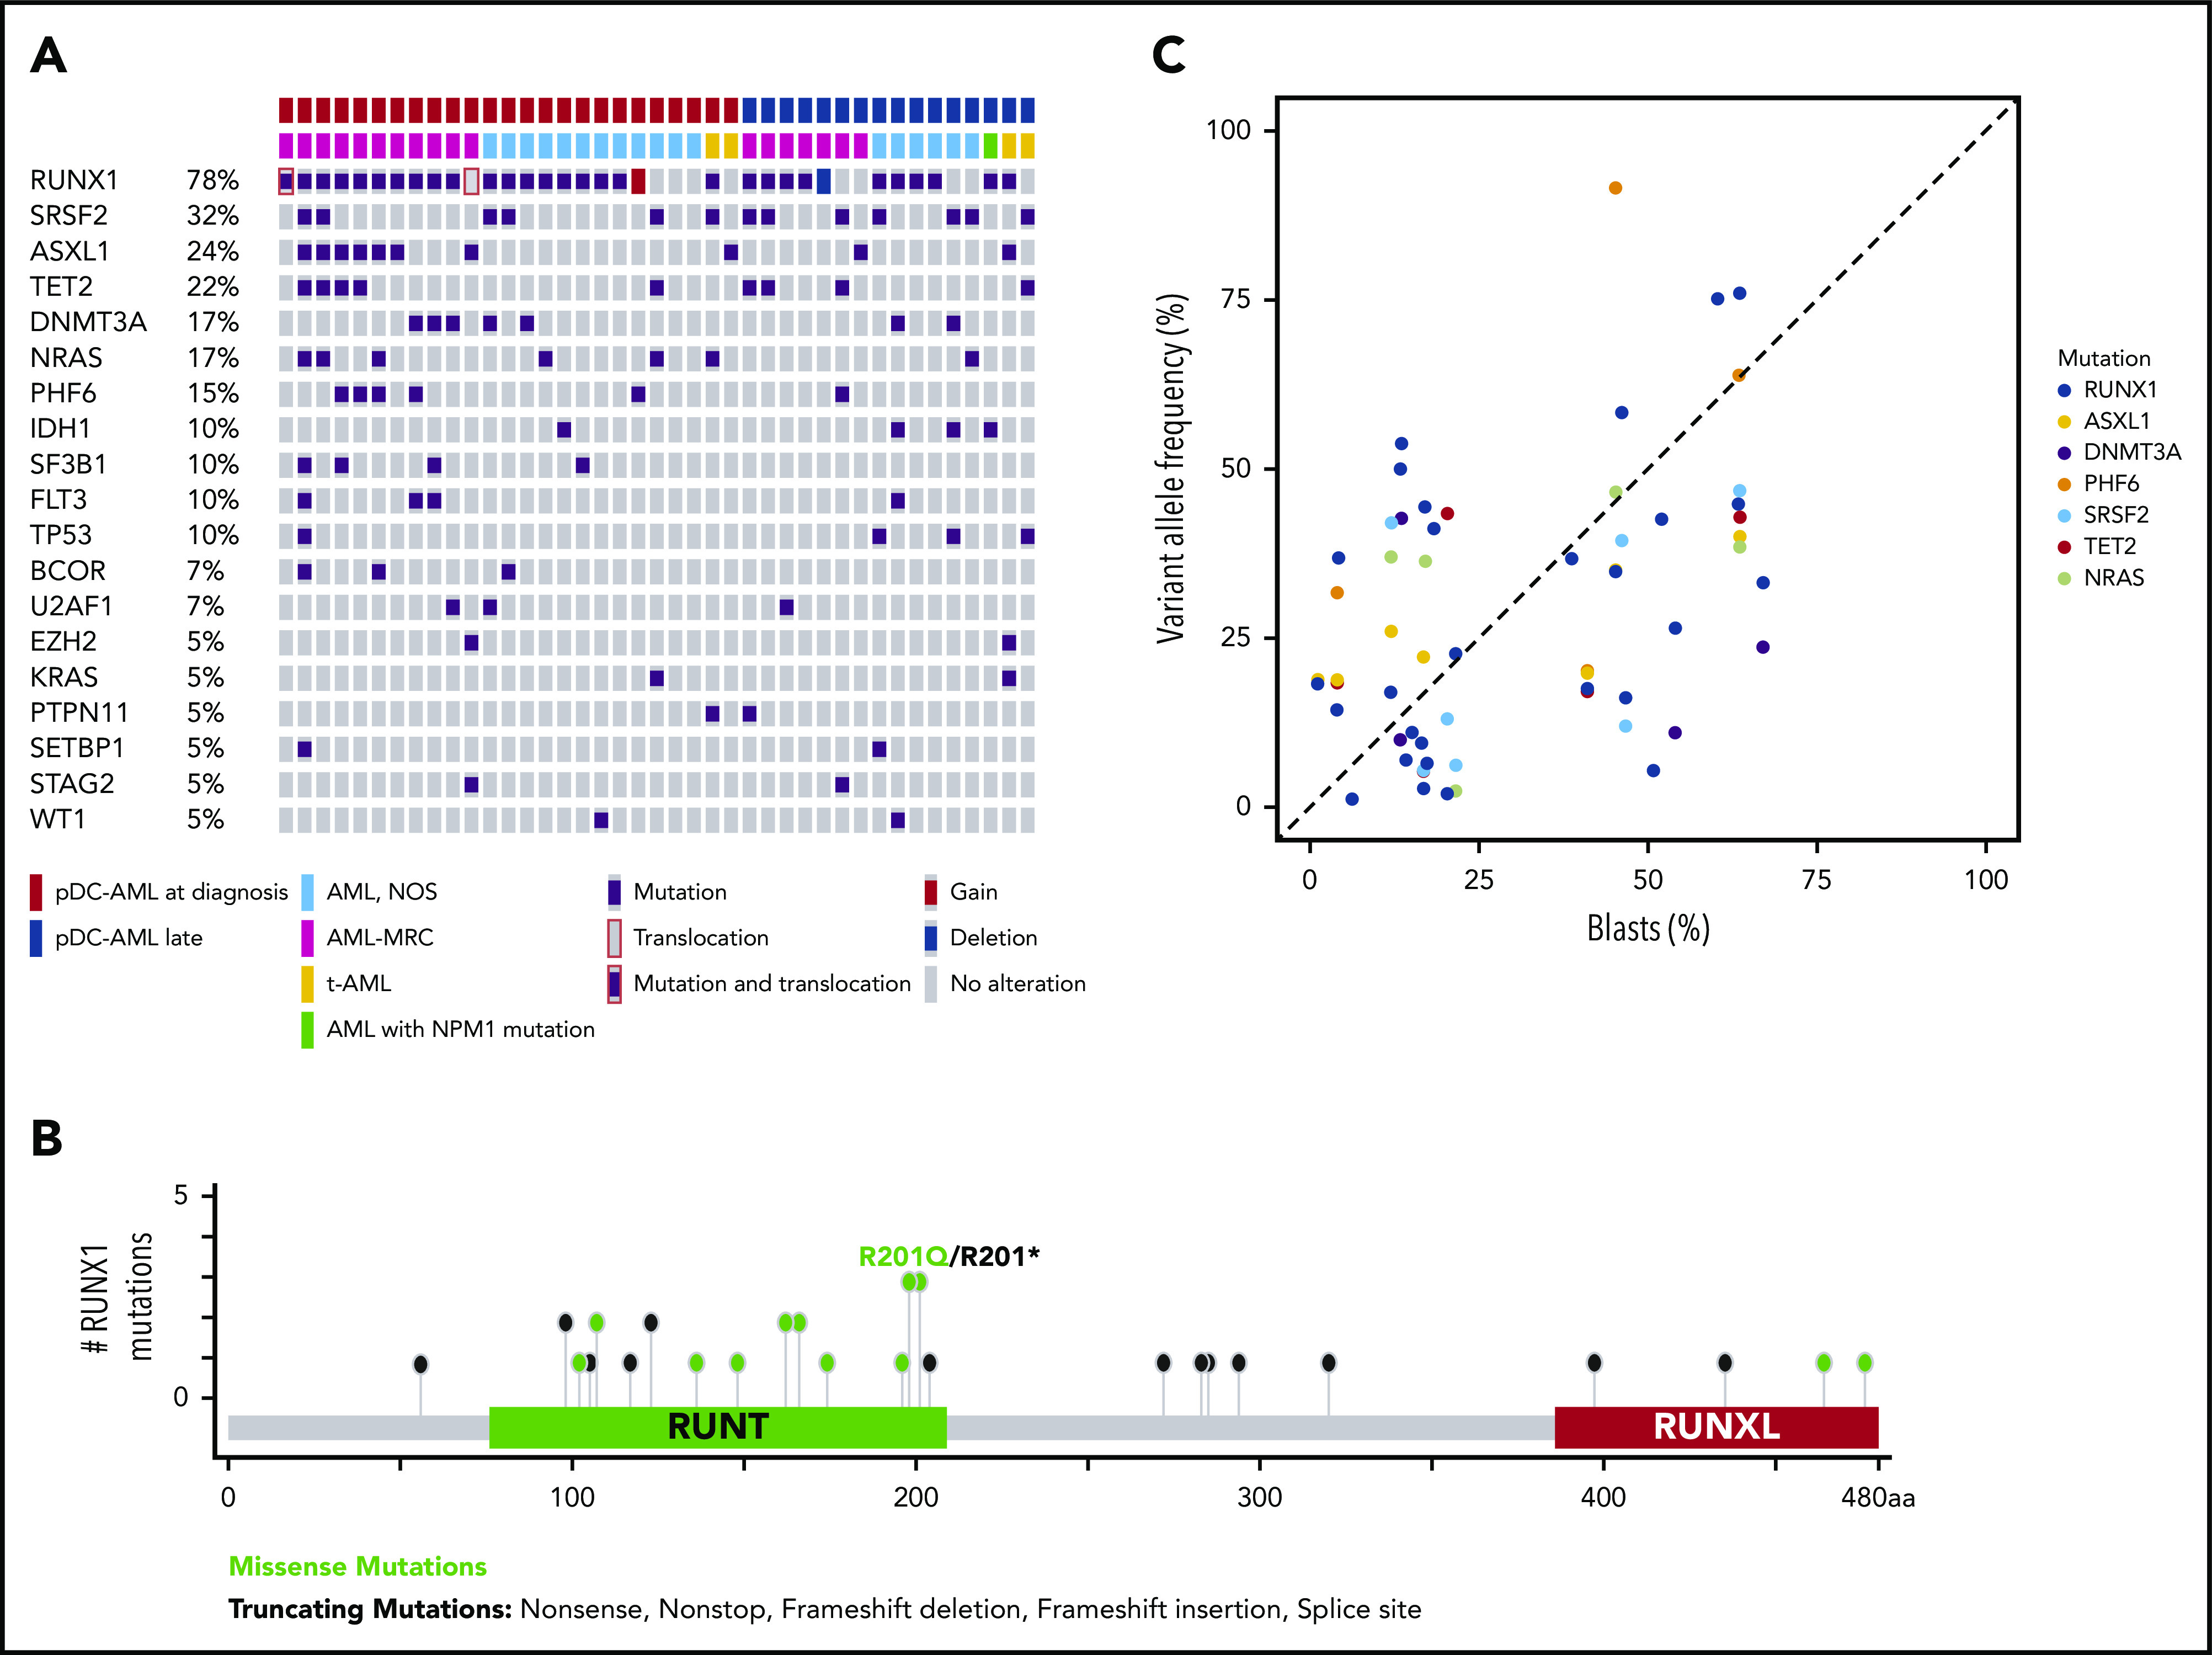
Figure 2.

RUNX1 mutations in pDC-AML. (A) Oncoplot of mutations in pDC-AML. (B) Lollipop graph of RUNX1 mutations in pDC-AML. (C) VAF of the major mutations compared with blast percentages. AML, NOS, AML not otherwise specified; AML-MRC, AML with myelodysplasia-related changes; t-AML: therapy-related AML.
