

Abstract
Background
Shortening the pain‐to‐balloon (P2B) and door‐to‐balloon (D2B) intervals in patients with ST‐segment–elevation myocardial infarction (STEMI) treated by primary percutaneous coronary intervention (PPCI) is essential in order to limit myocardial damage. We investigated whether direct admission of PPCI‐treated patients with STEMI to the catheterization laboratory, bypassing the emergency department, expedites reperfusion and improves prognosis.
Methods and Results
Consecutive PPCI‐treated patients with STEMI included in the ACSIS (Acute Coronary Syndrome in Israel Survey), a prospective nationwide multicenter registry, were divided into patients admitted directly or via the emergency department. The impact of the P2B and D2B intervals on mortality was compared between groups by logistic regression and propensity score matching. Of the 4839 PPCI‐treated patients with STEMI, 1174 were admitted directly and 3665 via the emergency department. Respective median P2B and D2B were shorter among the directly admitted patients with STEMI (160 and 35 minutes) compared with those admitted via the emergency department (210 and 75 minutes, P<0.001). Decreased mortality was observed with direct admission at 1 and 2 years and at the end of follow‐up (median 6.4 years, P<0.001). Survival advantage persisted after adjustment by logistic regression and propensity matching. P2B, but not D2B, impacted survival (P<0.001).
Conclusions
Direct admission of PPCI‐treated patients with STEMI decreased mortality by shortening P2B and D2B intervals considerably. However, P2B, but not D2B, impacted mortality. It seems that the D2B interval has reached its limit of effect. Thus, all efforts should be extended to shorten P2B by educating the public to activate early the emergency medical services to bypass the emergency department and allow timely PPCI for the best outcome.
Keywords: admission pathway, long‐term mortality, ST‐segment–elevation myocardial infarction, primary percutaneous coronary intervention
Subject Categories: Mortality/Survival, Percutaneous Coronary Intervention, Treatment
Nonstandard Abbreviations and Acronyms
- Acute Coronary Syndrome in Israel Survey
Acute Coronary Syndrome in Israel Survey
- ACTION
Acute Coronary Treatment and Intervention Outcomes Network
- D2B
door‐to‐balloon
- NCDR
National Cardiovascular Data Registry
- NRMI
National Registry of Myocardial Infarction
- PPCI
primary percutaneous coronary intervention
- P2B
pain‐to‐balloon
Clinical Perspective
What Is New?
Direct admission of primary percutaneous coronary intervention–treated patients with ST‐segment–elevation myocardial infarction to the catheterization laboratory, bypassing the emergency department, significantly decreased mortality by shortening pain‐to‐balloon and door‐to‐balloon intervals considerably.
The pain‐to‐balloon, but not door‐to‐balloon, interval impacted short‐ and long‐term mortality.
It seems that the door‐to‐balloon interval may have reached its limit of effect.
What Are the Clinical Implications?
All efforts should be extended to shorten pain‐to‐balloon time by educating the public to activate early the emergency medical services to bypass the emergency department and enable the performance of timely primary percutaneous coronary intervention.
This requires thorough training of the emergency medical services crews and effective communication with the catheterization laboratory staff.
The mortality risk after primary percutaneous coronary intervention (PPCI) in patients with ST‐segment–elevation myocardial infarction (STEMI) has been strongly associated with the time from hospital admission to balloon inflation (door‐to‐balloon [D2B]). 1 , 2 On the other hand, mortality risk was previously shown not to correlate with the time from symptom onset to reperfusion (pain‐to‐balloon [P2B]). 1 , 3 , 4 , 5 In view of the above, current guidelines and other advocates require the performance of PPCI within 90 minutes after admission (D2B) when transferring patients with STEMI to a nonpercutaneous coronary intervention center or within 60 minutes if presenting to a percutaneous coronary intervention medical center. 6 , 7
The ACSIS (Acute Coronary Syndrome in Israel Survey) registry is a biannual registry performed for more than 20 years in all coronary care units in Israel. Under the ACSIS framework performed every 2 years, the details of consecutive patients admitted to all cardiac care units for an acute coronary syndrome during a 2‐month period are prospectively recorded. Admission of patients with STEMI included in the ACSIS registry occurred either via the emergency department (ED), as occurs in most cases, or by the emergency medical services (EMS) ambulance directly to the catheterization laboratory. The pathway via the ED usually involves some inherent delay and, therefore, results in longer intervals to reperfusion. Thus, bypassing the ED is elected whenever possible in order to expedite reperfusion by PPCI.
The purpose of the current study was to evaluate, based on the relatively large long‐term prospective multicenter ACSIS registry, the characteristics and mortality of patients with STEMI admitted directly to the catheterization laboratory compared with patients admitted via the ED. In addition, we sought to assess whether D2B or the P2B interval representing the total ischemic time impact long‐term mortality.
Methods
Study Population
The ACSIS registries are performed every 2 years for 2 months during which the details of all consecutive patients admitted to all cardiac units in Israel with an acute coronary syndrome are prospectively recorded. The population evaluated in the present study comprised all patients with STEMI who were admitted and immediately underwent PPCI included in the combined 2004 to 2016 prospective ACSIS registries. The periods chosen were characterized by similar medical and interventional therapies, and by more complete long‐term patient data. There was an effort throughout the years, and under the direction of the guidelines, to shorten the time to coronary intervention and to admit patients with STEMI directly to the catheterization laboratory, but this depended on patient response, on the awareness of the emergency medical personnel, as well as on hospital local protocol. STEMI was frequently established based on a prehospital ECG performed by EMS personnel. Throughout the study period, participating medical centers have gradually implemented the practice to admit patients with STEMI directly to the catheterization laboratory in order to facilitate reperfusion by PPCI. Therefore, over the years, more patients were admitted directly to the catheterization laboratory. Yet, a considerable number of patients with STEMI still present or are brought to the ED. Admission to the catheterization laboratory involved a brief clinical evaluation, ECG review, and physical examination on entry, and, in the absence of allergies, contraindication, or misdiagnosis, immediate transport to the catheterization laboratory.
Mortality during the follow‐up period was assessed by matching patient data with the Israeli national population registry. All patients provided written informed consent. The study was approved by the local institutional review board of each center. No external funding was used to conduct the study. The data that support the findings of this study are available from the corresponding author on reasonable request.
Data Collection
Patient demographics, medical history, and concomitant risk factors and medical conditions were recorded from the ACSIS study case report forms as recorded during admission. The P2B time was defined as the interval from symptom onset as reported on admission by the patient or family member to the time of first balloon inflation. The D2B time was the interval from hospital admission to the ED or to the catheterization laboratory to balloon inflation as recorded in the medical chart. The 30‐day and 1‐, 2‐, and 5‐year follow‐up vital status as well as that at the end of follow‐up were documented for each patient by hospital chart, national population registry, or by phone call.
Statistical Analysis
Baseline characteristics and hospital data of the prespecified study groups, ie, PPCI‐treated patients with STEMI admitted via the ED or those admitted directly to the catheterization laboratory were compared. Comparison of categorical variables was performed with chi‐square analysis while continuous variables were compared by Student t test or nonparametric Mann‐Whitney U tests as appropriate.
Survival analysis of the difference between the unadjusted groups was performed using the Kaplan‐Meier curves followed by the log‐rank test. Univariate analysis for mortality predictors among study patients yielded the following covariates: age, sex, insulin‐dependent diabetes mellitus, hypertension, smoking, Killip class >1, chronic renal failure, atrial fibrillation, anterior STEMI, and admission pathway (Table 1, all P<0.001). The risk of mortality at the end of follow‐up was assessed according to admission pathway using the multivariate Cox proportional hazard regression model adjusted for the above‐mentioned prespecified covariates with the P2B or D2B intervals as binary or continuous variables (Table 1). Propensity score with a 2:1 ratio was derived using logistic regression to fit patient characteristics by admission pathway. 8 Data were analyzed to provide the propensity score using the covariates age, sex, heart failure, cerebrovascular accident, hypertension, diabetes mellitus, Killip class >1 (R Core Team, R Project for Statistical Computing; https://www.R‐project.org/). Any P value <0.05 was considered significant. The color‐shaded area enveloping the line in all figures denotes the 95% CI.
Table 1.
Predictors of Mortality During Follow‐Up of Patients With STEMI Treated With PPCI by Log Regression According to a Univariate Model (Second Column): A Multivariate Model Without and With Binary or Continuous P2B or D2B Intervals
| Variable | Univariate HR (95% CI) | Multivariate HR (95% CI) | Multivariate HR (95% CI), P2B (>Median, 189 minutes) |
|---|---|---|---|
| Age | 1.08 (1.07–1.08)*** | 1.07 (1.06–1.07)*** | 1.06 (1.05–1.07)*** |
| Sex | 0.47 (0.4–0.55)*** | 1.02 (0.86–1.21) | 1.1 (0.84–1.43) |
| Hypertension | 2.21 (1.88–2.59)*** | 1.15 (0.97–1.37) | 1.22 (0.95–1.56) |
| Diabetes mellitus | 1.81 (1.55–2.1)*** | 1.34 (1.14–1.58)** | 1.23 (0.97–1.57) |
| Chronic renal failure | 4.75 (3.95–5.7)*** | 2.05 (1.68–2.49)*** | 2.02 (1.45–2.82)*** |
| Atrial fibrillation | 3.08 (2.48, 3.81)*** | 1.33 (1.06–1.66)× | 1.69 (1.22–2.34)× |
| Killip class >1 | 4.63 (3.98–5.4)*** | 2.47 (2.09–2.92)*** | 3.18 (2.5–4.04)*** |
| Smoking | 0.49 (0.42–0.58)*** | 1.33 (1.11–1.6)* | 1.47 (1.14–1.91)* |
| Anterior STEMI | 1.32 (1.13–1.53)*** | 1.1 (0.94–1.28), 0.24 | 1.07 (0.85–1.34), 0.58 |
| Direct admission | 1.42 (1.16–1.75)** | 1.11 (0.9–1.37) | 1.04 (0.8–1.35) |
| P2B >189 (median) | 1.49 (1.17–1.88)** |
| Multivariate HR (95% CI), With Continuous P2B, per min | HR (95% CI), With Binary D2B (>Median, 62 min) | HR (95% CI), With continuous D2B per minute | |
|---|---|---|---|
| Age | 1.06 (1.05–1.07)*** | 1.06 (1.05–1.07)*** | 1.06 (1.05–1.07)*** |
| Sex | 1.08 (0.83–1.41) | 1.04 (0.81–1.33) | 1.04 (0.81–1.33) |
| Hypertension | 1.25 (0.97–1.6) | 1.31 (1.04–1.66)× | 1.32 (1.04–1.66)× |
| Diabetes mellitus | 1.25 (0.99–1.6) | 1.3 (1.04–1.64)× | 1.3 (1.03–1.63) × |
| Chronic renal failure | 2.08 (1.49–2.9)*** | 2.08 (1.54–2.81)*** | 2.07 (1.53–2.8)*** |
| Atrial fibrillation | 1.64 (1.19–2.28)× | 1.5 (1.1–2.03)* | 1.49 (1.1–2.02)* |
| Killip class >1 | 3.09 (2.42–3.95)× | 2.82 (2.24–3.56)*** | 2.82 (2.23–3.56)*** |
| Smoking | 1.52 (1.17–1.98)** | 1.52 (1.18–1.96)** | 1.53 (1.19–1.97)** |
| Anterior STEMI | 1.07 (0.85–1.34) | 1.08 (0.88–1.34) | 1.09 (0.88–1.35) |
| Direct admission | 1.08 (0.83–1.39) | 1.07 (0.83–1.39) | 1.08 (0.85–1.39) |
| P2B or D2B interval | 1 (1–1)× | 1.06 (0.85–1.33) | 1 (1–1) |
D2B indicates door‐to‐balloon time; HR, hazard ratio; P2B, pain‐to‐balloon time; PPCI, primary percutaneous coronary intervention; and STEMI, ST‐segment–elevation myocardial infarction. Variables are presented as number (percentage) or median (interquartile range). × P<0.05, *P<0.01, **P<0.001, ***P<0.0001, by median (interquartile range).
Results
Patients
Of the 11 370 patients hospitalized for an acute coronary syndrome included in 6 bimonthly nationwide ACSIS registries from 2004 to 2016, 4839 patients were admitted urgently because of STEMI and treated by PPCI. These patients comprised the population of the present study (age 61.7±13 years, 80% men) (Table 2). We compared the patients who were admitted to the catheterization laboratory via the ED (n=3665) with those admitted directly to the catheterization laboratory, thus bypassing the ED (n=1174). Study patients admitted directly to the catheterization laboratory differed from those admitted via the ED with respect to age, sex, history of stroke or heart failure, hypertension, diabetes mellitus, chronic renal failure, and smoking (Table 2). The incidence of any sign of heart failure on admission (Killip class II–IV) was lower among patients with STEMI admitted directly to the catheterization laboratory (11.7%) compared with those admitted via the ED (15++%, P<0.005) (Table 2). Likewise, the incidence of diabetes mellitus was higher among patients admitted via the ED (31.3% versus 26%, P<0.001). The incidence of anterior wall infarction and the extent of coronary vessel disease were similar among study groups (Table 2).
Table 2.
Patient Demographics, Comorbid Conditions, and Previous Cardiovascular History According to Admission Pathway
| Patient Characteristics | Overall Study Population (N=4839) | Direct Admission (n=1174) |
Admission via the ED (n=3665) |
P Value |
|---|---|---|---|---|
| Age, y | 61.7±13.2 | 59.7±12.2 | 62.3±13.4 | <0.001 |
| Men | 3850 (80%) | 968 (82.5%) | 2882 (79%) | 0.005 |
| History of congestive heart failure | 172 (3.6%) | 22 (2%) | 150 (4%) | 0.001 |
| S/P myocardial infarction | 1022 (21%) | 249 (21%) | 773 (21%) | 0.977 |
| S/P percutaneous coronary intervention | 964 (20%) | 234 (20%) | 730 (20%) | 1.0 |
| S/P cerebrovascular accident | 321 (6.6%) | 56 (4.8%) | 265 (7.2%) | 0.004 |
| Hypertension | 2496 (52%) | 558 (47.9%) | 1938 (53%) | 0.002 |
| Diabetes mellitus | 1447 (30%) | 303 (26%) | 1144 (31.3%) | <0.001 |
| Hyperlipidemia | 2901 (60.3%) | 714 (61.6%) | 2187 (60%) | 0.344 |
| Peripheral arterial disease | 278 (5.8%) | 56 (4.8%) | 222 (6%) | 0.116 |
| Chronic renal failure | 329 (6.8%) | 61 (5.2%) | 268 (7.3%) | 0.015 |
| New atrial fibrillation | 275 (5.7%) | 66 (5.6%) | 209 (5.7%) | 0.988 |
| Anterior STEMI | 2110 (43.6%) | 517 (44%) | 1593 (43.5%) | 1.0 |
| Killip class> 1 | 683 (14.3%) | 136 (11.7%) | 547 (15%) | 0.005 |
| Past smoker | 818 (17%) | 211 (18%) | 607 (16.6%) | 0.298 |
| Current smoker | 2248 (46.6%) | 596 (51%) | 1652 (45.3%) | 0.001 |
| Any smoking | 3066 (63.6%) | 807 (69%) | 2259 (62%) | <0.001 |
| P2B interval, min | 189 (130–320) | 160 (115–240) | 210 (140–355) | <0.001 |
| D2B interval, min | 62 (35–101) | 35 (15–60) | 75 (49–122) | <0.001 |
| Peak creatine kinase, U/L | 779 (284–1723) | 960 (364–2080) | 735 (266–1597) | <0.001 |
| Peak troponin T, ng/mL | 2 (0.49–7.74) | 3.42 (1.0–10.0) | 1.6 (0.35–6.42) | <0.001 |
| No. of diseased coronary vessels | ||||
| 1 | 1729 (39.4%) | 448 (39.8%) | 1281 (39%) | 0.58 |
| 2 | 1398 (31.9%) | 448 (39.8%) | 1032 (31.7%) | |
| 3 | 1118 (25%) | 273 (24%) | 845 (26%) | |
| No coronary artery disease | 138 (3.1%) | 40 (3.5%) | 98 (3.0%) | |
| Median LVEF (%) | 45% (8–55) | 45% (40–55) | 45 (37–55) | 0.05 |
| Grade of systolic function | ||||
| Normal LV function | 1484 (36%) | 358 (36%) | 1126 (36%) | 0.032 |
| Mild LV dysfunction | 1439 (34.9%) | 372 (37.4%) | 1067 (34.1%) | |
| Moderate LV dysfunction | 874 (21.2%) | 206 (20.7%) | 668 (21.4%) | |
| Severe LV dysfunction | 325 (7.9%) | 59 (5.9%) | 266 (8.5%) | |
| Hospital stay, d | 5 (4–7) | 4 (3–6) | 5 (4–7) | <0.001 |
D2B indicates door‐to‐balloon; ED, emergency department; LV, left ventricular; LVEF, left ventricular ejection fraction; P2B, pain‐to‐balloon; S/P, status post; and STEMI, ST‐segment–elevation myocardial infarction. Variables are presented as number (percentage) or median (interquartile range). Normal left ventricular function (>50%), mild (40–50%), moderate (30–40%), and severe systolic dysfunction (<30%).
Transport and Treatment Time Intervals
Of 1174 patients with STEMI admitted directly to the cardiac care unit, 1124 were transported by EMS ambulances (95.7%), 48 by regular ambulances (4.1%), and 2 transferred within the hospital (0.2%). In contrast, of the 3665 patients presenting to the ED, 1620 patients with STEMI were self‐referred (44.2%), 1493 were transported by the EMS system (40.7%), 446 by a regular ambulances (12.1%), and 106 patients developed STEMI during hospitalization (2.9%). Patients with STEMI admitted directly to the catheterization laboratory achieved significantly shorter P2B intervals (median, 160 minutes; interquartile range [IQR], 115–240) than those admitted via the ED (210 minutes; IQR, 140–355 [P<0.001]) (Table 2). Similarly, patients admitted directly to the catheterization laboratory achieved a significantly shorter D2B time (median, 35 minutes; IQR, 15–60) compared with those admitted via the ED (75 minutes; IQR, 49–122 [P<0.001]). Ninety‐one percent of the patients with STEMI admitted directly to the catheterization laboratory were treated within the guidelines‐dictated D2B interval <90 minutes, whereas only 61% achieved this goal when admitted via the ED (P<0.001). The currently advocated D2B of <60 minutes was attained in 78% when admitted directly to the catheterization laboratory versus 37% when admitted via the ED (P<0.001).
Median P2B interval among the total study patients was 189 minutes, while median D2B was 62 minutes. Among patients who achieved P2B <189 minutes, the median P2B interval was 125 (IQR, 95–154) when admitted directly to the catheterization laboratory (n=577), 135 (IQR, 110–160) when transported to the ED by EMS (n=348), and 130 minutes (IQR, 100–155) in the self‐transported patients (n=470). Otherwise, the P2B interval measured in the study subgroups with P2B >189 minutes were 285 (IQR, 220–412) in the directly admitted patients (n=438), 308 (IQR, 240–495) when transported to the ED by EMS (n=488), and 350 minutes (IQR, 258–570) in patients self‐referred to the ED (n=650, P<0.001). The D2B values were 30 (IQR, 13–50), 51 (IQR, 35–73), and 59 minutes (IQR, 40–78) in the respective study subgroups achieving P2B <189 minutes, and 47 (IQR, 23–80), 99 (IQR, 60–159), and 103 minutes (IQR, 68–159) when the P2B interval exceeded 189 minutes (P<0.001).
In‐Hospital Course
There was no indication of patient selection to one admission pathway over the other. Hospital length of stay was shorter in patients admitted directly to the catheterization laboratory (median, 4 days [IQR, 3–6] versus 5 days [IQR, 4–7], P<0.001). The left ventricular ejection fraction in patients admitted via the ED was lower than left ventricular ejection fraction evaluated in the directly admitted patients (Table 2). Also, median creatine kinase and troponin levels were significantly higher in the patients admitted directly compared with among patients admitted via the ED (Table 2).
Short‐ and Long‐Term Mortality
Patients were followed for 6.6±4.5 years (median, 6.4; IQR, 1.8–10.8). The unadjusted overall mortality during the follow‐up period was 27% (1304 patients), with a mortality rate of 29.8% among patients with STEMI admitted via the ED (1092 patients) compared with 18% among those admitted directly to the catheterization laboratory (212 patients, P<0.0001) (Table 3). The overall mortality rate of study patients was 5.7% at 30 days, 9.3% at 1 year, 11.7% at 2 years, 21% at 5 years, and 27% at the end of follow‐up (Table 3). Direct admission conferred a survival benefit compared with admission via the ED at 30 days (3.6% versus 6.3%, P=0.001), at 1 year (6.1% versus 10.3%, P<0.001), at 2 years (7.4% versus 12.9%, P<0.001), at 5 years (16.2% versus 22.1%, P=0.001), and at the end of follow‐up (18.1% versus 29.8%, P<0.001) (Table 3). If the current study population is examined by both the admission pathway and the median P2B, then the unadjusted Kaplan‐Meier curves show a significantly better survival for the patients treated earlier (<189 minutes), whether admitted directly to the catheterization laboratory or via the ED (Figure 1). If a dichotomous P2B interval (>median) was added to the multivariable analysis it proved to be a significant predictor, whereas diabetes mellitus demonstrated only a tendency toward significance (P=0.086) (Table 1). Equally, incorporating P2B as a continuous risk per minute variable in the model yielded similar results (Table 1). Conversely, adding D2B to the multivariable model while excluding P2B because of feasible collinearity did not significantly impact mortality whether entered as a categorical variable (>mean) or a continuous parameter (Table 1).
Table 3.
Mortality According to Admission Pathway
| Pathway | No. | 30‐d Mortality | 1‐y Mortality | 2‐y Mortality | 5‐y Mortality | End of FU Mortality |
|---|---|---|---|---|---|---|
| Unadjusted short‐ and long‐term mortality | ||||||
| Overall | 4839 | 273 (5.7%) | 444 (9.3%) | 464 (11.7%) | 696 (20.9%) | 1304 (27%) |
| Direct admission | 1174 | 42 (3.6%) | 71 (6.1%) | 64 (7.4%) | 107 (16.2%) | 212 (18.1%) |
| Admission via ED | 3665 | 231 (6.3%)* | 373 (10.3%)* | 400 (12.9%)* | 589 (22.1%)* | 1092 (29.8%)* |
| Short‐ and long‐term mortality according to the propensity score matching model | ||||||
| Overall | 3420 | 148 (4.4%) | 240 (7.1%) | 248 (8.9%) | 379 (16.3%) | 744 (21.8%) |
| Direct admission | 1140 | 39 (3.4%) | 66 (5.9%) | 59 (6.9%) | 102 (15.6%) | 206 (18.1%) |
| Admission via ED | 2280 | 109 (4.8%) | 174 (7.7%) | 189 (9.8%) | 277 (16.6%) | 538 (23.6%) |
| P value | 0.080 | 0.05 | 0.02 | 0.59 | <0.001 | |
ED indicates emergency department; and FU, follow‐up. *P<0.001, **P≤0.05, number (percentage).
Figure 1. Unadjusted Kaplan‐Meier survival curves for patients with ST‐segment–elevation myocardial infarction treated with primary percutaneous coronary intervention at 5 years according to both admission pathway and binary pain‐to‐balloon (P2B <189 or >189 minutes) intervals showing a statistically significant survival benefit for patients treated earlier regardless of admission pathway.
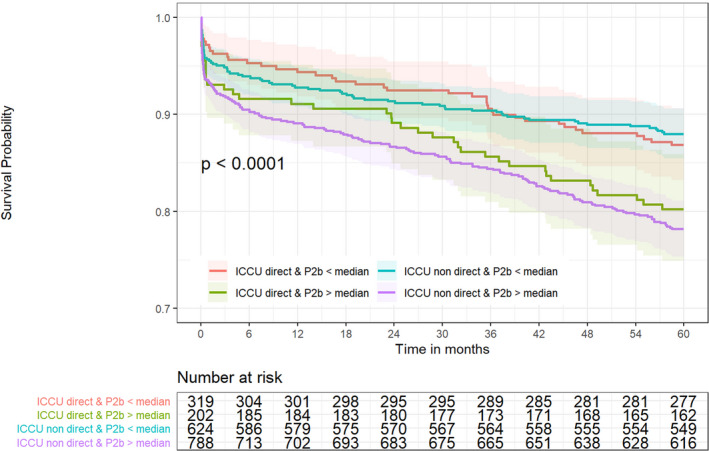
ICCU indicates intensive cardiac care unit.
Propensity‐matched subgroups were compatible by definition (Table 4). The time intervals were significantly shorter as expected and higher troponin and creatine kinase levels were seen in the directly admitted patients, showing the same relationship observed between the unadjusted study groups, perhaps signifying a higher early peak (Table 4). The Kaplan‐Meier curves for the propensity score–matched groups show a significant difference in mortality between study groups at 1 year (P<0.05), at 2 years (P=0.016), but not at 5 years (Figure 2A through 2C). Segregation of patients according to admission pathway and categorical P2B interval again demonstrated a clear survival benefit at 5‐years among patients with STEMI treated within the P2B <median interval regardless of admission pathway (Figure 2D), while D2B did not impact long‐term survival (Figure 3B).
Table 4.
Basic Characteristics and Time Intervals According to Admission Pathway for a 1:2 Propensity Score Match (n=3420)
| Variable | Direct Admission (n=1140) | Admission via the ED (n=2280) | P Value |
|---|---|---|---|
| Age, y | 59.7 (12.2) | 60 (12.3) | 0.64 |
| Men | 941 (82.5) | 1898 (83.2) | 0.64 |
| S/P congestive heart failure | 20 (1.8) | 42 (1.8) | 0.96 |
| S/P myocardial infarction | 241 (21.1) | 442 (19.4) | 0.24 |
| S/P percutaneous coronary intervention | 227 (19.9) | 432 (18.9) | 0.51 |
| S/P cerebrovascular accident | 54 (4.7) | 96 (4.2) | 0.54 |
| Hypertension | 544 (47.7) | 1055 (46.3) | 0.45 |
| Diabetes mellitus | 297 (26.1) | 583 (25.6) | 0.8 |
| Hyperlipidemia | 694 (61.3) | 1337 (58.8) | 0.18 |
| Peripheral arterial disease | 55 (4.8) | 117 (5.1) | 0.76 |
| Chronic renal failure | 61 (5.4) | 113 (5.0) | 0.67 |
| New atrial fibrillation | 64 (5.6) | 102 (4.5) | 0.16 |
| Anterior STEMI | 499 (43.8) | 978 (42.9) | 0.65 |
| Killip class >1 | 133 (11.7) | 268 (11.8) | 1 |
| Past smoker | 205 (18) | 370 (16.3) | 0.23 |
| Current smoker | 576 (50.6) | 1123 (49.4) | 0.56 |
| Peak troponin T, ng/mL | 3.39 (0.98–10) | 1.44 (0.31–5.6) | <0.001 |
| Peak creatine kinase, U/L | 964 (365–2046) | 756 (280–1664) | <0.001 |
| LVEF, % | 45% (40–55) | 45% (40–55) | 0.54 |
| P2B interval, min | 160 (115–240) | 210 (140–355) | <0.001 |
| D2B interval, min | 35 (15–60) | 75 (49–122) | <0.001 |
| P2B interval ≤189 (median) | 565 (62%) | 627 (46%) | <0.001 |
| D2B interval ≤62 | 730 (78%) | 575 (40%) | <0.001 |
| Mean follow‐up time, y | 6.1±4.2 | 7.3±4.6 | <0.001 |
| Median follow‐up time (IQR),y | 4.6 (1.8–9.6) | 7.6 (2.7–11.6) | <0.001 |
D2B indicates door‐to‐balloon; ED, emergency department; LVEF, left ventricular ejection fraction; P2B, pain‐to‐balloon; S/P, status post; STEMI, ST‐segment–elevation myocardial infarction. Variables are presented as number (percentage) or median (interquartile range [IQR]).
Figure 2. Propensity score–matched Kaplan‐Meier survival curves for primary percutaneous coronary intervention (PPCI)–treated patients with ST‐segment–elevation myocardial infarction according to admission pathway at 1 year (A), 2 years (B), and 5 years. (C).
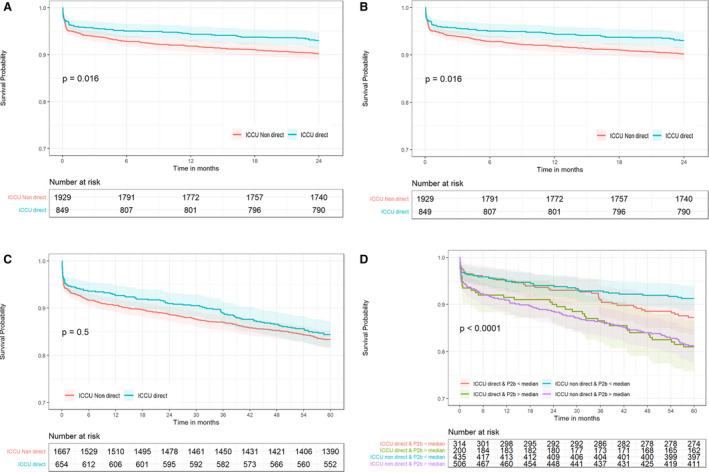
Propensity score–matched Kaplan‐Meier 5‐year survival curves for PPCI‐treated patients with STEMI according to both admission pathway and binary pain‐to‐balloon (P2B) intervals (D). ICCU indicates intensive cardiac care unit.
Figure 3. Unadjusted (A) and propensity score–matched (B) Kaplan‐Meier 5‐year survival curves for primary percutaneous coronary intervention–treated patients with ST‐segment–elevation myocardial infarction according to admission pathway and binary door‐to‐balloon (D2B) intervals (please note color legend) showing no effect of D2B interval.
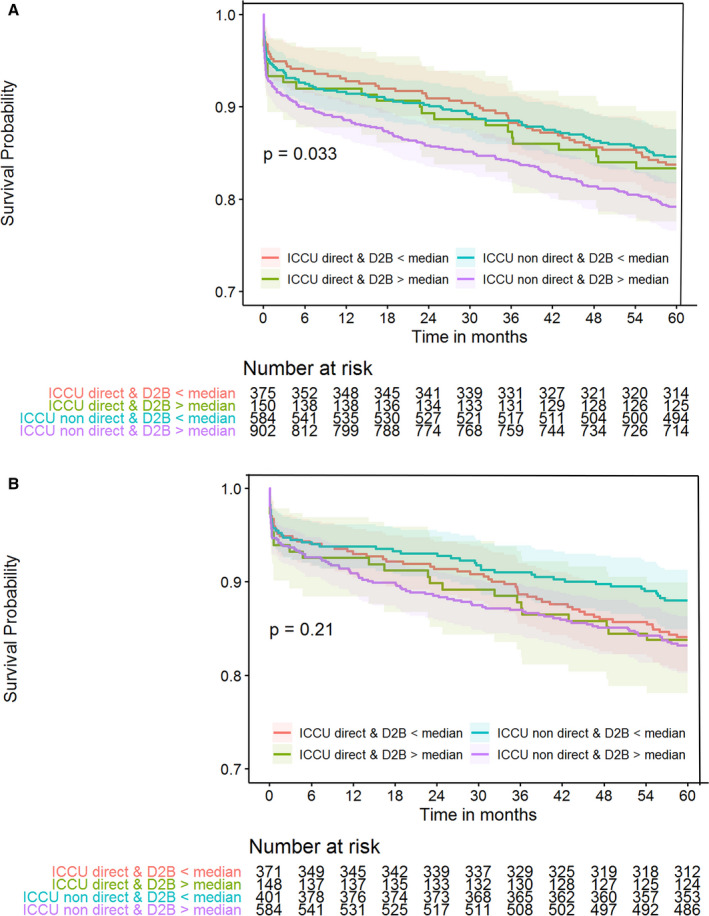
ICCU indicates intensive cardiac care unit.
In addition to expedient admission to the catheterization laboratory, patients with STEMI transported by the EMS are also treated initially in transit to the hospital, which could confer additional advantage; a benefit not afforded by patients presenting to the ED on their own. Therefore, we analyzed the unadjusted and the propensity score–matched 5‐year survival of study patients according to pre‐ED transport modality or direct admission pathway with binary P2B interval, and both yielded similar results (Figure 4). The results of both analyses clearly show the survival benefit of attaining a P2B interval <189 minutes regardless of prehospital or in‐hospital pathway (Figure 4). The 5‐year survival of patients admitted directly to the catheterization laboratory or transported to the ED by EMS or self‐transport and achieving P2B <189 minutes was 87%, 85%, and 91%, respectively, and 80%, 74%, 81% if the P2B interval exceeded 189 minutes, respectively (P<0.001).
Figure 4. Unadjusted (A) and propensity score–matched (B) Kaplan‐Meier 5‐year survival curves for primary percutaneous coronary intervention–treated patients with ST‐segment–elevation myocardial infarction according to pre–emergency department (ED) transport modality or direct admission pathway and binary P2B intervals clearly showing the survival benefit of pain‐to‐balloon (P2B) interval <189 minutes regardless of prehospital and in‐hospital pathway.
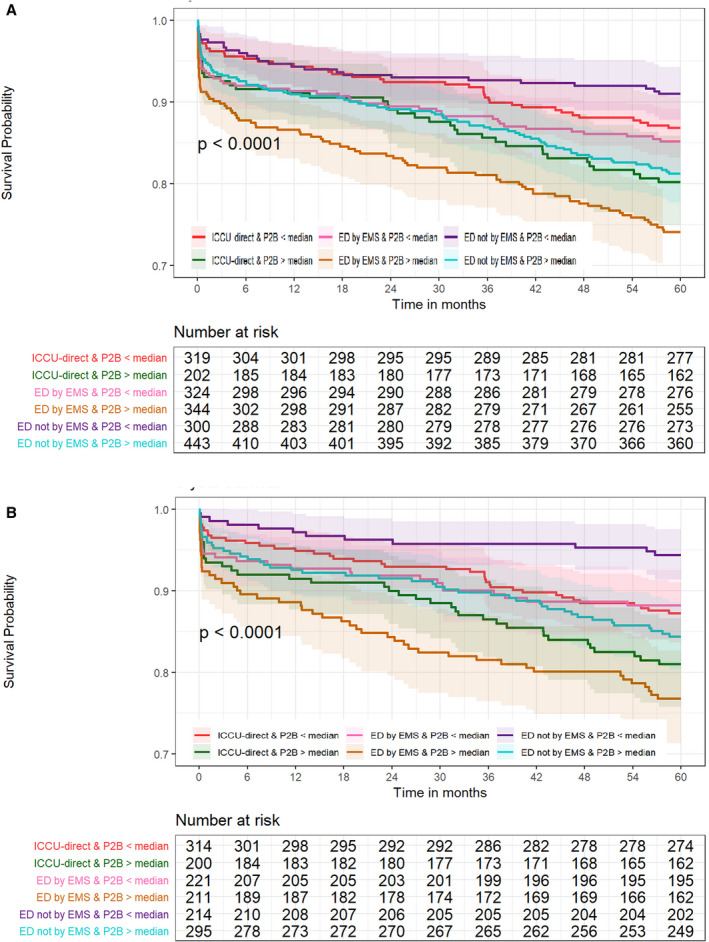
EMS indicates emergency medical services. ICCU indicates intensive cardiac care unit.
Discussion
The unadjusted results of the present study show that direct admission of patients with STEMI to the catheterization laboratory compared with admission via the ED markedly shortened both P2B and D2B intervals. This resulted in significantly better short‐ and long‐term survival of patients with STEMI treated by PPCI (Figure 1). However, study groups were not identical in their baseline characteristics (Table 2). Therefore, multivariate Cox proportional hazard regression model was used to adjust for the disparate prespecified covariates and propensity score matching was also applied to objectively assess outcomes by a different method. These analyses verified the findings of the unadjusted analysis and demonstrated that direct admission of PPCI‐treated patients with STEMI led to a higher early and late survival, putatively attributable to the shorter delay from ischemia onset to reperfusion. Furthermore, shorter P2B intervals were associated with lower long‐term mortality regardless of admission pathway (Figure 2D), while shorter D2B intervals did not confer any survival benefit on its own merit (Figure 3).
Amit et al 9 assessed the impact of bypassing the ED and direct admission to the coronary care unit on P2B and D2B intervals and on 30‐day and 1‐year mortality of 115 patients with STEMI (21%) compared with 418 patients (79%) admitted via the ED. Direct admission of patients with STEMI, who were younger with less comorbidity, achieved significantly shorter D2B intervals (70 versus 94 minutes, P<0.01). Yet, this resulted only in a trend toward reduced 30‐day and 1‐year mortality. Baran et al 10 evaluated a strategy to reduce D2B time for patients with STEMI by performing prehospital ECG, implementing EMS activation and direct admission to the catheterization laboratory. This strategy decreased D2B times dramatically, but only 209 of 574 patients with STEMI (36%) were admitted directly. In‐hospital mortality in patients admitted directly was 3.9% compared with 5.8% in those admitted via the ED. Bagai et al 3 studied 12,581 patients with STEMI diagnosed by a prehospital ECG treated at 371 PPCI‐capable hospitals included in the ACTION (Acute Coronary Treatment and Intervention Outcomes Network) registry. The ED was bypassed by only 1316 patients (10.5%) who experienced less heart failure and shock on presentation. PPCI within 90 minutes was achieved more frequently with ED bypass (80.7% versus 53.7%, P<0.0001), but the adjusted mortality risk was not significantly different (P=0.07). The 30‐day and long‐term mortality rates of these patients were not evaluated. Lubovich et al 11 analyzed data of 1552 consecutive patients with STEMI treated by PPCI enrolled in the Acute Coronary Syndrome Israeli Survey registry. Of these, 459 patients (30%) arrived directly to the catheterization laboratory. Again, bypassing the ED resulted in significantly shorter D2B times (59 versus 97 minutes, P=0.001) but with no difference in mortality at 30 days or 1 year.
Twenty years ago, Cannon et al 1 published an analysis based on the NRMI (National Registry of Myocardial Infarction) registry of patients with STEMI who had a median D2B of 116 minutes and found that delay in D2B time was related to increased mortality, but observed no significant correlation between P2B time and mortality. Several years later, McNamara et al 12 demonstrated in the same registry that longer D2B time intervals were associated with increased mortality in PPCI‐treated patients with STEMI regardless of their P2B time. Similarly, Antoniucci et al 5 showed in 1336 PPCI‐treated patients with STEMI that the P2B time was not an independent predictor of mortality. Rathore et al 13 observed in the large NCDR (National Cardiovascular Data Registry), which included 43,801 patients, that longer D2B times were associated with higher adjusted in‐hospital mortality risk. Consequently, Claeys et al 7 suggested that target D2B time should decrease to <60 minutes in order to achieve the lowest mortality, in keeping with recent European Society of Cardiology guidelines. 6 Bonnefoy et al 4 conducted a randomized multicenter trial of 840 patients with STEMI transferred by the EMS to PPCI centers within 6 hours of pain onset. They attained a P2B of 190 minutes with a 30‐day mortality of 4.8%, but shorter P2B times were not associated with lower mortality. In contrast, Rollando et al 14 have shown in a single‐center series of 790 PPCI‐treated patients with STEMI that shorter P2B time predicted lower long‐term mortality. In their study, patients with a treatment delay <180 minutes displayed lower mortality at 1, 3, 5, and 7 years than mortality in patients with delays >180 minutes, an interval similar to the median P2B interval of 189 minutes obtained in the current study that also correlated with long‐term mortality.
In the present study, direct admission of patients with STEMI to the catheterization laboratory resulted in P2B and D2B intervals ≈50 minutes and 40 minutes shorter than the respective intervals achieved by admission via the ED. It has also demonstrated that the P2B interval, but not the D2B interval, represents a significant predictor of long‐term mortality (Table 1). The P2B time was shown to impact long‐term mortality more than the admission pathway (Figure 2D), while D2B time lacked any long‐term effect on outcome, contrary to current dogma (Figure 3).
Since randomization is not feasible, propensity score matching was also applied in the present study to account for differences in baseline characteristics of the study groups. It confirmed the results of the unadjusted survival curves and the Cox regression analysis with the exception of the 5‐year survival curve, which conceivably could represent the result of patient attrition caused by loss of sicker patients during the 5‐year follow‐up (Figure 2). Propensity matching also demonstrated that the P2B interval, representing the total ischemic time, is the preponderant factor determining the 5‐year mortality regardless of admission pathway (Figure 2D).
The finding that the D2B time did not impact mortality while the P2B time did, as also suggested by Denktas et al, 15 makes one wonder whether D2B has reached its limit of effect in the past decade, and that all efforts should be extended to shorten P2B times. Nallamothu et al 16 stated that myocardial cell death begins as early as 20 minutes after coronary artery occlusion and is usually complete within 6 hours. Although this period may be extended depending on the presence of intermittent episodes of reperfusion and the extent of collateral circulation, it highlights the importance of the P2B interval as a significant determinant of myocardial damage. We suggest a pathophysiologic mechanism that seems to provide a feasible explanation for the present findings. Acute coronary obstruction precipitates ischemia, which initially is still reversible and is associated with minimal myocardial necrosis. If not rectified, myonecrosis develops, resulting at first in rapid damage whose rate of progression slows as occlusion time elapses. Eventually, complete damage of jeopardized myocardium occurs unless coronary reperfusion is achieved. The time scale of this process varies among individual patients with factors that modify its duration as mentioned above, 16 but usually it takes several hours. The period characterized by the steep rate of myonecrosis seems to occur usually, in the absence of immediate therapy, within the P2B time interval. It seems that the D2B interval occurs later during the flat slope of the time‐myonecrosis curve. Consequently, the impact of reperfusion on myocardial salvage at this stage is small as long as the D2B interval is not excessive. As a result, a reasonably short D2B time does not typically impact the long‐term prognosis of patients with STEMI, whereas a longer P2B time does.
The results of the present analysis strongly suggest that it is imperative to shorten the D2B interval as an inseparable component of the P2B period. Yet, all efforts should be made to shorten the P2B interval, which seems to substantially impact long‐term mortality. This requires the education of the public toward enhanced awareness of suspected ischemic symptoms in order to activate the EMS service early to bypass the ED and perform early PPCI for the best long‐term outcome. The EMS technicians should be able to transfer the ECG to the cardiac unit en route to the hospital to save time setting up the catheterization laboratory and recruiting its staff. Early activation of the catheterization laboratory by the cardiac unit is possible with well‐trained EMS staff who communicates effectively with the cardiac care personnel.
Study Limitations
It is impossible to implement randomization to admission pathway. However, the current study is based on a relatively large prospective nationwide multicenter registry of consecutive patients with STEMI. This essentially precludes a selection bias, other than medical condition and patient decision. Based on an unequivocal ECG, there was no apparent bias in patient selection regarding admission pathway. The propensity score matching seems to adjust for the difference between study groups. In addition, since virtually all patients with STEMI admitted directly to the catheterization laboratory, but only 40.8% of those presenting to the ED, were transported by EMS ambulances, there lingers the possible effect of therapy administered during transportation on outcome. However, this effect was not observed. The results show that as long as the P2B intervals were compatible, patients with STEMI brought to the ED by EMS did not fare better than those presenting to the ED on their own (Figure 4).
Conclusions
The present data show that direct admission of patients with STEMI to the catheterization laboratory in order to provide timely PPCI significantly decreased P2B and D2B intervals, resulting in lower short‐ and long‐term mortality. The analysis of this large multicenter study has shown that despite current dogma, P2B times significantly impact mortality, whereas D2B intervals appeared, under current conditions, to be less important. Indeed, direct admission to the catheterization laboratory, which demands collaboration and effective communication with the EMS system, is mandatory if the guideline‐dictated time constraint for PPCI is to be achieved for best clinical results. Time to treatment should be as short as possible, so hospitals should implement effective protocols to contact patients with STEMI early and transfer them directly to the catheterization laboratory.
Sources of Funding
None.
Disclosures
None.
Acknowledgments
The authors wish to thank Robert Klempfner, MD, for his support and Michal Einhorn and Tal Ovdat for their superb statistical analysis.
(J Am Heart Assoc. 2021;10:e018343. DOI: 10.1161/JAHA.120.018343.)
See Editorial by Brindis et al.
For Sources of Funding and Disclosures, see page 12.
References
- 1. Cannon CP, Gibson CM, Lambrew CT, Shoultz DA, Levy D, French WJ, Gore JM, Weaver WD, Rogers WJ, Tiefenbrunn AJ. Relationship of symptom‐onset‐to‐balloon time and door‐to‐balloon time with mortality in patients undergoing angioplasty for acute myocardial infarction. JAMA. 2000;283:2941–2497. [DOI] [PubMed] [Google Scholar]
- 2. Berger PB, Ellis SG, Holmes DR Jr, Granger CB, Criger DA, Betriu A, Topol EJ, Califf RM. Relationship between delay in performing direct coronary angioplasty and early clinical outcome in patients with acute myocardial infarction: results from the Global Use of Strategies to Open Occluded Arteries in Acute Coronary Syndromes (GUSTO‐IIb) trial. Circulation. 1999;100:14–20. [DOI] [PubMed] [Google Scholar]
- 3. Bagai A, Jollis JG, Dauerman HL, Peng SA, Rokos IC, Bates ER, French WJ, Granger CB, Roe MT. Emergency department bypass for ST‐Segment‐elevation myocardial infarction patients identified with a prehospital electrocardiogram: a report from the American Heart Association Mission: Lifeline program. Circulation. 2013;128:352–359. [DOI] [PubMed] [Google Scholar]
- 4. Bonnefoy E, Lapostolle F, Leizorovicz A, Steg G, McFadden EP, Dubien PY, Cattan S, Boullenger E, Machecourt J, Lacroute JM, et al. Comparison of angioplasty and Prehospital Thromboysis in acute myocardial infarction study group. Lancet. 2002;360:825–829. [DOI] [PubMed] [Google Scholar]
- 5. Antoniucci D, Valenti R, Migliorini A, Moschi G, Trapani M, Buonamici P, Cerisano G, Bolognese L, Santoro GM. Relation of time to treatment and mortality in patients with acute myocardial infarction undergoing primary coronary angioplasty. Am J Cardiol. 2002;89:1248–1252. [DOI] [PubMed] [Google Scholar]
- 6. Neumann FJ, Sousa‐Uva M, Ahlsson A, Alfonso F, Banning AP, Benedetto U, Byrne RA, Collet JP, Falk V, Head SJ, et al. ESC Scientific Document Group. ESC/EACTS Guidelines on myocardial revascularization. Eur Heart J. 2019;40:87–165. [DOI] [PubMed] [Google Scholar]
- 7. Claeys MJ, de Meester A, Convens C, Dubois P, Boland J, De Raedt H, Vranckx P, Coussement P, Gevaert S, Sinnaeve P, et al. Contemporary mortality differences between primary percutaneous coronary intervention and thrombolysis in ST‐segment elevation myocardial infarction. Arch Intern Med. 2011;171:544–549. [DOI] [PubMed] [Google Scholar]
- 8. Sekhon JS. Multivariate and propensity score matching software with automated balance optimization: The matching package for R. J Stat Softw. 2011;42:1–52. [Google Scholar]
- 9. Amit G, Cafri C, Gilutz H, Ilia R, Zahger D. Benefit of direct ambulance to coronary care unit admission of acute myocardial infarction patients undergoing primary percutaneous intervention. Int J Cardiol. 2007;119:355–358. [DOI] [PubMed] [Google Scholar]
- 10. Baran KW, Kamrowski KA, Westwater JJ, Tschida VH, Alexander CF, Beahrs MM, Biggs TA, Koller PT, Mahoney BD, Murray ST, et al. Very rapid treatment of ST‐segment‐elevation myocardial infarction: utilizing prehospital electrocardiograms to bypass the emergency department. Circ Cardiovasc Qual Outcomes. 2010;3:431–437. [DOI] [PubMed] [Google Scholar]
- 11. Lubovich A, Dobrecky‐Mery I, Radzishevski E, Samnia N, Matetzky S, Nagler R, Rosenschein U. Bypassing the emergency room to reduce door‐to‐balloon time and improve outcomes of ST‐elevation myocardial infarction patients: Analysis of data from 2004–2010 ACSIS registry. J Interv Cardiol. 2015;28:141–146. [DOI] [PubMed] [Google Scholar]
- 12. McNamara RL, Wang Y, Herrin J, Curtis JP, Bradley EH, Magid DJ, Peterson ED, Blaney M, Frederick PD, Krumholz HM. NRMI Investigators for the NRMI Investigators. Effect of Door‐to‐Balloon time on mortality in patients with ST‐Segment elevation myocardial infarction. J Am Coll Cardiol. 2006;47:2180–2186. [DOI] [PubMed] [Google Scholar]
- 13. Rathore SS, Curtis JP, Chen J, Wang Y, Nallamothu BK, Epstein AJ, Krumholz HM. National Cardiovascular Data Registry. Association of door‐to‐balloon time and mortality in patients admitted to hospital with ST elevation myocardial infarction: national cohort study. BMJ. 2009;338:b1807. [DOI] [PMC free article] [PubMed] [Google Scholar]
- 14. Rollando D, Puggioni E, Robotti S, De Lisi A, Ferrari Bravo M, Vardanega A, Pattaro I, De Benedetti F, Brignole M. Symptom onset‐to‐balloon time and mortality in the first seven years after STEMI treated with primary percutaneous coronary intervention. Heart. 2012;98:1738–1742. [DOI] [PubMed] [Google Scholar]
- 15. Denktas AE, Anderson V, McCarthy J, Smalling RW. Total ischemic time: The correct focus of attention for optimal ST‐segment elevation myocardial infarction care. J Am Coll Cardiol Intv. 2011;4:599–604. [DOI] [PubMed] [Google Scholar]
- 16. Nallamothu BK, Bradley EH, Krumholz HM. Time to treatment in primary percutaneous coronary intervention. N Engl J Med. 2007;357:1631–1638. [DOI] [PubMed] [Google Scholar]