

Abstract
Background
Although silent myocardial infarction (SMI) is prognostically important, the risk of sudden cardiac death (SCD) among patients with incident SMI is not well established.
Methods and Results
We examined 2 community‐based cohorts: the ARIC (Atherosclerosis Risk in Communities) study (n=13 725) and the CHS (Cardiovascular Health Study) (n=5207). Incident SMI was defined as electrocardiographic evidence of new myocardial infarction during follow‐up visits that was not present at the baseline. The primary study end point was physician‐adjudicated SCD. In the ARIC study, 513 SMIs, 441 clinically recognized myocardial infarctions (CMIs), and 527 SCD events occurred during a median follow‐up of 25.4 years. The multivariable hazard ratios of SMI and CMI for SCD were 5.20 (95% CI, 3.81–7.10) and 3.80 (95% CI, 2.76–5.23), respectively. In the CHS, 1070 SMIs, 632 CMIs, and 526 SCD events occurred during a median follow‐up of 12.1 years. The multivariable hazard ratios of SMI and CMI for SCD were 1.70 (95% CI, 1.32–2.19) and 4.08 (95% CI, 3.29–5.06), respectively. The pooled hazard ratios of SMI and CMI for SCD were 2.65 (2.18–3.23) and 3.99 (3.34–4.77), respectively. The risk of SCD associated with SMI is stronger with White individuals, men, and younger age. The population‐attributable fraction of SCD was 11.1% for SMI, and SMI was associated with an absolute risk increase of 8.9 SCDs per 1000 person‐years. Addition of SMI significantly improved the predictive power for both SCD and non‐SCD.
Conclusions
Incident SMI is independently associated with an increased risk of SCD in the general population. Additional research should address screening for SMI and the role of standard post–myocardial infarction therapy.
Keywords: ECG, silent myocardial infarction, sudden cardiac death
Subject Categories: Sudden Cardiac Death, Coronary Artery Disease
Nonstandard Abbreviations and Acronyms
- ARIC
Atherosclerosis Risk in Communities
- CHS
Cardiovascular Health Study
- CMI
clinically recognized myocardial infarction
- HCM
hypertrophic cardiomyopathy
- MC
Minnesota code
- NSCD
non–sudden cardiac death
- SCD
sudden cardiac death
- SMI
silent myocardial infarction
Clinical Perspective
What Is New?
Silent myocardial infarction (SMI) detected by ECG is common, and the incidence rate of SMI increases with age.
SMI was associated with ≈3‐fold increased risk of sudden cardiac death (SCD), and the strength of the association between SMI and SCD was comparable to that between SMI and non‐SCD, but weaker than the association between clinically recognized myocardial infarction and SCD.
There are race, sex, and age differences in the prognostic significance of SMI. The risk of SCD associated with SMI is stronger with White individuals, men, and younger age.
What Are the Clinical Implications?
Being more prevalent than CMI, SMI constitutes an underappreciated public health problem.
Early detection of SMI by ECG may be warranted to predict future risk of SCD and to better identify those who might benefit from more aggressive risk screening and management.
Sudden cardiac death (SCD) is a worldwide major health burden, accounting for more than 50% of cardiovascular death, with a currently estimated incidence of 4 to 5 million cases around the world annually. 1 Because the SCD often presents without warning symptoms before the event, it is typically the initial manifestation of cardiovascular disease in the general population. 2 Coronary heart disease (CHD) is the most predominant underlying cause of SCD. 3 Currently, most patients experiencing acute myocardial infarction (MI) with significant symptoms would present to a hospital for effective medical treatments, including coronary revascularization and antithrombotic therapy. 4 However, subjects whose first manifestation is SCD or who have no typical symptoms during the acute phase of MI seldom benefit from these therapies. 5 Also, these subgroups of patients are poorly represented in clinical trials from which current standards of care and treatment guidelines of CHD are derived.
Silent myocardial infarction (SMI), defined as evidence of pathological Q wave on the ECG in the absence of history of typical cardiac symptoms, constitutes up to one‐half of all MIs in the general population. 6 , 7 , 8 , 9 , 10 Previous reports have shown that both SMI and clinically recognized MI (CMI) were associated with poor prognosis, including heart failure, a second MI, and even death. 11 In a recent case‐control study by Vähätalo et al, 12 SMI determined by autopsy findings was associated with risk of SCD. However, there are limited data regarding the association between ECG‐defined SMI and long‐term risk of SCD in the general population. In addition, whether SMI is associated with SCD similar to CMI or worse than CMI remains elusive. Moreover, prevalence of SCD varies by race, sex, and age, and hence, there is a possibility that race, sex, and age modify the relationship between SMI and SCD.
In this study, we analyzed data from participants enrolled in 2 community‐based, observational, multicenter biracial cohorts, the ARIC (Atherosclerosis Risk in Communities) study and CHS (Cardiovascular Health Study), to determine the risk of SCD. We sought to examine the prevalence of SMI in the general population, to compare the associations of SMI and CMI with SCD versus those with no MI, and to examine the consistency of these relationships in subgroups stratified by race, sex, and age as well as SCD risk factors.
Methods
The data that support the findings of this study are available from the corresponding author on reasonable request.
Study Population
The ARIC study was a community‐based, biracial cohort study designed to investigate the causes of atherosclerosis and its clinical outcomes, as well as variations in cardiovascular risk factors, medical care, and disease. 13 , 14 Participants between 45 and 64 years of age were recruited from 4 communities across the United States (Washington County, MD; Forsyth County, NC; Jackson, MS; and suburban Minneapolis, MN) between 1987 and 1989. Participants underwent a standardized evaluation of cardiovascular risk factors and returned for 4 follow‐up visits: 1990 to 1992 (visit 2), 1993 to 1995 (visit 3), 1996 to 1998 (visit 4), and 2011 to 2013 (visit 5). They continued to be followed via semiannual telephone calls to ascertain the study end point. The present study used data obtained from baseline (1987–1989) through December 31, 2014.
The CHS is a cohort study of risk factors for CHD that prospectively enrolled and continues to follow a community‐dwelling cohort of men and women ≥65 years of age from Medicare eligibility lists in 4 US communities (North Carolina, California, Maryland, and Pennsylvania). 15 , 16 CHS field centers recruited a first cohort of 5201 participants in 1989/1990 and a second cohort of 687 participants in 1992/1993. Trained personnel performed annual follow‐up visits through 1998/1999 to assess participant demographic characteristics, medical history, hospitalizations, and lifestyle through standardized protocols. Semiannual phone interviews were conducted continuously since enrollment to ascertain health status, incident, and mortality events. The present study used data obtained from baseline (1989/1990 for the first cohort and 1992/1993 for the second cohort) through June 30, 2009.
Details of eligibility criteria and study procedures in each cohort have been described elsewhere. 14 , 16 We chose these cohorts because they were designed to understand the incidence and risk factors of SCD; their methodology for the ascertainment of SCD was rigorous, comparable, and validated. 16 Both studies were approved by the institutional review boards at all participating institutions, and all participants provided written informed consent at enrollment.
We excluded the following participants: (1) subjects for whom ECGs were missing or incomplete; (2) subjects with ventricular conduction abnormalities (eg, bundle‐branch block, external pacemaker, or Wolff–Parkinson–White pattern); (3) subjects with a history of cardiovascular disease at baseline that was defined as the presence of ECG evidence of MI, a self‐reported history of physician‐diagnosed MI, coronary artery bypass surgery, coronary angioplasty, hypertrophic cardiomyopathy (HCM), heart failure, and stroke. After all exclusions, the final analysis cohorts consisted of 13 725 ARIC study participants and 5207 CHS participants (Figure 1).
Figure 1. Study population derivation from the ARIC study (A) and CHS (B).
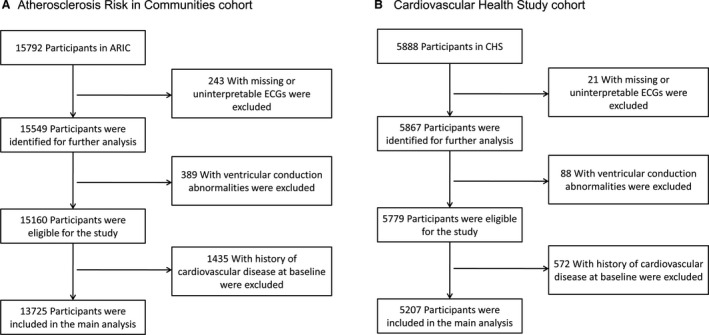
ARIC indicates Atherosclerosis Risk in Communities study; and CHS, Cardiovascular Health Study.
ECG Analysis and Diagnostic Criteria for SMI
At the examination, a standard resting supine 12‐lead ECG using MAC PC ECG machines (Marquette Electronics, Milwaukee, WI) was obtained for each subject a minimum of 1 hour after any smoking or caffeine ingestion. All ECGs were read by 2 trained medical practitioners who had received training in ECG reading according to the Minnesota code (MC) and were blinded to outcome status. Final decisions about the discrepancies between the practitioners were made by another senior practitioner.
Incident SMI was defined as ECG evidence of new MI during follow‐up visits in the ARIC study and CHS that was not present at the baseline visit in the absence of documented CMI. Participants with both SMI and CMI during follow‐up visits were considered to have CMI. ECG evidence of MI was defined by the new appearance of MC ECG classifications as a major Q/QS wave abnormality (MC 1.1 or MC 1.2) or minor Q/QS wave abnormality (MC 1.3) plus major ST‐T abnormality (MC 4.1, MC 4.2, MC 5.1, or MC 5.2). 17
Ascertainment of Outcomes
The primary study end point was physician‐adjudicated SCD. The methods for ascertainment of SCD events have been described previously. 18 To identify SCD, all fatal CHD events (including definite fatal MI, definite fatal CHD, and possible fatal CHD) in ARIC and CHS were reviewed by an independent panel of physicians. In the present study, SCD was defined as a sudden pulseless condition that was fatal (within 24 hours) and that was consistent with a ventricular tachyarrhythmia occurring in the absence of a known noncardiac condition as the proximate cause of the death. The secondary end point was non‐SCD (NSCD) defined as CHD death not meeting SCD criteria. 19
Statistical Analysis
For baseline characteristics by MI status (no MI, SMI, and CMI), descriptive statistics were used to determine mean values and SDs, as well as frequencies and percentages for categorical variables. We used multiple imputation based on 5 replications and the Markov‐chain Monte Carlo method, to account for missing data on education, body mass index (BMI), dyslipidemia, and heart rate. Each participant contributed follow‐up time from the date of the baseline examination until the earliest of the following dates: SCD/NSCD, other death, loss to follow‐up, or end of follow‐up. We calculated average follow‐up using the reverse Kaplan–Meier estimator by flipping the meaning of event and censor. 20 Cumulative incidence rates of SCD and NSCD per 1000 person‐years were calculated among ARIC and CHS participants who had SMI and CMI (versus no MI). Cumulative incidence curves of the time to SCD or NSCD by MI status used the Kaplan–Meier method.
As correlation tests of Schoenfeld residuals and the rank order of event time for assessing Cox proportional hazard assumption indicated that application of the Cox proportional hazard model was appropriate, time‐varying Cox proportional hazard models were used to obtain multivariable adjusted hazard ratios (HRs) to examine the associations of SMI and CMI (versus no MI) with SCD/NSCD, as well as test for modification of the association between MI and SCD/NSCD for a series of potential effect modifiers. We ran 3 models: in model 1, we have no adjustment for cardiovascular risk factors. In model 2, we adjusted for age (continuous), sex, and race at baseline. In model 3, we additionally adjusted for the baseline covariates: education levels, smoking status, alcohol use, hypertension, diabetes mellitus, dyslipidemia, heart rate (continuous), BMI, ECG‐determined left ventricular hypertrophy, use of blood pressure–lowering medication, use of beta‐blockers, use of aspirin, use of statins at the baseline visit, and incident heart failure. In addition, the impact of competing risk adjustment on SCD risk was evaluated by estimating HRs with and without adjustment for competing risk of NSCD. To assess the association between electrocardiographic markers of SMI and SCD, SMI was stratified according to the morphology of Q wave (major Q/QS wave abnormality or minor Q/QS wave abnormality), and the ECG abnormalities were categorized as anterior (V1–V3), lateral (I, aVL, or V4–V6), and inferior (II, III, or aVF), in which the SMI subgroups were each compared with the reference group with no MI.
The ARIC and CHS results were meta‐analyzed using random effect models. The meta‐analysis results were considered the primary results. Population‐attributable fractions were calculated to evaluate the potential impact of risk factor reduction from the public health perspective using the following formula: population‐attributable fraction=pdi[(HRi−1)/HRi], where pdi is the proportion of cases falling into ith exposure level and HRi is the HR comparing ith exposure level with unexposed group. 21 We then calculated −2log likelihood values, Akaike information criterion, and area under the receiver operating characteristic curve to evaluate the incremental prognostic value of the addition of SMI/CMI to the basic model. Finally, stratified analyses were performed by sex, race, history of hypertension, history of diabetes mellitus, smoking status, and BMI group (18.5–25, 25–30, and ≥30), and the P values for interaction were calculated in each subgroup. We also assessed the interaction with continuous covariates such as age and heart rate. Participants were divided into 5 age groups to evaluate age‐related effects: 45 to 54, 55 to 64, 65 to 74, 75 to 84, and 85+ years of age. We used Stata version 15.0 (StataCorp, College Station, TX) for all analyses. Statistical tests were 2‐sided and used a significance level of P<0.05.
Results
Baseline Characteristics
The cohort at risk for SCD in the ARIC study consisted of 7474 women and 6251 men 45 to 64 years of age at baseline and, in the CHS, 3003 women and 2204 men ≥65 years of age or older at baseline (Table 1). Of the 5207 participants in the CHS, 4697 (90.2%) were from the first cohort and 510 (9.8%) were from the second cohort. From visit 2 through visit 4 of the ARIC cohort, 513 subjects (3.7%) experienced SMI, and 441 (3.2%) experienced CMI. During the follow‐up visits of the CHS cohort, 1070 subjects (20.5%) experienced SMI, and 632 (12.1%) experienced CMI.
Table 1.
Baseline Characteristics According to Myocardial Infarction Status, ARIC Cohort, and CHS Cohort
| ARIC Cohort | CHS Cohort | |||||||||
|---|---|---|---|---|---|---|---|---|---|---|
| No MI (n=12 771) | SMI (n=513) | CMI (n=441) | P Value* | P Value † | No MI (n=3505) | SMI (n=1070) | CMI (n=632) | P Value* | P Value † | |
| Age, y | 54.1 (5.8) | 55.9 (5.3) | 56.5 (5.4) | 0.09 | <0.001 | 72.1 (5.5) | 72.7 (5.7) | 72.9 (5.4) | 0.62 | <0.001 |
| Women | 7153 (56.0) | 158 (30.8) | 163 (37.0) | 0.05 | <0.001 | 2141 (61.1) | 592 (55.3) | 270 (42.7) | <0.001 | <0.001 |
| Black individuals | 3298 (25.8) | 111 (21.6) | 117 (26.5) | 0.08 | 0.10 | 575 (16.4) | 174 (16.3) | 101 (16.0) | 0.88 | 0.96 |
| Education levels | ||||||||||
| Low | 2929 (22.9) | 149 (29.0) | 166 (37.6) | 0.01 | <0.001 | 1022 (29.2) | 317 (29.6) | 194 (30.7) | 0.89 | 0.90 |
| Intermediate | 5252 (41.1) | 195 (38.0) | 160 (36.3) | 1766 (50.4) | 544 (50.8) | 315 (49.8) | ||||
| High | 4590 (35.9) | 169 (32.9) | 115 (26.1) | 717 (20.5) | 209 (19.5) | 123 (19.5) | ||||
| Smoking status | ||||||||||
| Never | 3262 (25.5) | 159 (31.0) | 177 (40.1) | 0.001 | <0.001 | 406 (11.6) | 146 (13.6) | 74 (11.7) | 0.03 | 0.001 |
| Former | 4088 (32.0) | 224 (43.7) | 142 (32.2) | 1404 (40.1) | 442 (41.3) | 303 (47.9) | ||||
| Current | 5421 (42.5) | 130 (25.3) | 122 (27.7) | 1695 (48.4) | 482 (45.1) | 255 (40.4) | ||||
| Alcohol use | 7209 (56.5) | 282 (55.0) | 202 (45.8) | 0.005 | <0.001 | 1784 (50.9) | 517 (48.3) | 290 (45.9) | 0.33 | 0.04 |
| Hypertension | 4282 (33.5) | 262 (51.1) | 249 (56.5) | 0.10 | <0.001 | 1455 (41.5) | 541 (50.6) | 323 (51.1) | 0.83 | <0.001 |
| Diabetes mellitus | 1421 (11.1) | 110 (21.4) | 120 (27.2) | 0.04 | <0.001 | 499 (14.2) | 207 (19.4) | 142 (22.5) | 0.12 | <0.001 |
| Dyslipidemia | 5363 (42.0) | 242 (47.2) | 238 (54.0) | 0.04 | <0.001 | 1372 (39.1) | 397 (37.1) | 242 (38.3) | 0.63 | 0.48 |
| Heart rate, bpm | 66.7 (10.2) | 66.0 (10.9) | 67.8 (11.8) | 0.01 | 0.02 | 67.9 (10.9) | 68.3 (11.8) | 68.0 (12.0) | 0.61 | 0.66 |
| Body mass index, kg/m2 | 27.7 (5.4) | 28.1 (5.3) | 28.6 (5.2) | 0.14 | <0.001 | 26.5 (4.1) | 26.7 (4.1) | 27.0 (4.0) | 0.15 | <0.001 |
| Blood pressure–lowering medication use | 3735 (29.3) | 250 (48.8) | 224 (50.8) | 0.53 | <0.001 | 1381 (39.4) | 525 (49.1) | 319 (50.4) | 0.57 | <0.001 |
| Beta‐blocker use | 1258 (9.6) | 118 (23.0) | 88 (20.0) | 0.25 | <0.001 | 390 (11.1) | 172 (16.1) | 89 (14.1) | 0.27 | <0.001 |
| Aspirin use | 5855 (45.9) | 294 (57.3) | 206 (46.7) | <0.001 | <0.001 | 1679 (47.9) | 538 (50.3) | 337 (53.4) | 0.23 | <0.001 |
| Statin use | 257 (2.0) | 25 (4.9) | 29 (6.6) | 0.26 | <0.001 | 77 (2.2) | 24 (2.2) | 16 (2.5) | 0.70 | 0.87 |
Values are mean±SD when appropriate. ARIC indicates Atherosclerosis Risk in Communities; CHS, Cardiovascular Health Study; CMI, clinically manifest myocardial infarction; MI, myocardial infarction; and SMI, silent myocardial infarction.
P value for comparison between SMI and CMI with the unpaired Student t test and χ2 for continuous and categorical variables, respectively.
P value for comparison among the 3 groups using ANOVA and χ2 for continuous and categorical variables, respectively.
Baseline characteristics of the study participants stratified by MI status were shown in Table 1. The SMI and CMI shared common cardiovascular risk factors, and the prevalence of standard coronary risk factors was higher in subjects with SMI or CMI than those without MI. Subjects with SMI were more often older and men, had lower education levels, had a higher BMI, and were more likely to have histories of hypertension and diabetes mellitus compared with those without MI but less likely to be smokers and alcohol drinkers. They were also more likely to be taking aspirin, beta‐blockers, and blood pressure–lowering medication.
Of note, the use of beta‐blockers was not significantly different in subjects with SMI compared with those with CMI at baseline for both cohorts. However, during follow‐up, subjects with SMI are less likely to take beta‐blockers than those with CMI (34.1% versus 42.9% in ARIC cohort; P<0.001; 28.8% versus 40.2% in CHS cohort; P<0.001). Also, we observed less use of beta‐blockers in subjects with minor Q/QS wave compared with those with major Q/QS wave (27.3% versus 38.9% in ARIC cohort; P<0.001; 24.3% versus 31.5% in CHS cohort; P<0.001). In addition, subjects with SMI is less likely to be treated with coronary revascularization than those with CMI in CHS cohort (8.7% versus 41.8%; P<0.001), but not in ARIC cohort (22.4% versus 25.9%; P=0.216).
The overall incidence rate of SMI and CMI were 8.4 and 5.7 per 1000 person‐years, respectively, and SMI represented 59.6% of all MIs in the general population. The prevalence of incident SMI was age dependent and increased dramatically after 65 years of age; it was 2.4 per 1000 person‐years at ages 45 to 54 but 46.3 per 1000 person‐years at ages ≥85. The prevalence also increased with age for the CMI, ranging from 1.9 per 1000 person‐years at ages 45 to 54, to 19.4 per 1000 person‐years at ages ≥85. In addition, the incidence rate of SMI was significantly higher than CMI in every age category (Figure 2).
Figure 2. Incidence rate of SMI and CMI and change as a function of age.
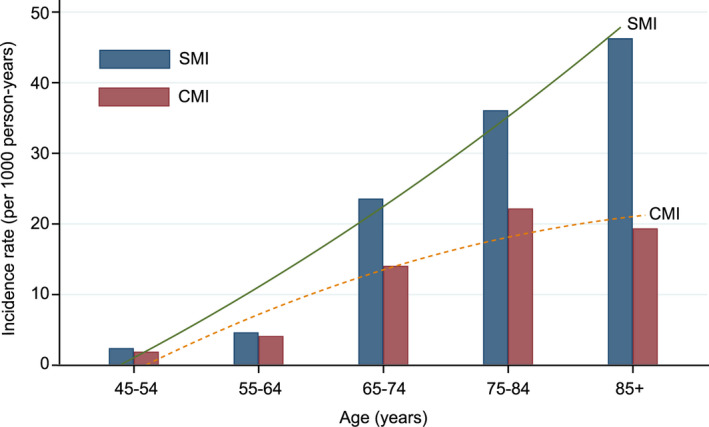
CMI indicates clinically manifest myocardial infarction; and SMI, silent myocardial infarction.
Association Between SMI and Risk of SCD
In the ARIC cohort, during a median follow‐up of 25.4 (interquartile range 18.9–25.6) years, there were 527 cases of SCD and 476 cases of NSCD. In time‐varying Cox proportional hazard models adjusting for age, sex, race, and both incident SMI and CMI, compared with no MI, were significantly associated with increased risk of SCD (Table 2, model 2). Although additional adjustment for cardiovascular risk factors attenuated these risk estimates (Table 2, model 3), the associations remained statistically significant. The magnitude of risk of SCD associated with SMI was larger than the risk associated with CMI (adjusted HR, 5.20; 95% CI, 3.81–7.10; P<0.001 for SMI; and adjusted HR, 3.80; 95% CI, 2.76–5.23; P<0.001 for CMI; P=0.032). In addition, as compared with no MI, SMI and CMI were associated with 6.04‐ and 12.75‐fold risk of NSCD, but the risk estimate associated with SMI seemed to be lower than the risk associated with CMI (P<0.001).
Table 2.
Risk of Sudden Cardiac Death and Non–Sudden Cardiac Death by Myocardial Infarction Status, ARIC Cohort, and CHS Cohort
| No. of Events | Person‐Years | Crude Incidence Rate* (95% CI) | Model 1 † HR (95% CI) | Model 2 ‡ HR (95% CI) | Model 3 § HR (95% CI) | |
|---|---|---|---|---|---|---|
| Sudden cardiac death | ||||||
| ARIC cohort | ||||||
| No MI | 408 | 280 667 | 1.45 (1.32–1.60) | 1.00 | 1.00 | 1.00 |
| SMI | 73 | 6217 | 11.74 (9.21–14.74) | 8.42 (6.19–11.45) | 6.80 (4.99–9.26) | 5.20 (3.81–7.10) |
| CMI | 46 | 5278 | 8.72 (6.39–11.61) | 5.08 (3.70–6.94) | 4.48 (3.25–6.17) | 3.80 (2.76–5.23) |
| CHS cohort | ||||||
| No MI | 284 | 48 057 | 5.91 (5.24–6.64) | 1.00 | 1.00 | 1.00 |
| SMI | 115 | 10 846 | 10.60 (8.76–12.71) | 2.10 (1.63–2.71) | 1.80 (1.40–2.32) | 1.70 (1.32–2.19) |
| CMI | 127 | 4086 | 31.08 (25.98–36.87) | 5.38 (4.35–6.66) | 4.32 (3.49–5.37) | 4.08 (3.29–5.06) |
| Combined | ||||||
| No MI | 692 | 328 724 | 2.11 (1.95–2.27) | 1.00 | 1.00 | 1.00 |
| SMI | 188 | 17 063 | 11.02 (9.51–12.70) | 3.69 (3.03–4.49) | 3.06 (2.52–3.73) | 2.65 (2.18–3.23) |
| CMI | 173 | 9364 | 18.48 (15.84–21.41) | 5.28 (4.43–6.30) | 4.37 (3.65–5.23) | 3.99 (3.34–4.77) |
| Non–sudden cardiac death | ||||||
| ARIC cohort | ||||||
| No MI | 314 | 280 667 | 1.12 (1.00–1.25) | 1.00 | 1.00 | 1.00 |
| SMI | 68 | 6217 | 10.94 (8.50–13.85) | 8.47 (6.38–11.23) | 6.96 (5.23–9.27) | 6.04 (4.54–8.05) |
| CMI | 94 | 5278 | 17.81 (14.42–21.75) | 21.94 (17.36–27.72) | 17.32 (13.68–21.94) | 12.75 (10.04–16.18) |
| CHS cohort | ||||||
| No MI | 255 | 48 057 | 5.31 (4.68–6.00) | 1.00 | 1.00 | 1.00 |
| SMI | 95 | 10 846 | 8.76 (7.09–10.70) | 2.09 (1.62–2.70) | 1.78 (1.38–2.30) | 1.64 (1.27–2.11) |
| CMI | 137 | 4086 | 33.53 (28.22–39.52) | 6.31 (5.11–7.79) | 5.06 (4.09–6.27) | 4.68 (3.77–5.79) |
| Combined | ||||||
| No MI | 569 | 328 724 | 1.73 (1.59–1.88) | 1.00 | 1.00 | 1.00 |
| SMI | 163 | 17 063 | 9.55 (8.15–11.13) | 3.92 (3.24–4.74) | 3.26 (2.69–3.94) | 2.91 (2.41–3.52) |
| CMI | 231 | 9364 | 24.67 (2.16–28.02) | 11.03 (9.43–12.90) | 8.80 (7.51–10.31) | 7.33 (6.25–8.59) |
ARIC indicates Atherosclerosis Risk in Communities; CHS, Cardiovascular Health Study; CMI, clinically manifest myocardial infarction; HR; hazard ratio; MI, myocardial infarction; and SMI, silent myocardial infarction.
per 103 person‐years.
Model 1adjusted for no cardiovascular risk factor.
Model 2 adjusted for age, sex, and race.
Model 3 adjusted for variables in model 2 plus education levels, smoking status, alcohol use, hypertension, diabetes mellitus, dyslipidemia, heart rate (continuous), BMI, ECG‐determined left ventricular hypertrophy, use of blood pressure–lowering medication, use of beta‐blockers, use of aspirin, use of statins at the baseline visit, and incident heart failure.
In the CHS cohort, during a median follow‐up of 12.1 (interquartile range, 6.2–18.5) years, there were 526 cases of SCD and 487 cases of NSCD. In time‐varying Cox proportional hazard models adjusting for demographics and clinical risk factors (Table 2, model 3), incident SMI was associated with higher risk of SCD (adjusted HR, 1.70; 95% CI, 1.32–2.19; P<0.001) and NSCD (adjusted HR, 1.64; 95% CI, 1.27–2.11; P<0.001) than no MI. In contrast to the ARIC study, CMI conferred markedly higher risk for both SCD (adjusted HR, 4.08; 95% CI, 3.29–5.06; P<0.001) and NSCD (adjusted HR, 4.68; 95% CI, 3.77–5.79; P<0.001), as compared with incident SMI (P<0.001). Figure 3 and Table 2 show the cumulative incidence of SCD and NSCD stratified by MI status for the ARIC and CHS cohorts.
Figure 3. Cumulative incidence of sudden cardiac death and non–sudden cardiac death stratified by MI status.
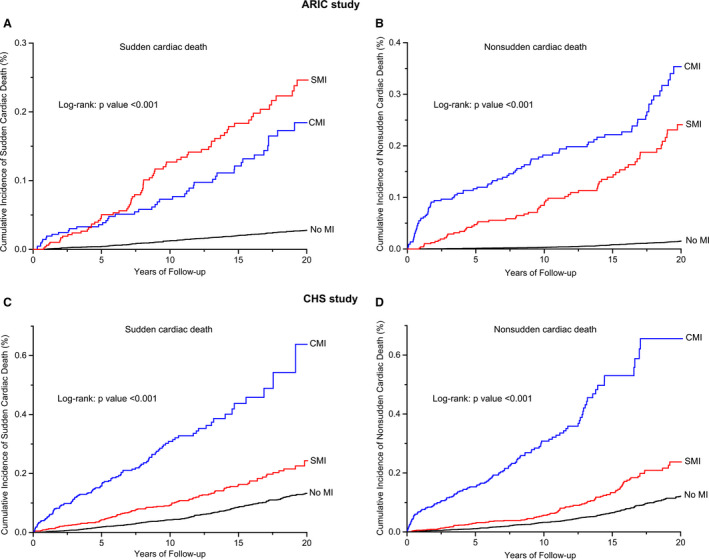
A and B, Sudden cardiac death and non–sudden cardiac death in the ARIC study; (C and D) sudden cardiac death and non–sudden cardiac death in the CHS study. ARIC indicates Atherosclerosis Risk in Communities study; CHS, Cardiovascular Health Study; CMI clinically manifest myocardial infarction; MI, myocardial infarction; and SMI, silent myocardial infarction.
The pooled HR (95% CI) of incident SMI for SCD in the ARIC study and the CHS was 2.65 (95% CI, 2.18–3.23; P<0.001).The pooled HR (95% CI) of incident SMI for NSCD was 2.91 (95% CI, 2.41–2.52; P<0.001) (Table 2). These 2 HRs did not differ significantly (P=0.612). However, the pooled HRs associated with CMI were 3.99 (95% CI, 3.34–4.77; P<0.001) for SCD and 7.33 (95% CI, 6.25–8.59; P<0.001) for NSCD, and statistically higher than the HRs associated with SMI (P<0.001). The pooled HR for SCD obtained from the competing risk model were slightly more attenuated than the HR obtained from the conventional Cox proportional hazards model, but remained statistically significant (adjusted HR, 2.44; 95% CI, 2.01–2.95; P<0.001 for SMI; and adjusted HR, 3.85; 95% CI, 3.12–4.75; P<0.001 for CMI).
Using the information on person‐years in subjects with or without MI, we could calculate absolute annual rates of SCD from 3 groups: 11.0 cases per 1000 person‐years in subjects with SMI, 18.5 cases in those with CMI, and 2.1 cases in those without MI, corresponding to an absolute risk increase of 8.9 (95% CI, 7.3–10.5) cases per 1000 person‐years for SMI and 16.4 (95% CI, 13.6–19.1) cases per 1000 person‐years for CMI (Table 2).Using the unadjusted summary risk estimates, we could calculate the population‐attributable fraction of SCD attributable to MI were 11.1% (95% CI, 9.7–12.3%) for SMI, and 12.3% (95% CI, 11.5–13.0%) for CMI. The additive prognostic value of SMI/CMI in addition to the basic model was further evaluated. The combined model with SMI/CMI provided a better fit with lower −2log likelihood and Akaike information criterion than that in the basic model for both SCD and NSCD. On receiver operating characteristic curve analysis, the model for SCD had a significantly higher predictive value when SMI/CMI was included (area under the curve, 0.74; 95% CI, 0.73–0.75;, P<0.001 for SMI; area under the curve, 0.75; 95% CI 0.73–0.77;, P<0.001 for CMI) compared with when it was not (area under the curve, 0.72; 95% CI, 0.0.71–0.73). Similarly, addition of SMI/CMI could also improve the predictive values for the outcome of NSCD (Table 3, Figure 4).
Table 3.
Incremental Prognostic Value of the Addition of SMI/CMI to the Basic Model for Sudden Cardiac Death and Non–Sudden Cardiac Death
| Basic Model* | Basic Model +SMI | Basic Model +CMI | |||||||||
|---|---|---|---|---|---|---|---|---|---|---|---|
| −2log Likelihood | AIC | ROC AUC | −2log Likelihood | AIC | ROC AUC | P Value † | −2log Likelihood | AIC | ROC AUC | P Value † | |
| Sudden cardiac death | 19 016 | 19 048 | 0.72 (0.71–0.73) | 15 730 | 15 766 | 0.74 (0.73–0.75) | <0.001 | 15 161 | 15 197 | 0.75 (0.73–0.77) | <0.001 |
| Non–sudden cardiac death | 16 750 | 16 782 | 0.74 (0.73–0.76) | 16 308 | 16 344 | 0.76 (0.74–0.77) | <0.001 | 16 080 | 16 114 | 0.78 (0.77–0.79) | <0.001 |
AIC indicates Akaike information criteria; CMI, clinically manifest myocardial infarction; ROC AUC, area under the receiver operating characteristics; and SMI, silent myocardial infarction.
Variables included in basic model: age, sex, race, education levels, smoking status, alcohol use, hypertension, diabetes mellitus, dyslipidemia, heart rate (continuous), body mass index, ECG‐determined left ventricular hypertrophy, use of BP‐lowering medication, use of beta‐blockers, use of aspirin, use of statins at the baseline visit and incident heart failure.
P value compared with basic model.
Figure 4. Comparison of area under the receiver operating characteristic curve (AUC) for sudden cardiac death (A) and non–sudden cardiac death (B) between the full model without and with SMI/CMI.
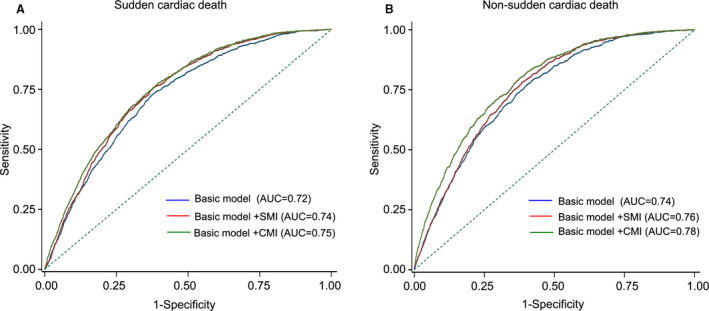
AUC indicates area under the curve; CMI, clinically manifest myocardial infarction; and SMI, silent myocardial infarction.
Electrocardiographic Measurements
We also assessed the prognostic significance of different electrocardiographic phenotypes in the presence of SMI (Table 4). Compared with those with major Q/QS wave abnormality, subjects with minor Q/QS wave plus major ST‐T abnormality had an increased risk of SCD (adjusted HR,3.25; 95% CI, 1.86–5.68; P<0.001 versus adjusted HR, 1.80; 95% CI, 1.27–2.55; P<0.001; P=0.029), and risk of NSCD (adjusted HR, 4.05; 95% CI, 2.34–7.01; P<0.001 versus adjusted HR, 2.03; 95% CI, 1.31–3.15; P<0.001; P=0.035). In addition, pathological Q waves in inferior leads and lateral leads seem to confer higher risk of SCD than those in anterior leads. ST‐segment depression in anterior leads and lateral leads was also associated with higher risk of SCD compared with that in inferior leads.
Table 4.
Association Between Electrocardiographic Markers of SMI and Sudden Cardiac Death and Non–Sudden Cardiac Death
| Variable | Sudden Cardiac Death | Non–Sudden Cardiac Death | ||||||
|---|---|---|---|---|---|---|---|---|
| No. of Events | Person‐Years | Crude Incidence Rate (95% CI) | HR (95% CI)* | No. of Events | Person‐Years | Crude Incidence Rate (95% CI) | HR (95% CI)* | |
| No MI | 692 | 328 724 | 2.11 (1.95–2.27) | 1.00 (Ref) | 569 | 328 724 | 1.73 (1.59–1.88) | 1.00 (Ref) |
| Type of SMI | ||||||||
| Major Q/QS wave | 81 | 9761 | 8.30 (6.60–10.30) | 1.80 (1.27–2.55) | 69 | 9761 | 7.07 (5.50–8.94) | 2.03 (1.31–3.15) |
| Minor Q/QS wave | 107 | 7302 | 14.65 (12.02–17.68) | 3.25 (1.86–5.68) | 94 | 7302 | 12.87 (10.42–15.73) | 4.05 (2.34–7.01) |
| Pathological Q wave | ||||||||
| Anterior | 42 | 6062 | 6.93 (5.00–9.35) | 1.34 (0.93–1.93) | 59 | 6062 | 9.73 (7.42–12.54) | 3.24 (1.72–6.10) |
| Inferior | 113 | 8919 | 12.67 (10.45–15.21) | 2.76 (1.55–4.91) | 86 | 8919 | 9.64 (7.72–11.89) | 3.01 (1.34–6.76) |
| Lateral | 33 | 2082 | 15.85 (10.94–22.19) | 3.29 (1.88–5.76) | 18 | 2082 | 8.65 (5.13–13.63) | 2.54 (0.78–8.27) |
| Inverted T wave | ||||||||
| Anterior | 94 | 7156 | 13.14 (10.63–16.05) | 3.05 (1.99–4.67) | 74 | 7156 | 10.34 (8.13–12.97) | 3.86 (2.44–6.11) |
| Inferior | 38 | 3210 | 11.84 (8.39–16.21) | 2.68 (1.31–5.48) | 25 | 3210 | 7.79 (5.05–11.48) | 2.51 (1.33–4.74) |
| Lateral | 89 | 8902 | 10.00 (8.04–12.29) | 2.32 (11.57–3.43) | 85 | 8902 | 9.55 (7.63–11.79) | 3.68 (2.43–5.57) |
| Depressed ST segment | ||||||||
| Anterior | 36 | 2117 | 17.01 (11.94–23.47) | 4.26 (2.50–7.26) | 44 | 2117 | 20.78 (15.14–27.80) | 6.54 (2.87–14.90) |
| Inferior | 6 | 826 | 7.26 (2.67–15.74) | 1.78 (0.88–3.60) | 18 | 826 | 21.79 (12.97–34.22) | 6.67 (2.01–22.13) |
| Lateral | 87 | 8952 | 9.72 (7.79–11.97) | 2.49 (1.58–3.92) | 62 | 8952 | 6.93 (5.31–8.87) | 2.12 (1.19–3.78) |
HR indicates hazard ratio; MI, myocardial infarction; and SMI, silent myocardial infarction.
Cox proportional hazards model adjusted for age (continuous), sex, race, education levels, smoking status, alcohol use, hypertension, diabetes mellitus, dyslipidemia, heart rate (continuous), body mass index, ECG‐determined left ventricular hypertrophy, use of blood pressure–lowering medication, use of beta‐blockers, use of aspirin, use of statins at the baseline visit, and incident heart failure.
Stratified Analyses
We performed stratified analyses across several prespecified clinical factors that might influence the outcomes. As shown, the pattern of associations between MI status and SCD was consistent among these subgroups; that is, there was no effect modification of history of diabetes mellitus, smoking status, and BMI on the association between MI by type and SCD. Three interaction effects between subgroup and SMI were identified: SMI was associated with a greater risk of SCD in men (adjusted HR, 3.05; 95% CI, 2.34–3.97; P<0.001) than in women (adjusted HR, 1.93; 95% CI, 1.42–2.62; P<0.001; P=0.031 for interaction), in White individuals (adjusted HR, 2.83; 95% CI, 2.26–3.55; P<0.001) compared with Black individuals (adjusted HR, 1.81; 95% CI, 1.15–2.85; P=0.010; P=0.003 for interaction), in subjects without hypertension (adjusted HR, 2.91; 95% CI, 2.16–3.90; P<0.001) compared with those with hypertension (adjusted HR, 2.29; 95% CI, 1.74–3.01; P=0.001 for interaction) (Figure 5). No significant interactions were found between these prespecified clinical factors and SMI for the secondary outcome. Given that the relationship between SMI and SCD differed on the basis of race and sex, the 4 subgroups (White men, White women, Black men, and Black women) were examined separately. Only Black women were found to have no significantly increased risk of SCD when SMI was present (adjusted HR, 1.60; 95% CI, 0.87–2.96; P=0.132) (Table 5).
Figure 5. Associations between type of MI and sudden cardiac death in subgroups.
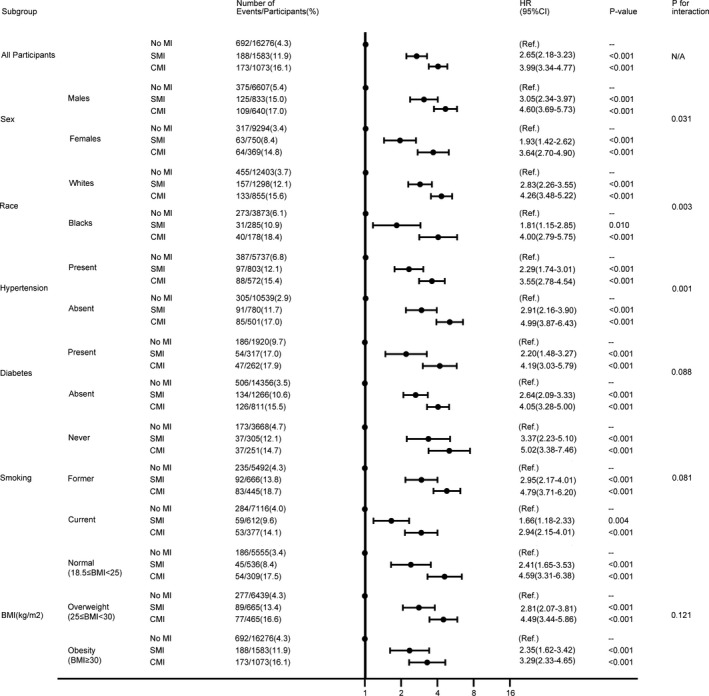
Model adjusted for age (continuous), sex, race, education levels, smoking status, alcohol use, hypertension, diabetes mellitus, dyslipidemia, heart rate, body mass index (continuous), ECG‐determined left ventricular hypertrophy, use of blood pressure–lowering medication, use of beta‐blockers, use of aspirin, use of statins at the baseline visit, and incident heart failure (subgroup used in stratification is not included in the model). BMI indicates body mass index; CMI, clinically manifest myocardial infarction; HR, hazard ratio; MI, myocardial infarction; and SMI, silent myocardial infarction.
Table 5.
Multivariable‐Adjusted Hazard Ratios of Sudden Cardiac Death and Non–Sudden Cardiac Death According to Myocardial Infarction Status, Stratified by Race and Sex Simultaneously
| White Men HR † (95% CI) (n=6748) | White Women HR † (95% CI) (n=7808) | Black Men HR † (95% CI) (n=1707) | Black Women HR † (95% CI) (n=2669) | |
|---|---|---|---|---|
| Sudden cardiac death | ||||
| No MI | 1.00 | 1.00 | 1.00 | 1.00 |
| SMI | 3.33 (2.49–4.45) | 2.17 (1.52–3.10) | 2.09 (1.07–4.09) | 1.60 (0.87–2.96) |
| CMI | 4.45 (3.46–5.71) | 4.25 (3.01–5.99) | 5.53 (3.51–8.72) | 2.62 (1.41–4.86) |
| Non–sudden cardiac death | ||||
| No MI | 1.00 | 1.00 | 1.00 | 1.00 |
| SMI | 3.40 (2.57–4.49) | 2.31 (1.63–3.27) | 2.25 (1.14–4.44) | 4.06 (2.15–7.67) |
| CMI | 6.95 (5.49–8.81) | 6.77 (5.03–9.11) | 8.54 (5.25–13.89) | 12.27 (7.27–20.73) |
CMI indicates clinically manifest myocardial infarction; HR, hazard ratio; MI, myocardial infarction; and SMI, silent myocardial infarction.
Cox proportional hazards model adjusted for age (continuous), sex, race, education levels, smoking status, alcohol use, hypertension, diabetes mellitus, dyslipidemia, heart rate (continuous), body mass index, ECG‐determined left ventricular hypertrophy, use of blood pressure–lowering medication, use of beta‐blockers, use of aspirin, use of statins at the baseline visit, and incident heart failure.
We further assessed the interactions with continuous covariates and MI status for the outcomes. No significant interaction effect was identified between heart rate and MI status for both SCD (P=0.112) and NSCD (P=0.258). However, age seemed to be an important factor that might influence the outcomes (P<0.001 for SCD and NSCD). The risk of SCD associated with SMI was stronger in younger participants. The adjusted HRs of SCD associated with SMI among the 5 age groups were 6.56 (95% CI, 3.93–10.93; P<0.001) for ages 45 to 54, 4.61 (95% CI, 3.06–6.96; P<0.001) for ages 55 to 64, 2.37 (95% CI, 1.69–3.33; P<0.001) for ages 65 to 74, 1.21 (95% CI, 0.71–2.08; P=0.480) for ages 75 to 84, and 0.51 (95% CI, 0.06–4.45; P=0.545) for ages 85+, respectively. Similar trend was observed for the outcome of NSCD (Table 6).
Table 6.
Multivariable‐Adjusted Hazard Ratios of Sudden Cardiac Death and Non–Sudden Cardiac Death According to Myocardial Infarction Status, Stratified by Age Groups
| Age Group (y) | Incidence Rate per 1000 Person‐Years (95% CI)* | Sudden Cardiac Death | Non–Sudden Cardiac Death | ||
|---|---|---|---|---|---|
| Cases/Participants | HR (95% CI) † | Cases/Participants | HR (95% CI) † | ||
| SMI | |||||
| 45–54 | 2.42 (2.11–2.78) | 30/198 | 6.56 (3.93–10.93) | 18/198 | 6.10 (3.56–10.44) |
| 55–64 | 4.66 (4.17–5.20) | 43/312 | 4.61 (3.06–6.96) | 49/312 | 6.02 (4.24–8.53) |
| 65–74 | 23.59 (21.88–25.43) | 77/664 | 2.37 (1.69–3.33) | 57/664 | 1.74 (1.23–2.47) |
| 75–84 | 36.11 (32.65–39.92) | 36/366 | 1.21 (0.71–2.08) | 33/366 | 1.19 (0.70–2.01) |
| 85+ | 46.29 (34.54–61.77) | 2/43 | 0.51 (0.06–4.45) | 6/43 | 0.78 (0.16–3.71) |
| CMI | |||||
| 45–54 | 1.92 (1.64–2.24) | 17/157 | 4.89 (3.01–7.95) | 25/157 | 13.67 (8.69–21.49) |
| 55–64 | 4.14 (3.68–4.65) | 28/277 | 3.12 (1.99–4.87) | 68/277 | 13.08 (9.80–17.48) |
| 65–74 | 14.07 (12.76–15.51) | 81/396 | 5.47 (4.07–7.34) | 88/396 | 5.25 (3.92–7.03) |
| 75–84 | 22.20 (19.50–25.25) | 43/225 | 3.09 (2.02–4.74) | 44/225 | 2.93 (1.91–4.50) |
| 85+ | 19.38 (12.29–31.42) | 4/18 | 4.65 (1.11–19.54) | 6/18 | 1.61 (0.34–7.63) |
CMI indicates clinically manifest myocardial infarction; HR, hazard ratio; MI, myocardial infarction; and SMI, silent myocardial infarction.
Incidence rate of SMI or CMI.
Cox proportional hazards model adjusted for age (continuous), sex, race, education levels, smoking status, alcohol use, hypertension, diabetes mellitus, dyslipidemia, heart rate (continuous), body mass index, ECG‐determined left ventricular hypertrophy, use of blood pressure–lowering medication, use of beta‐blockers, use of aspirin, use of statins at the baseline visit, and incident heart failure.
Discussion
In 2 large population‐based cohort studies in the United States including middle‐aged and elderly individuals, we examined the incidence of SMI and its association with SCD. The 3 key findings are the following: (1) SMI is common (≈60% of the MIs are silent), and the incidence rate increases with age; (2) SMI was associated with ≈3‐fold increased risk of SCD, and the strength of the association between SMI and SCD was comparable to that between SMI and NSCD but weaker than the association between CMI and SCD; and (3) there are race, sex, and age differences in the prognostic significance of SMI. We found that the risk of SCD associated with SMI is stronger with White individuals, men, and younger age. These findings highlight the importance of detection of SMI and the potential impact of such detection on personalized prevention of SCD that takes into account race, sex, and age.
Previous studies have found incidence of SMI in the general population ranged from 2.19 to 24 per 1000 person‐years. 22 In agreement with this, the incidence rate of SMI in our study was 8.4 per 1000 person‐years, slightly higher than that of CMI. Clinically apparent MI causes myocardial scar formation, which provides a substrate for malignant reentrant arrhythmias and in turn leads to SCD. 23 SMI similarly could cause myocardial injury and scar formation, and myocardial ischemia can be one of the triggering factors, but it is unknown whether this type or degree of scar can lead to reentrant circuits formation and subsequent SCD. Prior studies have identified SMI to be associated with greater risk of future reinfarction, other CHD, stroke, heart failure, and all‐cause mortality, but few studies have examined the association between SMI and SCD. 11
Consistent with the previous report by Vähätalo et al, 12 the present study demonstrates a positive association between incident SMI and risk of SCD. Furthermore, another autopsy study by Adabag et al 24 in individuals who died because of SCD but had no prior coronary history had also shown that a large proportion had experienced SMI. However, our results add incremental values as compared with the previous reports. First, the study by Vähätalo et al was a case‐control study conducted in individuals who had SCD and CHD with higher baseline risk and inherent biases. The relative risk of SMI may be higher in this study because of selection biases, which were not present in our community‐based population study. Nonetheless, the current study indicates that the increased risk of SCD associated with SMI extends to the community. Second, although autopsy or myocardial biopsy might be more robust in detecting SMI compared with ECG, it is of limited predictive value in clinical application, as it is impractical for every subject to undergo myocardial biopsy before death. Because ECG is a noninvasive, inexpensive, readily available tool with high interrater reliability, SMI could be identified with ease as a prognostic risk factor. Third, as the study by Vähätalo et al included only White populations of European ancestry and mainly male patients with older age, studies are warranted to fill in knowledge gaps about SMI in Black individuals, women, and younger population, who were often underrepresented in epidemiologic studies of SCD. Our observations of race, sex, and age differences in the association between SMI and SCD add to the accumulating evidence of sex, race, and age differences in cardiovascular disease outcomes and the potential differences in the impact of risk factors among sexes, races, and different age groups. Fourth, they did not adjust for vascular risk factors or comorbidities, making the association between SMI and SCD inconclusive. In this context, this study adds novel findings supporting the hypothesis that SMI is an independent risk factor for SCD.
The increased risk of SCD associated with SMI detected by ECG in community‐based cohorts of middle‐aged and elderly populations is an important finding of this study, since we found that the majority of all MIs were clinically unrecognized, suggesting a significant public health burden. Currently, up to one‐third cases of SCD have no known causative mechanism and are classified as unexplained SCD. Early detection of risk factors has the potential to minimize the burden of SCD‐related mortality. 25 The association found between SMI and SCD of undetermined cause suggests that SMI, which was often missed in routine care, might be responsible for some proportion of SCD cases. Our results indicated the proportion of SCD explained by SMI was comparable to that explained by CMI. Given the prevalence and prognosis of SMI, repeated measurement of ECG during scheduled health maintenance visits should be considered for high‐risk subsets of patients, particularly for those with cardiovascular risk factors. Despite the fact that guideline‐directed medical therapy has a clear role in the secondary prevention of future SCD among CMI patients and has become part of a quality‐of‐care core measure, it is unclear whether such benefit exists for subjects with SMI. 5 Further studies are warranted to elucidate the beneficial effects of screening for SMI and whether guideline‐directed medical therapy would reduce the risk of SCD in SMI patients in the same way as CMI patients.
Not surprisingly, SMI has a weaker association with SCD than CMI. In the short term, ECG changes reflecting ischemic cascade in the myocardium might precede clinical symptoms. 26 Thus, there is possibility that SMI represents milder or earlier changes before the development of CMI or SCD. In addition, studies indicated that SMI might have smaller infarct size, and manifest less regional wall‐motion abnormalities and higher ejection fraction than CMI. That is to say, SMI does not influence the myocardium as significantly as CMI, which could be another explanation for the weaker risk of SCD with SMI than CMI. However, there are other potential differences that could possibly lead to a stronger association with SMI. Individuals with SMI might have been adversely affected by the inherent delays in diagnosis and treatment. Our results also indicated that subjects with SMI are less likely to take beta‐blockers or receive coronary revascularization than those with CMI to prevent SCD. In addition, although subjects with minor Q/QS wave experienced a higher risk of SCD, they had lower rate of using beta‐blockers compared with those with major Q/QS wave. Thus, further studies are needed to determine the underlying pathophysiological differences between SMI and CMI.
Although the incidence rate of SMI increases with age, our subgroup analysis showed that younger individuals had a higher risk of SCD from SMI than older individuals. In the ARIC cohort, which represented a younger population, the risk of SCD associated with SMI was even higher than the risk associated with CMI. Because we adjusted for potential confounding risk factors, it is less likely that our observed age differences were confounded by differences in MI‐associated morbidities. Among young adults, the majority of SCDs occurred during physical activity or outdoors. 27 , 28 Hence, it is possible that younger individuals with SMI were more often unaware of their disease and presumably did not limit their physical exertion, thus experiencing higher risk of malignant arrhythmias and SCD. Also, younger individuals are generally under less intense health surveillance and medical control and are less likely to have secondary prevention strategies for CHD. However, whether this is attributable to distinct pathophysiological mechanisms or treatment effects merits further investigation.
Our study demonstrates that the risk of SMI‐associated SCD tends to be higher in White individuals than in Black individuals and in men than in women. The mechanisms underlying the race and sex differences in our study are unclear. It is possible that genetic background, emerging risk factors, physical activity, access to health care, awareness, and adherence to medications contribute to sex and racial differences. For example, as indicated in previous studies, men seem to be more tolerant to pain than women, and thus they might be less likely to seek medical treatment or limit their physical exertion. 29 In addition, the race‐ and sex‐based disparity could be partly explained by the use of a single ECG cutoff across both races and sexes. It is possible that a certain degree of Q wave or ST‐T change may indicate larger infarct size in White individuals and in men, while the presence of Q wave or ST‐T change in a Black or a female individual may indicate a relatively benign finding.
However, there is one point regarding SMI defined by ECG that needs to be addressed. Some studies reported that Q waves on ECG are not sensitive markers of MI (≈40%) and their specificity is also not ideal (≈70–80%). 30 In the ICELAND MI community‐based cohort of older people (median age, 76 years), using cardiac magnetic resonance imaging as the gold standard, ECG detected only 12% (19/157) of all SMIs and 59% of SMIs by ECG (27/46) were not MI. 31 Because some ECG patterns associated with SMI are similar to those of other cardiac disease, particularly HCM, some SCDs in these subjects labeled as SMI could be attributable to an underlying nonischemic cardiomyopathy. 32 However, the diagnosis of SMI in previous studies was based on a single measurement of ECG, which might be less sensitive and specific in detecting SMI. In the present study, ECGs were measured 4 times during ≈10 years of follow‐up. In addition, we have excluded subjects with the presence of ECG evidence of MI, HCM, and other conditions with ECGs similar to SMI at baseline, and the diagnosis of incident SMI was based on new‐onset Q wave, while in patients with HCM the abnormal ECGs were present at an early stage of the disease and the Q wave persisted Therefore, the analytic approach applied in our study might increase the sensitivity in detecting SMI and reduce the possibility that we would enroll subjects with HCM or other nonischemic cardiac disease.
The major strengths of our study include the relatively large sample size, the long‐term and virtually complete follow‐up, inclusion of non‐White participants, extensive measurement of covariates, the detailed risk factor and ECG information, and physician adjudication of all SCD cases. Some limitations of our analysis should be noted. First, this study included only individuals between 45 and 92 years of age, and thus we cannot comment on the influence of SMI outside this age range. Also, our study involved only White and Black subjects; thus, the results might not be generalizable to other races/ethnicities. Second, because of the strictly epidemiologic nature of our investigation, we cannot further clarify the pathophysiologic circumstances underlying SMI. Third, although we controlled for potentially confounding factors in the multivariable‐adjusted analyses, the possibility of residual confounding cannot be completely ruled out. For example, given the limited data available, we could not adjust for baseline ejection fraction, which is a well‐established marker of SCD. However, we have excluded participants with a history of heart failure at baseline and adjusted for incident heart failure, which could partially reduce the possibility that ejection fraction might influence the outcomes. Fourth, the study has the limitation of inflated type 1 error with no adjustments for multiple testings in the multiple outcomes and subgroup analyses.
In conclusion, SMI in individuals detected by ECG has a significantly higher risk of SCD than individuals without MI. Being more prevalent than CMI, SMI constitutes an underappreciated public health problem. This finding should be confirmed in additional studies, and if confirmed, it adds to our evolving understanding that SMI is not a benign condition. Not only does SMI predispose to stroke or heart failure but also directly increase the risk of death from ventricular tachyarrhythmias. This study suggests that early detection of SMI by ECG may be warranted to predict future risk of SCD and to better identify those who might benefit from more aggressive risk screening and management.
Sources of Funding
The ARIC study is carried out as a collaborative study supported by National Heart, Lung, and Blood Institute contracts. The study was also financially supported by the grants from National Natural Science Foundation of China (No. 81600260, 81370285 and 81970206), Guangdong Natural Science Foundation (2016A030313210, 2019A1515010269), Guangzhou City Science and Technology Key Program (No. 201508020057), the Project of Guangdong Province Science and Technology Plan (2017A020215174), the Fundamental Research Funds for the Central Universities in Sun Yat‐Sen University (18ykpy08), and the Project of Kelin New Star of the First Affiliated Hospital of Sun Yat‐Sen University (Y50186).
Disclosures
None.
Acknowledgments
The authors thank the staff and participants of the ARIC study, CHS study, and BioLINCC for their important contributions.
(J Am Heart Assoc. 2021;10:e017044. DOI: 10.1161/JAHA.120.017044.)
For Sources of Funding and Disclosures, see page 14.
References
- 1. Deo R, Albert CM. Epidemiology and genetics of sudden cardiac death. Circulation. 2012;125:620–637. 10.1161/CIRCULATIONAHA.111.023838 [DOI] [PMC free article] [PubMed] [Google Scholar]
- 2. Wellens HJJ, Schwartz PJ, Lindemans FW, Buxton AE, Goldberger JJ, Hohnloser SH, Huikuri HV, Kaab S, La Rovere MT, Malik M, et al. Risk stratification for sudden cardiac death: current status and challenges for the future. Eur Heart J. 2014;35:1642–1651. 10.1093/eurheartj/ehu176 [DOI] [PMC free article] [PubMed] [Google Scholar]
- 3. Myerburg RJ, Junttila MJ. Sudden cardiac death caused by coronary heart disease. Circulation. 2012;125:1043–1052. 10.1161/CIRCULATIONAHA.111.023846 [DOI] [PubMed] [Google Scholar]
- 4. Jneid H, Addison D, Bhatt DL, Fonarow GC, Gokak S, Grady KL, Green LA, Heidenreich PA, Ho PM, Jurgens CY, et al. 2017 AHA/ACC clinical performance and quality measures for adults with ST‐elevation and non–ST‐elevation myocardial infarction: a report of the American College of Cardiology/American Heart Association Task Force on performance measures. J Am Coll Cardiol. 2017;70:2048–2090. 10.1016/j.jacc.2017.06.032 [DOI] [PubMed] [Google Scholar]
- 5. Al‐Khatib SM, Stevenson WG, Ackerman MJ, Bryant WJ, Callans DJ, Curtis AB, Deal BJ, Dickfeld T, Field ME, Fonarow GC, et al. 2017 AHA/ACC/HRS guideline for management of patients with ventricular arrhythmias and the prevention of sudden cardiac death: executive summary. Circulation. 2018;138:e210–e271. 10.1161/CIR.0000000000000548 [DOI] [PubMed] [Google Scholar]
- 6. Elliott MD, Heitner JF, Kim H, Wu E, Parker MA, Lee DC, Kaufman DB, Bonow RO, Judd R, Kim RJ. Prevalence and prognosis of unrecognized myocardial infarction in asymptomatic patients with diabetes: a two‐center study with up to 5 years of follow‐up. Diabetes Care. 2019;42:1290–1296. 10.2337/dc18-2266 [DOI] [PMC free article] [PubMed] [Google Scholar]
- 7. Burgess DC, Hunt D, Li L, Zannino D, Williamson E, Davis TM, Laakso M, Kesaniemi YA, Zhang J, Sy RW, et al. Incidence and predictors of silent myocardial infarction in type 2 diabetes and the effect of fenofibrate: an analysis from the Fenofibrate Intervention and Event Lowering in Diabetes (FIELD) study. Eur Heart J. 2010;31:92–99. 10.1093/eurheartj/ehp377 [DOI] [PubMed] [Google Scholar]
- 8. Davis TM, Coleman RL, Holman RR. Prognostic significance of silent myocardial infarction in newly diagnosed type 2 diabetes mellitus: United Kingdom Prospective Diabetes Study (UKPDS) 79. Circulation. 2013;127:980–987. 10.1161/CIRCULATIONAHA.112.000908 [DOI] [PubMed] [Google Scholar]
- 9. de Torbal A, Boersma E, Kors JA, van Herpen G, Deckers JW, van der Kuip DA, Stricker BH, Hofman A, Witteman JC. Incidence of recognized and unrecognized myocardial infarction in men and women aged 55 and older: the Rotterdam Study. Eur Heart J. 2006;27:729–736. 10.1093/eurheartj/ehi707 [DOI] [PubMed] [Google Scholar]
- 10. Amier RP, Smulders MW, van der Flier WM, Bekkers S, Zweerink A, Allaart CP, Demirkiran A, Roos ST, Teunissen P, Appelman Y, et al. Long‐term prognostic implications of previous silent myocardial infarction in patients presenting with acute myocardial infarction. JACC Cardiovasc Imaging. 2018;11:1773–1781. [DOI] [PubMed] [Google Scholar]
- 11. Acharya T, Aspelund T, Jonasson TF, Schelbert EB, Cao JJ, Sathya B, Dyke CK, Aletras AH, Sigurdsson S, Thorgeirsson G, et al. Association of unrecognized myocardial infarction with long‐term outcomes in community‐dwelling older adults: the ICELAND MI Study. JAMA Cardiol. 2018;3:1101–1106. 10.1001/jamacardio.2018.3285 [DOI] [PMC free article] [PubMed] [Google Scholar]
- 12. Vähätalo JH, Huikuri HV, Holmström LTA, Kenttä TV, Haukilahti MAE, Pakanen L, Kaikkonen KS, Tikkanen J, Perkiömäki JS, Myerburg RJ, et al. Association of silent myocardial infarction and sudden cardiac death. JAMA Cardiol. 2019;4:796–802. 10.1001/jamacardio.2019.2210 [DOI] [PMC free article] [PubMed] [Google Scholar]
- 13. Jia X, Sun W, Hoogeveen RC, Nambi V, Matsushita K, Folsom AR, Heiss G, Couper DJ, Solomon SD, Boerwinkle E, et al. High‐sensitivity troponin I and incident coronary events, stroke, heart failure hospitalization, and mortality in the ARIC Study. Circulation. 2019;139:2642–2653. 10.1161/CIRCULATIONAHA.118.038772 [DOI] [PMC free article] [PubMed] [Google Scholar]
- 14. The Atherosclerosis Risk in Communities (ARIC) Study: design and objectives. The ARIC Investigators. Am J Epidemiol. 1989;129:687–702. [PubMed] [Google Scholar]
- 15. Rosenberg MA, Patton KK, Sotoodehnia N, Karas MG, Kizer JR, Zimetbaum PJ, Chang JD, Siscovick D, Gottdiener JS, Kronmal RA, et al. The impact of height on the risk of atrial fibrillation: the Cardiovascular Health Study. Eur Heart J. 2012;33:2709–2717. 10.1093/eurheartj/ehs301 [DOI] [PMC free article] [PubMed] [Google Scholar]
- 16. Waks JW, Sitlani CM, Soliman EZ, Kabir M, Ghafoori E, Biggs ML, Henrikson CA, Sotoodehnia N, Biering‐Sørensen T, Agarwal SK, et al. Global electric heterogeneity risk score for prediction of sudden cardiac death in the general population: the Atherosclerosis Risk in Communities (ARIC) and Cardiovascular Health (CHS) studies. Circulation. 2016;133:2222–2234. 10.1161/CIRCULATIONAHA.116.021306 [DOI] [PMC free article] [PubMed] [Google Scholar]
- 17. Ronald JP, Richard SC, Zhu‐Ming Z. The Minnesota Code Manual of Electrocardiographic Findings | SpringerLink. London: Springer. 2010. [Google Scholar]
- 18. Zhao D, Post WS, Blasco‐Colmenares E, Cheng A, Zhang Y, Deo R, Pastor‐Barriuso R, Michos ED, Sotoodehnia N, Guallar E. Racial differences in sudden cardiac death. Circulation. 2019;139:1688–1697. 10.1161/CIRCULATIONAHA.118.036553 [DOI] [PMC free article] [PubMed] [Google Scholar]
- 19. Chen LY, Sotoodehnia N, Bůžková P, Lopez FL, Yee LM, Heckbert SR, Prineas R, Soliman EZ, Adabag S, Konety S, et al. Atrial fibrillation and the risk of sudden cardiac death: the Atherosclerosis Risk in Communities study and Cardiovascular Health Study. JAMA Intern Med. 2013;173:29–35. 10.1001/2013.jamainternmed.744 [DOI] [PMC free article] [PubMed] [Google Scholar]
- 20. Schemper M, Smith TL. A note on quantifying follow‐up in studies of failure time. Control Clin Trials. 1996;17:343–346. 10.1016/0197-2456(96)00075-X [DOI] [PubMed] [Google Scholar]
- 21. Rockhill B, Newman B, Weinberg C. Use and misuse of population attributable fractions. Am J Public Health. 1998;88:15–19. 10.2105/AJPH.88.1.15 [DOI] [PMC free article] [PubMed] [Google Scholar]
- 22. Jonsdottir LS, Sigfusson N, Sigvaldason H, Thorgeirsson G. Incidence and prevalence of recognised and unrecognised myocardial infarction in women. The Reykjavik Study. Eur Heart J. 1998;19:1011–1018. [DOI] [PubMed] [Google Scholar]
- 23. Arbustini E, Kramer CM, Narula J. Arrhythmogenic potential of border zone after myocardial infarction: scar is more than just a healed wound. JACC Cardiovasc Imaging. 2018;11:573–576. [DOI] [PubMed] [Google Scholar]
- 24. Adabag AS, Peterson G, Apple FS, Titus J, King R, Luepker RV. Etiology of sudden death in the community: results of anatomical, metabolic, and genetic evaluation. Am Heart J. 2010;159:33–39. 10.1016/j.ahj.2009.10.019 [DOI] [PMC free article] [PubMed] [Google Scholar]
- 25. Bagnall RD, Weintraub RG, Ingles J, Duflou J, Yeates L, Lam L, Davis AM, Thompson T, Connell V, Wallace J, et al. A prospective study of sudden cardiac death among children and young adults. N Engl J Med. 2016;374:2441–2452. 10.1056/NEJMoa1510687 [DOI] [PubMed] [Google Scholar]
- 26. Nesto RW, Kowalchuk GJ. The ischemic cascade: temporal sequence of hemodynamic, electrocardiographic and symptomatic expressions of ischemia. Am J Cardiol. 1987;59:23C–30C. 10.1016/0002-9149(87)90192-5 [DOI] [PubMed] [Google Scholar]
- 27. Landry CH, Allan KS, Connelly KA, Cunningham K, Morrison LJ, Dorian P. Sudden cardiac arrest during participation in competitive sports. N Engl J Med. 2017;377:1943–1953. 10.1056/NEJMoa1615710 [DOI] [PMC free article] [PubMed] [Google Scholar]
- 28. Jayaraman R, Reinier K, Nair S, Aro AL, Uy‐Evanado A, Rusinaru C, Stecker EC, Gunson K, Jui J, Chugh SS. Risk factors of sudden cardiac death in the young: multiple‐year community‐wide assessment. Circulation. 2018;137:1561–1570. 10.1161/CIRCULATIONAHA.117.031262 [DOI] [PMC free article] [PubMed] [Google Scholar]
- 29. Ohrn AM, Nielsen CS, Schirmer H, Stubhaug A, Wilsgaard T, Lindekleiv H. Pain tolerance in persons with recognized and unrecognized myocardial infarction: a population‐based, cross‐sectional study. J Am Heart Assoc. 2016;5:e003846. 10.1161/JAHA.116.003846 [DOI] [PMC free article] [PubMed] [Google Scholar]
- 30. Lucia PV, Anna LL, Catherine K, Tiziano M, Francesco FF. Role of Q‐waves ECG in myocardial scar assessment in patients with prior myocardial infarction. Med Clin Rev. 2019;5:1–6. [Google Scholar]
- 31. Schelbert EB, Cao JJ, Sigurdsson S, Aspelund T, Kellman P, Aletras AH, Dyke CK, Thorgeirsson G, Eiriksdottir G, Launer LJ, et al. Prevalence and prognosis of unrecognized myocardial infarction determined by cardiac magnetic resonance in older adults. JAMA. 2012;308:890–896. 10.1001/2012.jama.11089 [DOI] [PMC free article] [PubMed] [Google Scholar]
- 32. Finocchiaro G, Sheikh N, Biagini E, Papadakis M, Maurizi N, Sinagra G, Pelliccia A, Rapezzi C, Sharma S, Olivotto I. The electrocardiogram in the diagnosis and management of patients with hypertrophic cardiomyopathy. Heart Rhythm. 2020;17:142–151. 10.1016/j.hrthm.2019.07.019 [DOI] [PubMed] [Google Scholar]