

Abstract
Network Medicine applies network science approaches to investigate disease pathogenesis. Many different analytical methods have been used to infer relevant molecular networks, including protein-protein interaction networks, correlation-based networks, gene regulatory networks, and Bayesian networks. Network Medicine applies these integrated approaches to Omics Big Data (including genetics, epigenetics, transcriptomics, metabolomics, and proteomics) using computational biology tools and, thereby, has the potential to provide improvements in the diagnosis, prognosis, and treatment of complex diseases. We discuss briefly the types of molecular data that are used in molecular network analyses, survey the analytical methods for inferring molecular networks, and review efforts to validate and visualize molecular networks. Successful applications of molecular network analysis have been reported in pulmonary arterial hypertension, coronary heart disease, diabetes mellitus, chronic lung diseases, and drug development. Important knowledge gaps in Network Medicine include incompleteness of the molecular interactome, challenges in identifying key genes within genetic association regions, and limited applications to human diseases.
Keywords: Network Medicine, Big Data, Molecular Networks
1. Introduction
Networks are widely used to represent relationships between entities in complex data sets. A network can represent physical connections, such as the internet, or it can be used to represent dependencies between different elements, such as a diagnostic decision tree in clinical care. Network approaches have been applied to a variety of complex systems, including social connections, ecological systems, and disease transmission. Network science provides approaches that can be particularly valuable in the analysis of molecular data, which will be the focus on this review. Based on graph theory, networks provide a useful structure to visualize and analyze relationships--both linear and nonlinear--among variables of interest.
Graphically, we represent networks as collections of nodes (often circles) and edges (lines connecting the nodes), which indicate a relationship between the nodes (Figure 1a). In addition to visualizing relationships between nodes, properties of the network such as the number of connections a node possesses, or the number of paths passing through a node, can provide important information about overall network structure and the stability of the network to perturbations. The multiple interactions encoded within networks can lead to network responses to perturbation that cannot be predicted from studying isolated nodes or pairs of nodes; these complex responses are referred to as emergent properties.
Figure 1:
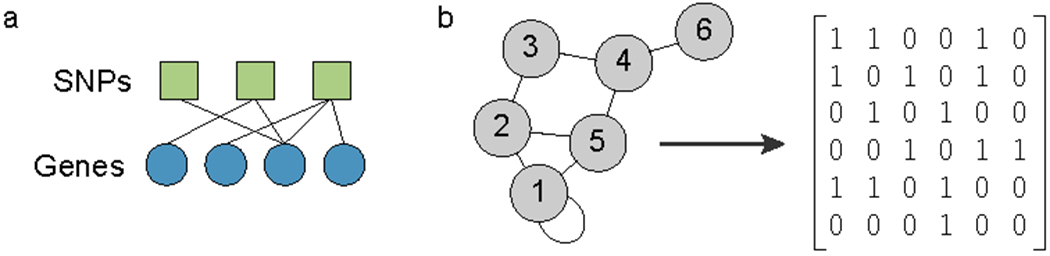
(a) A bipartite graph, in this case showing eQTL associations. (b) A unipartite graph and its corresponding adjacency matrix.
A network graph with only one type of node is denoted a “unipartite graph.” An example of a unipartite molecular graph is a co-expression network in which two genes are linked if their expression levels are highly correlated. The edges in such a graph have “edge weights” which represent the strength of the “interaction;” in this example, the correlation coefficient. If we have two types of nodes (say, squares and circles) and connections only between one type and the other, we can represent those connections using a “bipartite graph.” An example would be a gene regulatory network in which we link transcription factors to the genes that they regulate. In expression quantitative trait locus (eQTL) networks (in which one type of node represents a single nucleotide polymorphism (SNP) and another type of node represents the expression level of a gene), the network does not represent physical interactions but rather statistical associations between the SNP dose and gene expression level.
For both unipartite and bipartite graphs, the edges are key components. Because the edges are so important, we often represent a network as a collection of edges, which can be summarized using an “adjacency matrix;” a matrix that depicts connections between the nodes in a graph (Figure 1b). The advantage of using such a representation is that it facilitates mathematical analysis of the network and its properties.
When network science approaches are applied to the analysis of disease, the term “Network Medicine” has been used (Barabasi, 2007; Barabasi, Gulbahce, & Loscalzo, 2011; Loscalzo, Barabasi, & Silverman, 2017). In many applications, Network Medicine seeks to use cellular molecular pathways to explore the etiologies of human diseases. However, since many molecular pathways remain poorly defined, Network Medicine relies on inference or interaction networks between elements within human cells, and then uses the resulting networks to explore drivers of disease.
A variety of different methods has been used to infer relevant cellular molecular networks. Protein-protein interaction networks, often referred to as the interactome (Vidal, Cusick, & Barabasi, 2011), have been used to identify interconnected subsets of interacting proteins related to specific diseases, known as disease network modules. Methods such as weighted gene coexpression network analysis (Langfelder & Horvath, 2008) use pairwise correlation in gene expression levels to identify modules of similarly expressed genes in distinct phenotypic states. Still other methods integrate multiple different data types to infer regulatory interactions between transcription factors and their targets (Glass, Huttenhower, Quackenbush, & Yuan, 2013; Sonawane et al., 2017). These modeling approaches based on Big Data can be thought of as “top-down” efforts to identify genes of interest agnostically in disease-related networks. However, “bottom-up” approaches to build disease networks by identifying the biological relationships and network connections for well-established susceptibility genes can also be used to create disease-related molecular networks.
Network Medicine applies these integrated approaches to state-of-the-art Omics data and computational biology tools and, thereby, has the potential to provide improvements in the diagnosis, prognosis, and treatment of complex diseases. We anticipate that improvements in disease diagnosis will have the most immediate impact on clinical medicine. However, substantial advancements in the analysis, interpretation, and validation of Network Medicine approaches will be required to turn this potential to transform medical care into reality.
In this review, we discuss the types of molecular data that are used in molecular network analyses, survey the analytical methods for inferring molecular networks, and review efforts to validate molecular networks. We will review several successful applications of molecular network analysis. Finally, we will consider knowledge gaps and future directions for this developing field.
2. Data Collection for Molecular Networks
Although computational biologists often do not have extensive training in molecular and cell biology, understanding the impact of sample collection and storage protocols on the Omics data utilized for building molecular networks is essential. Different Omics data types are differentially affected by sample source, sample collection, subject characteristics, and sample storage. Obtaining DNA for assessments of genetic variation is robust to most of these variables, but other Omics data types (e.g., transcriptomics, metabolomics, proteomics, and epigenetics) can be profoundly altered. The most readily available sample source is peripheral blood; however, the relevance of blood Omics data for diseases based in other organ systems is variable. Whole tissue samples (e.g., lung, heart) can provide greater disease relevance, but the cellular alterations related to disease pathology need to be considered. Individual cell types provide more specific Omics data but are more difficult to obtain. Subject characteristics of relevance for Omics data include whether the sample donors were acutely ill or in a stable state. For example, mechanical ventilation of many GTEx donors had a substantial impact on lung gene expression (McCall, Illei, & Halushka, 2016). For metabolomics, obtaining blood samples in the fasting state is preferred, although many metabolites can be assessed in non-fasting samples (Townsend et al., 2013). Key issues related to sample processing include the time from sample collection to freezer storage. Anticoagulant selection affects proteomic studies in blood samples (Lan et al., 2018), while collecting samples in DMSO can alter DNA methylation. Increasing numbers of freeze-thaw cycles are problematic for many Omics data types. The temperature of freezer storage (the colder, the better) can also influence sample quality and Omics results.
Generating Omics data from appropriate biospecimens has become commoditized for genetic variation assessment, using either SNP genotyping panels or DNA sequencing (whole exome or whole genome). Metabolomics assessments can be performed with targeted panels; untargeted assays can also be performed, but identification of those analytes can be quite challenging (Gika, Virgiliou, Theodoridis, Plumb, & Wilson, 2019). Epigenomic data are obtained using profiling techniques analyzing both DNA methylation and histone modifications. DNA methylation marks can be measured with pre-defined panels or based on DNA sequencing before and after bisulfite conversion of methylated cytosines. Chromatin accessibility and histone modifications can be assessed with a plethora of different Omics-driven approaches such as Nome-Seq, ATAC-Seq and ChIP-Seq, which map nucleosomes and non-histone proteins and detect DNA-associated proteins and histone modifications at the genome-wide level. Transcriptomics has largely moved from microarray analysis to RNA-Seq. Proteomics can be performed with pre-defined panels of analytes (e.g., Olink, SomaLogic) or with shotgun mass spectrometry. Each of these platforms has specific challenges that require domain expertise for appropriate interpretation. For example, DNA methylation panels are affected by SNPs located under assay probes (W. Zhou, Laird, & Shen, 2017), and analytes in protein panels like SomaLogic can be affected by non-specific binding (Joshi & Mayr, 2018).
3. Data Cleaning and Normalization for Molecular Networks
The many challenges and sources of variability related to Omics data collection directly impact data analysis and interpretation of molecular networks built from those data sets. Even when every effort is made during data collection and generation, data will be affected by technical noise that can substantially (or even critically) impact the identification of biological signals.
Some of the most important sources of technical noise are batch effects, which introduce systematic technical variability in the data (W. W. B. Goh, Wang, & Wong, 2017). Batch effects can result in both the absence of significant results when genuine biological differences exist (false negatives) and the presence of false positive results that solely stem from technical variation. Well-known batch effects include day of sample processing and/or data generation, reagent batches, and operators. The worst-case batch effects are confounding effects, i.e., when the batch effect is completely confounded with the biological factor of interest. Examples of confounding batch effects are when all control and disease subject samples are processed on two different days or by two different operators, or when all male and female samples are processed separately in their respective batches. While it is possible to identify and correct for non-confounding batch effects in data or explicitly to account for this source of variability in statistical tests as explicit covariates, they are best handled by careful experimental design using blocking, i.e., assigning samples to different experimental batches in a balanced way. Exploratory data analysis and visualization approaches (such as hierachical clustering or principal component analysis) can be effective to identify batch effects. In the absence of apparent visual clues, known genes that are susceptible to batch effects can also be used (Leek et al., 2010). Correction of batch effects can be effective in well-balanced study designs (i.e., when biological groups are evenly represented across batches) by using standard normalization (see below) followed by batch correction such as the popular ComBat method (Johnson et al., 2007), that relies on Bayesian inference to estimate the batch effects. Surrogate variable analysis (SVA) (Leek & Storey, 2007) uses factors defining the expected biological classes to estimate and correct for sources of variation that are not associated with the biological factor. Removed unwanted variation (RUV) (Gagnon-Bartsch & Speed, 2012) relies on invariant features, i.e., features expected to remain unaffected by the biological factor of interest, to estimate and correct for unwanted batch effects. The application of batch correction methods does, of course, not guarantee that the undesired variation will be addressed. It is essential to check the corrected data and results to verify that these are not still influenced by the batch effects. Batch effects are particularly difficult to account for in clinical studies when the size of the cohort increases and collections span over a long duration, and when the phenotypes of the incoming patients are random (thus impeaching any design planning until the very end of the collection, leading to long and varying times from sample collection to processing). In addition to batch correction, it is essential to ensure comparability across samples by removing as much of the technical, unwanted variability and leaving relevant, biological variability untouched, a procedure called normalization. At times, simple methods such as centering (shifting each sample distribution towards a common value) and scaling (normalizing the range of the measurements across samples), can suffice. Generally, especially when handling Omics data, techniques that consider all data together and more profoundly affect the data need to be considered (for example quantile (Hicks et al., 2018) and variance stabilization normalizations (Anders & Huber, 2010; Huber, von Heydebreck, Sueltmann, Poustka, & Vingron, 2003)). In Figure 2, we show in a tractable example how the lack of data normalization (for instance, centering and scaling) can substantially alter the resulting network. We analyzed the expression profiles of five genes (two of which, genes 3 and 4, are co-expressed, panel a) across four samples using co-expression networks. The example demonstrates that using absolute gene expression values (heatmap b and network c) misleadingly groups genes 3 and 5, and how centering and scaling the gene expression data (heatmap d and network e) can recover the anticipated clustering of genes 3 and 4. These results are comparable to the positive control that uses correlation values between genes to construct heatmap f and network g.
Figure 2: The effect of centering and scaling on a simple and tractable network of five genes:
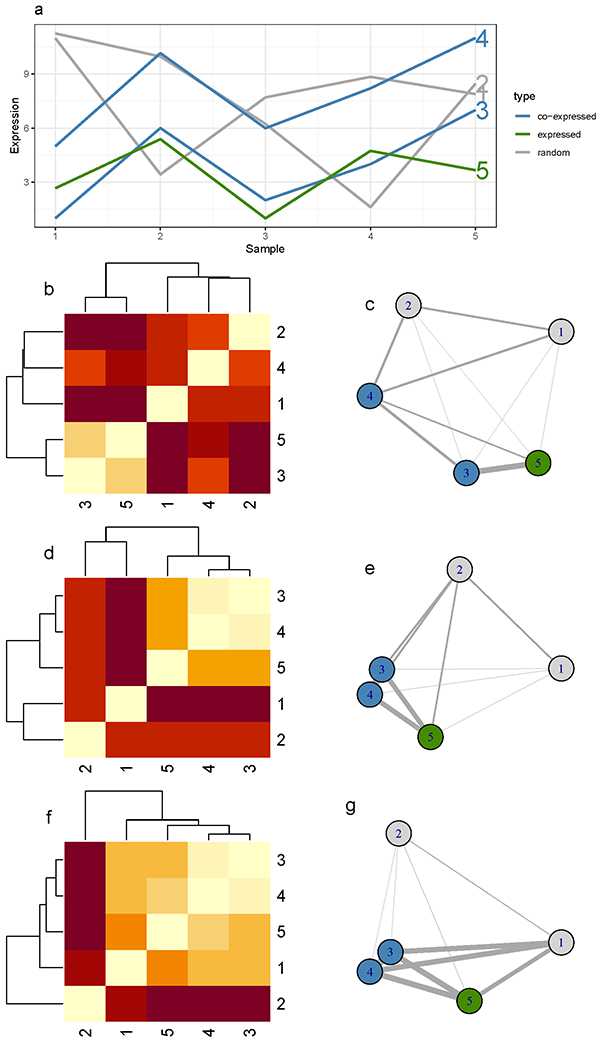
(a) genes 1 and 2 are random (in gray), genes 3 and 4 are co-expressed (in blue), and gene 5 (in green) has an expression close, in absolute expression intensity, to gene 3. The width of the graph edges and the layout of the graphs (c, e, f) (i.e., proximity of the nodes) are proportional to the similarity of the nodes/genes. Heatmap (b) and graph (c) represent the Euclidean distances and the resulting network, respectively, illustrating the similarity of genes 3 and 5 when the distances of absolute expression values are used. After centering and scaling of the expression values, we see how the co-expressed genes become closely connected (d, e). At the bottom (f, g), we represent the result of calculating gene expression correlation as a positive control, demonstrating the desired effect directly on the absolute expression values. The nodes of genes 3 and 4 nearly fully overlap.
Depending on the Omics technology at hand, a substantial proportion of data points can be missing. Missing data can be a particularly acute issue for mass spectrometry-based proteomics and metabolomics assays, where both the high number and the different types of missingness (technical/random and biological/non-random) can dramatically influence how to process the data and the outcomes of an analysis (Lazar, Gatto, Ferro, Bruley, & Burger, 2016). Missing data can be ignored or statistical imputation approaches can be used to estimate them, but both approaches can lead to biased analytical results.
In every step of a data analysis procedure, it is advisable to identify outliers (Bittremieux, Meysman, Martens, Valkenborg, & Laukens, 2016; Kauffmann & Huber, 2010; Norton, Vaquero-Garcia, Lahens, Grant, & Barash, 2018; Stanfill et al., 2018), including samples or features with an abnormal number of missing values, samples that display substantially different distributions in their quantitative features, or samples that do not cluster with the rest of their group. Such cases need to be handled carefully; if the outlying nature of a sample cannot be corrected (through appropriate missing data imputation and data normalization, or after correction of mis-annotated samples), the offending sample might be better removed completely for the subsequent data analysis.
Finally, it is important to highlight that the above steps also hold true when reusing publicly available data (when performing a meta-analysis combining several data sets, for example) or other resources providing large-scale genomic information (for example, accessing protein-protein interaction from the STRING database (Szklarczyk et al., 2015)). The question that one needs to answer when cleaning and pre-processing Omics data, is whether the data as they stand (raw or possibly heavily processed) are adequate to address the specific scientific question at hand.
4. Analytical Approaches for Molecular Networks
Many different analytical approaches have been developed for molecular networks. Rather than providing an exhaustive list of such methods, we focus on describing several major classes of molecular network models, including protein-protein interaction networks, gene regulatory networks, correlation networks, Bayesian networks, RNA-RNA networks, and epigenomic networks, emphasizing the strengths and limitations of available analytical approaches.
4.1. Protein-Protein Interaction Networks
Specific physical contacts of two or more proteins as a result of biochemical processes are called protein-protein interactions (PPIs). They are steered by non-covalent forces and often occur in a cell-type-specific, condition-specific, and organism-specific manner. Manifold wet laboratory technologies exist for their identification, such as affinity purification, Y2H (yeast 2 hybrid), or TAP (tandem affinity purification) (Rao, Srinivas, Sujini, & Kumar, 2014). Through PPIs, differential protein complex formation and signal flow through the network can be studied in response to changing internal and external conditions or stimuli. PPI networks are often referred to as the “interactome,” and huge databases have emerged over the last decade of systems biology that store and annotate them for subsequent interrogation using computational tools. Two examples: 1) The Integrated Interactions Database (IID) stores over 4.8 million PPIs annotated for tissue-specificity, subcellular localization, disease associations, and druggability (Kotlyar, Pastrello, Malik, & Jurisica, 2019); and 2) The STRING database stores over 2 billion PPIs for 5,090 organisms and 24.6 million proteins (Szklarczyk et al., 2015). The STRING database also includes predicted interactions based, for example, on homology or text mining, and functional associations in addition to physical ones. PPI networks can be modelled as matrices or as undirected graphs where vertices correspond to proteins and edges to (physical or functional) interactions which can be weighted (usually with confidence scores or p-values). Many approaches for clustering and cross-species or cross-condition comparisons of such networks have been developed (cf.(Bader & Hogue, 2003; Malek, Ibragimov, Albrecht, & Baumbach, 2016)). Invaluable in a systems and Network Medicine context have proven so-called network enrichment methods, which usually aim at co-clustering an expression data set gathered for a set of patients suffering from a certain disease compared to a control group having a differential clinical outcome. Here, the aim is to identify subnetworks enriched with genes or proteins that are significantly altered in their behavior (e.g., differentially expressed, methylated, or mutated). Such subnetworks are candidate disease mechanisms and may be used as mechanistic markers for endophenotyping (Zanin et al., 2019). Many such network enrichment tools have been developed over the last decade and are now applied to the identification of disease mechanisms. Examples include DEGAS (Ulitsky, Krishnamurthy, Karp, & Shamir, 2010), KeyPathwayMiner (List et al., 2016), HOTNET (Vandin, Clay, Upfal, & Raphael, 2012), or GrandForest (see Figures 3 and 4). All such network module detection approaches come with different advantages and disadvantages that depend on biomedical assumptions regarding the underlying disease mechanisms and the available Omics data types (Batra et al., 2017; Nikolayeva, Guitart Pla, & Schwikowski, 2018). Currently, available PPI networks are usually studied in the context of gene expression or genetic variation data. Few approaches exist for the analysis of alternative splicing in the context of PPIs (Emig et al., 2010), as this would require structural knowledge about the PPIs to identify spliced exons and corresponding protein domain variations. Such information is, however, only available for comparably small numbers (<10,000) of PPIs, e.g., in Instruct (Meyer, Das, Wang, & Yu, 2013). Static PPI networks often do not allow for inferring causality, as they are undirected and have no annotation regarding activation or repression; this is in contrast to dynamic responses of PPIs to perturbation or to gene regulatory networks, which can be interrogated regarding their power to explain the emergence of different phenotypes on an expression level (S. J. Larsen, Rottger, Schmidt, & Baumbach, 2019).
Figure 3. The main principle of PPI network enrichment for mechanistic biomarker extraction,
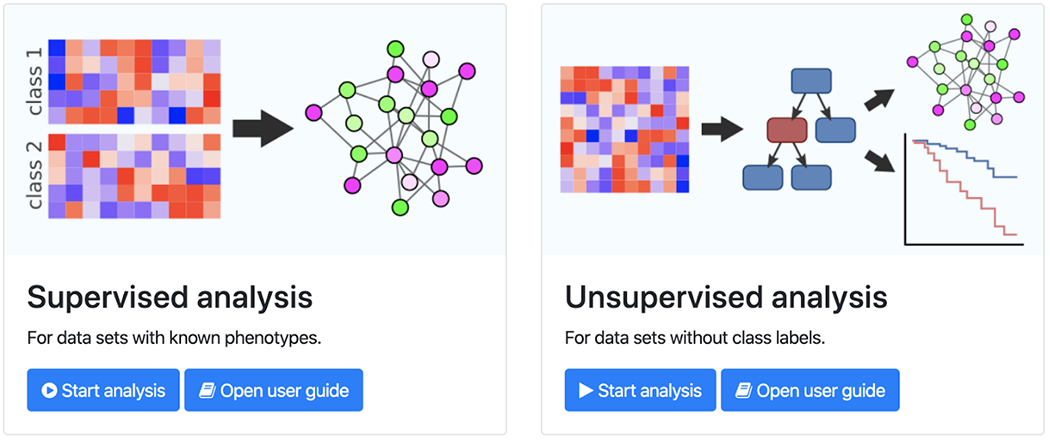
supervised (left) and de novo/unsupervised (right). In a supervised setting one is interested in finding a set of proteins/genes that explain the difference between two or more classes (e.g. disease subtypes) by the alteration of a set of genes or proteins that form a subnetwork of the interactome. The labels do not necessarily need to be discrete but can be continuous observations or outcomes such as disease progression, growth responses, growth rate, treatment effects, or survival. In an unsupervised setting, no labels are given but the existence of subtypes (called endophenotypes) is assumed, which is characterized by given Omics data. This image is a screenshot from the GrandForest webtool (S.J. Larsen, Schmidt, & Baumbach, 2020), which identifies disease classes and sub-types (de novo) while, conjointly, explaining this stratification with differential sub-network expression. The sub-networks then are enriched with mechanistic candidate biomarkers.
Figure 4. The principle of the GrandForest webtool network enrichment approach.
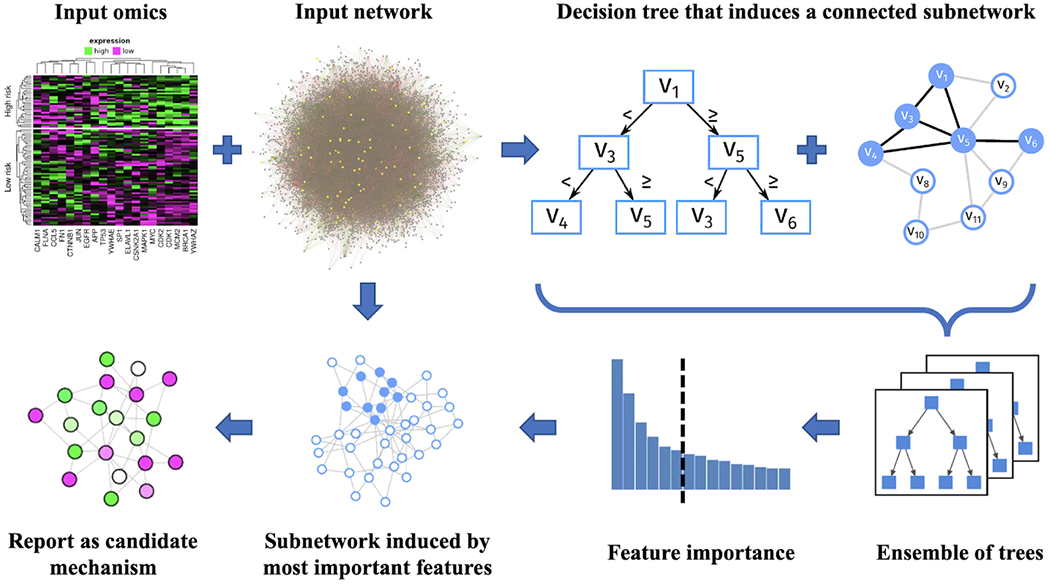
Given a (labeled) Omics data set (e.g., gene expression) and a PPI network, the tool learns decision trees just like in a classical Random Forest but restricts the decision tree growing to only pick proteins that are adjacent (in the network) to at least one previously picked feature protein. This way, all decision trees in the forest model by-design represent subnetworks of the interactome. They can be sorted by feature importance (e.g., using Gini index). The top m genes (user parameter) are located in the input network and the induced subnetwork is reported and visualized as a candidate mechanism driving the phenotype of interest. Importantly, GrandForest can identify subnetworks where many genes are not significant individually but become significant only as a mechanistic marker ensemble (S.J. Larsen et al., 2020).
Based on the hypothesis that proteins relevant for a particular disease will be localized (rather than randomly scattered) throughout the molecular interactome, multiple approaches have been developed to identify disease network modules within the PPI network (L. Y. Lee & Loscalzo, 2019). Seed genes can be selected based on genome-wide association studies (GWAS) or other reductionist experimental evidence to guide disease module identification using random walk or other approaches to interrogate the interactome (Erten, Bebek, Ewing, & Koyuturk, 2011; Navlakha & Kingsford, 2010). Alternatively, all of the genetic association evidence in a GWAS can be used to prioritize disease network modules (Ghiassian, Menche, & Barabasi, 2015; Jia, Zheng, Long, Zheng, & Zhao, 2011; Petti, Bizzarri, Verrienti, Falcone, & Farina, 2019).
4.2. Gene Regulatory Networks
Gene regulation involves the complex interplay of multiple biological molecules. The transcriptional process starts with the coordinated activity of multiple regulatory proteins, known as transcription factors (TFs), which bind to specific control regions in the DNA and then work together to recruit RNA polymerase (RNAP) (Lambert et al., 2018). After recruitment, RNAP transcribes a gene, producing mRNA, which is then translated into protein. Additional factors, such as microRNAs and other epigenetic modifiers, are also involved in this process and can influence the amount of mRNA transcribed and the amount of protein translated (T. I. Lee & Young, 2013). Gene regulatory networks model transcriptional processes by connecting regulators (such as TFs) to the genes encoding the downstream products of transcription and/or translation (mRNA and/or proteins, respectively) (Sonawane et al., 2017). Importantly, a subset of the target genes in these networks encode TFs, creating a complex set of interactions that can be studied to understand the processes that control how a cell responds to environmental factors and to determine how the mechanisms controlling gene transcription are altered in the context of disease (Baumbach, Tauch, & Rahmann, 2009; Baumbach, Wittkop, Kleindt, & Tauch, 2009).
Much of the early work in modelling regulatory networks leveraged gene expression data to draw connections between TFs and genes based on linear (de la Fuente, Bing, Hoeschele, & Mendes, 2004) or non-linear (Faith et al., 2007; Margolin et al., 2006) correlations in their expression profiles (De Smet & Marchal, 2010; Marbach et al., 2012). However, it soon became clear that gene regulatory networks estimated solely from gene expression data could not distinguish between direct and indirect regulatory events (Marbach et al., 2010), at least partially due to the fact that gene co-regulation (i.e., a pair of genes regulated by the same TF) often has similar or stronger expression correlation than direct regulation of a gene by a TF (Ku, Duggal, Li, Girvan, & Ott, 2012). This observation led to the development of network reconstruction algorithms that incorporate multiple sources of data (Chang et al., 2008; Conlon, Liu, Lieb, & Liu, 2003; Hecker, Lambeck, Toepfer, van Someren, & Guthke, 2009). For example, interactions between TFs and genes can be derived by scanning the control regions of genes for sequence patterns that correspond to potential TF binding sites. In isolation, these interactions lack biological context, generally contain many false-positives (spurious network edges), and are limited by the availability of information regarding the binding preferences of TFs. These estimates can be combined with epigenetic data assessing chromatin state in order to create context-specific networks (Beyer et al., 2006; Gerstein et al., 2012; Neph et al., 2012; Pique-Regi et al., 2011); however, the resulting models often suffer from a high number of false-negatives (missing network edges). One significant appeal of these approaches is their potential to incorporate distal information into gene regulatory networks, although currently the effective and accurate association of enhancers with genes remains an outstanding problem in the field of computational biology.
Statistical approaches have also been applied to model gene regulatory networks. These approaches fall into two main classes: (1) regression-based approaches, which estimate regulatory interactions by modeling each gene’s expression level as a linear combination of the expression levels of its potential TF regulators (Haury, Mordelet, Vera-Licona, & Vert, 2012); and (2) classification-based approaches, which add and remove regulatory interactions by comparing each gene’s expression profile to the expression profiles of other genes that are, or are not, targeted by a particular TF (Ernst et al., 2008; Mordelet & Vert, 2008). These statistical approaches, although powerful, essentially solve a series of independent problems, presenting challenges for assimilating their results into a single, coherent gene regulatory network. One method that overcomes this limitation is PANDA (Passing Attributes between Networks for Data Assimilation) (Glass et al., 2013), which uses a message-passing approach (Frey & Dueck, 2007) to integrate information regarding TF complexes, TF targeting of genes, and gene co-regulation. PANDA works by performing a series of network projections to optimize shared structures across these input data and to uncover TF and gene targeting patterns. PANDA has been successfully applied in multiple different disease contexts, including ovarian cancer (Glass, Quackenbush, Spentzos, Haibe-Kains, & Yuan, 2015), colorectal cancer (Lopes-Ramos et al., 2018), diet-induced weight-loss (Vargas, Quackenbush, & Glass, 2016), chronic obstructive pulmonary disease (COPD) (Glass et al., 2014; Lao et al., 2015), and asthma (Qiu et al., 2018), as well as to study gene regulatory networks in multiple human tissues (Sonawane et al., 2017) and cell lines (Lopes-Ramos et al., 2017).
Gene regulatory networks that are inferred from data are often directed, with edges that extend from a regulator – such as a transcription factor – to a target gene, as well as weighted, with scores reflecting the overall evidence for a regulatory relationship. These two features make regulatory networks excellent models of biological processes, which are, by definition, directed and also may have varying levels of importance depending on biological context (Sonawane et al., 2017). In principle, gene regulatory networks should also be signed in order to convey information regarding transcriptional activation or inhibition. Although these types of relationships have been carefully curated at a genome-wide level for some smaller organisms, such as E. coli (Gama-Castro et al., 2016), they cannot be easily measured using high throughput methods. Thus, due to the scale and complexity of higher order mammalian systems, signs are generally only considered when investigating well-studied subsets of human gene regulatory relationships, such as those reported in pathway databases (Kanehisa, Furumichi, Tanabe, Sato, & Morishima, 2017).
4.3. Correlation Networks
Correlation-based networks and their graph theory-based properties have been successfully used to summarize and understand large data sets generated in biological and medical studies (Batushansky, Toubiana, & Fait, 2016; D. Yu, Kim, Xiao, & Hwang, 2013). Correlation networks are based on the calculation of pairwise correlation coefficients between the data associated with a pair of nodes (usually Pearson or Spearman coefficients, Kendall’s tau, or Mutual Information). Since these correlation values are generally non-zero (i.e., the network is complete), it is necessary to impose a hard or soft threshold on the correlation coefficient values in order to remove spurious relationships and, thus, focus on significant associations between highly correlated nodes(Schwarz & McGonigle, 2011; Zhan et al., 2017). Hard-thresholding approaches create binary networks where sub-threshold inter-node correlations are suppressed (edge values set to 0), and supra-threshold correlations are compressed (edge values set to 1). Alternatively, soft-thresholding approaches replace thresholding with a continuous mapping of correlation values into edge weights, which has the effect of suppressing rather than removing weaker network connections. Pearson correlation is the most widely used statistic to measure the degree of the linear relationship between two normally distributed variables. Alternatives include Spearman and Kendall’s tau correlations, which do not require any assumptions about the distribution of the data and measure the statistical association between two variables based on their ranks. These three measurements can take values ranging from −1 to 1. Finally, mutual information is a generalized correlation measure used to assess the non-linear dependence between two random variables. It is always larger than or equal to zero: the larger the value, the greater the relationship between the two variables. Mutual information is zero when the two variables are independent.
Correlation networks are frequently used to analyze gene expression data (referred to as gene co-expression networks) and to gather biologically relevant information from genes with similar co-expression patterns (Fiscon, Conte, Farina, & Paci, 2018). Gene co-expression networks are fertile fields for mining information about key genes and fundamental drivers of gene expression in a cellular system. Currently, two of the most promising algorithms for gene co-expression networks are SWIM (SWItch Miner) (Paci et al., 2017) and WGCNA (Weighted Gene Correlation Network Analysis) (Langfelder & Horvath, 2008; B. Zhang & Horvath, 2005). SWIM builds an unweighted correlation network (hard-thresholding) and exploits local and global graph properties to mine genes, called switch genes, which suggest association with drastic changes in cellular phenotype, such as in cancer development. WGCNA builds a correlation network that can be weighted (soft-thresholding) or unweighted (hard-thresholding) and identifies relevant genes by measuring the centrality of a gene within the network. WGCNA also permits incorporation of external sample information (like physiological, metabolic, and clinical traits) in order to screen for modules and intramodular hubs that relate to a sample trait, thus suggesting possible key roles of a specific network module in the phenotypic characterization. However, WGCNA considers only the right tail (i.e., positive correlation between gene pairs) of the correlation distribution.
To date, the left tail (i.e., negative correlation between gene pairs) of the correlation distribution, and the interpretation of negative edges within a complex network representation of functional connectivity, has largely been ignored, apart from the SWIM methodology. Indeed, it is known that the human genome is pervasively transcribed (E. P. Consortium et al., 2007), yet at any given spatial/temporal state a cell generally uses only a fraction of its gene functions. This observation suggests a crucial role of negative regulation to save cells from activation of specific pathways and cell functions in response to specific external stimuli or physiological and/or pathological changes. As an example, microRNAs are now universally recognized as key negative regulators in many intracellular processes as well as in cancer development and progression (Calin & Croce, 2006; X. Zhou, Xu, Wang, Lin, & Chen, 2015). The strength of SWIM is to emphasize the importance of negative regulation by explicitly considering also the left tail of the correlation distribution.
Correlation networks have also been successfully used to study complex diseases, comorbidity, and disease progression. Complex diseases (e.g., diabetes, stroke, cancer, etc.) are often considered as syndromes composed of overlapping individual diseases or phenotypes that manifest a similar pathological or physiological outcome. To understand how diseases are connected, the first Phenotypic Disease Network (PDN) was introduced as a map summarizing phenotypic connections (comorbidity correlations obtained from the disease history of more than 30 million patients) between diseases (nodes) (Hidalgo, Blumm, Barabasi, & Christakis, 2009). The authors showed that diseases progress preferentially along the links of this map; in particular, this progression is different for patients of different genders and ethnicities, and patients affected by diseases that are connected to many other diseases in the PDN tend to die sooner than those affected by less connected diseases. Later, a phenomenological comorbidity network based on medical claims data of the entire population of Austria was proposed (Chmiel, Klimek, & Thurner, 2014). This network was constructed from a two-layer multiplex network of two statistical measures quantifying relations between diseases. In contrast to the PDN proposed by Hidalgo et al. (Hidalgo et al., 2009), this network was based on a combination of measures (i.e., conditional probabilities for a comorbidity and respective contingency coefficients) that have been corrected for biases that result from the comparison of very rare and frequent diseases. The authors showed that the disease network undergoes dramatic structural changes across the lifetime and that patients predominantly develop diseases that are in close network proximity to disorders that they already suffer. A different approach was developed to investigate multiple disease-related phenotypes within one complex disease; Chu and colleagues developed a method for constructing networks of phenotypic variables (nodes) based on partial correlations between quantitative, disease-related phenotypes (edges) (Chu et al., 2014). Specifically, using COPD as an example, these investigators described the application of network inference methods to explore the relationships between disease-related phenotypes, and they showed that the proposed approach allows detection of novel relationships that would not have been observed in a single variable analysis. A further example of a complex disease studied with correlation network analysis is provided by Nishihara and colleagues, where the authors investigated the carcinogenic process in colorectal carcinoma (Nishihara et al., 2017). They proposed to model the complex process that encompasses a multitude of molecular events (e.g., somatic mutations, epigenetic alterations, and aberrant protein expression) with a biomarker correlation network wherein a node represents a tumor tissue biomarker (e.g., somatic mutation, methylation level, immune reaction, or protein expression) and an edge between two nodes occurs if the associated biomarkers exhibit a statistically significant Spearman correlation. Such a network analysis integrates multidimensional tumor biomarker data and allows identification of key molecular events and pathways that are central to an underlying biological process.
A limitation of gene co-expression correlation-based networks is that the effect of an expressed gene on a disease phenotype requires that its encoded protein binding and pathway partners be co-expressed (Kitsak et al., 2016). This requires knowledge of the PPI for optimal interpretation, as purely regulatory interactions may not be informative in this regard. Ideally, differentially expressed genes can be mapped to the PPI to create a ‘reticulotype’ for a disease module of interest that is specific to an individual or a limited number of individuals with that disease phenotype. Such an approach moves the field ever closer to personalized precision medicine (L. Y. Lee & Loscalzo, 2019).
4.4. Bayesian Networks
Bayesian networks are powerful models whose structure is determined directly from data that measure the values of variables across a series of samples, conditions, or states. More formally, Bayesian networks are directed acyclic graphs whose nodes are random probabilistic variables with values that describe variation across a set of states. The edges in a Bayesian network model the dependencies between variables, with the conditional probability distributions of each variable encoded by the network structure. In particular, the values taken by a node in a Bayesian network are modeled as a distribution that is conditioned on that node’s parents, but independent of its non-descendants given its parents. Thus, the edges in these models ultimately can represent the influence of a number of both detected and undetected factors, providing an appealing framework with which to characterize relationships between variables despite imperfect knowledge and incomplete data, features commonly encountered in real-world Network Medicine applications.
Two main classes of methods are used to reconstruct the structure of Bayesian networks: constraint-based approaches (Natori, Uto, Nishiyama, Kawano, & Ueno, 2015) and score-based algorithms (Andrews, Ramsey, & Cooper, 2018). Whereas the former uses conditional independence tests to determine dependency structures in the data, the latter maximizes an objective function based on goodness-of-fit scores (Friedman, Linial, Nachman, & Pe’er, 2000; Vignes et al., 2011). Score-based methods seek to identify the best network structure by optimizing a scoring function, and thus are more computationally expensive compared to constraint-based approaches, which relax this criterion. Although this relaxation results in lower accuracy models, it also allows for learning larger networks. It is important to note that with prior knowledge regarding the topological ordering of the network and the use of entropy to assess conditional independence and goodness of fit, constraint-based and score-based approaches learn the same network structure (Cowell, 2001). There are also hybrid methods which combine aspects of both constraint-based and score-based approaches (Scutari, Graafland, & Gutierrez, 2019). Two important aspects to consider when modelling Bayesian networks include parameter estimation and structural learning. Parameter estimation involves learning the conditional probability distributions based on the data given a known network structure (Ji, Xia, & Meng, 2015). Structural learning involves learning both the network structure and the parameters by combining a statistical criterion with an algorithm that determines how to apply that criterion to the data (Scanagatta, Salmeron, & Stella, 2019).
Bayesian networks often capture subtle relationships, producing realistic models of the pathways that control disease development and progression. Bayesian network analysis has been applied in a number of biological contexts. An early application in yeast gene expression data generated a highly predictive model of cell cycle mechanics (Friedman et al., 2000), demonstrating the power of the approach. Due to the size and complexity of the data, applications using human gene expression data often require constraining the model search space based on a preliminary set of network topologies (Hartemink, Gifford, Jaakkola, & Young, 2002; Imoto et al., 2004; Le Phillip, Bahl, & Ungar, 2004). With these modifications, Bayesian networks have been used to study a variety of related problems, such as the reconstruction of gene regulatory networks from the scientific literature (Gevaert, Van Vooren, & De Moor, 2007) and gene expression data (Husmeier, 2003; Husmeier & Werhli, 2007). More recent work in Bayesian networks includes the development of tools that support integrative and multi-modal data analysis, such as bootstrapping to reduce reliance on outliers, and the implementation of multiple search and validation algorithms (McGeachie, Chang, & Weiss, 2014). These advances have led to the application of Bayesian networks to multiple different Omics data types, such as micro-RNA (McGeachie et al., 2017), metabolomics (Rogers et al., 2014), and microbiome data (McGeachie et al., 2016). An application of Bayesian networks to the integration of metabolomic, genomic, and methylation data implicated metabolic pathways in the pathophysiology of asthma control (McGeachie et al., 2015). Bayesian approaches have also been applied to model gene regulatory networks based on conditional mutual information (Aghdam, Ganjali, Zhang, & Eslahchi, 2015; X. Zhang, Zhao, Hao, Zhao, & Chen, 2015). Dynamic Bayesian networks have been utilized to create weighted directed networks, which can utilize longitudinal Omics data to create time-varying regulatory networks of activation or inhibition events (Z. Wang, Guo, & Gong, 2018).
Despite their appeal and many successful applications, Bayesian network models have several well-known limitations. First, Bayesian networks are computationally complex and thus best applied to efforts to understand relationships between a relatively small number of variables. Resolving the structure of a Bayesian network is a nondeterministic polynomial time (NP)–hard problem (Chickering, 1996). To overcome this limitation, prior information can be used to “seed” the network structure and limit the search space (Djebbari & Quackenbush, 2008). Secondly, Bayesian networks are structured as directed acyclic graphs. Thus, their application in modeling cellular processes, which often involve cyclic features such as feedback loops, requires modifications to the standard framework. Extensions to Bayesian networks that incorporate cyclic structures include factor graph approaches (Gat-Viks, Tanay, Raijman, & Shamir, 2006) and dynamic Bayesian networks (Husmeier, 2003; Kim, Imoto, & Miyano, 2003; J. Yu, Smith, Wang, Hartemink, & Jarvis, 2004; Zou & Conzen, 2005).
4.5. RNA-RNA Networks
RNA plays a central role in physiological functions of every living organism, as described by Walter Gilbert in 1986 (Berget, Moore, & Sharp, 1977; Chow, Gelinas, Broker, & Roberts, 1977; Gilbert, 1986; R. C. Lee, Feinbaum, & Ambros, 1993; Reinhart et al., 2000). Since then, high throughput genome-wide studies by the Encyclopedia of DNA Elements (ENCODE) and Functional Annotation of Mammals (FANTOM) projects have revealed that 98% of the human genome is pervasively transcribed and only 2% of the RNAs encode proteins (Lizio et al., 2019; Pazin, 2015). These results have triggered a plethora of studies on epigenetic functions of non-coding RNAs (ncRNAs) in human physiology and pathobiology in the last 20 years. The ncRNAs are classified, according to their length, into small RNAs (miRNAs, piRNA, siRNAs, snRNAs, snoRNAs, tRNAs) and long non-coding RNAs (lncRNAs); the latter includes circular RNAs as well. All of these RNAs are intricately interconnected in biological regulatory networks (Holoch & Moazed, 2015).
Ever-increasing evidence suggests that many genomic mutations reside in non-coding regions that perturb RNA-RNA interactions, leading to different diseases (Shah et al., 2018; Yuan & Weidhaas, 2019). Such interactions are epitomized by the competing endogenous RNA (ceRNA) hypothesis, in which lncRNAs function as they bind to miRNAs and consequently regulate the expression of messenger RNAs (mRNAs) (Anastasiadou, Jacob, & Slack, 2018; Salmena, Poliseno, Tay, Kats, & Pandolfi, 2011). Furthermore, ncRNAs interact not only with each other but also with proteins and DNA, which are interconnected in diverse regulatory networks. Therefore, a better understanding of RNA-RNA interactions is of fundamental importance in Network Medicine (Barabasi et al., 2011; L. Y. Lee & Loscalzo, 2019; Tay, Rinn, & Pandolfi, 2014).
Data-driven methodologies help to shed light on ncRNA network involvement in human disease (Ristevski & Chen, 2018). One of the most versatile data mining tools is the Gene Expression Omnibus database repository (GEO), containing high throughput gene expression data, and the BioPortal database repository, which provides biomedical ontologies (Clough & Barrett, 2016). One way to study an RNA-RNA network in a particular disease takes into account the pipeline to analyze mRNA, miRNA, and lncRNA datasets from the GEO. Indeed, a recent study analyzed differential expression of these RNAs in spinal cord injury (SCI) and normal samples (L. Wang, Wang, Liu, & Quan, 2019). The raw data analysis, performed either by using the Linear Models for Microarray Data (LIMMA) package or the Morpheus platform, was used respectively to identify statistically significant deregulated mRNAs and differentially expressed miRNAs and lncRNAs (Gentleman et al., 2004). Differential expression data were matched based on their complementarity to assess the predicted interactions between mRNA-lncRNA, mRNA-miRNA, and lncRNA-miRNA. After an accurate and unbiased analysis, the RNA interactions were placed in a network using Cytoscape software. From this analysis, a ceRNA network was unraveled, which included 93 mRNA, 9 miRNA and 13 lncRNA nodes with a total of 202 edges. Additionally, the FunRich software was used to analyze biological functions, molecular pathways, clinical phenotypes, transcription factors and protein domains related to all mRNA, miRNA, and lncRNA nodes. Based on the degree of a node, as indicated by the number of mRNA, miRNA, and lncRNA neighbors, the authors identified three of the 13 lncRNA nodes and their corresponding three sub-ceRNA networks as potential biomarkers and therapeutic targets for SCI. Such pipeline data analysis provides further insights into how lncRNAs interact with other RNA species to form a molecular network. A similar approach could be employed for identification of RNA-RNA interactions in other human diseases.
Among computational methods describing miRNA-sponge interactions (ceRNAs) through a network-based approach (Le, Zhang, Liu, & Li, 2017), the method proposed by Paci and colleagues has been ranked as most effective in identifying the number of ncRNA interactions associated with breast cancer (Paci, Colombo, & Farina, 2014). Specifically, based on a partial correlation model, the authors investigated the role of lncRNAs as miRNA sponges and built miRNA-mediated interaction (MMI) networks, where nodes represent ceRNAs (lncRNA or mRNA) and edges represent miRNAs that are mediating their interaction, in human breast invasive carcinoma (BRCA). The results revealed the lncRNA, PVT1 (Pvt1 Oncogene), as the first hub of the BRCA MMI-network. More than 80% of microRNAs sponged by PVT1 corresponds to the mir-200 family, whose importance in breast cancer is related to the epithelial-mesenchymal transition.
The above studies on RNA-RNA interactions demonstrate the importance of these networks for the identification of disease-driven RNA as potential diagnostic biomarkers and therapeutic targets. Notwithstanding the importance of an accurate and unbiased RNA-RNA network analysis in health and disease, the critical importance of experimental validation by cell-based approaches and animal models should not be underestimated.
4.6. Epigenomic Regulatory Networks
In the era of precision medicine, epigenomics has acquired a key role in revealing how epigenetic modifications can be utilized to identify diagnostic biomarkers and/or new therapeutic targets. Epigenomics analyzes overall epigenetic modifications within the genome of the cell.
Epigenetic regulation is the result of different modification pathways that affect DNA either directly (DNA methylation) or indirectly, through post-translational modifications of histone proteins, nucleosome positioning, and chromatin accessibility of regulatory regions to DNA binding proteins (Z. Chen, Li, Subramaniam, Shyy, & Chien, 2017). Accordingly, epigenetic modifications coordinately establish the transcriptional program of cells and, together with integration methods of genomic, transcriptomic, and proteomic data, are crucial to understand fully the regulatory mechanisms underlying complex diseases (Robinson & Pelizzola, 2015). The epigenome is highly dynamic.
Epigenomic patterns are tightly regulated by both genetic and environmental factors that ultimately establish different clinical phenotypes (Allis & Jenuwein, 2016). In recent years, a considerable amount of epigenetic data have been produced using several epigenetic analysis techniques aimed at finely characterizing both DNA methylation (Whole Genome Bisulfite Sequencing, MeDip, pyrosequencing, MSRE/MRE-Seq), chromatin accessibility and histone modifications (ChIP-Seq, Nome-Seq, ATAC-Seq), and chromosome conformation capture (3C, 4C, 5C, Hi-C). High-throughput sequencing technology has extended the body of epigenetic information at genome-wide scale. Major efforts are currently underway to establish data annotation protocols (for data standardization) and computational methods for epigenomic analysis by making use of databases and software tools for statistical analysis, data integration, and functional annotation.
Several data repositories and browsers are currently available thanks to the endeavors of Big Data consortia. ENCODE, the International Human Epigenome Consortium (IHEC), NIH Roadmap, Blueprint, and others have made available epigenetic profiling datasets as well as standardization of protocols and sample preparation for both healthy and disease states of different cell lineages and tissues (Bernstein et al., 2010; Bujold et al., 2016; B. consortium, 2016; Davis et al., 2018; Martens & Stunnenberg, 2013). In parallel, a remarkable number of epigenomic databases, tools, and data storage systems has allowed the storage and visualization of epigenomic datasets of different sample groups (Han & He, 2016). Among these, the Human Epigenome Browser(X. Zhou et al., 2011) and UCSC Genome Browser (Kent et al., 2002) provide resources and tools for epigenetic data mining and annotation.
In complex diseases, the epigenomic profile results from the interplay between genetic and environmental factors. Thus, integrating epigenomics data in different pathological contexts represents an important step towards effectively defining and treating multifactorial diseases. Epigenome-wide association studies (EWAS) identify epigenetic marks associated with a specific phenotype. Several web tools such as the Human EpiGenome Browser (X. Zhou et al., 2011) and coMET (Martin, Yet, Tsai, & Bell, 2015) are used to visualize different epigenetic profiles by phenotype. A more comprehensive view of the functional implications of EWAS associations can be exploited using gene ontology, pathway, and network analysis tools. Ingenuity Pathway Analysis (IPA©, QIAGEN) explores biological networks, functions, and associated diseases of EWAS associations (Kramer, Green, Pollard, & Tugendreich, 2014), while Locus Overlap Analysis (LOLA) provides genomic region enrichment analysis to interpret functional genomics and epigenomics data (Sheffield & Bock, 2016). Genomic Regions Enrichment of Annotations Tool (GREAT) is another powerful tool able to correlate data sets from ChIP-seq or, more generally, from DNA binding of cis-regulatory DNA regions with biological processes (McLean et al., 2010). Several network-based methods and tools such as eFORGE and ChromHMM are able to predict chromatin states from epigenetics data (Breeze et al., 2016; Ernst & Kellis, 2017).
Data integration approaches aimed at functionally annotating specific traits associated with epigenetic associations are now being developing by exploiting the possibility to predict chromatin states and establish links with gene expression (Claussnitzer et al., 2015). Few bioinformatics tools are currently available to combine and model multi-omics data and networks. Significance-based Modules Integrating the Transcriptome and Epigenome (SMITE) integrates transcriptomics and epigenomics data at high resolution, increasing confidence in finding gene modules underlying cellular pathophysiology (Wijetunga et al., 2017). SMITE may be used to identify novel gene modules in large epigenetic and transcriptomic data sets and provide a more useful characterization and visualization of functional modules inside a gene network. BioWardrobe is another user-friendly platform that stores, visualizes, and analyzes epigenomics and transcriptomics data, without requiring any particular programming skills (Kartashov & Barski, 2015). This tool correlates differential gene expression with binding analysis and creates average tag-density profiles and heatmaps.
Several studies represent valuable examples of the use of integrated epigenomic approaches to dissect complex disease. Claussnitzer revealed a mechanistic basis for the genetic association between FTO and human obesity (Claussnitzer et al., 2015), identifying the rs1421085 T-to-C single-nucleotide variant of the FTO gene as the single-nucleotide variant (SNV) responsible for dysregulation of target genes with a functional role in human obesity. The authors combined public resources for epigenomic annotations, chromosome conformation assays, and regulatory motif conservation. The data indicated that rs1421085 disrupts ARID5B repressor binding resulting in derepression of IRX3/IRX5 during early adipocyte differentiation. In another study based on the International Cancer Genome Consortium (Beekman et al., 2018), Beekman and colleagues analyzed the epigenome of seven chronic lymphocytic leukemias (CLLs) and the chromatin landscape of another 100 additional cases previously characterized by whole-genome or whole-exome sequencing (WGS/WES), RNA-seq, and DNA methylation microarrays. These authors identified de novo reprogrammed regulatory regions associated with the development of CLL and its main clinical subtypes with diagnostic, prognostic, and potentially therapeutic value. The comprehensive dataset provided by the authors offered new insights into the biology and clinical behavior of CLL, representing a resource for the scientific community into the study of gene regulation, cell differentiation, and cancer genomics or epigenomics.
A summary of the major molecular network types reviewed in this section is provided in Table 1.
Table 1:
Overview of the types of networks often used in analytical analysis for network medicine applications.
| Network Type | Structure | Nodes Represent | Edges Represent | Typically Derived From | Primary Use(s) |
|---|---|---|---|---|---|
| Protein-Protein Interaction | undirected; unipartite | proteins | physical or functional protein interactions | affinity purification, yeast-2-hybrid, tandem affinity purification | disease module detection |
| Gene Regulatory* | directed; bipartite | transcription factors and genes | regulation of genes by transcription factor proteins | DNA sequence scan, ChIP-assays, reverse-engineered from expression data | modeling and identification of alterations to regulatory processes |
| Correlation** | undirected; unipartite | genes/mRNAs | correlation in mRNA levels of genes | expression data | mining information about key genes and identifying drivers of gene expression |
| Bayesian | directed; acyclic | variables | dependency between variables | measurements across a series of variables | modeling relationships between variables |
| RNA-RNA | directed; multipartite | RNA species | regulation of RNA (e.g., lncRNA regulates miRNA; miRNA regulates mRNA) | expression data combined with regulatory information | identification of potential diagnostic biomarkers and therapeutic targets |
Epigenomic data can be integrated into gene regulatory networks to construct epigenomic regulatory networks. This additional layer of information can aid in the identification of biomarkers and therapeutic targets.
Correlation networks can also be constructed between other types of biological molecules using other types of Omics data. For example, a correlation network of metabolites can be constructed using metabolomics data.
5. Laboratory Validation of Molecular Networks
As discussed in previous sections, the analysis of molecular networks combines data from different sources: protein-protein interaction networks are derived mostly from yeast two-hybrid systems and tandem affinity purification assays, whereas networks based on correlations between gene expression levels may not capture causal relationships (Celaj et al., 2017; Snider et al., 2015). Therefore, the conclusions drawn from the analysis of Omics data, whether based on publicly available datasets or correlations within a set of human samples, should be experimentally validated. If the disease under investigation has an animal model or a tissue or a cellular model (e.g., stem cells derived from patients), these could be interrogated to verify the existence of the network identified in silico. Specifically, if a subnetwork of interacting proteins exists, its experimental perturbation (pharmacologically, by siRNA, or genetically) should lead to a change in a disease-relevant phenotype.
The Network Medicine approach to build networks from pair-wise molecular interactions (Kyoto Encyclopedia of Genes and Genomes, KEGG) and other high throughput approaches (e.g., brain imaging, connectomics, functional Magnetic Resonance Imaging (fMRI), etc.) can be combined with information gathered by high throughput techniques from cellular models (e.g., interactome or protein-protein interactions, kinase perturbation databases, phosphatase substrates, Reactome, druggome, etc.), in addition to extensive tissue protein expression databases, tissue atlases or annotated databases that consider protein functions (e.g., gene ontology). Consequently, experimental validation of network models represents an important step towards the development of precision medicine (Doncheva, Kacprowski, & Albrecht, 2012; Loscalzo & Barabasi, 2011). Two approaches have been considered to validate reliably the physiological relevance of target genes and pathways in a given network: animal models and cell-based approaches. However, selecting the appropriate model system and perturbation for network validation can be challenging. Molecular networks may vary between cell types, so selecting a cell type relevant for the disease of interest is helpful. The relevance of a particular animal model for human disease needs to be considered. In addition, a subset of key network relationships, rather than the entire network, is typically considered for validation due to the expense and logistical challenges of performing large-scale cellular and animal model functional studies.
5.1. Animal Models
An integral part of the Network Medicine approach should aim to define which gene-targeted animal model most effectively recapitulates a certain human disease. Although most complex diseases are polygenic, gene-targeted animal models focused on single genes often recapitulate key aspects of a complex disease. Table 2 provides examples of animal models of disease including attention deficit hyperactivity disorder (ADHD), anxiety/depression, memory dysfunction/dementia, type 1 and type 2 diabetes, nephrotic syndrome, obesity, and cancer.
Table 2:
Comparison of Estimated Genetic Determinants for Human Complex Diseases and Available Animal Models for Molecular Network Validation in Those Diseases
| Animal model Validation of Molecular networks | ||
|---|---|---|
| Disease | Estimated Number of Genetic Subgroups according to GWAS or DNA Sequencing | Number of Available Gene-Targeted Animal Models of the Disease (including Transgenic, Knock-out, and Knock-in Animals) |
| ADHD | 15 (Faraone & Larsson, 2019; Gizer, Ficks, & Waldman, 2009) | 54 (D. Viggiano, 2008) |
| Anxiety/Depression | 80 (Ormel, Hartman, & Snieder, 2019) | 33 (A. Viggiano, Cacciola, Widmer, & Viggiano, 2015) |
| Memory Impairment/Dementia | 30 (Nacmias, Bagnoli, Piaceri, & Sorbi, 2018) | 35 (De Sanctis, Bellenchi, & Viggiano, 2018) |
| Diabetes Mellitus Type 2 | 143 (Xue et al., 2018) | 11 (Kadowaki, 2000; Plum, Wunderlich, Baudler, Krone, & Bruning, 2005) |
| Diabetes Mellitus Type 1 | 39 (Alkorta-Aranburu et al., 2014) | Unknown |
| Nephrotic Syndrome | 37 (Sen et al., 2017) | Unknown |
| Obesity | 52 (Kleinendorst et al., 2018) | 20 (Kanasaki & Koya, 2011; Lutz & Woods, 2012) |
| Cancer | Variable according to the cancer type | Same number of cancer subtypes (patient-derived xenografts (PDXs) or Avatars)(Ben-David et al., 2017) |
Obtaining an accurate estimate of the number of genes responsible for a polygenic disease is problematic for several reasons: (i) in some instances (such as ADHD), the previously reported candidate gene associations (in contrast to large-scale genome-wide association studies) often have questionable validity; and (ii) the number of genetic loci is not equivalent to the number of different genetic subgroups; there can be multiple functional variants at each locus, and even if discrete subgroups can be identified, they likely relate to multiple genetic variants. These limitations are also present in general when trying to infer molecular networks in human subjects. However, notwithstanding these limitations, it is interesting to analyze an estimate of the number of genes/genetic loci in each of these situations and compare it to the number of available genetic animal models.
Keeping in mind these limitations, as detailed in Table 2, many complex human diseases have a polygenic origin based on GWAS and next-generation sequencing data, and only few present a monogenic familial origin. In contrast, transgenic and knock-out animal models have a single gene perturbation. The disease phenotype of these genetic models often differs from the full phenotype of the human disease; the phenotype is often milder or even absent in some cases. However, of note, the number of available genetic animal models is approximately of the same order of the estimated number of genes responsible for the human disease, except for type II diabetes. Moreover, in some instances (such as type 1 diabetes and nephrotic syndrome), a systematic report of the available animal models is not available, although the knockout mouse for each risk gene is available. Furthermore, a unique opportunity of a disease- or even patient-specific validation of a molecular network identified in silico is offered by patient-derived xenografts (PDXs) or avatars (Ben-David et al., 2017), which are based on cancer cells isolated from patients and injected into “nude” mice (mice without an immune system): these are an improved, individualized reproduction of the disease into animal models (though with several limitations (Willyard, 2018)).
In animal models, the effect of single-gene perturbations on molecular networks is then usually studied using Omics (e.g., proteomics, transcriptomics) analysis on relevant tissues. Strategies of gene-enrichment analysis or other techniques detailed above can be used to infer the disease network (how a molecular perturbation in a molecular network produces a specific phenotype). This information not only validates molecular networks inferred in patients but also gives a detailed view of which cells/tissues are most affected by the network perturbation and even tissue-by-tissue differences in molecular networks.
5.2. Cell-based Approaches
In vitro cellular models most commonly used experimentally to validate network relationships inferred from Omics data include immortalized cell lines or primary cells isolated from different human tissues, stem cells, and induced pluripotent stem cells (iPS). Computational identification of hub genes that affect multiple molecular pathways in PPI and RNA-RNA interaction (RRI) networks necessitates functional validation to confirm biological mechanisms and suggest potential druggable targets. Experimental laboratory validation usually occurs in two-dimensional (2D) monolayer cell cultures. This unnatural system does not recapitulate the extracellular microenvironment in which the cells reside in the body, due to the lack of extracellular matrix (ECM) and of local and circulating factors (e.g., neurohormones), critical components for physiological cell functions (Bonnans, Chou, & Werb, 2014). Consequently, failures of clinical trials, especially in phase III, could be attributed to misleading experimental results obtained in 2D cell cultures. To reflect more realistic and natural cell responses to any therapeutic treatment, three-dimensional (3D) cell culture systems have been developed. Cells in a 3D culture may either grow as spheroids in suspension, as organoids surrounded by ECM, or on scaffolds, as described in Table 3 (Abbott, 2003; Edmondson, Broglie, Adcock, & Yang, 2014; Muthuswamy, 2017). Organoids, arguably used interchangeably with spheroids, are a self-organized cell system that develop into 3D organ-like units that resemble the function and structure of an organ (Muthuswamy, 2017). Therefore, organoid cultures established from patients are used for personalized reliable drug screening and for studying gene function, offering new therapeutic approaches in the field of personalized medicine. More dynamic types of cell cultures are Organ-on-chip (OOC) or Organ-Chips, a multi-channel 3-D microfluidic cell culture chip made with silicone rubber polymer, which simulates the activities, mechanics, and physiological responses of entire organs and organ systems (Huh, Hamilton, & Ingber, 2011). Unlike conventional cell culture plates, microfluidic devices have been developed to mimic entire organs and to recapitulate cellular interactions within a tissue unit by creating separate parenchymal and vascular compartments, therefore providing a more physiological microenvironment. Furthermore, in these devices a smaller culture volume is needed, providing a greater concentration of cell-secreted growth factors as compared with 96-well plates (Przybyla & Voldman, 2012). Cells might be also seeded and grown on functionalized scaffolds made of synthetic biomaterials, such as polysaccharides, that are nontoxic, biocompatible, and biodegradable to achieve better cellular adhesion, differentiation, and proliferation able to form functional 3D human tissues for medical applications. Scaffolds mimic the extracellular matrix that sustain cell growth and can better recapitulate the microenvironment in which the cells are capable of exerting their physiological functions. Scaffold bioprinting has many potential medical applications, from organoids to human tissue fabrication for modeling pathobiology, drug development, and reconstitution and transplantation of damaged tissues and ultimately entire organs (“Tissue-engineered disease models,” 2018).
Table 3:
Main characteristics of cell-based approaches that are used for validation of molecular networks
| Cell-based approaches | ||||
| In vitro cell models | • immortalized cell lines • primary cells isolated from different human tissues • stem cells • induced pluripotent stem cells (iPS) |
|||
| Types of cell culture systems | ||||
| 2D | Cells are growing in a polystyrene rigid plastic surface (Petri dishes, flasks) | |||
| 3D | Cells are growing as spheroids, in suspension, or organoids surrounded by ECM, or on scaffolds | |||
| 3D cell culture systems | ||||
| Spheroids | Liquid overlay culture (LOC) | Hanging drop | Microtechnology | Bioreactor |
| Spheroids are placed on a thin layer of matrix composed by a mixture of matrigel with specific growth factors depending on the cell type. | Formation of spheroids in a small volume of cell suspension as a droplet. | Cell suspension is placed on 20 μm to 500 μm micro chambers with various shapes: honeycomb, round, or square(Karp et al., 2007) | Dynamic cell culture condition created by continuous stirring in appropriate glass containers for massive spheroid production(Ou & Hosseinkhani, 2014) | |
| Organoids | Examples of organoids and use: • human epithelial cells, breast cancer cells, acini-like structures that secreted milk proteins (Emerman, Enami, Pitelka, & Nandi, 1977) • exocrine pancreas cells used as a platform to study pancreatitis and pancreatic cancer (Huang et al., 2015) • human derived organoids can be altered genetically, by the genome editing CRISPR/Cas9 technology, to study the role of genes in molecular pathways of interest (Fujii, Matano, Nanki, & Sato, 2015) |
|||
| Organ-Chips | • Human breathing lung alveolus chip, blood-brain barrier, kidney, skin, placenta, intestine, etc. (Huh et al., 2010; Kasendra et al., 2018; Sances et al., 2018) | |||
| Scaffolds | Mineral | Polymeric custom shapes Hydrogel | De-cellularized tissues and organs | 3D bioprinting |
| Use for bone, dental, craniofacial and axon regeneration: -calcium phosphates composite scaffolds -graphene-based nanocomposites |
Use for reconstruction of bone, cartilage, muscle tissues: -biodegradable/bioabsorbable synthetic polymers (PCL, PLA, PEG) -biopolymers (collagen, gelatin, hyaluronic acid, chitosan) |
Use for engineering blood vessels and vascularized tissues grafts: -urinary bladder -vagina -liver -heart valves -tendons |
Use to create tissue/organ by three bio-printing techniques: -Inkjet -laser-assisted -extrusion |
|
PCL: poly-e-caprolactone, PLA: poly lactic acid, PEG: polyethylene glycol
Integration of predictive molecular networks with empirical data derived from 3D culture systems could become a powerful approach for precision medicine. As mentioned above, 3D bioengineered models from patient-derived cells are geared towards more physiologic behavior that considers not only cell-cell but also cell-microenvironmental interactions. Molecular perturbations of these culture systems could be assessed for changes in gene expression, RNA-RNA interactions, or protein-protein interactions. However, application of Omics data in these 3D culture systems remains challenging. This challenge is mostly due to the complexity of nonlinear biological systems, characterized by common nodes (proteins or RNA) working in concert with other nodes in a network, thus affecting multiple molecular pathways. Perturbation of a single node by a drug or siRNA, small hairpin RNA (shRNA), CRISPR/Cas9, or any other RNA-based compound might influence multiple molecular network members and create feedback loop processes. This complexity derives not only from the number of genes and molecular pathways, but also from responses over time after in vitro or in vivo treatment; i.e., with the aforementioned compounds. Moreover, a therapeutic treatment of an animal or 3D cellular model could be efficient and nontoxic at a certain range of a compound concentration; i.e., lower concentrations might be less toxic than high doses of a therapeutic compound. Another characteristic of in vitro cell-based biological systems is their adaptability to any therapeutic treatment that might induce drug resistance. We also need to verify whether organotypic cultures manifest the emergent properties of disease/toxicity (Grego et al., 2017). These and other challenges may lead to failure for validation of even the most powerful predictive molecular network.
The knowledge of molecular networks and especially causal network models combined with the experimental observations in 3D cell cultures could become an integrated and more accurate approach to predict human responses to any therapeutic treatment (Jaeger et al., 2014).
6. Data Visualization of Molecular Networks
Network Medicine allows the mapping of diseases into the theoretical problems of graphs. The study of networks requires a large amount of data to be analyzed and computed, in terms of properties of various nodes and relations existing among nodes and dynamicity related to the state of the network. Therefore, in addition to automatic analysis techniques (e.g., machine learning), it is possible to integrate this new approach with data visualization and visual analytics (Thomas & Cook, 2005), depicting networks so that it is possible to understand clearly the region of interest and analyze the relationships between network layers (Marai, Pinaud, Buhler, Lex, & Morris, 2019).
Visual analytics is a field that has intersected in multiple ways with medical data analysis (Chittaro, 2001; Shneiderman, Plaisant, & Hesse, 2013). With the birth of Network Medicine, several contributions have been proposed. They are focused on visualization of the molecular interactome (Chaurasia et al., 2009; Lu et al., 2004), disease module and gene pathways (Cerami, Demir, Schultz, Taylor, & Sander, 2010; Mlecnik et al., 2005), and phenotypes (Bottomly, McWeeney, & Wilmot, 2016). Most of these approaches represent results using the node-edge diagram (Gladilin, 2017; Sharma et al., 2015), but generally they have very basic visual interactions. Moreover, general purpose frameworks exist, in the form of environments or libraries, that allow visualization of large biological networks like Cytoscape (Smoot, Ono, Ruscheinski, Wang, & Ideker, 2011), NetBioV (Tripathi, Dehmer, & Emmert-Streib, 2014), or HitWalker 2 (Bottomly et al., 2016). Gerasch and colleagues (Gerasch et al., 2014) proposed a system for visually analyzing high-throughput Omics data in the context of networks; in particular, for differential analysis between groups of subjects and the analysis of time series data. Perer and Sun (Perer & Sun, 2012) and Basole and coworkers (Basole et al., 2015) proposed visual analytics solutions that analyze data from clinical patients, where the network reconstructs the time-evolving data of the clinical patient. In addition, Auriemma Citarella and coworkers (Auriemma Citarella et al., 2019) analyzed the symptoms of the patients and the general information of the disease using information retrieval. However, they analyzed only the patients’ data, without correlating them to the interactome. In this research, the symptoms of the patients can be considered as a layer in a multilayer network to have a more precise analysis. The work by Huan and colleagues (Huan, Sivachenko, Harrison, & Chen, 2008) presents PRoteoLEns, a JAVA-based visual analytics tool for creating, annotating, and exploring multi-scale biological networks. Nonetheless, the tool seems very proficient in exploring subparts of a biological network, but is not as effective in communicating a network overview. An improvement towards the analytics in the multilayer structure is represented by NEMESIS (Angelini, Blasilli, Farina, Lenti, & Santucci, 2019), inspired by the work of Dietzsch and colleagues (Dietzsch, Heinrich, Nieselt, & Bartz, 2009). NEMESIS is a visual analytics solution that provides the means for exploring interactively different facets of a complex body of data, inspecting both the data associated with topological properties of a single network and summary multidimensional information derived from other relevant networks.
It is possible to model Network Medicine data as a multi-layer network, where each network (e.g., protein-protein interaction networks (Rolland et al., 2014), metabolic networks (Ravasz, Somera, Mongru, Oltvai, & Barabasi, 2002), human disease networks (HDN) (K. I. Goh et al., 2007), metabolic disease networks (MDN) (Braun, Rietman, & Vidal, 2008), and drug-target networks (DTN) (Yildirim, Goh, Cusick, Barabasi, & Vidal, 2007)) is a different layer. As explained by Kivela and colleagues (Kivela et al., 2014), a multilayer network has a set of nodes just like a typical network, but in addition, there are layers. Each connection is not a pair of nodes; instead, it is a tuple of node-layers. The difficulties in understanding these connections are related to the multiple points of view that this structure generates; in fact, the elements can be analyzed at the intra-layer level (effectively focusing on a single homogeneous network) or at the inter-layer level. In this structure, layers and their connectivity have major roles; in fact, each layer must be chosen for its usefulness and importance with respect to the problems being studied. Network Medicine seems the perfect domain where modelling the various elements at hand as a multi-layer network can provide enriched analysis and benefits, although with additional complexity to manage.
From a visualization perspective, it is important to look for appropriate visual representations apart from the classic node-edge diagram, adjacency matrix (Ghoniem, Fekete, & Castagliola, 2005), or chord diagram (Crnovrsanin, Muelder, Faris, Felmlee, & Ma, 2014), or using a hybrid approach (matrix and node-edge) (Henry, Fekete, & McGuffin, 2007). These representations should be able to provide scalability with respect to data size and should be able to support the analyst providing an explorable overview. The analyst must be supported by tools to examine interactions within a single layer of the multi-layer network and eventually explore the connection to other layers. In this sense, it becomes important to design navigation patterns through different visual representations, automatically selecting the best one for the specific task at hand (e.g., exploration of the network, communication between different types of evidence, or analysis of a subset of elements). Transitions between abstract visual paradigms (e.g., node-edge representation, adjacency matrix representation, and novel visual paradigms) should be managed while keeping the user selection, allowing rearrangement of the layout of the multi-layer network depending on the kind of analysis executed. Where the complexity of the analysis again becomes manageable, the visualization can transition back to node-edge diagrams that are more readable for a low number of elements with respect to other abstract visual representations. Proposals on this topic are the automation of the change of visualizations with respect to granularity of the focus level (Landesberger et al., 2011) (e.g., from matrix to node-edge) or Detail to Overview via Selections and Aggregations (DOSA) (van den Elzen & van Wijk, 2014).
Among several visualization tasks to be supported, we can envision consolidating network data (e.g., interactome data), given the different sources that provide these data. Homogenization of data is necessary to perform deep studies aimed at uncovering new edges in single networks (e.g., protein-protein network) or among the networks (e.g., drugs-patients). Identification of interesting areas of the multi-layer network, such as highly connected nodes (hubs), may indicate certain properties that are present or are of specific interest (e.g., disease modules). Studying the connectivity in the multi-layer network, it is possible to identify regularities that could provide biological insights, but also to manage visually the complexity of the multi-layer network layout. On this topic, interesting visual approaches include the gragnostics (Gove, 2019) approach proposing several metrics for network similarity (e.g., to recognize similarities between the different layers and finding new patterns) and methodologies for pruning uninteresting elements from the network, allowing more scalable visual representations (Auber, 2004; Singh, 2007).
Eventually, these elements can even be used to model new layers of the multi-layer network, using them for fast filtering activities or pattern-matching based on machine learning techniques. Another interesting aspect is the network neighborhood; nearby nodes are often associated with the same phenomena. Genes that belong to the same disease are often arranged in a local neighborhood, so it is possible to find similar patterns in the proximity of a selected gene. Clustering approaches can be used to delineate these regions of interest.
The link between the fields of visualization, visual analytics, and Network Medicine (summarized in Figure 5) can bring mutual improvements for different types of users: physicians and medical personnel, as well as bioinformatics and visualization researchers and practitioners. Physicians and other medical personnel, provided with interpretable results coming from powerful automatic analysis methods, can form, test, and validate new hypotheses, eventually taking into account multiple relationships derived from the interconnected nature of a multilayer network. This effort can help to understand better a current disease under examination, test new drugs, and evaluate their effectiveness on patients, all in the same holistic and interconnected view, where visualization allows an investigator to steer the analysis and interpret and communicate the results.
Figure 5: The Visual Analytics cycle applied to Network Medicine.

Data from different domains (e.g., cellular, molecular, and genetic networks) are input to two different processes, Visual Data Exploration which exploits visualization paradigms (Node-Edge, Matrix, Chords, etc.) to represent these data and classic Automated Data Analysis through different approaches (machine learning, network analysis algorithms, etc.). These two processes are interconnected, allowing an analyst to steer algorithms by interacting with the visual representation of results. The whole process generates new insights (e.g., relationships among networks) used as a feedback loop for new cycles of analysis.
Despite the heavy computational cost of many of these data analysis techniques, network visualization approaches can help in conducting data exploration, fine-tuning and optimizing specific algorithms, and testing and comparing new automatic analysis techniques. Finally, for visualization researchers and practitioners, the requirements of Network Medicine can help in designing and testing new abstract visual paradigms, tailor interaction approaches to support exploration better, and investigate smoother transition techniques between views for exploration, analysis, communication and interpretation of results, eventually advancing the state-of-the-art in the field of networks, and in particular multilayer network, representation.
7. Successful Applications of Molecular Networks
Application of potent network-based algorithms represents the most fruitful way to reach useful clinical platforms for precision medicine and personalized therapy in complex diseases (Barabasi, 2007; Barabasi et al., 2011; Menche et al., 2015). In this section, we will review several examples in which the application of network-based methods has provided pathobiological insights into conventionally defined complex diseases. In the future, Network Medicine has the potential to redefine diseases based on the molecular networks that determine their pathobiological mechanisms, instead of the conventional approach of disease diagnosis based on physiology and/or pathology.
7.1. Pulmonary Arterial Hypertension (PAH)
Pulmonary arterial hypertension (PAH) leads to fibrotic vasculopathy and endothelial dysfunction underlying heart remodeling (Chan & Loscalzo, 2008). Combining network-based algorithms and modeling of epigenetic trajectories over time may be crucial to discover novel clinical biomarkers leading to precision medicine of PAH (Napoli, Benincasa, & Loscalzo, 2019). Samokhin and colleagues have mapped fibrosis-related proteins to the human interactome and, by using the betweenness centrality (BC) analysis, revealed that the SMAD3 target neural precursor cell expressed developmentally down-regulated 9 (NEDD9) is a critical hyperaldosteronism-regulated node triggering the shift from an adaptive to maladaptive fibrotic response (Samokhin et al., 2018). Interestingly, NEDD9 reduction prevented fibrotic vascular remodeling in vivo, thus suggesting a putative novel drug target.
7.2. Coronary Heart Disease (CHD)
An integrated approach combining imaging modalities in the quantification of coronary atherosclerosis and novel circulating biomarkers could improve precision medicine of coronary heart disease (CHD) (Infante et al., 2017). By providing additional linking proteins (seed connectors) to the seed protein pool, the Seed Connector algorithm (SCA) identified novel putative drug targets in CHD, such as the neuropilin-1 (NRP1) protein (R. S. Wang & Loscalzo, 2018). Furthermore, a systems pharmacology-based platform measuring the distance between disease proteins and drug targets in the human PPI was developed (Cheng et al., 2018). Evidence from large-scale patient datasets indicated that carbamazepine and hydroxychloroquine were strongly associated with a higher and lower risk of CHD onset, respectively. Importantly, in silico applications may serve as useful tools for efficient screening of potentially new indications for approved drugs (drug repurposing), undesirable side effects, as well as potential mechanisms of drug action, thus enlarging opportunities for personalized therapy (Cheng et al., 2018; R. S. Wang & Loscalzo, 2018).
7.3. Diabetes mellitus
Sharma and coworkers performed a robust network-based controllability approach in order to construct a regulatory sub-network in human pancreatic samples (Sharma et al., 2018). By applying the control centrality (Cc) concept to identify high control centrality (HiCc) pathways, an enrichment of variants regulating gene expression (eQTL) was observed. Interestingly, the nuclear factor of activated T cells 4 (NFATC4) belonged to four HiCc pathways and may increase the expression of four putative downstream T2D genes, thereby implicating a potentially crucial node contributing to disease pathogenesis (Sharma et al., 2018).
7.4. Complex Lung Diseases: Chronic Obstructive Pulmonary Disease (COPD), Idiopathic Pulmonary Fibrosis, and Asthma
Recently, a PPI network-based approach unveiled molecular network neighborhoods for chronic obstructive pulmonary disease (COPD) and idiopathic pulmonary fibrosis (IPF), with a statistically significant region of intersection and network proximity (Halu et al., 2019). The shared network region involved 19 genes, including Rho GTPase activating protein 12 (ARHGAP12) and butyrylcholinesterase (BCHE) as key nodes. Thus, network-based strategies may also offer a potent means to dissect genes and pathways shared between phenotypically distinct diseases, such as COPD and IPF, thus offering novel insights into pathobiological mechanisms (Halu et al., 2019). In earlier work, by mapping the seed genes onto the human interactome via the DIAMOnD algorithm (Ghiassian et al., 2015), an asthma-associated network neighborhood was identified (Sharma et al., 2015). Interestingly, the asthma network module was strongly associated with two clinical phenotypes, asthma severity and poor asthma control, thus providing evidence for its putative importance in asthma pathogenesis, as well as in future precision medicine.
7.5. Redefinition of sGC as a Primarily Neuronal Target
Clinically relevant molecular targets are often associated with only one or a few disease indications or medical specialties. This, however, may be solely due to the fact that other disease areas or indications were never considered. Langhauser and coworkers investigated such a potential bias in a high prevalence unmet medical need cluster of disease phenotypes linked to cyclic GMP (Langhauser et al., 2018). Hitherto, the central cGMP-forming enzyme, soluble guanylate cyclase (sGC), had been targeted pharmacologically exclusively for smooth muscle modulation in cardiology (angina pectoris, heart failure, coronary heart disease) and pulmonology (pulmonary arterial hypertension). The disease associations of sGC were re-investigated in a non-hypothesis based manner in order to identify possibly previously unrecognized clinical indications by determining the protein-protein interactome-based proximity of the proteins within the sGC complex to the proteins associated with major common diseases (Guney, Menche, Vidal, & Barabasi, 2016). To prioritize the diseases, four diseasomes were assessed based on disease–disease relationship scores. Only those links that correspond to non-spurious relationships between diseases were kept by including disease pairs that shared at least one gene (n > 0); had a positive shared protein interaction score (z > 0); showed symptom similarity (Jaccard index > 0.5); and were known to be comorbid (relative risk > 1) in the four diseasomes, respectively. The degree centrality of each disease within these diseasomes was calculated and then an average final centrality value was determined. To ensure that the incompleteness of the interactome data did not have a significant effect on the ranking of the diseases, the centrality of the diseases without using the interactome-based diseasome was also checked. Stroke remained as the most central disease across the diseasomes, an application that has so far not been explored clinically. Indeed, when investigating the neurological indication of this cluster with the highest unmet medical need, ischemic stroke, pre-clinically sGC activity was virtually absent post-stroke. Conversely, a heme-free form of sGC, apo-sGC, was now the predominant isoform suggesting it may be a mechanism-based target in stroke. Indeed, this repurposing hypothesis could be validated experimentally in vivo as specific activators of apo-sGC were directly neuroprotective, reduced cerebral infarct size and increased survival. Thus, common mechanism clusters of the diseasome allow direct drug repurposing across previously unrelated disease phenotypes redefining them in a mechanism-based manner.
7.6. Co-target Discovery for Network Pharmacology
Drug discovery mainly focuses on single molecular targets. Mechanism-based disease definitions would, however, frequently be networks targeted by multiple compound synergy and network pharmacology. Beginning with a primary causal target, Casas and coworkers extended a validated seed protein to a second protein using guilt-by-association analysis and then validated the prediction and synergy using both cellular in vitro and in vivo models (Casas et al., 2019). As a disease model they chose ischemic stroke, and reactive oxygen species forming NADPH oxidase type 4 (Nox4) as a primary causal therapeutic target. For network analysis, they used classical PPIs but also metabolite-dependent interactions, assuming that signaling events may occur in a non-PPI manner. Based on this protein–metabolite network, they conducted a gene ontology-based semantic similarity ranking to find suitable synergistic co-targets for network pharmacology. They then identified the nitric oxide synthase (Nos) gene family as the closest target to Nox4. Indeed, when combining a NOS and a NOX inhibitor at subthreshold concentrations, they observed pharmacological synergy in a supra-additive manner suggesting a causal network comprised of Nox4 and Nos signaling. Thus, protein–metabolite network analysis can predict and pair synergistic mechanistic disease targets for network pharmacology, an approach that may reduce the risk of failure and increase the efficacy of single-target drug discovery and therapy approaches.
7.7. Drug Networks
Drug-based networks (for which we propose the term ‘drugome’) may be especially relevant for translational Network Medicine and network validation. These networks include pluripotent drugs (effective in more than one disease) or promiscuous drugs (having more than one binding target). Both drug interactions and resulting drug networks offer the possibility of discovering drug repurposing opportunities for clinical validation. Hu and Agarwal performed a systematic, large-scale analysis of genomic expression profiles of human diseases and drugs to create a disease-drug network (Hu & Agarwal, 2009). A network of 170,027 significant interactions was extracted from comparisons between publicly available transcriptomic profiles. The network included primarily disease-drug and drug-drug relationships. Among the disease-drug links, connections with negative scores suggested new indications for existing drugs, while positive scoring connections may aid in drug side effect identification. Drug-drug relationships may aid in target and pathway deconvolution. The relevance of drug-drug networks is further enhanced by the recent observation of the detection of molecular interaction field similarities which provide further opportunities for drug repurposing as well as to identify potential molecular mechanisms responsible for side-effects. Chartier and colleagues performed a large-scale analysis to detect binding-site molecular interaction field similarities between the binding-sites of the primary target of registered drugs against a non-redundant dataset of all proteins with known structure (Chartier, Morency, Zylber, & Najmanovich, 2017). They found 140 unique drugs and 1,216 unique potential cross-reactivity protein targets. This expands the potential for drug repurposing for small molecules from the orthologous target to several so-called “off-targets.”
7.8. Future Network Medicine Applications
Network Medicine may effectively overcome the limitations of the current reductionist approach to medical research by using a “deep phenotyping” strategy that combines heterogeneous Big Data and clinical information, lifestyle, and nutritional habits in order to provide a map of the aberrant signaling pathways interlinked with each other layer of knowledge at the individual level. Epigenetic-sensitive changes represent a bridge between genome and environment during early-life development, providing novel insights into the “epigenetic transgenerational effect” hypothesis, a topic that deserves further investigation in humans (Benincasa et al., 2019; Napoli et al., 2019; Napoli et al., 2012). The above-mentioned network-oriented biomarkers could be useful to prevent, diagnose, and monitor complex diseases as well as to offer novel drug targets providing the opportunity of repurposing previously approved drugs for other diseases (Cheng et al., 2018). Moreover, Sanchez-Vega et al. emphasized the possibility that the high intra- and inter-individual heterogeneity of a specific type of cancer could be dissected by the underlying pathway abnormalities leading to a molecular-based diagnostic platform that could be more effective than traditional approaches (Sanchez-Vega et al., 2018). Long-term clinical trials are needed to validate these molecular networks and machine learning predictive models, providing a huge opportunity for precision medicine and personalized therapy of complex diseases. Importantly, Network Medicine is now focusing on the ongoing “Foodome” project (https://www.barabasilab.com/projects) based on the relationship between specific food (bio)chemicals and consumption behaviors, linking this to health and disease outcomes. In the future, these efforts may unveil crucial information about the relationships between epigenetic sensors and lifestyle/nutritional habits as one of the most important risk factors for diabetes, cardiovascular diseases, and cancer. These advances in Network Medicine have the potential to lead to important clinical applications (Figure 6) with more personalized and effective treatments.
Figure 6: The Network Medicine approach and its putative clinical applications.
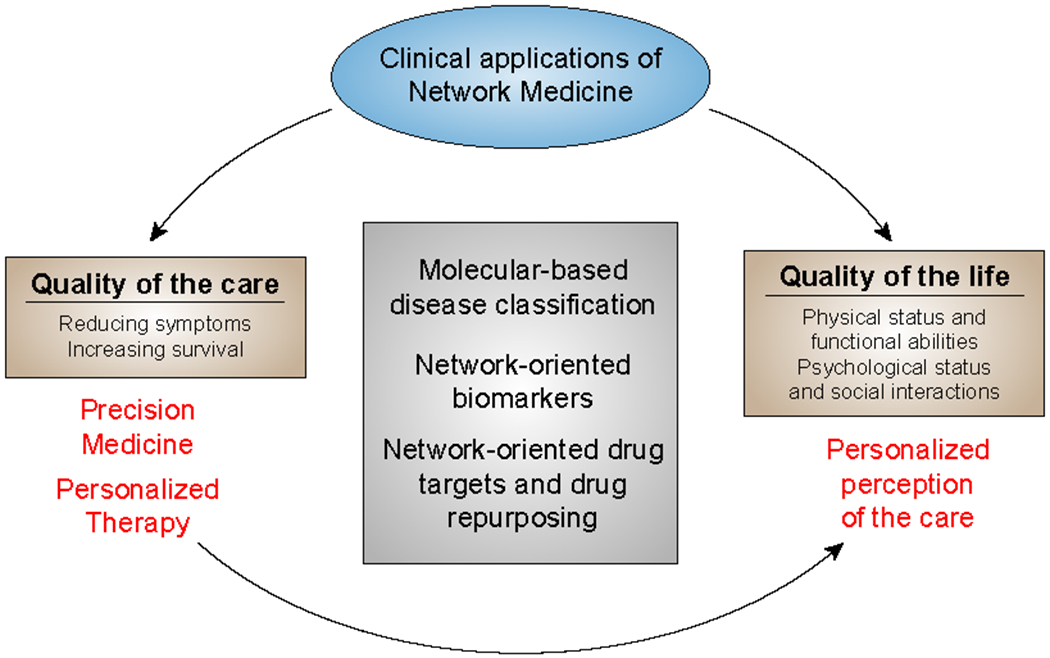
The main goal of Network Medicine is to provide holistic, network-based approaches for disease classification and drug target selection. This molecular-bioinformatic approach has the potential to improve both the quality of care and the quality of life of patients affected by complex diseases.
8. Conclusion: Knowledge Gaps and Key Research Directions
Although Network Medicine studies have already led to substantial progress, there are important knowledge gaps that have limited the impact of network-based analysis on clinical practice. We will review some of these key limitations and suggest future directions for Network Medicine research.
8.1. Incompleteness of the Molecular Interactome
Notwithstanding huge advances in systematic protein-protein interaction mapping technologies (Y2H- or MS-based) (Luck, Sheynkman, Zhang, & Vidal, 2017; Rolland et al., 2014; Smits & Vermeulen, 2016), it is estimated that the coverage of the human molecular interactome accounts for only about 20% of all potential pairwise interactions (Menche et al., 2015). Since many Network Medicine approaches are based on the topology of the molecular interactome (e.g., disease modules, connectivity patterns, centrality measures, etc.), interactome incompleteness is undeniably a hurdle. Attempts have been carried out to evaluate the impact of such incompleteness, leading to hypotheses that disease modules linked to <25 disease genes are likely to be fragmented and are difficult to detect in the current molecular interactome model (Menche et al., 2015). In such a landscape, computational predictive mapping approaches can come to the rescue and complement experimental high-throughput methods, providing reliable de novo PPI detection (Kotlyar, Rossos, & Jurisica, 2017). These approaches are based on genomic or functional data (Gandhi et al., 2006; X. Wang & Jin, 2017), on protein structure and dynamics (often coupled with machine learning techniques) (Ehrenberger, Cantley, & Yaffe, 2015; Q. C. Zhang et al., 2012), or on techniques derived from social links inference methods, e.g., based on the triad closure principle (TCP) (Bianconi, Darst, Iacovacci, & Fortunato, 2014), or on paths of length three (L3) (Kovacs et al., 2019).
It is also worth mentioning the need to go beyond pairwise interactions, e.g., by probing multi-protein interactions, in order to predict the behavior of larger protein complexes, operative scaffolds on which most cellular process rely (Hur, Chen, & Mueller, 2016), as well as the attempts to characterize the so-called “negatome”, i.e., the set of proteins that are unlikely to engage in physical interactions. The negatome is potentially useful for training PPI predictive algorithms and for assessing the false-positive rates of PPI detection attempts (Mao et al., 2014). Although the limitations of interactome incompleteness are problematic for protein-protein interaction networks, all network methods that rely on databases of molecular connections (e.g., transcription factor binding sites) will be susceptible to false-negative network connections due to incomplete mapping of molecular relationships and false-positive network connections due to technical artifacts. For example, protein metabolites (substrates and products) are often missing in metabolite databases. Casas and colleagues needed to include hydrogen peroxide as a metabolite of NOX in order to implicate NOS in ischemic stroke pathogenesis (Casas et al., 2019).
8.2. Uncertainty about Key Genes in Genetic Association Loci
Although GWAS have identified thousands of associations between genetic variants and complex diseases that withstand stringent adjustments for multiple statistical testing, the functional variants within those GWAS loci and the genes that they influence are known in only a small minority of GWAS regions (Silverman, 2018). Most complex disease genetic variants are located in noncoding regions, and they often do not regulate the nearest gene (Baranski et al., 2018). These uncertainties limit the accuracy of selection of GWAS “seed” genes for protein-protein interaction network studies. Moreover, since GWAS evidence has been used to support findings from other types of molecular networks (e.g., correlation, gene regulatory), the application of GWAS results in these contexts is also limited by the lack of functional dissection of GWAS statistical associations. Thus, although GWAS can provide reasonably comprehensive assessments of the common genetic variants influencing a complex disease, applying these results to molecular network studies remains challenging. Finding functional variants and the genes that they influence within GWAS loci are active areas of research (Musunuru et al., 2018).
8.3. Limited Application to Human Samples and Diseases: the Gap between Systems Biology and Network Medicine
There still are many hurdles to the successful and profitable deployment of Network Medicine approaches in the clinical context. Some of these bottlenecks and gridlocks include: 1) the strong focus on smaller biological systems typical of Systems Biology studies, which is often difficult to scale to the organism-level required in clinical practice, owing to the inherent limits of the conclusions to the specific experimental/biological context (e.g., signaling pathways, gene regulatory networks in cellular processes such as differentiation, etc.); 2) a large number of scientific hypotheses can be generated via network biology and Network Medicine methods, with a parallel need for robust testing and solid validation, i.e., basic needs in the clinical context; 3) the difficulties in gathering supporting, coherent, and secured data in clinical settings; and 4) the nature and the structure of clinical and medical data, with their own complexity, schemas, ontologies and access restrictions, and the necessity to link them unequivocally with clinical samples. From this perspective, meta-analyses can have the capability to increase statistical power and generalizability of single-study analysis (B. Chen & Butte, 2013; Wolkenhauer, Auffray, Jaster, Steinhoff, & Dammann, 2013; Wolkenhauer et al., 2009). Comparing different networks is a challenging task when nodes can differ between networks (recently reviewed by Tantardini and colleagues), which can be addressed with approaches based on graphlets, spectral methods, and portrait divergence (Tantardini, Ieva, Tajoli, & Piccardi, 2019).
A complete validation process should eventually lead to the enactment of qualified, standardized, partially automated protocols and workflows, able and tailored to work in highly dynamical clinical settings. Furthermore, often neglected, key points reside in the fact that models and findings should not be byzantine from a clinical perspective (see also considerations about “black boxes” in the next paragraph), as well as in the structure of the healthcare system, that will be required to adapt drastically to operate with multidisciplinary teams, working with multi-omics data, large-scale data storage facilities, standard analytical pipelines, and specific managerial frameworks. All of these processes demand specific education and complementary formations for hospital personnel in the context of larger training programmes (Hood, 2013; Noell, Faner, & Agusti, 2018).
8.4. Potential impact of New Molecular and Computational Methodologies on Network Medicine
The development of CRISPR technology has literally transfigured the capability of genome editing and has opened unique scenarios to analyze pathways and biological networks at the level of single-nucleotide specificity (Jinek et al., 2012). To demonstrate the impact that new molecular technologies can exert on network biology and Network Medicine, Li and coworkers used CRISPR for outlining the role of network edges compared to that of nodes (Li, Nowak, Withers, Pertsemlidis, & Bleris, 2018); they targeted a number of miRNA sites in 71 genes involved in the p53 pathway, ablating numerous edges and thus demonstrating their essentiality for the pathway function and stability. From this perspective, CRISPR editing in biological network analysis seems to provide a finer resolution tool compared to more disruptive node removal techniques, potentially leading to the identification of previously hidden interactions and more opportunities for therapeutic intervention.
Advanced analytical approaches, such as machine learning (ML) and deep neural networks (DNNs), are becoming a powerful and essential phase of modern biology and medical investigative workflows. Several successful applications have already been enumerated, such as achievements in the predictions of protein binding interactions, in inferring gene regulatory networks, in predicting metabolic functions, in genome annotation, and in the discovery of key transcriptional regulators involved in cancer, among other diseases (Sonawane, Weiss, Glass, & Sharma, 2019). Notwithstanding the many successes and the new opportunities offered, there remain daunting challenges to be faced, including the insatiable hunger for data of ML and DNN algorithms, for which, paradoxically, even the current biological data deluge is insufficient. Options to engage with such challenges with a focus on medicine and public health include the provision, availability and exploitation of larger, curated, formatted and open multi-omic datasets combined with robust, standardized, and curated clinical phenotypic data (Mooney & Pejaver, 2018; Vanschoren, van Rijn, Bischl, & Torgo, 2013); and, from the algorithmic side, the commitment in the development of new ML approaches able to deal with smaller datasets, which are already in progress in fields other than biology and medicine (Y. Zhang & Ling, 2018). The use of simulated data displaying the same attributes of experimental data--as already largely implemented in the setup of GWAS analysis tools (Dudek, Motsinger, Velez, Williams, & Ritchie, 2006)--is also viable, for example through the exploitation of the recent generative adversarial networks (GANs), a DNN architecture employing two neural networks that compete one against the other, one generating data that simulate the training (real) dataset (the generator), and the other recognizing if the simulated data belong to the training set (the adversary), until the ‘conflict” is resolved by simulating data that are indistinguishable from the real data (Ghasedi Dizaji, Wang, & Huang, 2018).
Finally, it is important to mention the fact that many advanced ML approaches work as “black boxes,” hiding the importance and the correlation of a set of features from the outcome (i.e., its biological interpretation), thus hindering the deployment of predictive models because ultimately, humans do not understand--nor trust—them (Camacho, Collins, Powers, Costello, & Collins, 2018). To overcome this issue, several efforts are being pursued in providing interpretable ML approaches able to balance interpretability, accuracy, and computational viability (Lakkaraju, Bach, & Leskovec, 2016; M. K. Yu et al., 2018).
Acknowledgments:
This article was written by the Molecular Networks Working Group of the International Network Medicine Consortium. We thank the other consortium members for their comments and ideas relevant to this manuscript.
Funding Information:
Edwin K. Silverman: Supported by National Institutes of Health (USA) grants U01 HL089856, P01 HL114501, R01 HL133135, R01 HL 137927, and R01 HL147148
Harald H.H.W. Schmidt:
Supported by REPO-TRIAL: This project has received funding from the European Union’s Horizon 2020 research and innovation programme under grant agreement No. 777111. This reflects only the author’s view and the European Commission is not responsible for any use that may be made of the information it contains.
Supported by FeatureCloud: This project has received funding from the European Union’s Horizon 2020 research and innovation programme under grant agreement No 826078. This reflects only the author’s view and the European Commission is not responsible for any use that may be made of the information it contains.
Supported by SAVEBRAIN: This project has received funding from the European Research Council (ERC) under the European Union’s Horizon 2020 research and innovation programme under grant agreement No. 737586. This reflects only the author’s view and the European Commission is not responsible for any use that may be made of the information it contains.
Eleni Anastasiadou: None reported
Lucia Altucci: Supported by VALERE: Vanvitelli per la Ricerca, the Italian Association for Cancer Research (AIRC-17217), MIUR20152TE5PK, iCURE (CUP B21c17000030007), FASE 2: IDEAL (CUP B63D18000560007), MIUR, proof of concept, CUP:B64I19000290008
Marco Angelini: None reported
Lina Badimon: Supported by Plan Nacional de Salud (PNS) [SAF2016-76819-R to L.B. and PGC2018-094025-B-I00 to G.V.] from the Spanish Ministry of Science and Innovation and funds FEDER “Una Manera de Hacer Europa” and CIBERCV (to L.B.). We thank the support of the Generalitat of Catalunya (Secretaria d’Universitats i Recerca del Departament d’Economia i Coneixement de la Generalitat, 2017 SGR 1480) and the Fundación Investigación Cardiovascular-Fundación Jesus Serra for their continuous support.
Jean-Luc Balligand: Supported by a WELBIO-Fonds National de la Recherche Scientifique grant funded by the Walloon Region (AGR-REN-X500220F-35045981)
Giuditta Benincasa: As a PhD student of Translational Medicine, she is supported by an Educational Grant from the University of Campania “Luigi Vanvitelli”, Naples, Italy.
Giovambattista Capasso: None reported
Federica Conte: None reported
Antonella Di Costanzo: Supported by VALERE: Vanvitelli per la Ricerca, the Italian Association for Cancer Research (AIRC-17217), MIUR20152TE5PK, iCURE (CUP B21c17000030007), FASE 2: IDEAL (CUP B63D18000560007), MIUR, proof of concept, CUP:B64I19000290008
Lorenzo Farina: None reported
Giulia Fiscon: None reported
Laurent Gatto: None reported
Michele Gentili: Partially supported by grant number AR11916B32035A1F from Progetti per Avvio alla Ricerca - Tipo 1 Sapienza University of Rome, Italy.
Joseph Loscalzo: Supported by National Institutes of Health (USA) grants U54 HL1191145, U01 HG007690, and P50 GM107618, and American Heart Association grant 700382
Cinzia Marchese: PRIN 2017 n. 2017F8ZB89_002 Minister of Health (ERC LS_7)
Claudio Napoli: Supported by grant number PRIN2017F8ZB89 from Italian Ministry of Research (PI: Prof Napoli)
Paola Paci: None reported
Manuela Petti: None reported
John Quackenbush: Supported by National Institutes of Health (USA) grants R01HL111759, P01HL105339, and 1R35CA220523
Paolo Tieri: Partially supported by the EU H2020 project “iPC Individualized Paediatric Cure”, grant agreement No. 826121, and from COST project CA15120 OpenMultiMed
Davide Viggiano: None reported
Gemma Vilahur: Supported by Plan Nacional de Salud (PNS) [SAF2016-76819-R to L.B. and PGC2018-094025-B-I00 to G.V.] from the Spanish Ministry of Science and Innovation and funds FEDER “Una Manera de Hacer Europa” and CIBERCV (to L.B.). We thank the support of the Generalitat of Catalunya (Secretaria d’Universitats i Recerca del Departament d’Economia i Coneixement de la Generalitat, 2017 SGR 1480) and the Fundación Investigación Cardiovascular-Fundación Jesus Serra for their continuous support.
Kimberly Glass: Supported by grant number K25HL133599 from the National Heart, Lung, and Blood Institute of the National Institutes of Health, USA
Jan Baumbach: Supported by H2020 grants RepoTrial (nr. 777111) and FeatureCloud (nr. 826078), as well as DFG Collaborative Research Centers Microbial Signatures (SFB1371) and Molecular Mechanisms in Plants (SFB924), and his VILLUM Young Investigator grant (nr. 13154).
Footnotes
Conflicts of Interest:
Edwin K. Silverman: Grant support from GSK and Bayer
Harald H.H.W. Schmidt: None reported
Eleni Anastasiadou: None reported
Lucia Altucci: None reported
Marco Angelini: None reported
Lina Badimon: None reported
Jean-Luc Balligand: None reported
Giuditta Benincasa: None reported
Giovambattista Capasso: None reported
Federica Conte: None reported
Antonella Di Costanzo: None reported
Lorenzo Farina: None reported
Giulia Fiscon: None reported
Laurent Gatto: None reported
Michele Gentili: None reported
Joseph Loscalzo: Scipher Medicine, Inc.—cofounder of this biotech start-up, uses network medicine strategies to define biomarkers of therapeutic efficacy and to repurpose drugs
Cinzia Marchese: None reported
Claudio Napoli: None reported
Paola Paci: None reported
Manuela Petti: None reported
John Quackenbush: None reported
Paolo Tieri: None reported
Davide Viggiano: None reported
Gemma Vilahur: None reported
Kimberly Glass: None reported
Jan Baumbach: None reported
References:
- Abbott A (2003). Cell culture: biology’s new dimension. Nature, 424(6951), 870–872. doi: 10.1038/424870a [DOI] [PubMed] [Google Scholar]
- Aghdam R, Ganjali M, Zhang X, & Eslahchi C (2015). CN: a consensus algorithm for inferring gene regulatory networks using the SORDER algorithm and conditional mutual information test. Mol Biosyst, 11(3), 942–949. doi: 10.1039/c4mb00413b [DOI] [PubMed] [Google Scholar]
- Alkorta-Aranburu G, Carmody D, Cheng YW, Nelakuditi V, Ma L, Dickens JT, … Del Gaudio D (2014). Phenotypic heterogeneity in monogenic diabetes: the clinical and diagnostic utility of a gene panel-based next-generation sequencing approach. Mol Genet Metab, 113(4), 315–320. doi: 10.1016/j.ymgme.2014.09.007 [DOI] [PMC free article] [PubMed] [Google Scholar]
- Allis CD, & Jenuwein T (2016). The molecular hallmarks of epigenetic control. Nat Rev Genet, 17(8), 487–500. doi: 10.1038/nrg.2016.59 [DOI] [PubMed] [Google Scholar]
- Anastasiadou E, Jacob LS, & Slack FJ (2018). Non-coding RNA networks in cancer. Nat Rev Cancer, 18(1), 5–18. doi: 10.1038/nrc.2017.99 [DOI] [PMC free article] [PubMed] [Google Scholar]
- Anders S, & Huber W (2010). Differential expression analysis for sequence count data. Genome Biol, 11(10), R106. doi: 10.1186/gb-2010-11-10-r106 [DOI] [PMC free article] [PubMed] [Google Scholar]
- Andrews B, Ramsey J, & Cooper GF (2018). Scoring Bayesian Networks of Mixed Variables. Int J Data Sci Anal, 6(1), 3–18. doi: 10.1007/s41060-017-0085-7 [DOI] [PMC free article] [PubMed] [Google Scholar]
- Angelini M, Blasilli G, Farina L, Lenti S, & Santucci G (2019). Nemesis (Nework Medicine Analysis): Towards visual exploration of network medicine data. Paper presented at the Proceedings of the 14th International Joint Conference on Computer Vision, Imaging and Computer Graphics Theory and Applications. [Google Scholar]
- Auber D (2004). Tulip -- A Huge Graph Visualization Framework. In (pp. 105–126). Berlin, Heidelberg: Springer. [Google Scholar]
- Auriemma Citarella A, De Marco F, Franca M, Francese R, Pellecchia MT, Risi M, & Tortora G (2019). Identifying correlations among biomedical data through information retrieval techniques. Paper presented at the Proceedings of the 23rd International Conference on Information Visualisation, Paris. [Google Scholar]
- Bader GD, & Hogue CW (2003). An automated method for finding molecular complexes in large protein interaction networks. BMC Bioinformatics, 4, 2. [DOI] [PMC free article] [PubMed] [Google Scholar]
- Barabasi AL (2007). Network medicine--from obesity to the “diseasome”. The New England journal of medicine, 357(4), 404–407. doi: 10.1056/NEJMe078114 [DOI] [PubMed] [Google Scholar]
- Barabasi AL, Gulbahce N, & Loscalzo J (2011). Network medicine: a network-based approach to human disease. Nature Reviews. Genetics, 12(1), 56–68. doi: 10.1038/nrg2918 [DOI] [PMC free article] [PubMed] [Google Scholar]
- Baranski TJ, Kraja AT, Fink JL, Feitosa M, Lenzini PA, Borecki IB, … Province MA (2018). A high throughput, functional screen of human Body Mass Index GWAS loci using tissue-specific RNAi Drosophila melanogaster crosses. PLoS Genet, 14(4), e1007222. doi: 10.1371/journal.pgen.1007222 [DOI] [PMC free article] [PubMed] [Google Scholar]
- Basole RC, Braunstein ML, Kumar V, Park H, Kahng M, Chau DH, … Thompson M (2015). Understanding variations in pediatric asthma care processes in the emergency department using visual analytics. J Am Med Inform Assoc, 22(2), 318–323. doi: 10.1093/jamia/ocu016 [DOI] [PubMed] [Google Scholar]
- Batra R, Alcaraz N, Gitzhofer K, Pauling J, Ditzel HJ, Hellmuth M, … List M (2017). On the performance of de novo pathway enrichment. NPJ Syst Biol Appl, 3, 6. doi: 10.1038/s41540-017-0007-2 [DOI] [PMC free article] [PubMed] [Google Scholar]
- Batushansky A, Toubiana D, & Fait A (2016). Correlation-Based Network Generation, Visualization, and Analysis as a Powerful Tool in Biological Studies: A Case Study in Cancer Cell Metabolism. Biomed Res Int, 2016, 8313272. doi: 10.1155/2016/8313272 [DOI] [PMC free article] [PubMed] [Google Scholar]
- Baumbach J, Tauch A, & Rahmann S (2009). Towards the integrated analysis, visualization and reconstruction of microbial gene regulatory networks. Brief Bioinform, 10(1), 75–83. doi: 10.1093/bib/bbn055 [DOI] [PMC free article] [PubMed] [Google Scholar]
- Baumbach J, Wittkop T, Kleindt CK, & Tauch A (2009). Integrated analysis and reconstruction of microbial transcriptional gene regulatory networks using CoryneRegNet. Nat Protoc, 4(6), 992–1005. doi: 10.1038/nprot.2009.81 [DOI] [PubMed] [Google Scholar]
- Beekman R, Chapaprieta V, Russinol N, Vilarrasa-Blasi R, Verdaguer-Dot N, Martens JHA, … Martin-Subero JI (2018). The reference epigenome and regulatory chromatin landscape of chronic lymphocytic leukemia. Nat Med, 24(6), 868–880. doi: 10.1038/s41591-018-0028-4 [DOI] [PMC free article] [PubMed] [Google Scholar]
- Ben-David U, Ha G, Tseng YY, Greenwald NF, Oh C, Shih J, … Golub TR (2017). Patient-derived xenografts undergo mouse-specific tumor evolution. Nat Genet, 49(11), 1567–1575. doi: 10.1038/ng.3967 [DOI] [PMC free article] [PubMed] [Google Scholar]
- Benincasa G, Costa D, Infante T, Lucchese R, Donatelli F, & Napoli C (2019). Interplay between genetics and epigenetics in modulating the risk of venous thromboembolism: A new challenge for personalized therapy. Thrombosis research, 177, 145–153. doi: 10.1016/j.thromres.2019.03.008 [DOI] [PubMed] [Google Scholar]
- Berget SM, Moore C, & Sharp PA (1977). Spliced segments at the 5’ terminus of adenovirus 2 late mRNA. Proc Natl Acad Sci U S A, 74(8), 3171–3175. doi: 10.1073/pnas.74.8.3171 [DOI] [PMC free article] [PubMed] [Google Scholar]
- Bernstein BE, Stamatoyannopoulos JA, Costello JF, Ren B, Milosavljevic A, Meissner A, … Thomson JA (2010). The NIH Roadmap Epigenomics Mapping Consortium. Nat Biotechnol, 28(10), 1045–1048. doi: 10.1038/nbt1010-1045 [DOI] [PMC free article] [PubMed] [Google Scholar]
- Beyer A, Workman C, Hollunder J, Radke D, Moller U, Wilhelm T, & Ideker T (2006). Integrated assessment and prediction of transcription factor binding. PLoS computational biology, 2(6), e70. doi: 10.1371/journal.pcbi.0020070 [DOI] [PMC free article] [PubMed] [Google Scholar]
- Bianconi G, Darst RK, Iacovacci J, & Fortunato S (2014). Triadic closure as a basic generating mechanism of communities in complex networks. Phys Rev E Stat Nonlin Soft Matter Phys, 90(4), 042806. doi: 10.1103/PhysRevE.90.042806 [DOI] [PubMed] [Google Scholar]
- Bittremieux W, Meysman P, Martens L, Valkenborg D, & Laukens K (2016). Unsupervised Quality Assessment of Mass Spectrometry Proteomics Experiments by Multivariate Quality Control Metrics. Journal of proteome research, 15(4), 1300–1307. doi: 10.1021/acs.jproteome.6b00028 [DOI] [PubMed] [Google Scholar]
- Bonnans C, Chou J, & Werb Z (2014). Remodelling the extracellular matrix in development and disease. Nat Rev Mol Cell Biol, 15(12), 786–801. doi: 10.1038/nrm3904 [DOI] [PMC free article] [PubMed] [Google Scholar]
- Bottomly D, McWeeney SK, & Wilmot B (2016). HitWalker2: visual analytics for precision medicine and beyond. Bioinformatics, 32(8), 1253–1255. doi: 10.1093/bioinformatics/btv739 [DOI] [PMC free article] [PubMed] [Google Scholar]
- Braun P, Rietman E, & Vidal M (2008). Networking metabolites and diseases. Proc Natl Acad Sci U S A, 105(29), 9849–9850. doi: 10.1073/pnas.0805644105 [DOI] [PMC free article] [PubMed] [Google Scholar]
- Breeze CE, Paul DS, van Dongen J, Butcher LM, Ambrose JC, Barrett JE, … Beck S (2016). eFORGE: A Tool for Identifying Cell Type-Specific Signal in Epigenomic Data. Cell Rep, 17(8), 2137–2150. doi: 10.1016/j.celrep.2016.10.059 [DOI] [PMC free article] [PubMed] [Google Scholar]
- Bujold D, Morais DAL, Gauthier C, Cote C, Caron M, Kwan T, … Bourque G (2016). The International Human Epigenome Consortium Data Portal. Cell Syst, 3(5), 496–499 e492. doi: 10.1016/j.cels.2016.10.019 [DOI] [PubMed] [Google Scholar]
- Calin GA, & Croce CM (2006). MicroRNA signatures in human cancers. Nat Rev Cancer, 6(11), 857–866. doi: 10.1038/nrc1997 [DOI] [PubMed] [Google Scholar]
- Camacho DM, Collins KM, Powers RK, Costello JC, & Collins JJ (2018). Next-Generation Machine Learning for Biological Networks. Cell, 173(7), 1581–1592. doi: 10.1016/j.cell.2018.05.015 [DOI] [PubMed] [Google Scholar]
- Casas AI, Hassan AA, Larsen SJ, Gomez-Rangel V, Elbatreek M, Kleikers PWM, … Schmidt H (2019). From single drug targets to synergistic network pharmacology in ischemic stroke. Proc Natl Acad Sci U S A, 116(14), 7129–7136. doi: 10.1073/pnas.1820799116 [DOI] [PMC free article] [PubMed] [Google Scholar]
- Celaj A, Schlecht U, Smith JD, Xu W, Suresh S, Miranda M, … Onge RP (2017). Quantitative analysis of protein interaction network dynamics in yeast. Mol Syst Biol, 13(7), 934. doi: 10.15252/msb.20177532 [DOI] [PMC free article] [PubMed] [Google Scholar]
- Cerami E, Demir E, Schultz N, Taylor BS, & Sander C (2010). Automated network analysis identifies core pathways in glioblastoma. PLoS ONE, 5(2), e8918. doi: 10.1371/journal.pone.0008918 [DOI] [PMC free article] [PubMed] [Google Scholar]
- Chan SY, & Loscalzo J (2008). Pathogenic mechanisms of pulmonary arterial hypertension. Journal of molecular and cellular cardiology, 44(1), 14–30. doi: 10.1016/j.yjmcc.2007.09.006 [DOI] [PMC free article] [PubMed] [Google Scholar]
- Chang LW, Payton JE, Yuan W, Ley TJ, Nagarajan R, & Stormo GD (2008). Computational identification of the normal and perturbed genetic networks involved in myeloid differentiation and acute promyelocytic leukemia. Genome Biol, 9(2), R38. doi: 10.1186/gb-2008-9-2-r38 [DOI] [PMC free article] [PubMed] [Google Scholar]
- Chartier M, Morency LP, Zylber MI, & Najmanovich RJ (2017). Large-scale detection of drug off-targets: hypotheses for drug repurposing and understanding side-effects. BMC Pharmacol Toxicol, 18(1), 18. doi: 10.1186/s40360-017-0128-7 [DOI] [PMC free article] [PubMed] [Google Scholar]
- Chaurasia G, Malhotra S, Russ J, Schnoegl S, Hanig C, Wanker EE, & Futschik ME (2009). UniHI 4: new tools for query, analysis and visualization of the human protein-protein interactome. Nucleic Acids Res, 37(Database issue), D657–660. doi: 10.1093/nar/gkn841 [DOI] [PMC free article] [PubMed] [Google Scholar]
- Chen B, & Butte AJ (2013). Network medicine in disease analysis and therapeutics. Clinical pharmacology and therapeutics, 94(6), 627–629. doi: 10.1038/clpt.2013.181 [DOI] [PMC free article] [PubMed] [Google Scholar]
- Chen Z, Li S, Subramaniam S, Shyy JY, & Chien S (2017). Epigenetic Regulation: A New Frontier for Biomedical Engineers. Annu Rev Biomed Eng, 19, 195–219. doi: 10.1146/annurev-bioeng-071516-044720 [DOI] [PubMed] [Google Scholar]
- Cheng F, Desai RJ, Handy DE, Wang R, Schneeweiss S, Barabasi AL, & Loscalzo J (2018). Network-based approach to prediction and population-based validation of in silico drug repurposing. Nature communications, 9(1), 2691. doi: 10.1038/s41467-018-05116-5 [DOI] [PMC free article] [PubMed] [Google Scholar]
- Chickering DM (1996). Learning Bayesian Networks is NP-Complete. In Fisher D & Lenz HJ (Eds.), Learning from Data (Vol. 112, pp. 121–130). New York, NY: Springer. [Google Scholar]
- Chittaro L (2001). Information visualization and its application to medicine. Artif Intell Med, 22(2), 81–88. [DOI] [PubMed] [Google Scholar]
- Chmiel A, Klimek P, & Thurner S (2014). Spreading of diseases through comorbidity networks across life and gender. New Journal of Physics, 16, 115013. [Google Scholar]
- Chow LT, Gelinas RE, Broker TR, & Roberts RJ (1977). An amazing sequence arrangement at the 5’ ends of adenovirus 2 messenger RNA. Cell, 12(1), 1–8. doi: 10.1016/0092-8674(77)90180-5 [DOI] [PubMed] [Google Scholar]
- Chu JH, Hersh CP, Castaldi PJ, Cho MH, Raby BA, Laird N, … Silverman EK (2014). Analyzing networks of phenotypes in complex diseases: methodology and applications in COPD. BMC systems biology, 8, 78. doi: 10.1186/1752-0509-8-78 [DOI] [PMC free article] [PubMed] [Google Scholar]
- Claussnitzer M, Dankel SN, Kim KH, Quon G, Meuleman W, Haugen C, … Kellis M (2015). FTO Obesity Variant Circuitry and Adipocyte Browning in Humans. N Engl J Med, 373(10), 895–907. doi: 10.1056/NEJMoa1502214 [DOI] [PMC free article] [PubMed] [Google Scholar]
- Clough E, & Barrett T (2016). The Gene Expression Omnibus Database. Methods Mol Biol, 1418, 93–110. doi: 10.1007/978-1-4939-3578-9_5 [DOI] [PMC free article] [PubMed] [Google Scholar]
- Conlon EM, Liu XS, Lieb JD, & Liu JS (2003). Integrating regulatory motif discovery and genome-wide expression analysis. Proc Natl Acad Sci U S A, 100(6), 3339–3344. doi: 10.1073/pnas.0630591100 [DOI] [PMC free article] [PubMed] [Google Scholar]
- consortium B (2016). Quantitative comparison of DNA methylation assays for biomarker development and clinical applications. Nat Biotechnol, 34(7), 726–737. doi: 10.1038/nbt.3605 [DOI] [PubMed] [Google Scholar]
- Consortium EP, Birney E, Stamatoyannopoulos JA, Dutta A, Guigo R, Gingeras TR, … de Jong PJ (2007). Identification and analysis of functional elements in 1% of the human genome by the ENCODE pilot project. Nature, 447(7146), 799–816. doi: 10.1038/nature05874 [DOI] [PMC free article] [PubMed] [Google Scholar]
- Cowell RG (2001). Conditions under which conditional independence and scoring methods lead to identical selection of Bayesian network models. Paper presented at the Seventeenth Conference on Uncertainty in Artificial Intelligence (UAI2001). [Google Scholar]
- Crnovrsanin T, Muelder CW, Faris R, Felmlee D, & Ma K-L (2014). Visualization techniques for categorical analysis of social networks with multiple edge-sets. Social Networks, 37, 56–64. [Google Scholar]
- Davis CA, Hitz BC, Sloan CA, Chan ET, Davidson JM, Gabdank I, … Cherry JM (2018). The Encyclopedia of DNA elements (ENCODE): data portal update. Nucleic Acids Res, 46(D1), D794–D801. doi: 10.1093/nar/gkx1081 [DOI] [PMC free article] [PubMed] [Google Scholar]
- de la Fuente A, Bing N, Hoeschele I, & Mendes P (2004). Discovery of meaningful associations in genomic data using partial correlation coefficients. Bioinformatics, 20(18), 3565–3574. doi: 10.1093/bioinformatics/bth445 [DOI] [PubMed] [Google Scholar]
- De Sanctis C, Bellenchi GC, & Viggiano D (2018). A meta-analytic approach to genes that are associated with impaired and elevated spatial memory performance. Psychiatry Res, 261, 508–516. doi: 10.1016/j.psychres.2018.01.036 [DOI] [PubMed] [Google Scholar]
- De Smet R, & Marchal K (2010). Advantages and limitations of current network inference methods. Nature reviews. Microbiology, 8(10), 717–729. doi: 10.1038/nrmicro2419 [DOI] [PubMed] [Google Scholar]
- Dietzsch J, Heinrich J, Nieselt K, & Bartz D (2009). Spray: A visual analytics approach for gene expression data. Paper presented at the 2009 IEEE Symposium on Visual Analytics Science and Technology. [Google Scholar]
- Djebbari A, & Quackenbush J (2008). Seeded Bayesian Networks: constructing genetic networks from microarray data. BMC systems biology, 2, 57. doi: 10.1186/1752-0509-2-57 [DOI] [PMC free article] [PubMed] [Google Scholar]
- Doncheva NT, Kacprowski T, & Albrecht M (2012). Recent approaches to the prioritization of candidate disease genes. Wiley interdisciplinary reviews. Systems biology and medicine, 4(5), 429–442. doi: 10.1002/wsbm.1177 [DOI] [PubMed] [Google Scholar]
- Dudek SM, Motsinger AA, Velez DR, Williams SM, & Ritchie MD (2006). Data simulation software for whole-genome association and other studies in human genetics. Pac Symp Biocomput, 499–510. [PubMed] [Google Scholar]
- Edmondson R, Broglie JJ, Adcock AF, & Yang L (2014). Three-dimensional cell culture systems and their applications in drug discovery and cell-based biosensors. Assay Drug Dev Technol, 12(4), 207–218. doi: 10.1089/adt.2014.573 [DOI] [PMC free article] [PubMed] [Google Scholar]
- Ehrenberger T, Cantley LC, & Yaffe MB (2015). Computational prediction of protein-protein interactions. Methods Mol Biol, 1278, 57–75. doi: 10.1007/978-1-4939-2425-7_4 [DOI] [PMC free article] [PubMed] [Google Scholar]
- Emerman JT, Enami J, Pitelka DR, & Nandi S (1977). Hormonal effects on intracellular and secreted casein in cultures of mouse mammary epithelial cells on floating collagen membranes. Proc Natl Acad Sci U S A, 74(10), 4466–4470. doi: 10.1073/pnas.74.10.4466 [DOI] [PMC free article] [PubMed] [Google Scholar]
- Emig D, Salomonis N, Baumbach J, Lengauer T, Conklin BR, & Albrecht M (2010). AltAnalyze and DomainGraph: analyzing and visualizing exon expression data. Nucleic Acids Res, 38(Web Server issue), W755–762. doi: 10.1093/nar/gkq405 [DOI] [PMC free article] [PubMed] [Google Scholar]
- Ernst J, Beg QK, Kay KA, Balazsi G, Oltvai ZN, & Bar-Joseph Z (2008). A semi-supervised method for predicting transcription factor-gene interactions in Escherichia coli. PLoS computational biology, 4(3), e1000044. doi: 10.1371/journal.pcbi.1000044 [DOI] [PMC free article] [PubMed] [Google Scholar]
- Ernst J, & Kellis M (2017). Chromatin-state discovery and genome annotation with ChromHMM. Nat Protoc, 12(12), 2478–2492. doi: 10.1038/nprot.2017.124 [DOI] [PMC free article] [PubMed] [Google Scholar]
- Erten S, Bebek G, Ewing RM, & Koyuturk M (2011). DADA: Degree-Aware Algorithms for Network-Based Disease Gene Prioritization. BioData Min, 4, 19. doi: 10.1186/1756-0381-4-19 [DOI] [PMC free article] [PubMed] [Google Scholar]
- Faith JJ, Hayete B, Thaden JT, Mogno I, Wierzbowski J, Cottarel G, … Gardner TS (2007). Large-scale mapping and validation of Escherichia coli transcriptional regulation from a compendium of expression profiles. PLoS Biol, 5(1), e8. doi: 10.1371/journal.pbio.0050008 [DOI] [PMC free article] [PubMed] [Google Scholar]
- Faraone SV, & Larsson H (2019). Genetics of attention deficit hyperactivity disorder. Mol Psychiatry, 24(4), 562–575. doi: 10.1038/s41380-018-0070-0 [DOI] [PMC free article] [PubMed] [Google Scholar]
- Fiscon G, Conte F, Farina L, & Paci P (2018). Network-Based Approaches to Explore Complex Biological Systems towards Network Medicine. Genes (Basel), 9(9). doi: 10.3390/genes9090437 [DOI] [PMC free article] [PubMed] [Google Scholar]
- Frey BJ, & Dueck D (2007). Clustering by passing messages between data points. Science, 315(5814), 972–976. doi: 10.1126/science.1136800 [DOI] [PubMed] [Google Scholar]
- Friedman N, Linial M, Nachman I, & Pe’er D (2000). Using Bayesian networks to analyze expression data. Journal of computational biology : a journal of computational molecular cell biology, 7(3-4), 601–620. doi: 10.1089/106652700750050961 [DOI] [PubMed] [Google Scholar]
- Fujii M, Matano M, Nanki K, & Sato T (2015). Efficient genetic engineering of human intestinal organoids using electroporation. Nat Protoc, 10(10), 1474–1485. doi: 10.1038/nprot.2015.088 [DOI] [PubMed] [Google Scholar]
- Gagnon-Bartsch JA, & Speed TP (2012). Using control genes to correct for unwanted variation in microarray data. Biostatistics, 13(3), 539–552. doi: 10.1093/biostatistics/kxr034 [DOI] [PMC free article] [PubMed] [Google Scholar]
- Gama-Castro S, Salgado H, Santos-Zavaleta A, Ledezma-Tejeida D, Muniz-Rascado L, Garcia-Sotelo JS, … Collado-Vides J (2016). RegulonDB version 9.0: high-level integration of gene regulation, coexpression, motif clustering and beyond. Nucleic Acids Res, 44(D1), D133–143. doi: 10.1093/nar/gkv1156 [DOI] [PMC free article] [PubMed] [Google Scholar]
- Gandhi TK, Zhong J, Mathivanan S, Karthick L, Chandrika KN, Mohan SS, … Pandey A (2006). Analysis of the human protein interactome and comparison with yeast, worm and fly interaction datasets. Nat Genet, 38(3), 285–293. doi: 10.1038/ng1747 [DOI] [PubMed] [Google Scholar]
- Gat-Viks I, Tanay A, Raijman D, & Shamir R (2006). A probabilistic methodology for integrating knowledge and experiments on biological networks. Journal of computational biology : a journal of computational molecular cell biology, 13(2), 165–181. doi: 10.1089/cmb.2006.13.165 [DOI] [PubMed] [Google Scholar]
- Gentleman RC, Carey VJ, Bates DM, Bolstad B, Dettling M, Dudoit S, … Zhang J (2004). Bioconductor: open software development for computational biology and bioinformatics. Genome Biol, 5(10), R80. doi:gb-2004-5-10-r80 [pii] 10.1186/gb-2004-5-10-r80 [DOI] [PMC free article] [PubMed] [Google Scholar]
- Gerasch A, Faber D, Kuntzer J, Niermann P, Kohlbacher O, Lenhof HP, & Kaufmann M (2014). BiNA: a visual analytics tool for biological network data. PLoS ONE, 9(2), e87397. doi: 10.1371/journal.pone.0087397 [DOI] [PMC free article] [PubMed] [Google Scholar]
- Gerstein MB, Kundaje A, Hariharan M, Landt SG, Yan KK, Cheng C, … Snyder M (2012). Architecture of the human regulatory network derived from ENCODE data. Nature, 489(7414), 91–100. doi: 10.1038/nature11245 [DOI] [PMC free article] [PubMed] [Google Scholar]
- Gevaert O, Van Vooren S, & De Moor B (2007). A framework for elucidating regulatory networks based on prior information and expression data. Ann N Y Acad Sci, 1115, 240–248. doi:annals.1407.002 [pii] 10.1196/annals.1407.002 [DOI] [PubMed] [Google Scholar]
- Ghasedi Dizaji K, Wang X, & Huang H (2018). Semi-supervised Generative Adversarial Network for Gene Expression Inference. Paper presented at the Proceedings of the 24th ACM SIGKDD International Conference on Knowledge Discovery and Data Mining, London. [Google Scholar]
- Ghiassian SD, Menche J, & Barabasi AL (2015). A DIseAse MOdule Detection (DIAMOnD) algorithm derived from a systematic analysis of connectivity patterns of disease proteins in the human interactome. PLoS computational biology, 11(4), e1004120. doi: 10.1371/journal.pcbi.1004120 [DOI] [PMC free article] [PubMed] [Google Scholar]
- Ghoniem M, Fekete J-D, & Castagliola P (2005). On the readability of graphs using node-link and matrix-based representations: A controlled experiment and statistical analysis. Information Visualization, 4, 114–135. [Google Scholar]
- Gika H, Virgiliou C, Theodoridis G, Plumb RS, & Wilson ID (2019). Untargeted LC/MS-based metabolic phenotyping (metabonomics/metabolomics): The state of the art. J Chromatogr B Analyt Technol Biomed Life Sci, 1117, 136–147. doi: 10.1016/j.jchromb.2019.04.009 [DOI] [PubMed] [Google Scholar]
- Gilbert W (1986). The RNA World. Nature, 319, 618. [Google Scholar]
- Gizer IR, Ficks C, & Waldman ID (2009). Candidate gene studies of ADHD: a meta-analytic review. Hum Genet, 126(1), 51–90. doi: 10.1007/s00439-009-0694-x [DOI] [PubMed] [Google Scholar]
- Gladilin E (2017). Graph-theoretical model of global human interactome reveals enhanced long-range communicability in cancer networks. PLoS ONE, 12(1), e0170953. doi: 10.1371/journal.pone.0170953 [DOI] [PMC free article] [PubMed] [Google Scholar]
- Glass K, Huttenhower C, Quackenbush J, & Yuan GC (2013). Passing messages between biological networks to refine predicted interactions. PLoS ONE, 8(5), e64832. doi: 10.1371/journal.pone.0064832 [DOI] [PMC free article] [PubMed] [Google Scholar]
- Glass K, Quackenbush J, Silverman EK, Celli B, Rennard SI, Yuan GC, & DeMeo DL (2014). Sexually-dimorphic targeting of functionally-related genes in COPD. BMC systems biology, 8(1), 118. doi: 10.1186/s12918-014-0118-y [DOI] [PMC free article] [PubMed] [Google Scholar]
- Glass K, Quackenbush J, Spentzos D, Haibe-Kains B, & Yuan GC (2015). A network model for angiogenesis in ovarian cancer. BMC Bioinformatics, 16, 115. doi: 10.1186/s12859-015-0551-y [DOI] [PMC free article] [PubMed] [Google Scholar]
- Goh KI, Cusick ME, Valle D, Childs B, Vidal M, & Barabasi AL (2007). The human disease network. Proceedings of the National Academy of Sciences of the United States of America, 104(21), 8685–8690. doi: 10.1073/pnas.0701361104 [DOI] [PMC free article] [PubMed] [Google Scholar]
- Goh WWB, Wang W, & Wong L (2017). Why Batch Effects Matter in Omics Data, and How to Avoid Them. Trends Biotechnol, 35(6), 498–507. doi: 10.1016/j.tibtech.2017.02.012 [DOI] [PubMed] [Google Scholar]
- Gove R (2019). Gragnostics: Fast, interpretable features for comparing graphs. Paper presented at the Proceedings of the 23rd International Conference on Information Visualization, Paris. [Google Scholar]
- Grego S, Dougherty ER, Alexander FJ, Auerbach SS, Berridge BR, Bittner ML, … Yoon M (2017). Systems biology for organotypic cell cultures. ALTEX, 34(2), 301–310. doi: 10.14573/altex.1608221 [DOI] [PubMed] [Google Scholar]
- Guney E, Menche J, Vidal M, & Barabasi AL (2016). Network-based in silico drug efficacy screening. Nature communications, 7, 10331. doi: 10.1038/ncomms10331 [DOI] [PMC free article] [PubMed] [Google Scholar]
- Halu A, Liu S, Baek SH, Hobbs BD, Hunninghake GM, Cho MH, … Sharma A (2019). Exploring the cross-phenotype network region of disease modules reveals concordant and discordant pathways between chronic obstructive pulmonary disease and idiopathic pulmonary fibrosis. Hum Mol Genet, 28, 2352–2364. doi: 10.1093/hmg/ddz069 [DOI] [PMC free article] [PubMed] [Google Scholar]
- Han Y, & He X (2016). Integrating Epigenomics into the Understanding of Biomedical Insight. Bioinform Biol Insights, 10, 267–289. doi: 10.4137/BBI.S38427 [DOI] [PMC free article] [PubMed] [Google Scholar]
- Hartemink AJ, Gifford DK, Jaakkola TS, & Young RA (2002). Combining location and expression data for principled discovery of genetic regulatory network models. Pac Symp Biocomput, 437–449. [PubMed] [Google Scholar]
- Haury AC, Mordelet F, Vera-Licona P, & Vert JP (2012). TIGRESS: Trustful Inference of Gene REgulation using Stability Selection. BMC systems biology, 6, 145. doi: 10.1186/1752-0509-6-145 [DOI] [PMC free article] [PubMed] [Google Scholar]
- Hecker M, Lambeck S, Toepfer S, van Someren E, & Guthke R (2009). Gene regulatory network inference: data integration in dynamic models-a review. Biosystems, 96(1), 86–103. doi: 10.1016/j.biosystems.2008.12.004 [DOI] [PubMed] [Google Scholar]
- Henry N, Fekete JD, & McGuffin MJ (2007). NodeTrix: a hybrid visualization of social networks. IEEE Trans Vis Comput Graph, 13(6), 1302–1309. doi: 10.1109/TVCG.2007.70582 [DOI] [PubMed] [Google Scholar]
- Hicks SC, Okrah K, Paulson JN, Quackenbush J, Irizarry RA, & Bravo HC (2018). Smooth quantile normalization. Biostatistics, 19(2), 185–198. doi: 10.1093/biostatistics/kxx028 [DOI] [PMC free article] [PubMed] [Google Scholar]
- Hidalgo CA, Blumm N, Barabasi AL, & Christakis NA (2009). A dynamic network approach for the study of human phenotypes. PLoS computational biology, 5(4), e1000353. doi: 10.1371/journal.pcbi.1000353 [DOI] [PMC free article] [PubMed] [Google Scholar]
- Holoch D, & Moazed D (2015). RNA-mediated epigenetic regulation of gene expression. Nat Rev Genet, 16(2), 71–84. doi: 10.1038/nrg3863 [DOI] [PMC free article] [PubMed] [Google Scholar]
- Hood L (2013). Systems biology and p4 medicine: past, present, and future. Rambam Maimonides Med J, 4(2), e0012. doi: 10.5041/RMMJ.10112 [DOI] [PMC free article] [PubMed] [Google Scholar]
- Hu G, & Agarwal P (2009). Human disease-drug network based on genomic expression profiles. PLoS ONE, 4(8), e6536. doi: 10.1371/journal.pone.0006536 [DOI] [PMC free article] [PubMed] [Google Scholar]
- Huan T, Sivachenko AY, Harrison SH, & Chen JY (2008). ProteoLens: a visual analytic tool for multi-scale database-driven biological network data mining. BMC Bioinformatics, 9 Suppl 9, S5. doi: 10.1186/1471-2105-9-S9-S5 [DOI] [PMC free article] [PubMed] [Google Scholar]
- Huang L, Holtzinger A, Jagan I, BeGora M, Lohse I, Ngai N, … Muthuswamy SK (2015). Ductal pancreatic cancer modeling and drug screening using human pluripotent stem cell- and patient-derived tumor organoids. Nat Med, 21(11), 1364–1371. doi: 10.1038/nm.3973 [DOI] [PMC free article] [PubMed] [Google Scholar]
- Huber W, von Heydebreck A, Sueltmann H, Poustka A, & Vingron M (2003). Parameter estimation for the calibration and variance stabilization of microarray data. Stat Appl Genet Mol Biol, 2, Article3. doi: 10.2202/1544-6115.1008 [DOI] [PubMed] [Google Scholar]
- Huh D, Hamilton GA, & Ingber DE (2011). From 3D cell culture to organs-on-chips. Trends Cell Biol, 21(12), 745–754. doi: 10.1016/j.tcb.2011.09.005 [DOI] [PMC free article] [PubMed] [Google Scholar]
- Huh D, Matthews BD, Mammoto A, Montoya-Zavala M, Hsin HY, & Ingber DE (2010). Reconstituting organ-level lung functions on a chip. Science, 328(5986), 1662–1668. doi: 10.1126/science.1188302 [DOI] [PMC free article] [PubMed] [Google Scholar]
- Hur KH, Chen Y, & Mueller JD (2016). Characterization of Ternary Protein Systems In Vivo with Tricolor Heterospecies Partition Analysis. Biophys J, 110(5), 1158–1167. doi: 10.1016/j.bpj.2016.01.009 [DOI] [PMC free article] [PubMed] [Google Scholar]
- Husmeier D (2003). Sensitivity and specificity of inferring genetic regulatory interactions from microarray experiments with dynamic Bayesian networks. Bioinformatics, 19(17), 2271–2282. doi: 10.1093/bioinformatics/btg313 [DOI] [PubMed] [Google Scholar]
- Husmeier D, & Werhli AV (2007). Bayesian integration of biological prior knowledge into the reconstruction of gene regulatory networks with Bayesian networks. Comput Syst Bioinformatics Conf, 6, 85–95. doi:9781860948732_0013 [pii] [PubMed] [Google Scholar]
- Imoto S, Higuchi T, Goto T, Tashiro K, Kuhara S, & Miyano S (2004). Combining microarrays and biological knowledge for estimating gene networks via bayesian networks. J Bioinform Comput Biol, 2(1), 77–98. [DOI] [PubMed] [Google Scholar]
- Infante T, Forte E, Schiano C, Cavaliere C, Tedeschi C, Soricelli A, … Napoli C (2017). An integrated approach to coronary heart disease diagnosis and clinical management. Am J Transl Res, 9(7), 3148–3166. [PMC free article] [PubMed] [Google Scholar]
- Jaeger S, Min J, Nigsch F, Camargo M, Hutz J, Cornett A, … Jenkins JL (2014). Causal Network Models for Predicting Compound Targets and Driving Pathways in Cancer. J Biomol Screen, 19(5), 791–802. doi: 10.1177/1087057114522690 [DOI] [PubMed] [Google Scholar]
- Ji Z, Xia Q, & Meng G (2015). A Review of Parameter Learning Methods in Bayesian Network. In Huang DS & Han K (Eds.), Advanced Intelligent Computing Theories and Applications. ICIC 2015. Lecture Notes in Computer Science (Vol. 9227, pp. 3–12): Springer, Cham. [Google Scholar]
- Jia P, Zheng S, Long J, Zheng W, & Zhao Z (2011). dmGWAS: dense module searching for genome-wide association studies in protein-protein interaction networks. Bioinformatics, 27(1), 95–102. doi:btq615 [pii] 10.1093/bioinformatics/btq615 [DOI] [PMC free article] [PubMed] [Google Scholar]
- Jinek M, Chylinski K, Fonfara I, Hauer M, Doudna JA, & Charpentier E (2012). A programmable dual-RNA-guided DNA endonuclease in adaptive bacterial immunity. Science, 337(6096), 816–821. doi: 10.1126/science.1225829 [DOI] [PMC free article] [PubMed] [Google Scholar]
- Johnson WE, Li C, & Rabinovic A (2007). Adjusting batch effects in microarray expression data using empirical Bayes methods. Biostatistics, 8(1), 118–127. doi: 10.1093/biostatistics/kxj037 [DOI] [PubMed] [Google Scholar]
- Joshi A, & Mayr M (2018). In Aptamers They Trust: The Caveats of the SOMAscan Biomarker Discovery Platform from SomaLogic. Circulation, 138(22), 2482–2485. doi: 10.1161/CIRCULATIONAHA.118.036823 [DOI] [PMC free article] [PubMed] [Google Scholar]
- Kadowaki T (2000). Insights into insulin resistance and type 2 diabetes from knockout mouse models. J Clin Invest, 106(4), 459–465. doi: 10.1172/JCI10830 [DOI] [PMC free article] [PubMed] [Google Scholar]
- Kanasaki K, & Koya D (2011). Biology of obesity: lessons from animal models of obesity. J Biomed Biotechnol, 2011, 197636. doi: 10.1155/2011/197636 [DOI] [PMC free article] [PubMed] [Google Scholar]
- Kanehisa M, Furumichi M, Tanabe M, Sato Y, & Morishima K (2017). KEGG: new perspectives on genomes, pathways, diseases and drugs. Nucleic Acids Res, 45(D1), D353–D361. doi: 10.1093/nar/gkw1092 [DOI] [PMC free article] [PubMed] [Google Scholar]
- Karp JM, Yeh J, Eng G, Fukuda J, Blumling J, Suh KY, … Khademhosseini A (2007). Controlling size, shape and homogeneity of embryoid bodies using poly(ethylene glycol) microwells. Lab Chip, 7(6), 786–794. doi: 10.1039/b705085m [DOI] [PubMed] [Google Scholar]
- Kartashov AV, & Barski A (2015). BioWardrobe: an integrated platform for analysis of epigenomics and transcriptomics data. Genome Biol, 16, 158. doi: 10.1186/s13059-015-0720-3 [DOI] [PMC free article] [PubMed] [Google Scholar]
- Kasendra M, Tovaglieri A, Sontheimer-Phelps A, Jalili-Firoozinezhad S, Bein A, Chalkiadaki A, … Ingber DE (2018). Development of a primary human Small Intestine-on-a-Chip using biopsy-derived organoids. Scientific reports, 8(1), 2871. doi: 10.1038/s41598-018-21201-7 [DOI] [PMC free article] [PubMed] [Google Scholar]
- Kauffmann A, & Huber W (2010). Microarray data quality control improves the detection of differentially expressed genes. Genomics, 95(3), 138–142. doi: 10.1016/j.ygeno.2010.01.003 [DOI] [PubMed] [Google Scholar]
- Kent WJ, Sugnet CW, Furey TS, Roskin KM, Pringle TH, Zahler AM, & Haussler D (2002). The human genome browser at UCSC. Genome Res, 12(6), 996–1006. doi: 10.1101/gr.229102 [DOI] [PMC free article] [PubMed] [Google Scholar]
- Kim SY, Imoto S, & Miyano S (2003). Inferring gene networks from time series microarray data using dynamic Bayesian networks. Brief Bioinform, 4(3), 228–235. doi: 10.1093/bib/4.3.228 [DOI] [PubMed] [Google Scholar]
- Kitsak M, Sharma A, Menche J, Guney E, Ghiassian SD, Loscalzo J, & Barabasi AL (2016). Tissue Specificity of Human Disease Module. Scientific reports, 6, 35241. doi: 10.1038/srep35241 [DOI] [PMC free article] [PubMed] [Google Scholar]
- Kivela M, Arenas A, Barthelemy M, Gleeson JP, Moreno Y, & Porter MA (2014). Multilayer networks. Journal of Complex Networks, 2, 203–271. [Google Scholar]
- Kleinendorst L, Massink MPG, Cooiman MI, Savas M, van der Baan-Slootweg OH, Roelants RJ, … van Haelst MM (2018). Genetic obesity: next-generation sequencing results of 1230 patients with obesity. J Med Genet, 55(9), 578–586. doi: 10.1136/jmedgenet-2018-105315 [DOI] [PubMed] [Google Scholar]
- Kotlyar M, Pastrello C, Malik Z, & Jurisica I (2019). IID 2018 update: context-specific physical protein-protein interactions in human, model organisms and domesticated species. Nucleic Acids Res, 47(D1), D581–D589. doi: 10.1093/nar/gky1037 [DOI] [PMC free article] [PubMed] [Google Scholar]
- Kotlyar M, Rossos AEM, & Jurisica I (2017). Prediction of Protein-Protein Interactions. Curr Protoc Bioinformatics, 60, 8 2 1–8 2 14. doi: 10.1002/cpbi.38 [DOI] [PubMed] [Google Scholar]
- Kovacs IA, Luck K, Spirohn K, Wang Y, Pollis C, Schlabach S, … Barabasi AL (2019). Network-based prediction of protein interactions. Nature communications, 10(1), 1240. doi: 10.1038/s41467-019-09177-y [DOI] [PMC free article] [PubMed] [Google Scholar]
- Kramer A, Green J, Pollard J Jr., & Tugendreich S (2014). Causal analysis approaches in Ingenuity Pathway Analysis. Bioinformatics, 30(4), 523–530. doi: 10.1093/bioinformatics/btt703 [DOI] [PMC free article] [PubMed] [Google Scholar]
- Ku WL, Duggal G, Li Y, Girvan M, & Ott E (2012). Interpreting patterns of gene expression: signatures of coregulation, the data processing inequality, and triplet motifs. PLoS ONE, 7(2), e31969. doi: 10.1371/journal.pone.0031969 [DOI] [PMC free article] [PubMed] [Google Scholar]
- Lakkaraju H, Bach SH, & Leskovec J (2016). Interpretable Decision Sets: A Joint Framework for Description and Prediction. KDD, 2016, 1675–1684. doi: 10.1145/2939672.2939874 [DOI] [PMC free article] [PubMed] [Google Scholar]
- Lambert SA, Jolma A, Campitelli LF, Das PK, Yin Y, Albu M, … Weirauch MT (2018). The Human Transcription Factors. Cell, 172(4), 650–665. doi: 10.1016/j.cell.2018.01.029 [DOI] [PubMed] [Google Scholar]
- Lan J, Nunez Galindo A, Doecke J, Fowler C, Martins RN, Rainey-Smith SR, … Dayon L (2018). Systematic Evaluation of the Use of Human Plasma and Serum for Mass-Spectrometry-Based Shotgun Proteomics. Journal of proteome research, 17(4), 1426–1435. doi: 10.1021/acs.jproteome.7b00788 [DOI] [PubMed] [Google Scholar]
- Landesberger T, Kuijper A, Schreck T, Kohlhammer J, van Wijk JJ, Fekete JD, & Fellner D (2011). Visual analysis of large graphs: State-of-the-art and future research challenges. Computer Graphics Forum, 30, 1719–1749. [Google Scholar]
- Langfelder P, & Horvath S (2008). WGCNA: an R package for weighted correlation network analysis. BMC Bioinformatics, 9, 559. doi: 10.1186/1471-2105-9-559 [DOI] [PMC free article] [PubMed] [Google Scholar]
- Langhauser F, Casas AI, Dao VT, Guney E, Menche J, Geuss E, … Schmidt H (2018). A diseasome cluster-based drug repurposing of soluble guanylate cyclase activators from smooth muscle relaxation to direct neuroprotection. NPJ Syst Biol Appl, 4, 8. doi: 10.1038/s41540-017-0039-7 [DOI] [PMC free article] [PubMed] [Google Scholar]
- Lao T, Glass K, Qiu W, Polverino F, Gupta K, Morrow J, … Zhou X (2015). Haploinsufficiency of Hedgehog interacting protein causes increased emphysema induced by cigarette smoke through network rewiring. Genome medicine, 7(1), 12. doi: 10.1186/s13073-015-0137-3 [DOI] [PMC free article] [PubMed] [Google Scholar]
- Larsen SJ, Rottger R, Schmidt H, & Baumbach J (2019). E. coli gene regulatory networks are inconsistent with gene expression data. Nucleic Acids Res, 47(1), 85–92. doi: 10.1093/nar/gky1176 [DOI] [PMC free article] [PubMed] [Google Scholar]
- Larsen SJ, Schmidt HHW, & Baumbach J (2020). De Novo and Supervised Endophenotyping Using Network-Guided Ensemble Learning. Systems Medicine, 3.1, 8–21. [Google Scholar]
- Lazar C, Gatto L, Ferro M, Bruley C, & Burger T (2016). Accounting for the Multiple Natures of Missing Values in Label-Free Quantitative Proteomics Data Sets to Compare Imputation Strategies. Journal of proteome research, 15(4), 1116–1125. doi: 10.1021/acs.jproteome.5b00981 [DOI] [PubMed] [Google Scholar]
- Le Phillip P, Bahl A, & Ungar LH (2004). Using prior knowledge to improve genetic network reconstruction from microarray data. In Silico Biol, 4(3), 335–353. doi:2004040027 [pii] [PubMed] [Google Scholar]
- Le TD, Zhang J, Liu L, & Li J (2017). Computational methods for identifying miRNA sponge interactions. Brief Bioinform, 18(4), 577–590. doi: 10.1093/bib/bbw042 [DOI] [PubMed] [Google Scholar]
- Lee LY, & Loscalzo J (2019). Network Medicine in Pathobiology. Am J Pathol, 189(7), 1311–1326. doi: 10.1016/j.ajpath.2019.03.009 [DOI] [PMC free article] [PubMed] [Google Scholar]
- Lee RC, Feinbaum RL, & Ambros V (1993). The C. elegans heterochronic gene lin-4 encodes small RNAs with antisense complementarity to lin-14. Cell, 75(5), 843–854. doi: 10.1016/0092-8674(93)90529-y [DOI] [PubMed] [Google Scholar]
- Lee TI, & Young RA (2013). Transcriptional regulation and its misregulation in disease. Cell, 152(6), 1237–1251. doi: 10.1016/j.cell.2013.02.014 [DOI] [PMC free article] [PubMed] [Google Scholar]
- Leek JT, Scharpf RB, Bravo HC, Simcha D, Langmead B, Johnson WE, … Irizarry RA (2010). Tackling the widespread and critical impact of batch effects in high-throughput data. Nat Rev Genet, 11(10), 733–739. doi: 10.1038/nrg2825 [DOI] [PMC free article] [PubMed] [Google Scholar]
- Leek JT, & Storey JD (2007). Capturing heterogeneity in gene expression studies by surrogate variable analysis. PLoS Genet, 3(9), 1724–1735. doi: 10.1371/journal.pgen.0030161 [DOI] [PMC free article] [PubMed] [Google Scholar]
- Li Y, Nowak CM, Withers D, Pertsemlidis A, & Bleris L (2018). CRISPR-Based Editing Reveals Edge-Specific Effects in Biological Networks. CRISPR J, 1, 286–293. doi: 10.1089/crispr.2018.0018 [DOI] [PubMed] [Google Scholar]
- List M, Alcaraz N, Dissing-Hansen M, Ditzel HJ, Mollenhauer J, & Baumbach J (2016). KeyPathwayMinerWeb: online multi-omics network enrichment. Nucleic Acids Res, 44(W1), W98–W104. doi: 10.1093/nar/gkw373 [DOI] [PMC free article] [PubMed] [Google Scholar]
- Lizio M, Abugessaisa I, Noguchi S, Kondo A, Hasegawa A, Hon CC, … Kawaji H (2019). Update of the FANTOM web resource: expansion to provide additional transcriptome atlases. Nucleic Acids Res, 47(D1), D752–D758. doi: 10.1093/nar/gky1099 [DOI] [PMC free article] [PubMed] [Google Scholar]
- Lopes-Ramos CM, Kuijjer ML, Ogino S, Fuchs CS, DeMeo DL, Glass K, & Quackenbush J (2018). Gene Regulatory Network Analysis Identifies Sex-Linked Differences in Colon Cancer Drug Metabolism. Cancer Res, 78(19), 5538–5547. doi: 10.1158/0008-5472.CAN-18-0454 [DOI] [PMC free article] [PubMed] [Google Scholar]
- Lopes-Ramos CM, Paulson JN, Chen CY, Kuijjer ML, Fagny M, Platig J, … Glass K (2017). Regulatory network changes between cell lines and their tissues of origin. BMC Genomics, 18(1), 723. doi: 10.1186/s12864-017-4111-x [DOI] [PMC free article] [PubMed] [Google Scholar]
- Loscalzo J, & Barabasi AL (2011). Systems biology and the future of medicine. Wiley interdisciplinary reviews. Systems biology and medicine, 3(6), 619–627. doi: 10.1002/wsbm.144 [DOI] [PMC free article] [PubMed] [Google Scholar]
- Loscalzo J, Barabasi AL, & Silverman EK (Eds.). (2017). Network Medicine: Complex Systems in Human Disease and Therapeutics. Cambridge, MA: Harvard University Press. [Google Scholar]
- Lu H, Zhu X, Liu H, Skogerbo G, Zhang J, Zhang Y, … Chen R (2004). The interactome as a tree--an attempt to visualize the protein-protein interaction network in yeast. Nucleic Acids Res, 32(16), 4804–4811. doi: 10.1093/nar/gkh814 [DOI] [PMC free article] [PubMed] [Google Scholar]
- Luck K, Sheynkman GM, Zhang I, & Vidal M (2017). Proteome-Scale Human Interactomics. Trends Biochem Sci, 42(5), 342–354. doi: 10.1016/j.tibs.2017.02.006 [DOI] [PMC free article] [PubMed] [Google Scholar]
- Lutz TA, & Woods SC (2012). Overview of animal models of obesity. Curr Protoc Pharmacol, Chapter 5, Unit5 61. doi: 10.1002/0471141755.ph0561s58 [DOI] [PMC free article] [PubMed] [Google Scholar]
- Malek M, Ibragimov R, Albrecht M, & Baumbach J (2016). CytoGEDEVO-global alignment of biological networks with Cytoscape. Bioinformatics, 32(8), 1259–1261. doi: 10.1093/bioinformatics/btv732 [DOI] [PubMed] [Google Scholar]
- Mao X, Ma Q, Zhou C, Chen X, Zhang H, Yang J, … Xu Y (2014). DOOR 2.0: presenting operons and their functions through dynamic and integrated views. Nucleic Acids Res, 42(Database issue), D654–659. doi: 10.1093/nar/gkt1048 [DOI] [PMC free article] [PubMed] [Google Scholar]
- Marai GE, Pinaud B, Buhler K, Lex A, & Morris JH (2019). Ten simple rules to create biological network figures for communication. PLoS computational biology, 15(9), e1007244. doi: 10.1371/journal.pcbi.1007244 [DOI] [PMC free article] [PubMed] [Google Scholar]
- Marbach D, Costello JC, Kuffner R, Vega NM, Prill RJ, Camacho DM, … Stolovitzky G (2012). Wisdom of crowds for robust gene network inference. Nat Methods, 9(8), 796–804. doi: 10.1038/nmeth.2016 [DOI] [PMC free article] [PubMed] [Google Scholar]
- Marbach D, Prill RJ, Schaffter T, Mattiussi C, Floreano D, & Stolovitzky G (2010). Revealing strengths and weaknesses of methods for gene network inference. Proc Natl Acad Sci U S A, 107(14), 6286–6291. doi: 10.1073/pnas.0913357107 [DOI] [PMC free article] [PubMed] [Google Scholar]
- Margolin AA, Nemenman I, Basso K, Wiggins C, Stolovitzky G, Dalla Favera R, & Califano A (2006). ARACNE: an algorithm for the reconstruction of gene regulatory networks in a mammalian cellular context. BMC Bioinformatics, 7 Suppl 1, S7. doi: 10.1186/1471-2105-7-S1-S7 [DOI] [PMC free article] [PubMed] [Google Scholar]
- Martens JH, & Stunnenberg HG (2013). BLUEPRINT: mapping human blood cell epigenomes. Haematologica, 98(10), 1487–1489. doi: 10.3324/haematol.2013.094243 [DOI] [PMC free article] [PubMed] [Google Scholar]
- Martin TC, Yet I, Tsai PC, & Bell JT (2015). coMET: visualisation of regional epigenome-wide association scan results and DNA co-methylation patterns. BMC Bioinformatics, 16, 131. doi: 10.1186/s12859-015-0568-2 [DOI] [PMC free article] [PubMed] [Google Scholar]
- McCall MN, Illei PB, & Halushka MK (2016). Complex Sources of Variation in Tissue Expression Data: Analysis of the GTEx Lung Transcriptome. Am J Hum Genet, 99(3), 624–635. doi: 10.1016/j.ajhg.2016.07.007 [DOI] [PMC free article] [PubMed] [Google Scholar]
- McGeachie MJ, Chang HH, & Weiss ST (2014). CGBayesNets: conditional Gaussian Bayesian network learning and inference with mixed discrete and continuous data. PLoS computational biology, 10(6), e1003676. doi: 10.1371/journal.pcbi.1003676 [DOI] [PMC free article] [PubMed] [Google Scholar]
- McGeachie MJ, Dahlin A, Qiu W, Croteau-Chonka DC, Savage J, Wu AC, … Lasky-Su JA (2015). The metabolomics of asthma control: a promising link between genetics and disease. Immun Inflamm Dis, 3(3), 224–238. doi: 10.1002/iid3.61 [DOI] [PMC free article] [PubMed] [Google Scholar]
- McGeachie MJ, Davis JS, Kho AT, Dahlin A, Sordillo JE, Sun M, … Tantisira KG (2017). Asthma remission: Predicting future airways responsiveness using an miRNA network. J Allergy Clin Immunol, 140(2), 598–600 e598. doi: 10.1016/j.jaci.2017.01.023 [DOI] [PMC free article] [PubMed] [Google Scholar]
- McGeachie MJ, Sordillo JE, Gibson T, Weinstock GM, Liu YY, Gold DR, … Litonjua A (2016). Longitudinal Prediction of the Infant Gut Microbiome with Dynamic Bayesian Networks. Scientific reports, 6, 20359. doi: 10.1038/srep20359 [DOI] [PMC free article] [PubMed] [Google Scholar]
- McLean CY, Bristor D, Hiller M, Clarke SL, Schaar BT, Lowe CB, … Bejerano G (2010). GREAT improves functional interpretation of cis-regulatory regions. Nat Biotechnol, 28(5), 495–501. doi: 10.1038/nbt.1630 [DOI] [PMC free article] [PubMed] [Google Scholar]
- Menche J, Sharma A, Kitsak M, Ghiassian SD, Vidal M, Loscalzo J, & Barabasi AL (2015). Disease networks. Uncovering disease-disease relationships through the incomplete interactome. Science, 347(6224), 1257601. doi: 10.1126/science.1257601 [DOI] [PMC free article] [PubMed] [Google Scholar]
- Meyer MJ, Das J, Wang X, & Yu H (2013). INstruct: a database of high-quality 3D structurally resolved protein interactome networks. Bioinformatics, 29(12), 1577–1579. doi: 10.1093/bioinformatics/btt181 [DOI] [PMC free article] [PubMed] [Google Scholar]
- Mlecnik B, Scheideler M, Hackl H, Hartler J, Sanchez-Cabo F, & Trajanoski Z (2005). PathwayExplorer: web service for visualizing high-throughput expression data on biological pathways. Nucleic Acids Res, 33(Web Server issue), W633–637. doi: 10.1093/nar/gki391 [DOI] [PMC free article] [PubMed] [Google Scholar]
- Mooney SJ, & Pejaver V (2018). Big Data in Public Health: Terminology, Machine Learning, and Privacy. Annu Rev Public Health, 39, 95–112. doi: 10.1146/annurev-publhealth-040617-014208 [DOI] [PMC free article] [PubMed] [Google Scholar]
- Mordelet F, & Vert JP (2008). SIRENE: supervised inference of regulatory networks. Bioinformatics, 24(16), i76–82. doi: 10.1093/bioinformatics/btn273 [DOI] [PubMed] [Google Scholar]
- Musunuru K, Bernstein D, Cole FS, Khokha MK, Lee FS, Lin S, … Luo XJ (2018). Functional Assays to Screen and Dissect Genomic Hits: Doubling Down on the National Investment in Genomic Research. Circ Genom Precis Med, 11(4), e002178. doi: 10.1161/CIRCGEN.118.002178 [DOI] [PMC free article] [PubMed] [Google Scholar]
- Muthuswamy SK (2017). Bringing together the organoid field: from early beginnings to the road ahead. Development, 144(6), 963–967. doi: 10.1242/dev.144444 [DOI] [PubMed] [Google Scholar]
- Nacmias B, Bagnoli S, Piaceri I, & Sorbi S (2018). Genetic Heterogeneity of Alzheimer’s Disease: Embracing Research Partnerships. J Alzheimers Dis, 62(3), 903–911. doi: 10.3233/JAD-170570 [DOI] [PMC free article] [PubMed] [Google Scholar]
- Napoli C, Benincasa G, & Loscalzo J (2019). Epigenetic Inheritance Underlying Pulmonary Arterial Hypertension. Arteriosclerosis, thrombosis, and vascular biology, 39(4), 653–664. doi: 10.1161/ATVBAHA.118.312262 [DOI] [PMC free article] [PubMed] [Google Scholar]
- Napoli C, Crudele V, Soricelli A, Al-Omran M, Vitale N, Infante T, & Mancini FP (2012). Primary prevention of atherosclerosis: a clinical challenge for the reversal of epigenetic mechanisms? Circulation, 125(19), 2363–2373. doi: 10.1161/CIRCULATIONAHA.111.085787 [DOI] [PubMed] [Google Scholar]
- Natori K, Uto M, Nishiyama Y, Kawano S, & Ueno M (2015). Constraint-based Learning Bayesian Networks Using Bayes Factor. In Suzuki J & Ueno M (Eds.), Advanced Methodologies for Bayesian Networks. AMBN 2015 Lecture Notes in Computer Science (Vol. 9505, pp. 15–31): Springer, Cham. [Google Scholar]
- Navlakha S, & Kingsford C (2010). The power of protein interaction networks for associating genes with diseases. Bioinformatics, 26(8), 1057–1063. doi: 10.1093/bioinformatics/btq076 [DOI] [PMC free article] [PubMed] [Google Scholar]
- Neph S, Stergachis AB, Reynolds A, Sandstrom R, Borenstein E, & Stamatoyannopoulos JA (2012). Circuitry and dynamics of human transcription factor regulatory networks. Cell, 150(6), 1274–1286. doi: 10.1016/j.cell.2012.04.040 [DOI] [PMC free article] [PubMed] [Google Scholar]
- Nikolayeva I, Guitart Pla O, & Schwikowski B (2018). Network module identification-A widespread theoretical bias and best practices. Methods, 132, 19–25. doi: 10.1016/j.ymeth.2017.08.008 [DOI] [PMC free article] [PubMed] [Google Scholar]
- Nishihara R, Glass K, Mima K, Hamada T, Nowak JA, Qian ZR, … Onnela JP (2017). Biomarker correlation network in colorectal carcinoma by tumor anatomic location. BMC Bioinformatics, 18(1), 304. doi: 10.1186/s12859-017-1718-5 [DOI] [PMC free article] [PubMed] [Google Scholar]
- Noell G, Faner R, & Agusti A (2018). From systems biology to P4 medicine: applications in respiratory medicine. Eur Respir Rev, 27(147). doi: 10.1183/16000617.0110-2017 [DOI] [PMC free article] [PubMed] [Google Scholar]
- Norton SS, Vaquero-Garcia J, Lahens NF, Grant GR, & Barash Y (2018). Outlier detection for improved differential splicing quantification from RNA-Seq experiments with replicates. Bioinformatics, 34(9), 1488–1497. doi: 10.1093/bioinformatics/btx790 [DOI] [PMC free article] [PubMed] [Google Scholar]
- Ormel J, Hartman CA, & Snieder H (2019). The genetics of depression: successful genome-wide association studies introduce new challenges. Transl Psychiatry, 9(1), 114. doi: 10.1038/s41398-019-0450-5 [DOI] [PMC free article] [PubMed] [Google Scholar]
- Ou KL, & Hosseinkhani H (2014). Development of 3D in vitro technology for medical applications. Int J Mol Sci, 15(10), 17938–17962. doi: 10.3390/ijms151017938 [DOI] [PMC free article] [PubMed] [Google Scholar]
- Paci P, Colombo T, & Farina L (2014). Computational analysis identifies a sponge interaction network between long non-coding RNAs and messenger RNAs in human breast cancer. BMC systems biology, 8, 83. doi: 10.1186/1752-0509-8-83 [DOI] [PMC free article] [PubMed] [Google Scholar]
- Paci P, Colombo T, Fiscon G, Gurtner A, Pavesi G, & Farina L (2017). SWIM: a computational tool to unveiling crucial nodes in complex biological networks. Scientific reports, 7, 44797. doi: 10.1038/srep44797 [DOI] [PMC free article] [PubMed] [Google Scholar]
- Pazin MJ (2015). Using the ENCODE Resource for Functional Annotation of Genetic Variants. Cold Spring Harb Protoc, 2015(6), 522–536. doi: 10.1101/pdb.top084988 [DOI] [PMC free article] [PubMed] [Google Scholar]
- Perer A, & Sun J (2012). MatrixFlow: temporal network visual analytics to track symptom evolution during disease progression. AMIA Annu Symp Proc, 2012, 716–725. [PMC free article] [PubMed] [Google Scholar]
- Petti M, Bizzarri D, Verrienti A, Falcone R, & Farina L (2019). Connectivity significance for disease gene prioritization in an expanding universe. IEEE/ACM Trans Comput Biol Bioinform. doi: 10.1109/TCBB.2019.2938512 [DOI] [PubMed] [Google Scholar]
- Pique-Regi R, Degner JF, Pai AA, Gaffney DJ, Gilad Y, & Pritchard JK (2011). Accurate inference of transcription factor binding from DNA sequence and chromatin accessibility data. Genome Res, 21(3), 447–455. doi: 10.1101/gr.112623.110 [DOI] [PMC free article] [PubMed] [Google Scholar]
- Plum L, Wunderlich FT, Baudler S, Krone W, & Bruning JC (2005). Transgenic and knockout mice in diabetes research: novel insights into pathophysiology, limitations, and perspectives. Physiology (Bethesda), 20, 152–161. doi: 10.1152/physiol.00049.2004 [DOI] [PubMed] [Google Scholar]
- Przybyla LM, & Voldman J (2012). Attenuation of extrinsic signaling reveals the importance of matrix remodeling on maintenance of embryonic stem cell self-renewal. Proc Natl Acad Sci U S A, 109(3), 835–840. doi: 10.1073/pnas.1103100109 [DOI] [PMC free article] [PubMed] [Google Scholar]
- Qiu W, Guo F, Glass K, Yuan GC, Quackenbush J, Zhou X, & Tantisira KG (2018). Differential connectivity of gene regulatory networks distinguishes corticosteroid response in asthma. J Allergy Clin Immunol, 141(4), 1250–1258. doi: 10.1016/j.jaci.2017.05.052 [DOI] [PMC free article] [PubMed] [Google Scholar]
- Rao VS, Srinivas K, Sujini GN, & Kumar GN (2014). Protein-protein interaction detection: methods and analysis. Int J Proteomics, 2014, 147648. doi: 10.1155/2014/147648 [DOI] [PMC free article] [PubMed] [Google Scholar]
- Ravasz E, Somera AL, Mongru DA, Oltvai ZN, & Barabasi AL (2002). Hierarchical organization of modularity in metabolic networks. Science, 297(5586), 1551–1555. doi: 10.1126/science.1073374 [DOI] [PubMed] [Google Scholar]
- Reinhart BJ, Slack FJ, Basson M, Pasquinelli AE, Bettinger JC, Rougvie AE, … Ruvkun G (2000). The 21-nucleotide let-7 RNA regulates developmental timing in Caenorhabditis elegans. Nature, 403(6772), 901–906. doi: 10.1038/35002607 [DOI] [PubMed] [Google Scholar]
- Ristevski B, & Chen M (2018). Big Data Analytics in Medicine and Healthcare. J Integr Bioinform, 15(3). doi: 10.1515/jib-2017-0030 [DOI] [PMC free article] [PubMed] [Google Scholar]
- Robinson MD, & Pelizzola M (2015). Computational epigenomics: challenges and opportunities. Front Genet, 6, 88. doi: 10.3389/fgene.2015.00088 [DOI] [PMC free article] [PubMed] [Google Scholar]
- Rogers AJ, McGeachie M, Baron RM, Gazourian L, Haspel JA, Nakahira K, … Choi AM (2014). Metabolomic derangements are associated with mortality in critically ill adult patients. PLoS ONE, 9(1), e87538. doi: 10.1371/journal.pone.0087538 [DOI] [PMC free article] [PubMed] [Google Scholar]
- Rolland T, Tasan M, Charloteaux B, Pevzner SJ, Zhong Q, Sahni N, … Vidal M (2014). A proteome-scale map of the human interactome network. Cell, 159(5), 1212–1226. doi: 10.1016/j.cell.2014.10.050 [DOI] [PMC free article] [PubMed] [Google Scholar]
- Salmena L, Poliseno L, Tay Y, Kats L, & Pandolfi PP (2011). A ceRNA hypothesis: the Rosetta Stone of a hidden RNA language? Cell, 146(3), 353–358. doi: 10.1016/j.cell.2011.07.014 [DOI] [PMC free article] [PubMed] [Google Scholar]
- Samokhin AO, Stephens T, Wertheim BM, Wang RS, Vargas SO, Yung LM, … Maron BA (2018). NEDD9 targets COL3A1 to promote endothelial fibrosis and pulmonary arterial hypertension. Science translational medicine, 10(445). doi: 10.1126/scitranslmed.aap7294 [DOI] [PMC free article] [PubMed] [Google Scholar]
- Sances S, Ho R, Vatine G, West D, Laperle A, Meyer A, … Svendsen CN (2018). Human iPSC-Derived Endothelial Cells and Microengineered Organ-Chip Enhance Neuronal Development. Stem Cell Reports, 10(4), 1222–1236. doi: 10.1016/j.stemcr.2018.02.012 [DOI] [PMC free article] [PubMed] [Google Scholar]
- Sanchez-Vega F, Mina M, Armenia J, Chatila WK, Luna A, La KC, … Schultz N (2018). Oncogenic Signaling Pathways in The Cancer Genome Atlas. Cell, 173(2), 321–337 e310. doi: 10.1016/j.cell.2018.03.035 [DOI] [PMC free article] [PubMed] [Google Scholar]
- Scanagatta M, Salmeron A, & Stella F (2019). A survey of Bayesian network structure learning from data. Progress in Artificial Intelligence, 8, 425–439. [Google Scholar]
- Schwarz AJ, & McGonigle J (2011). Negative edges and soft thresholding in complex network analysis of resting state functional connectivity data. Neuroimage, 55(3), 1132–1146. doi: 10.1016/j.neuroimage.2010.12.047 [DOI] [PubMed] [Google Scholar]
- Scutari M, Graafland CE, & Gutierrez JM (2019). Who learns better Bayesian network structures: Accuracy and speed of structure learning algorithms. International Journal of Approximate Reasoning, 115, 235–253. [Google Scholar]
- Sen ES, Dean P, Yarram-Smith L, Bierzynska A, Woodward G, Buxton C, … Saleem MA (2017). Clinical genetic testing using a custom-designed steroid-resistant nephrotic syndrome gene panel: analysis and recommendations. J Med Genet, 54(12), 795–804. doi: 10.1136/jmedgenet-2017-104811 [DOI] [PMC free article] [PubMed] [Google Scholar]
- Shah MY, Ferracin M, Pileczki V, Chen B, Redis R, Fabris L, … Calin GA (2018). Cancer-associated rs6983267 SNP and its accompanying long noncoding RNA CCAT2 induce myeloid malignancies via unique SNP-specific RNA mutations. Genome Res, 28(4), 432–447. doi: 10.1101/gr.225128.117 [DOI] [PMC free article] [PubMed] [Google Scholar]
- Sharma A, Halu A, Decano JL, Padi M, Liu YY, Prasad RB, … Loscalzo J (2018). Controllability in an islet specific regulatory network identifies the transcriptional factor NFATC4, which regulates Type 2 Diabetes associated genes. NPJ Syst Biol Appl, 4, 25. doi: 10.1038/s41540-018-0057-0 [DOI] [PMC free article] [PubMed] [Google Scholar]
- Sharma A, Menche J, Huang C, Ort T, Zhou X, Ghiassian S, … Barabasi AL (2015). A disease module in the interactome explains disease heterogeneity, drug response and captures novel pathways and genes for asthma. Human Molecular Genetics, 24, 3005–3020. [DOI] [PMC free article] [PubMed] [Google Scholar]
- Sheffield NC, & Bock C (2016). LOLA: enrichment analysis for genomic region sets and regulatory elements in R and Bioconductor. Bioinformatics, 32(4), 587–589. doi: 10.1093/bioinformatics/btv612 [DOI] [PMC free article] [PubMed] [Google Scholar]
- Shneiderman B, Plaisant C, & Hesse BW (2013). Improving healthcare with interactive visualization. Computer, 46, 58–66. [Google Scholar]
- Silverman EK (2018). Applying Functional Genomics to Chronic Obstructive Pulmonary Disease. Annals of the American Thoracic Society, 15(Supplement_4), S239–S242. doi: 10.1513/AnnalsATS.201808-530MG [DOI] [PMC free article] [PubMed] [Google Scholar]
- Singh L (2007). Exploring graph mining approaches for dynamic heterogeneous networks. Paper presented at the Proceedings of the National Science Foundation Symposium on Next Generation of Data Mining and Cyber-Enabled Discovery for Innovation, Baltimore, MD. [Google Scholar]
- Smits AH, & Vermeulen M (2016). Characterizing Protein-Protein Interactions Using Mass Spectrometry: Challenges and Opportunities. Trends Biotechnol, 34(10), 825–834. doi: 10.1016/j.tibtech.2016.02.014 [DOI] [PubMed] [Google Scholar]
- Smoot ME, Ono K, Ruscheinski J, Wang PL, & Ideker T (2011). Cytoscape 2.8: new features for data integration and network visualization. Bioinformatics, 27(3), 431–432. doi: 10.1093/bioinformatics/btq675 [DOI] [PMC free article] [PubMed] [Google Scholar]
- Snider J, Kotlyar M, Saraon P, Yao Z, Jurisica I, & Stagljar I (2015). Fundamentals of protein interaction network mapping. Mol Syst Biol, 11(12), 848. doi: 10.15252/msb.20156351 [DOI] [PMC free article] [PubMed] [Google Scholar]
- Sonawane AR, Platig J, Fagny M, Chen CY, Paulson JN, Lopes-Ramos CM, … Kuijjer ML (2017). Understanding Tissue-Specific Gene Regulation. Cell Rep, 21(4), 1077–1088. doi: 10.1016/j.celrep.2017.10.001 [DOI] [PMC free article] [PubMed] [Google Scholar]
- Sonawane AR, Weiss ST, Glass K, & Sharma A (2019). Network Medicine in the Age of Biomedical Big Data. Front Genet, 10, 294. doi: 10.3389/fgene.2019.00294 [DOI] [PMC free article] [PubMed] [Google Scholar]
- Stanfill BA, Nakayasu ES, Bramer LM, Thompson AM, Ansong CK, Clauss TR, … Group TS (2018). Quality Control Analysis in Real-time (QC-ART): A Tool for Real-time Quality Control Assessment of Mass Spectrometry-based Proteomics Data. Molecular & cellular proteomics : MCP, 17(9), 1824–1836. doi: 10.1074/mcp.RA118.000648 [DOI] [PMC free article] [PubMed] [Google Scholar]
- Szklarczyk D, Franceschini A, Wyder S, Forslund K, Heller D, Huerta-Cepas J, … von Mering C (2015). STRING v10: protein-protein interaction networks, integrated over the tree of life. Nucleic Acids Res, 43(Database issue), D447–452. doi: 10.1093/nar/gku1003 [DOI] [PMC free article] [PubMed] [Google Scholar]
- Tantardini M, Ieva F, Tajoli L, & Piccardi C (2019). Comparing methods for comparing networks. Scientific reports, 9(1), 17557. doi: 10.1038/s41598-019-53708-y [DOI] [PMC free article] [PubMed] [Google Scholar]
- Tay Y, Rinn J, & Pandolfi PP (2014). The multilayered complexity of ceRNA crosstalk and competition. Nature, 505(7483), 344–352. doi: 10.1038/nature12986 [DOI] [PMC free article] [PubMed] [Google Scholar]
- Thomas JJ, & Cook KA (2005). Illuminating the Path: The Research and Development Agenda for Visual Analytics. Retrieved from
- Tissue-engineered disease models. (2018). Nat Biomed Eng, 2(12), 879–880. doi: 10.1038/s41551-018-0339-2 [DOI] [PubMed] [Google Scholar]
- Townsend MK, Clish CB, Kraft P, Wu C, Souza AL, Deik AA, … Wolpin BM (2013). Reproducibility of metabolomic profiles among men and women in 2 large cohort studies. Clin Chem, 59(11), 1657–1667. doi: 10.1373/clinchem.2012.199133 [DOI] [PMC free article] [PubMed] [Google Scholar]
- Tripathi S, Dehmer M, & Emmert-Streib F (2014). NetBioV: an R package for visualizing large network data in biology and medicine. Bioinformatics, 30(19), 2834–2836. doi: 10.1093/bioinformatics/btu384 [DOI] [PubMed] [Google Scholar]
- Ulitsky I, Krishnamurthy A, Karp RM, & Shamir R (2010). DEGAS: de novo discovery of dysregulated pathways in human diseases. PLoS ONE, 5(10), e13367. doi: 10.1371/journal.pone.0013367 [DOI] [PMC free article] [PubMed] [Google Scholar]
- van den Elzen S, & van Wijk JJ (2014). Multivariate Network Exploration and Presentation: From Detail to Overview via Selections and Aggregations. IEEE Trans Vis Comput Graph, 20(12), 2310–2319. doi: 10.1109/TVCG.2014.2346441 [DOI] [PubMed] [Google Scholar]
- Vandin F, Clay P, Upfal E, & Raphael BJ (2012). Discovery of mutated subnetworks associated with clinical data in cancer. Pac Symp Biocomput, 55–66. [PubMed] [Google Scholar]
- Vanschoren J, van Rijn JN, Bischl B, & Torgo L (2013). OpenML: Networked science in machine learning. SIGKDD Explorations, 15(2), 49–60. doi: 10.1145/2641190/2641198 [DOI] [Google Scholar]
- Vargas AJ, Quackenbush J, & Glass K (2016). Diet-induced weight loss leads to a switch in gene regulatory network control in the rectal mucosa. Genomics, 108(3-4), 126–133. doi: 10.1016/j.ygeno.2016.08.001 [DOI] [PMC free article] [PubMed] [Google Scholar]
- Vidal M, Cusick ME, & Barabasi AL (2011). Interactome networks and human disease. Cell, 144(6), 986–998. doi:S0092-8674(11)00130-9 [pii] 10.1016/j.cell.2011.02.016 [DOI] [PMC free article] [PubMed] [Google Scholar]
- Viggiano A, Cacciola G, Widmer DA, & Viggiano D (2015). Anxiety as a neurodevelopmental disorder in a neuronal subpopulation: Evidence from gene expression data. Psychiatry Res, 228(3), 729–740. doi: 10.1016/j.psychres.2015.05.032 [DOI] [PubMed] [Google Scholar]
- Viggiano D (2008). The hyperactive syndrome: metanalysis of genetic alterations, pharmacological treatments and brain lesions which increase locomotor activity. Behav Brain Res, 194(1), 1–14. doi: 10.1016/j.bbr.2008.06.033 [DOI] [PubMed] [Google Scholar]
- Vignes M, Vandel J, Allouche D, Ramadan-Alban N, Cierco-Ayrolles C, Schiex T, … de Givry S (2011). Gene regulatory network reconstruction using Bayesian networks, the Dantzig Selector, the Lasso and their meta-analysis. PLoS ONE, 6(12), e29165. doi: 10.1371/journal.pone.0029165 [DOI] [PMC free article] [PubMed] [Google Scholar]
- Wang L, Wang B, Liu J, & Quan Z (2019). Construction and analysis of a spinal cord injury competitive endogenous RNA network based on the expression data of long noncoding, micro and messenger RNAs. Mol Med Rep, 19(4), 3021–3034. doi: 10.3892/mmr.2019.9979 [DOI] [PMC free article] [PubMed] [Google Scholar]
- Wang RS, & Loscalzo J (2018). Network-Based Disease Module Discovery by a Novel Seed Connector Algorithm with Pathobiological Implications. J Mol Biol, 430(18 Pt A), 2939–2950. doi: 10.1016/j.jmb.2018.05.016 [DOI] [PMC free article] [PubMed] [Google Scholar]
- Wang X, & Jin Y (2017). Predicted networks of protein-protein interactions in Stegodyphus mimosarum by cross-species comparisons. BMC Genomics, 18(1), 716. doi: 10.1186/s12864-017-4085-8 [DOI] [PMC free article] [PubMed] [Google Scholar]
- Wang Z, Guo Y, & Gong H (2018). An Integrative Analysis of Time-varying Regulatory Networks From High-dimensional Data. Proc IEEE Int Conf Big Data, 2018, 3798–3807. doi: 10.1109/BigData.2018.8622361 [DOI] [PMC free article] [PubMed] [Google Scholar]
- Wijetunga NA, Johnston AD, Maekawa R, Delahaye F, Ulahannan N, Kim K, & Greally JM (2017). SMITE: an R/Bioconductor package that identifies network modules by integrating genomic and epigenomic information. BMC Bioinformatics, 18(1), 41. doi: 10.1186/s12859-017-1477-3 [DOI] [PMC free article] [PubMed] [Google Scholar]
- Willyard C (2018). The mice with human tumours: Growing pains for a popular cancer model. Nature, 560(7717), 156–157. doi: 10.1038/d41586-018-05890-8 [DOI] [PubMed] [Google Scholar]
- Wolkenhauer O, Auffray C, Jaster R, Steinhoff G, & Dammann O (2013). The road from systems biology to systems medicine. Pediatr Res, 73(4 Pt 2), 502–507. doi: 10.1038/pr.2013.4 [DOI] [PubMed] [Google Scholar]
- Wolkenhauer O, Fell D, De Meyts P, Bluthgen N, Herzel H, Le Novere N, … van Leeuwen I (2009). SysBioMed report: advancing systems biology for medical applications. IET Syst Biol, 3(3), 131–136. doi: 10.1049/iet-syb.2009.0005 [DOI] [PubMed] [Google Scholar]
- Xue A, Wu Y, Zhu Z, Zhang F, Kemper KE, Zheng Z, … Yang J (2018). Genome-wide association analyses identify 143 risk variants and putative regulatory mechanisms for type 2 diabetes. Nature communications, 9(1), 2941. doi: 10.1038/s41467-018-04951-w [DOI] [PMC free article] [PubMed] [Google Scholar]
- Yildirim MA, Goh KI, Cusick ME, Barabasi AL, & Vidal M (2007). Drug-target network. Nat Biotechnol, 25(10), 1119–1126. doi: 10.1038/nbt1338 [DOI] [PubMed] [Google Scholar]
- Yu D, Kim M, Xiao G, & Hwang TH (2013). Review of biological network data and its applications. Genomics Inform, 11(4), 200–210. doi: 10.5808/GI.2013.11.4.200 [DOI] [PMC free article] [PubMed] [Google Scholar]
- Yu J, Smith VA, Wang PP, Hartemink AJ, & Jarvis ED (2004). Advances to Bayesian network inference for generating causal networks from observational biological data. Bioinformatics, 20(18), 3594–3603. doi: 10.1093/bioinformatics/bth448 [DOI] [PubMed] [Google Scholar]
- Yu MK, Ma J, Fisher J, Kreisberg JF, Raphael BJ, & Ideker T (2018). Visible Machine Learning for Biomedicine. Cell, 173(7), 1562–1565. doi: 10.1016/j.cell.2018.05.056 [DOI] [PMC free article] [PubMed] [Google Scholar]
- Yuan Y, & Weidhaas JB (2019). Functional microRNA binding site variants. Molecular oncology, 13(1), 4–8. doi: 10.1002/1878-0261.12421 [DOI] [PMC free article] [PubMed] [Google Scholar]
- Zanin M, Chorbev I, Stres B, Stalidzans E, Vera J, Tieri P, … Schmidt H (2019). Community effort endorsing multiscale modelling, multiscale data science and multiscale computing for systems medicine. Brief Bioinform, 20(3), 1057–1062. doi: 10.1093/bib/bbx160 [DOI] [PMC free article] [PubMed] [Google Scholar]
- Zhan L, Jenkins LM, Wolfson OE, GadElkarim JJ, Nocito K, Thompson PM, … Leow AD (2017). The significance of negative correlations in brain connectivity. J Comp Neurol, 525(15), 3251–3265. doi: 10.1002/cne.24274 [DOI] [PMC free article] [PubMed] [Google Scholar]
- Zhang B, & Horvath S (2005). A general framework for weighted gene co-expression network analysis. Stat Appl Genet Mol Biol, 4, Article17. doi: 10.2202/1544-6115.1128 [DOI] [PubMed] [Google Scholar]
- Zhang QC, Petrey D, Deng L, Qiang L, Shi Y, Thu CA, … Honig B (2012). Structure-based prediction of protein-protein interactions on a genome-wide scale. Nature, 490(7421), 556–560. doi: 10.1038/nature11503 [DOI] [PMC free article] [PubMed] [Google Scholar]
- Zhang X, Zhao J, Hao JK, Zhao XM, & Chen L (2015). Conditional mutual inclusive information enables accurate quantification of associations in gene regulatory networks. Nucleic Acids Res, 43(5), e31. doi: 10.1093/nar/gku1315 [DOI] [PMC free article] [PubMed] [Google Scholar]
- Zhang Y, & Ling C (2018). A strategy to apply machine learning to small datasets in materials science. npj Computational Materials, 4. doi: 10.1038/s41524-018-0081-z [DOI] [Google Scholar]
- Zhou W, Laird PW, & Shen H (2017). Comprehensive characterization, annotation and innovative use of Infinium DNA methylation BeadChip probes. Nucleic Acids Res, 45(4), e22. doi: 10.1093/nar/gkw967 [DOI] [PMC free article] [PubMed] [Google Scholar]
- Zhou X, Maricque B, Xie M, Li D, Sundaram V, Martin EA, … Wang T (2011). The Human Epigenome Browser at Washington University. Nat Methods, 8(12), 989–990. doi: 10.1038/nmeth.1772 [DOI] [PMC free article] [PubMed] [Google Scholar]
- Zhou X, Xu X, Wang J, Lin J, & Chen W (2015). Identifying miRNA/mRNA negative regulation pairs in colorectal cancer. Scientific reports, 5, 12995. doi: 10.1038/srep12995 [DOI] [PMC free article] [PubMed] [Google Scholar]
- Zou M, & Conzen SD (2005). A new dynamic Bayesian network (DBN) approach for identifying gene regulatory networks from time course microarray data. Bioinformatics, 21(1), 71–79. doi: 10.1093/bioinformatics/bth463 [DOI] [PubMed] [Google Scholar]