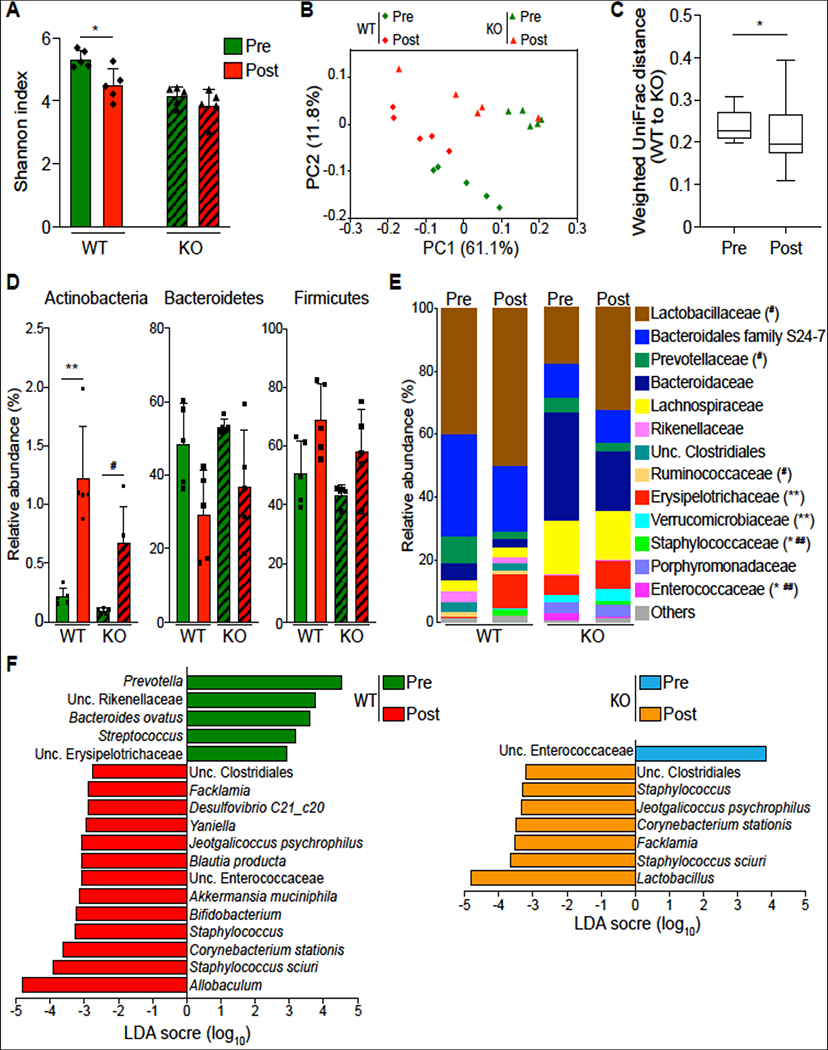
Figure 6. Cohousing contributes to partial exchange of fecal microbiota in DRA KO and WT mice.
Shannon index of fecal microbiota in post-cohoused DRA KO and WT mice compared to their pre-cohoused counterparts (n=5) (Figure A). Weighted Unifrac PCoA plot showing community variation in indicated mouse groups (Figure B). Weighted Unifrac distances between cohoused mice and their pre-cohoused controls showing the reduced similarity between DRA KO and WT mice after cohousing (Figure C). Averaged relative abundances of top phyla (Figure D) and families (Figure E) in pre- and post-cohoused DRA KO and WT mice. LEfSe plots showing differentiating taxa (species level) between post-cohoused mice and their pre-cohoused controls (Figure F). *p <0.05, **p <0.01, pre-cohoused WT vs. post-cohoused WT; #p <0.05, ##P <0.01, pre-cohoused KO vs. post-cohoused KO.

