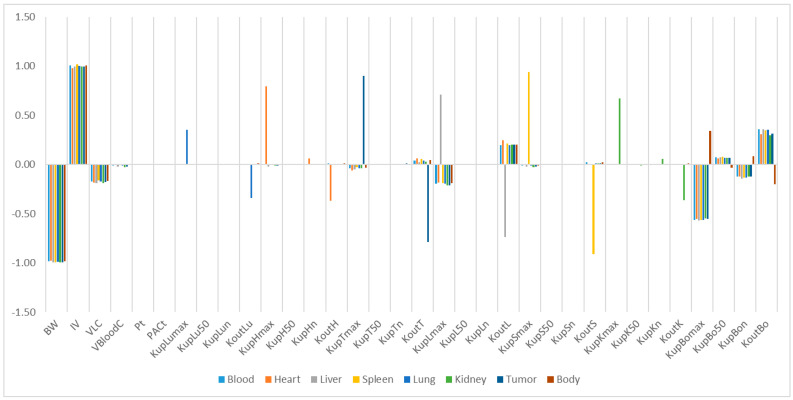
Figure 7.
Relative sensitivity analyses for the parameters of mPEG5k-9.09%-80 nm NP concentrations in mouse tissues. Positive values represent PCL-P2 NP concentration increases in the organ when the parameter value increases, while negative values indicate PCL-P2 NP concentration decreases in the organ when the parameter value increases.

