

Summary
We describe a physics-based learning model for predicting the immunogenicity of cytotoxic T lymphocyte (CTL) epitopes derived from diverse pathogens including SARS-CoV-2. The model was trained and optimized on the relative immunodominance of CTL epitopes in human immunodeficiency virus infection. Its accuracy was tested against experimental data from patients with COVID-19. Our model predicts that only some SARS-CoV-2 epitopes predicted to bind to HLA molecules are immunogenic. The immunogenic CTL epitopes across all SARS-CoV-2 proteins are predicted to provide broad population coverage, but those from the SARS-CoV-2 spike protein alone are unlikely to do so. Our model also predicts that several immunogenic SARS-CoV-2 CTL epitopes are identical to seasonal coronaviruses circulating in the population and such cross-reactive CD8+ T cells can indeed be detected in prepandemic blood donors, suggesting that some level of CTL immunity against COVID-19 may be present in some individuals before SARS-CoV-2 infection.
Subject areas: Immunology, Immune Respons, In Silico Biology, Artificial Intelligence
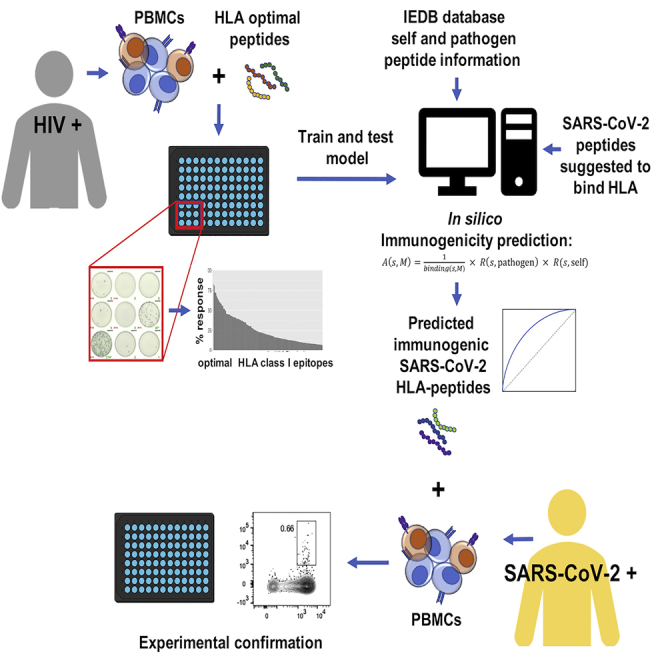
Graphical abstract
Highlights
-
•
A physics-based learning model to predict CTL epitope immunogenicity across viruses
-
•
Trained on relative CTL epitope immunodominance in HIV and applied to SARS-CoV-2
-
•
Only a fraction of SARS-CoV-2 peptides that bind to HLA molecules is immunogenic
-
•
Immunogenic SARS-CoV-2 epitopes identical to seasonal coronaviruses were identified
Immunology; Immune Respons; In Silico Biology; Artificial Intelligence
Introduction
It is generally thought that an effective vaccine will likely be required to bring the pandemic of coronavirus disease 2019 (COVID-19) caused by the SARS-CoV-2 virus under control. Thus a myriad of efforts to develop vaccines that may protect against infection by SARS-CoV-2 have been launched (Akst, 2020). To date, three vaccines have received emergency use approval (EUA) by the Food and Drug Administration in the United States. These vaccines primarily elicit protective antibody responses against the spike protein of SARS-CoV-2. How durable the protection conferred by not only these but also other vaccine candidates will be remains to be shown.
Although current vaccines and vaccine candidates are primarily geared toward induction of neutralizing antibody responses, a potential role for SARS-CoV-2-specific T cells in protection against and control of infection has been proposed (Le Bert et al., 2020; Braun et al., 2020; Rydyznski Moderbacher et al., 2020). Indeed, there is evidence from other coronaviruses, like SARS-CoV that caused severe acute respiratory syndrome (SARS) in 2003, that the antibody response elicited in patients infected with SARS-CoV was protective but relatively short lived (Liu et al., 2006; Mo et al., 2006; Tang et al., 2011). In contrast, T cell responses were more durable (Channappanavar et al., 2014; Fan et al., 2009; Tang et al., 2011). For example, Fan et al. (2009) showed that most patients who recovered from SARS-CoV have memory T cell responses directed against the virus four years after recovery. Tang et al. (2011) showed that six years after recovery patients with SARS-CoV did not have significant amounts of virus-specific circulating antibodies, but had significant memory T cell responses compared with healthy controls. Furthermore, a critical role for virus-specific memory T cells in broad and long-term protection against SARS-CoV infection has been elucidated in animal models (Channappanavar et al., 2014; Zhao et al., 2010). The nucleocapsid (N), membrane (M), and envelope (E) proteins of SARS-CoV-2 are over 90% conserved compared with SARS-CoV, and the spike (S) protein is 76% similar (Ahmed et al., 2020). Given this similarity between SARS-CoV-2 and SARS-CoV, it is worth exploring the development of vaccines that may also elicit protective T cell responses.
Multiple recent studies have been focusing on discovering potential epitopes of SARS-CoV-2 that can elicit T cell responses. Ahmed et al. (2020) and Grifoni et al. (2020a) have tried to identify peptides of SARS-CoV-2 that have high sequence identity with SARS-CoV epitopes. However, only a small number of SARS-CoV peptides that are experimentally known to elicit T cell responses in humans are shared by SARS-CoV-2. Moreover, these shared peptides are associated with a limited set of human leukocyte antigen (HLA) molecules, thus providing poor coverage of the global population. Ahmed et al. (2020) and Prachar et al., 2020, among other groups (Campbell et al., 2020; Nerli and Sgourakis, 2020; Prachar et al., 2020), also identified SARS-CoV-2 peptides that are capable of binding to HLA molecules, based on either major histocompatibility complex (MHC) binding assay results or bioinformatic methods. By doing this, they identified a large pool of SARS-CoV-2 peptides that are associated with diverse HLA molecules, which cover a broad cross-section of the global population. However, binding to HLA molecules does not imply that the peptide epitope will elicit an immunogenic T cell response in humans (Yewdell, 2006). Predicting the immunogenicity of T cell epitopes in humans with given HLA types in a reliable way is a major challenge. The ability to address this challenge will significantly aid the design of vaccines that aim to elicit protective T cell responses against diverse pathogens, with SARS-CoV-2 being one example.
We aimed to systematically determine the relative immunogenicity of cytotoxic T lymphocyte (CTL) epitopes in people with diverse HLA alleles by developing a physics-based learning algorithm. We exploited the fact that short peptides, about 9–11 amino acids in length, are not unique to the organism from which they are derived (Butler et al., 2013; Kosmrlj et al., 2008). Therefore, the information obtained from data on epitope-specific CTL responses against one pathogen can be used to learn CTL immunogenicity patterns against diverse other pathogens. To train and optimize our method we first studied a viral infection, human immunodeficiency virus (HIV), for which well-defined data on the relative immunodominance of CTL epitopes are available. The results suggest that our method is more accurate than the immunogenicity prediction tool publicly available on the Immune Epitope Database (IEDB, http://tools.iedb.org/immunogenicity) (Calis et al., 2013; Vita et al., 2019).
We then applied our algorithm to identify immunogenic SARS-CoV-2 peptide epitopes and tested our approach by experimentally quantifying CTL responses toward a selection of predicted immunodominant optimal peptides in patients with COVID-19. Our model predicts that only a fraction of peptide epitopes that are known to bind different HLA molecules is likely to be immunogenic. However, the set of immunogenic peptides still provides broad coverage of the global population. Given the low mutability of the SARS-CoV-2 virus so far, these results suggest that a whole proteome immunogen may be able to elicit potent T cell responses in diverse individuals. We also predict that the immunogenic CTL epitopes contained in the spike protein of SARS-CoV-2 (immunogen in most current vaccine formulations) is unlikely to provide broad population coverage, because these spike epitopes are associated with a limited number of HLA alleles. Finally, several predicted immunogenic peptide epitopes derived from the SARS-CoV-2 proteome are identical to those contained in the four human coronaviruses of low pathogenicity (HCoV) that regularly circulate in the human population. Indeed, we found evidence for such cross-reactive CTL responses in pre-pandemic blood, suggesting that HCoV-specific memory CTL responses present in a subset of the population may be able to target SARS-CoV-2 epitopes.
Our results provide a useful guide for the design of second-generation COVID-19 vaccines that aim to elicit CTL immunity and will also inform other investigators about the likely dominant T cell responses they may wish to test in patients with specific HLA types. More importantly, upon further testing, validation, and elaboration, our approach for predicting immunogenicity of CTL epitopes may be useful for diverse infectious pathogens including those that will undoubtedly emerge in the future.
Results
Model development and training against clinical data
CTLs bind to short peptides, about 9–11 amino acids in length, displayed in complex with HLA class I molecules. Such short motifs do not contain any long-range information about the genome of the organism from which they are derived (Butler et al., 2013; Kosmrlj et al., 2008). Therefore, the ability to predict the relative immunogenicity of peptide epitopes derived from the genome of one virus in persons with a given HLA allele is likely to allow the prediction of immunogenicity of epitopes derived from another virus' proteome.
Our model for immunogenicity of CTL peptide epitopes is inspired by studies aimed to predict immunogenicity of cancer neo-antigens for immunotherapy (Luksza et al., 2017). We wish to predict the peptide immunodominance hierarchy in people with different HLA genes. For that purpose, we define a “CTL immunogenicity metric” , where is the sequence of the peptide whose relative immunogenicity we wish to predict for a person with the HLA allele, . This metric is the product of three terms, and is written as follows:
| (Equation 1) |
Each of the terms mentioned above reflects a different physical phenomenon. The binding term is a measure of the probability that the peptide can be processed, bound to, and displayed by HLA molecule . Machine learning approaches have been trained on many measurements of peptide presentation by different HLA molecules, and a resulting method, netMHCpan4.0 (Vanessa and Nielsen, 2017), can make reasonable estimates of for many alleles as the percentile rank of the elution-ligand score. We next posit that whether or not a peptide is targeted by human CTLs should correlate with how similar its sequence is to peptides derived from diverse pathogens that are known to elicit a CTL response in humans (listed in the IEDB database (Vita et al., 2019); methods). The term, in Equation 1 is the sequence similarity of peptide to these pathogen-derived peptides. We define mathematically as the number of pathogenic peptides whose alignment score with is larger than a threshold value, :
| (Equation 2) |
Here, is a pathogenic peptide in the database; is the alignment score of and , which is determined by the BLOSUM62-based Smith-Waterman alignment method (as used by Luksza et al. [2017]), and is the step function. A higher alignment score means that the biochemical properties of the two peptides are more similar to each other.
T cells develop in the thymus, where they are exposed to HLA-bound peptides derived from the host's proteome. For a thymocyte to mature into a peripheral T cell, it must bind to at least one of these peptides with an affinity that exceeds a threshold value, and not bind to any of them with an affinity that exceeds a higher threshold value (Daniels et al., 2006). In past studies (Butler et al., 2013; Kosmrlj et al., 2008, 2009; Košmrlj et al., 2010; Stadinski et al., 2016), we developed a mechanistic understanding of how thymic development shapes the pathogen reactivity of the T cell repertoire in an organism. Extending these studies leads us to the seemingly counterintuitive conclusion that T cells that bind to human peptides more strongly will also be likely to bind more strongly to pathogen-derived peptides. One simple way to understand this is by examining data in mice, which show that more self-reactive T cells are statistically enriched in more hydrophobic amino acids at residues that contact the HLA-bound peptides (Stadinski et al., 2016). This is because T cell receptor (TCR) binding to HLA-bound peptides creates an interface from which water must be partially expelled. So, hydrophobic amino acids are more likely to favor the formation of such an interface. However, this argument applies to both self- and pathogen-derived peptides. Therefore, statistically, TCRs that bind more avidly to self-peptides should also bind more avidly to pathogen-derived peptides. There is some experimental evidence supporting this prediction (Mandl et al., 2013). Based on these considerations, we include the term, , in Equation 1, which is the biochemical sequence similarity of peptide to peptides derived from the human proteome. These peptides are also gathered from the IEDB database (Vita et al., 2019) (methods). Similar to Equation 2, is defined as the number of self-peptides whose alignment score with is larger than a threshold value, :
| (Equation 3) |
Now, denotes a self-peptide.
We used Equations 1, 2, and 3 to train a predictor of the immunodominance hierarchy of peptides targeted by CTLs in humans with different HLA alleles. The two parameters in our model are and , which will be determined by fitting the model to the training data (methods). Given experimental measurements on the immunodominance hierarchy of peptides derived from pathogens in humans with different HLA alleles, we constructed a binary classifier based on . A peptide with larger than a threshold is classified as dominant, and the others are classified as nondominant. We trained and tested our model for as a predictor of immunodominance using experimental data on HIV peptides targeted by humans with different HLA alleles (methods).
We systematically assembled data on HIV-1-specific CTL responses, as determined by gamma interferon (IFN-γ) enzyme-linked immunospot (ELISpot) assay, against a panel of up to 457 peptides including previously described optimal HIV-1 epitopes as defined in the Los Alamos National Laboratory HIV epitope database (www.hiv.lanl.gov) and epitope variants (methods). Data were available from multiple cohorts of HIV-1-infected individuals at different stages of the infection, and subsets of the data have been reported previously (Pereyra et al., 2014; Streeck et al., 2009). In total, optimal epitope-specific CD8+ T cell data were available from 1,102 individuals, including 619 individuals during acute and early infection and 483 individuals during chronic infection of which 321 were considered spontaneous HIV controllers with median plasma HIV RNA levels ≤2,000 copies/mL. For the majority of individuals, the peptides used for T cell response assessment were selected based on the individual's HLA class I genotype. However, 314 individuals with chronic infection had been tested against 267 optimal epitopes, irrespective of the individual's HLA class I alleles. An average of 7 (range, 0–42) epitope-specific CTL responses were detected in the primary infection cohort, whereas HIV-1-specific CTL responses against an average of 20 epitopes (range, 0–95) were detected in chronically infected individuals. For our analysis, HLA class I-restricted CTL responses were considered only if the respective HLA allele was shared by at least 20 individuals in the dataset. Table S1 in the supplemental information summarizes the frequencies of recognition for tested HIV-1-specific CTL epitopes in the respective cohorts.
We used the percentage of patients with a given HLA allele responding to a given HIV peptide , denoted as , as the metric of immunodominance. The peptides that elicit response in more than 25% of tested patients with a given HLA allele were labeled as dominant and the others as non-dominant. Repeated 10-fold cross-validation was performed to train and test the model (methods).
The performance of the -based classifier on the test sets is summarized as receiver operator characteristic (ROC) curves (Figures 1A and 1B). For the HIV acute infection group, the classifier has an area under the curve (AUC) score of approximately 0.71 for the ROC curve. For the chronic infection group, the classifier has an AUC score of approximately 0.66. The superior performance in the acute infection dataset can be explained by the fact that as HIV infection progresses, the virus mutates to escape CTL response, and as a result less immunodominant peptides are targeted by CTLs in the chronic phase (Streeck et al., 2009). The performance of the current model is compared with a T cell epitope immunogenicity prediction model developed by Calis et al. (2013), which is publicly available in IEDB. Our model shows superior performance as measured by the AUC (0.71 versus 0.57 for the acute group, 0.66 versus 0.34 for the chronic group; Figures 1A and 1B). We also evaluated the importance of each of the three terms of , the binding term, the term representing similarity to pathogenic peptides, and that representing similarity to human peptides by constructing partial models with one or two terms removed from . The same training and testing procedures were repeated for these partial models. For both the acute and the chronic groups the partial models show less predictive power compared with the full model as measured by the values of the AUC (Figures 1C–1F). The “binding only” bar graphs correspond to the predictions from netMHCpan4.0, which is used commonly. Our full model outperforms netMHCpan4.0 as measured by the values of the AUC, a point that is also evident from the ROC curves corresponding to our model and netMHCpan4.0 (Figures 1G and 1H). For example, the values of the AUC for our full model and netMHCpan4.0 for the acute cohort are 0.71 and 0.64, respectively.
Figure 1.

Performance of the A(s,M)-based classifier
(A and B) The ROC curve of the binary classifier based on our model (red), compared with the immunogenicity prediction model developed by Calis et al. (2013) (green). (A) The ROC curves for the acute HIV infection group. The AUC of the red curve is 0.71. The AUC of the green curve is 0.57. (B) The ROC curves for the chronic HIV infection group. The AUC of the red curve is 0.66. The AUC of the green curve is 0.34.
(C and D) The Spearman correlation coefficient between A(s,M) and p(s,M) on the test sets. The full model is compared with partial models where one or two of the three terms of A(s,M) are missing. (C) Corresponds to the acute group. (D) Corresponds to the chronic group.
(E and F) The AUC of the binary classifier based on our model. The full model is compared with partial models where one or two of the three terms of A(s,M) are missing. (E) Corresponds to the acute group. (F) Corresponds to the chronic group.
(G and H) The ROC curves for acute (G) and chronic infection (H) comparing our model with netMHCpan4.0, also summarized in figures (C–F) under “binding.” The error bars represent ± SD.
Only a fraction of SARS-CoV-2 peptides that bind to HLA molecules are immunogenic
Many research groups have identified peptides derived from SARS-CoV-2 that can bind with HLA molecules (Ahmed et al., 2020; Campbell et al., 2020; Grifoni et al., 2020a; Nerli and Sgourakis, 2020; Prachar et al., 2020). Two different approaches were employed. In one approach, peptides that bind to different HLA molecules were identified based on experimental assays (Ahmed et al., 2020; Prachar et al., 2020). In the other approach, bioinformatic tools were used to identify peptides that bind to HLA molecules (Campbell et al., 2020; Grifoni et al., 2020a; Nerli and Sgourakis, 2020). We used our trained classifier to predict the immunogenicity of peptides that were determined to bind to different HLA molecules experimentally, as reported by Ahmed et al. (2020) and Prachar et al., 2020. Our classifier can also be easily applied to the peptides reported by other groups too.
Ahmed et al. (2020) identified 187 SARS-CoV peptides that were suggested by HLA binding assays to bind to diverse HLA class I molecules, and were identical in SARS-CoV-2. We further screened these peptides using our classifier (methods) and found that only 74 of them are predicted to be immunogenic (Tables 1 and S2). These predicted peptides are associated with 33 different HLA alleles. Standard methods predict that this would enable coverage of 98.8% of the global population (i.e., 98.8% of the global population has at least one of these alleles) and 99.2% of US population (methods).
Table 1.
The predicted topmost immunogenic SARS-CoV-2 peptides based on the peptide pool reported by Ahmed et al. (2020)
| HLA | Peptide |
|---|---|
| HLA-A∗02:01 | FLWLLWPVTL; SMWSFNPET; WLLWPVTLA; LLLDRLNQL; FLLNKEMYL; FLLPSLATV; FLNRFTTTL; FLPRVFSAV; ILGTVSWNL; ALWEIQQVV; KLWAQCVQL; FVDGVPFVV; KLNVGDYFV; LLDDFVEII; LLLDDFVEI; LVLSVNPYV; NLWNTFTRL; TLVPQEHYV; TMADLVYAL; VLWAHGFEL; YLDAYNMMI; YLNTLTLAV; HLVDFQVTI; RLDKVEAEV; VLNDILSRL |
| HLA-B∗44:03 | LEQWNLVIGF; YEQYIKWPWY |
| HLA-A∗23:01 | LWLLWPVTL; SFNPETNIL; GYQPYRVVVL |
| HLA-A∗24:02 | LWLLWPVTL; SFNPETNIL; KQFDTYNLW; GYQPYRVVVL |
| HLA-A∗30:02 | ATSRTLSYY; GTTLPKGFY; LSPRWYFYY; VTPSGTWLTY; ISDYDYYRY; RVDFCGKGY |
| HLA-A∗11:01 | ATSRTLSYYK; KTFPPTEPK; KTFPPTEPKK; AVLQSGFRK; GVAMPNLYK; RLYYDSMSY; VVYRGTTTY; SVLNDILSR |
| HLA-B∗07:02 | FPRGQGVPI; SPRWYFYYL; MPASWVMRI; FPPTSFGPL; IPRRNVATL; HPLADNKFAL |
| HLA-B∗54:01 | FPRGQGVPI; SPRWYFYYL; FPPTSFGPL; APHGVVFLHV |
| HLA-B∗08:01 | FPRGQGVPI |
| HLA-B∗35:01 | FPRGQGVPI; MPASWVMRI; VVYRGTTTY; HPLADNKFAL; FPNITNLCPF |
| HLA-B∗51:01 | FPRGQGVPI; FPPTSFGPL |
| HLA-B∗53:01 | FPRGQGVPI; HPLADNKFAL; FPNITNLCPF |
| HLA-B∗40:01 | MEVTPSGTWL; YEGNSPFHPL |
| HLA-A∗29:02 | GTTLPKGFY; LSPRWYFYY; TPSGTWLTY; VTPSGTWLTY; ISDYDYYRY |
| HLA-A∗03:01 | KTFPPTEPK; KTFPPTEPKK; AVLQSGFRK; GVAMPNLYK; KLFAAETLK; RLYYDSMSY; VVYRGTTTY |
| HLA-A∗31:01 | KTFPPTEPK; KTFPPTEPKK; SVSPKLFIR |
| HLA-A∗68:01 | KTFPPTEPK; KTFPPTEPKK |
| HLA-A∗01:01 | LSPRWYFYY; VTPSGTWLTY; ISDYDYYRY; VVDKYFDCY; LIDLQELGKY; RVDFCGKGY |
| HLA-A∗26:01 | VTPSGTWLTY |
| HLA-B∗45:01 | AEGSRGGSQA |
| HLA-A∗02:02 | FLGRYMSAL; FLLNKEMYL; FLLPSLATV; FLNRFTTTL; FLPRVFSAV; ALWEIQQVV; FVDGVPFVV; KLNVGDYFV; KLSYGIATV; LLDDFVEII; LLLDDFVEI; TMADLVYAL; VLWAHGFEL; YLDAYNMMI; YLNTLTLAV; HLVDFQVTI |
| HLA-A∗02:03 | FLGRYMSAL; FLLNKEMYL; FLLPSLATV; FLNGSCGSV; FLNRFTTTL; FLPRVFSAV; ALWEIQQVV; FVDGVPFVV; KLSYGIATV; LLLDDFVEI; TLIGDCATV; TMADLVYAL; VLWAHGFEL; YLDAYNMMI; YLNTLTLAV; HLVDFQVTI |
| HLA-A∗02:06 | FLLNKEMYL; FLLPSLATV; FLPRVFSAV; GVYDYLVST; IQPGQTFSV; ALWEIQQVV; FVDGVPFVV; LLDDFVEII; LLLDDFVEI; LVLSVNPYV; TMADLVYAL; VLWAHGFEL; YLDAYNMMI; YTMADLVYA; HLVDFQVTI |
| HLA-C∗06:02 | FRYMNSQGL |
| HLA-A∗68:02 | FVDGVPFVV; MVMCGGSLYV; YTMADLVYA |
| HLA-B∗15:01 | KQFDTYNLW; RLYYDSMSY; TTLPVNVAF; VVYRGTTTY; YQKVGMQKY |
| HLA-B∗58:01 | KQFDTYNLW; TTLPVNVAF; VVYRGTTTY |
| HLA-A∗69:01 | TLVPQEHYV; VLWAHGFEL |
| HLA-B∗40:02 | YEGNSPFHPL |
| HLA-B∗27:05 | GRLQSLQTY; VRFPNITNL |
| HLA-C∗14:02 | VRFPNITNL |
| HLA-B∗44:02 | YEQYIKWPWY |
| HLA-B∗18:01 | YEQYIKWPWY |
The same analysis was performed for the 152 SARS-CoV-2 peptides identified by Prachar et al., 2020, which are also verified by HLA binding assays to be strong binders to diverse HLA class I molecules. Our classifier predicted that 98 of them are immunogenic (Tables 2 and S2). They are associated with 10 different HLA alleles, which cover 94% of the global population and 93.2% of US population. These two sets of predicted immunogenic peptides can be combined together, which gives a total of 162 immunogenic peptides associated with 37 different HLA alleles (Table S2). These HLA alleles can cover 99.6% of the global population and 99.7% of US population. On average each HLA allele is associated with 7.3 immunogenic peptides. Recall that the immunogenic peptides predicted by our model are defined as those that elicit a response in more than 25% of population with the associated HLA allele. With more than seven immunogenic peptides associated with each HLA allele, it is likely that immunogenic CTL responses will be present in most people with the corresponding allele.
Table 2.
The predicted topmost immunogenic SARS-CoV-2 peptides based on the peptide pool reported by Prachar et al., 2020
| HLA | Peptide |
|---|---|
| HLA-A∗01:01 | CTDDNALAY; LTNDNTSRY; PTDNYITTY; ISDYDYYRY; DTDFVNEFY; LTDEMIAQY; FTSDYYQLY; GTDLEGNFY; FSAVGNICY; VVDKYFDCY; FLTENLLLY; VTDVTQLYL; LTGHMLDMY |
| HLA-A∗02:01 | YLQPRTFLL; FLNRFTTTL; FLLNKEMYL; YLDAYNMMI; YLNSTNVTI; FLLPSLATV; FLAHIQWMV; NLIDSYFVV; YLYALVYFL; ALSKGVHFV |
| HLA-A∗03:01 | GVYFASTEK; AVAKHDFFK; TTIKPVTYK; VTNNTFTLK; RLFRKSNLK; GVAMPNLYK; ALAYYNTTK; KLFAAETLK; TLKSFTVEK; KSAGFPFNK; ASMPTTIAK; VLSGHNLAK; KTFPPTEPK; TSFGPLVRK; HLYLQYIRK; STFNVPMEK; TLKGGAPTK; QIYKTPPIK; RIAGHHLGR; IINNTVYTK; RQFHQKLLK; VTYVPAQEK; KLFDRYFKY |
| HLA-A∗11:01 | GVYFASTEK; AVAKHDFFK; TTIKPVTYK; VTNNTFTLK; GVAMPNLYK; ALAYYNTTK; KSAGFPFNK; ASMPTTIAK; ITPVHVMSK; KTFPPTEPK; TSFGPLVRK; STFNVPMEK; IINNTVYTK; VTYVPAQEK; QTFFKLVNK; AGFSLWVYK; AIDAYPLTK; HVVGPNVNK; GVYYHKNNK; AVLQSGFRK; HLMGWDYPK; KTIQPRVEK |
| HLA-A∗24:02 | TYACWHHSI; VYMPASWVM; YYKKDNSYF; NYMPYFFTL; VYSTGSNVF; VYFLQSINF; YYQLYSTQL; YYTSNPTTF; NYNYLYRLF; FYLTNDVSF; FYGGWHNML; YFIASFRLF; RYKLEGYAF; IYNDKVAGF; SYATHSDKF; AYANSVFNI; TYKPNTWCI; FFASFYYVW; YYHTTDPSF |
| HLA-C∗07:01 | VYMPASWVM; KRVDWTIEY; HANEYRLYL |
| HLA-B∗40:01 | AELAKNVSL; GEVITFDNL; REVLSDREL; GETLPTEVL; AEWFLAYIL; FELEDFIPM; GEYSHVVAF; QEYADVFHL; AEYHNESGL; HEETIYNLL; SEFDRDAAM; FEYVSQPFL; QELYSPIFL; TEVVGDIIL; SEVGPEHSL; RELHLSWEV; YELQTPFEI; HEGKTFYVL; TEHSWNADL; REQIDGYVM |
| HLA-C∗04:01 | GFDYVYNPF |
| HLA-C∗07:02 | KRVDWTIEY |
| HLA-C∗01:02 | FAPSASAFF |
CTL epitopes contained in the spike protein may not elicit sufficiently broad T cell responses
Currently, most SARS-CoV-2 vaccines only contain the spike protein of the virus as the immunogen (Akst, 2020). Thus, we wanted to test whether the immunogenic peptides from the spike protein alone can elicit CTL responses in a large portion of the population. Among the combined set of 162 predicted immunogenic peptides that we identified, 22 belong to the spike protein of the virus, and they are associated with 16 HLA alleles (Table S2). These 16 HLA alleles cover 92.3% of the global population and 93.5% of the US population. However, on average each HLA allele is only associated with 1.8 immunogenic peptides. This relatively low number indicates that it is likely that most people with a particular allele will not mount immunogenic CTL responses. Therefore, including various viral proteins in the vaccine immunogen may be necessary in order to achieve broad coverage of CTL responses in a given population.
Testing predictions against experimental data on immunogenicity of long SARS-CoV-2 peptides
Peng et al., 2020 tested 423 overlapping 15- to 18-mer SARS-CoV-2 peptides for CD4+ and CD8+ T cell responses using blood samples from 42 recently recovered patients with COVID-19. IFN-γ ELISpot assays and intracellular cytokine staining were used to test for responses. Confirmed CD8+ T cell responses were detected against seven peptides in a number of patients. We calculated our CTL immunogenicity metric () for all 9- to 11-mers contained in these long peptides in persons with the HLA types of the positively tested patients (Table 3). If the largest value of for at least one 9- to 11-mer contained in a positively tested 15- to 18-mer exceeded the threshold for immunodominance in our model, we predicted a positive CTL response. Encouragingly, we correctly predicted five of the seven positively tested peptides to be immunogenic. Our predictions were incorrect for two long peptides that registered positive responses in one patient each. The small number of confirmed patients tested for each long peptide precluded meaningful calculation of statistical significance.
Table 3.
Prediction of immunodominance for long peptides, against which CD8+ T cell responses were found in patients with COVID-19 Peng et al., 2020
| Tested peptide | Patient | Largest amplitude prediction |
Immunogenic | True positive rate | ||
|---|---|---|---|---|---|---|
| Epitope | HLA | Amplitude | ||||
| LSPRWYFYYLGTGPEAGL | 1–10 | SPRWYFYYL | HLA-B∗07:02 | 48,654 | Yes | 10/11 |
| 11 | YLGTGPEAGL | HLA-A∗02:01 | 4,761 | No | ||
| MEVTPSGTWL | 1 | MEVTPSGTWL | HLA-B∗40:01 | 97,994 | Yes | 1/1 |
| LLNKHIDAYKTFPPTEPK | 1 | KTFPPTEPK | HLA-A∗11:01 | 1,217,377 | Yes | 2/2 |
| 2 | KTFPPTEPK | HLA-A∗03:01 | 894,699 | Yes | ||
| KDCVVLHSYFTSDYYQLY | 1–2 | FTSDYYQLY | HLA-A∗01:01 | 418,525 | Yes | 2/2 |
| YFTSDYYQLYSTQLSTDTGV | 1–2 | FTSDYYQLY | HLA-A∗01:01 | 418,525 | Yes | 2/2 |
| CTFEYVSQPFLMDLE | 1 | YVSQPFLMDL | HLA-C∗07:02 | 2,984 | No | 0/1 |
| GPKKSTNLVKNKCVN | 1 | KSTNLVKNK | HLA-A∗31:01 | 211 | No | 0/1 |
The first column shows the tested peptide sequences and column 2 shows the patient index, where patients are counted from top to bottom row for each peptide in Table 2 in Peng et al. Columns 3–5 show the epitope-HLA combination from the positively tested patients that results in the largest predicted amplitude. A peptide is predicted to be immunogenic, if this maximum amplitude is larger than the threshold for immunogenicity in our model. The last column shows the true positive rate of the predictions for each peptide. The total number of positively tested patients for each peptide is indicated in the denominator of the true positive rate.
CTL responses elicited by predicted immunodominant SARS-CoV-2 optimal peptides
In order to determine if individuals with COVID-19 indeed mount CTL responses against optimal epitopes that our model predicted to be immunodominant, we collected peripheral blood mononuclear cells (PBMCs) from 28 individuals with SARS-CoV-2 PCR-confirmed infection. We selected a total of 108 individual 9-mer SARS-CoV-2 peptides for the HLA alleles that were most frequently expressed in this cohort, namely, HLA A∗01:01, A∗02:01, A∗03:01, A∗11:01, A∗24:02, B∗07:02, B∗08:01, and C∗04:01. The peptides were selected based on their predicted immunogenicity hierarchy, i.e., according to values (amplitude) of our immunogenicity metric (). Figure 2A summarizes the mean prediction amplitude of all peptides across all tested alleles, with peptide 1 being the peptide with the highest prediction amplitude for each allele. Peptides with very low predicted immunogenicity values were excluded from this analysis. T cell responses to these peptides were quantified by IFN-γ-ELISpot assay following PBMC expansion with anti-CD3-antibody in IL-2-containing media. Overall, we detected responses for each HLA allele, except for C∗04:01 (only four peptides of this allele were tested). Some peptides were not targeted at all, whereas several induced responses in all patients with the corresponding HLA allele (Figure 2B). As expected, no responses were seen against predicted HLA-restricted peptides in patients without the corresponding allele (Figure S1). Mean IFN-γ+ T cell response magnitude per peptide across individuals with identical HLA ranged from 33 to 987 spot-forming cells/106 PBMCs (Figure 2C). Overall, the breadth of CTL responses differed by HLA, with A∗01:01-restricted epitopes being more frequently targeted than peptides restricted by other alleles (Figure 2D). Interestingly, one individual who expressed four of the tested alleles showed a CTL response to at least one of the predicted peptides in each allele. Orf1ab was the most frequently targeted viral protein followed by N and S (Figure 2E). One individual (with allele C∗04:01) did not have any CTL responses against the respective peptides but had detectable CTL responses against overlapping peptide pools for N and S, whereas two other individuals had no detectable SARS-CoV-2-specific responses at all. On the other hand, five of the seven patients who did not respond to the N OLP pool as well as 10 of the 14 patients who did not respond to the S OLP pool showed IFN-γ+ T cell responses to one or more of our predicted peptides, suggesting an advantage of testing optimal epitopes predicted by our algorithm rather than pools of overlapping peptides in the detection of antigen-specific CTL responses in patients with COVID-19.
Figure 2.

CTL responses elicited by predicted immunodominant SARS-CoV-2 optimal peptides
IFN-γ T cell responses in 28 patients with COVID-19 were tested against 108 single 9-mer peptides (4–20 individual peptides per allele), of decreasing predicted immunodominance for the respective HLA alleles that were most frequently expressed in this cohort.
(A) The mean amplitude of predicted immunogenic peptides (1–20), as determined by our model, across all tested alleles. Responses to N and S overlapping peptides pools were also included.
(B) Frequency (%) of patients with the respective HLA allele with a response to a given peptide (1–20).
(C) Mean magnitude of T cell responses (in SFC/1M PBMCs) against a given peptide (1–20) across all responding patients with the respective HLA allele.
(D) Breadth of targeted peptides (each dot represents one patient) per HLA. The red highlighted dots show one patient who expressed four of the tested alleles and had a response to at least one peptide in each allele.
(E) Distribution of targeted viral proteins for which T cell response was detected. 50% of the response was focused on orf1ab.
(F) Most frequently (>50% of patients) targeted optimal peptides.
To further analyze these data, for each peptide, we compared the fraction of patients who positively responded to a peptide with its metric of immunogenicity () predicted by our model. For the 108 peptides tested, we found a Pearson correlation value of 0.43 between the predicted value of and the fraction of positively responding patients (Figure 3A). We then grouped peptides according to their restricting HLA types and compared the fraction of positively responding patients for each HLA type with the mean value of predicted by our model for the grouped peptides. This comparison was characterized by a Pearson correlation value of 0.82 (Figure 3B). Interestingly, peptides tested for the HLA type A∗01:01 were predicted to be most immunodominant with a large mean value of (4.9 × 10⁵) and patients with this HLA type had the highest fraction of positively responding individuals. This result is consistent with the data that peptides restricted by HLA A∗01:01 were most frequently targeted (Figure 2D)
Figure 3.

Comparison between model and ELISpot results for optimal peptides
(A) Scatterplot of the fraction of positively responding patients graphed against the model prediction for the amplitude for each of the 108 experimentally tested peptides. The weighted Pearson correlation coefficient is 0.43. The number of patients per tested peptide is the weight for each peptide.
(B) Peptides were grouped according to HLA types. Scatterplot of the fraction of positively responding patients for each HLA type graphed against the predicted mean amplitude for all peptides in this group. Shown is the weight Pearson correlation coefficient (0.82). The number of patients tested per HLA group is the weight. Error bars reflect the standard deviations of the fraction of positively responding patients within each group (each HLA type). Statistical significance was computed as described in methods.
Taken together, these data show a reasonable positive correlation between model predictions and patient data. Moreover, using the model we were able to rapidly identify several highly targeted optimal peptides across several alleles that induced responses in more than 50% of tested patients (Figure 2F), further validating our approach.
There is significant overlap between immunogenic CTL epitopes in SARS-CoV-2 and less pathogenic human coronaviruses
Unlike SARS-CoV-2 that causes severe respiratory disease, other less pathogenic coronaviruses circulating in the human population usually only cause mild diseases (like the common cold). Four common human coronaviruses (HCoV), HCoV-229E(NC_002645.1), NL63(NC_005831.2), OC43(NC_006213.1), and HKU1(NC_006577.2), are responsible for 10% to 30% of upper respiratory tract infections in adults (Paules et al., 2020). Given that memory T cell responses are likely induced in at least a fraction of the human population infected by these coronaviruses, we wanted to explore whether such memory responses could theoretically be induced/expanded following infection with SARS-CoV-2. Thus we employed our classifier to identify common immunogenic peptide epitopes between HCoV and SARS-CoV-2. We first gathered a set of 38 HLA class I alleles that represent more than 99% of the world. We then applied our classifier to all possible overlapping 8- to 11-mers in the proteome of SARS-CoV-2 and determined that there are 2,311 potentially immunogenic CTL epitopes associated with those 38 HLA alleles. We then further determined the unique set of immunogenic peptides that were common between SARS-CoV-2 and the four common HCoV. We found 46 shared immunogenic peptides, which are associated with 31 HLA alleles (Table S3). These HLA alleles cover 98.6% of the global population and 99.0% of US population. On average each of these alleles is associated with 5.6 immunogenic peptides. Given this level of overlap between immunogenic epitopes between HCoVs and SARS-CoV-2, one can hypothesize that CTL memory responses elicited by past infection with common coronaviruses could respond to SARS-CoV-2 infection.
We demonstrate this directly by an ex vivo assessment of pre-pandemic PBMCs using one of our SARS-CoV-2 peptides predicted to be both immunogenic and conserved among coronaviruses in a peptide-MHC tetramer (HLA-A∗02:01/Orf1ab4725-4733). We find that SARS-CoV-2-reactive CD8+ T cells can indeed be detected in unexposed individuals (mean frequency of ~8.3 × 10⁻⁶, n = 8) (Figures 4A, 4B, S2). The frequency of SARS-CoV-2 (Orf1ab4725-4733)-specific T cells in unexposed individuals, however, was significantly lower than that of CD8+ T cells (mean frequency of ~4.2 × 10⁻⁴, n = 8) reactive to influenza virus (HLA-A∗02:01/M158-66) (Figures 4A and 4B). Phenotypic characterization using CCR7 and CD45RA staining indicates that these SARS-CoV-2 (Orf1ab4725-4733)-specific T cells predominantly display a memory phenotype (Figure 4C), further suggesting that they had been exposed previously to other HCoVs. We also accounted for the fact that each individual may have been infected by only a subset of the four less pathogenic coronaviruses. So, to determine a lower bound, we determined the immunogenic epitopes that are shared between SARS-CoV-2 and each of the four less pathogenic HCoV. The results are presented in Table 4. On average, 19 epitopes are common with any one of the less pathogenic human coronaviruses. The results shown in Table 4 and the experimental data described above lead us to believe that some fraction of the human population has memory T cell responses that may target immunogenic SARS-CoV-2 CTL epitopes and provide some measure of protection. Indeed, several studies have shown that CD4+ and also CD8+ T cell responses against SARS-CoV-2 peptides were detectable in prepandemic blood donors using OLP mega-pools (Le Bert et al., 2020; Grifoni et al., 2020b).
Figure 4.

Ex vivo detection of SARS-CoV-2 reactive CD8+ T cells in healthy, unexposed individuals
(A) Representative FACS plots of A∗02:01/M1 and A∗02:01/Orf1ab tetramer staining.
(B) Quantification of antigen-specific CD8+ T cells. Each donor (n = 8) data is represented by a dot, and the mean is indicated by the solid line. Statistical significance was determined by Wilcoxon matched-pairs signed rank test.
(C) The mean percentages for each of the memory subsets defined based on the expression of CD45RA and CCR7 markers; naive (TN, CD45RA+CCR7+), central memory (TCM, CD45RA−CCR7+), effector memory (TEM, CD45RA−CCR7-), and effector memory expressing CD45RA (TEMRA, CD45RA+CCR7-) for Orf1ab+ CD8+ T cells in unexposed individuals.
Table 4.
Shared immunogenic peptides between SARS-CoV-2 and four common low-pathogenicity human coronaviruses
| N = peptide | N = HLA | HLA coverage (US) | HLA coverage (world) | Npep per HLA | |
|---|---|---|---|---|---|
| in229E | 8 | 24 | 93.60% | 90.20% | 1.67 |
| inHKU1 | 31 | 29 | 97.80% | 96.60% | 5.24 |
| inHL63 | 17 | 28 | 96.70% | 95.00% | 2.86 |
| inOC43 | 20 | 25 | 97.50% | 96.30% | 2.32 |
| average | 10 | 26.5 | 96.40% | 94.53% | 3.225 |
The first column shows the number of shared immunogenic peptides between SARS-CoV-2 and each of the four viruses. The second column shows the number of HLA alleles associated with those peptides. The third and fourth columns show the population coverage of those HLAs for the United States and the world, respectively. The fifth column shows the average number of immunogenic peptides associated with each HLA. The last row of the table shows the average of all these quantities.
Discussion
In this work we developed a physics-based learning algorithm that aims to predict the CTL immunogenicity of peptides in humans. By physics-based learning algorithm, we mean that machine learning is performed to determine the parameters in a model that is rooted in the underlying biophysics of T cell responses to antigen, rather than a generic classifier. The model applies to diverse pathogens and requires information only on the HLA alleles in an individual.
A significant number of bioinformatics tools exist for modeling peptide binding to MHC molecules, such as the NetMHC algorithm 4.0 (https://doi.org/10.1093/bioinformatics/btv639), and are available within the IEDB epitope analysis toolbox. A number of efforts have aimed to develop bioinformatic tools to characterize the sequences of TCRs in human repertoires, and to follow how particular clones evolve in response to viral infections, thus aiming to characterize how specific TCRs react to particular infections (Minervina et al., 2020; Murugan et al., 2012). By analyzing the sequences of TCRs, Glanville et al. and Dash et al. (Dash et al., 2017; Glanville et al., 2017; Pogorelyy et al., 2019) developed sequence-similarity-based clustering algorithms that cluster TCRs with shared sequence motifs that are likely to exhibit similar epitope specificity. However, estimating the immunogenicity of particular epitopes in humans with a particular HLA type has been challenging. Calis et al. proposed a model to predict the immunogenicity of new peptide MHCs (pMHC) using large sets of immunogenic and non-immunogenic pMHC data (Calis et al., 2013). Here, we chose a different approach and developed our model based on biophysical considerations. Because short peptides do not carry information about the genome of origin, our model should be applicable to peptides derived from diverse pathogens. Our model was then trained and validated against a large dataset of experimentally quantified T cell responses in HIV-infected individual. The model results in improved performance in predicting immunogenicity compared with publicly available models, such as netMHCpan4.0 and that due to Calis et al. (2013).
Many groups have identified SARS-CoV-2 peptides that are able to bind with HLA molecules (Ahmed et al., 2020; Campbell et al., 2020; Grifoni et al., 2020a; Nerli and Sgourakis, 2020; Prachar et al., 2020), either using experimental assays or bioinformatic tools. We screened these peptides for immunogenicity using our algorithm. Specifically, we studied the peptides suggested by Ahmed et al. (2020) and Prachar et al., 2020, but our model can be applied to filter peptides suggested by other groups. Our results suggest that only a fraction of the peptides that bind to HLA molecules are likely to be immunogenic.
We tested the predictive capability of our model against two sets of experimental data; one set was reported by Peng et al., 2020 and the other was obtained by us using samples from patients infected with SARS-CoV-2. Despite the paucity of a large cohort of patients, we found satisfactory correlations between model predictions and experimental data for immunogenicity in patients. Taken together, this model tested against data from patients infected with HIV and SARS-CoV-2 suggests that our immunogenicity prediction method is reasonably accurate and will add to existing models that are currently available.
The combined set of SARS-CoV-2 peptides that we predict to be immunogenic among known HLA binders provides broad coverage of the global population. We note that CTL escape mutations in SARS-CoV-2 thus far are uncommon (Ahmed et al., 2020). Therefore, determination of mutational vulnerabilities of the virus to focus CTL responses to special epitopes, as has been done for HIV (Abdul-Jawad et al., 2016; Ahmed et al., 2019; Barton et al., 2016; Dahirel et al., 2011; Ferguson et al., 2013; Gaiha et al., 2019; Hayton et al., 2014; Létourneau et al., 2007; Louie et al., 2018; Mann et al., 2014; Shekhar et al., 2013), is likely not necessary. Whole proteome immunogens should suffice in a vaccine that aims to elicit potent CTL responses that provide broad population coverage.
As most SARS-CoV-2 vaccines, under EUA or in development, use only the spike protein as the immunogen, we also analyzed whether peptides from the spike alone can yield broad CTL coverage over the global population. Based on our analysis, the immunogenic spike peptides alone are unlikely to provide such broad coverage from the standpoint of CTL responses. Therefore, to get broad CTL coverage, an immunogen consisting of other SARS-CoV-2 proteins, i.e., ORF, N, etc., might be necessary. This is potentially significant if antibody responses to SARS-CoV-2 prove not to be durable, as reported for SARS-CoV.
With regard to common human coronaviruses, which have likely infected substantially more individuals than SARS-CoV-2 despite the current pandemic, our model predicts that there is overlap between the immunogenic CTL epitopes among these viruses. Indeed, several groups have now described cross-reactive T cell responses in prepandemic donors (Le Bert et al., 2020; Grifoni et al., 2020b), and we also found effector memory CTL responses to predicted cross-reactive epitopes in blood samples from individuals before 2019. Here, we were able to identify single optimal peptides, providing more granularity in the cross-reactive T cell specificity. Furthermore, the cross-reactive CTLs that we found exhibited a memory phenotype. This suggests that memory CTLs directed against less pathogenic coronaviruses could target immunogenic SARS-CoV-2 epitopes upon infection. Clinical outcomes and the course of disease during SARS-CoV-2 infection are extremely heterogeneous, ranging from asymptomatic disease to death (Fu et al., 2020). Whether pre-existing HCoV-specific memory T cells actually play a disease modifying or even protective role needs to be determined, but our model now provides the most likely immunodominant CTL epitope-specific responses to focus on.
Although validated by HIV and also tested against SARS-CoV-2 CTL response data, our model is not yet experimentally tested in larger COVID-19 patient cohorts or for other viral infections. It is important to further validate, and potentially elaborate, the model by testing against experimental data for diverse viruses. More data will also help improve the model. Currently the model contains two parameters and , which are the cutoff thresholds for similarity to self and pathogenic peptides, respectively. These two parameters are used for all HLA alleles. However, it is known that peptides bound to different alleles can use different peptide residues to make primary contacts with the TCR. So, a model with allele-specific similarity cutoff thresholds might further improve the performance. This will require training our model against more extensive datasets. As short peptides derived from the proteome do not carry long-range information about the pathogen, if our model is further validated and elaborated, it will be a valuable and simple tool for rapid identification of immunogenic CTL epitopes contained in diverse pathogens. The availability of such a tool will aid many applications pertinent to infectious diseases, including new pandemic-causing pathogens that will undoubtedly emerge in the future.
Limitations of the study
Variable accuracy in predicting immunogenic peptides was observed across alleles, i.e., predictions for the HLA-A∗01:01 allele were more robust than for other alleles, such as HLA-A∗24:02 where the measured peptides did not seem to match the predicted hierarchy. We can only speculate that this is a reflection of the variable amount of data per HLA allele in the HIV dataset that was used to build and train the model. Training the model against more extensive datasets and adjusting the cutoff thresholds per HLA allele will likely help to improve the prediction accuracy. Furthermore, for this proof-of-principle analysis we did not experimentally explore CTL responses against SARS-CoV-2 peptides with very low prediction scores, to confirm that these peptides indeed were not targeted in vivo. Although we predicted cross-reactive peptide responses with HCoV, these were only detected using tetramers at very low levels in unexposed individuals. In order to reliably establish the existence and phenotype of these predicted responses, a larger set of HLA/peptide tetramers needs to be evaluated, potentially utilizing tetramer enrichment strategies.
Resource availability
Lead contact
Information and requests for resources should be directed to and will be fulfilled by the lead contact, Boris Julg (bjulg@mgh.harvard.edu).
Materials availability
This study did not generate new unique reagents.
Data and code availability
All relevant data are available from the lead contact upon reasonable request. The code for the computational tool is publicly available at https://github.com/andy90/immunogenicity_predictor.
Methods
All methods can be found in the accompanying transparent methods supplemental file.
Acknowledgments
This work was supported by the National Institutes of Health (AI138790 to B.J. and AI057229 to M.M.D.), NSF grant # PHY-2026995 to A.G. and A.K.C. A.G., B.J., and A.K.C. were supported by the Ragon Institute of MGH, MIT, & Harvard. This project has been funded in part with federal funds from the Frederick National Laboratory for Cancer Research, under Contract No. HHSN261200800001E. Neither does the content of this publication necessarily reflect the views or policies of the Department of Health and Human Services nor does the mention of trade names, commercial products, or organizations imply endorsement by the US Government. This research was supported in part by the Intramural Research Program of the NIH, Frederick National Lab, Center for Cancer Research.
Author contributions
Project conceptualizing and planning was performed by A.G., A.K.C., and B.J.; HIV and SARS-CoV-2 ELISpot data were generated by Z.C., E.S., F.P.S., and H.S.; HLA data were generated by M.C.; the model development and validation were done by A.G., A.A., J.D., and A.K.C.; V.M. generated the tetramer data under the supervision of M.M.D.; and the manuscript was written by A.G., Z.C., A.K.C.,V.M., M.M.D., and B.J.
Declaration of interests
The authors declare no competing interests.
Published: April 23, 2021
Footnotes
Supplemental information can be found online at https://doi.org/10.1016/j.isci.2021.102311.
Contributor Information
Arup K. Chakraborty, Email: arupc@mit.edu.
Boris Julg, Email: bjulg@mgh.harvard.edu.
Supplemental information
References
- Abdul-Jawad S., Ondondo B., Van Hateren A., Gardner A., Elliott T., Korber B., Hanke T. Increased valency of conserved-mosaic vaccines enhances the breadth and depth of Epitope recognition. Mol. Ther. 2016;24:375–384. doi: 10.1038/mt.2015.210. [DOI] [PMC free article] [PubMed] [Google Scholar]
- Ahmed S.F., Quadeer A.A., Morales-Jimenez D., McKay M.R. Sub-dominant principal components inform new vaccine targets for HIV Gag. Bioinformatics. 2019;35:3884–3889. doi: 10.1093/bioinformatics/btz524. [DOI] [PubMed] [Google Scholar]
- Ahmed S.F., Quadeer A.A., McKay M.R. Preliminary identification of potential vaccine targets for the COVID-19 coronavirus (SARS-CoV-2) based on SARS-CoV immunological studies. Viruses. 2020;12:254. doi: 10.3390/v12030254. [DOI] [PMC free article] [PubMed] [Google Scholar]
- Akst J. TheScientist; 2020. COVID-19 Vaccine Frontrunners. [Google Scholar]
- Barton J.P., Goonetilleke N., Butler T.C., Walker B.D., McMichael A.J., Chakraborty A.K. Relative rate and location of intra-host HIV evolution to evade cellular immunity are predictable. Nat. Commun. 2016;7:11660. doi: 10.1038/ncomms11660. [DOI] [PMC free article] [PubMed] [Google Scholar]
- Le Bert N., Tan A.T., Kunasegaran K., Tham C.Y.L., Hafezi M., Chia A., Chng M.H.Y., Lin M., Tan N., Linster M. SARS-CoV-2-specific T cell immunity in cases of COVID-19 and SARS, and uninfected controls. Nature. 2020;584:457–462. doi: 10.1038/s41586-020-2550-z. [DOI] [PubMed] [Google Scholar]
- Braun J., Loyal L., Frentsch M., Wendisch D., Georg P., Kurth F., Hippenstiel S., Dingeldey M., Kruse B., Fauchere F. SARS-CoV-2-reactive T cells in healthy donors and patients with COVID-19. Nature. 2020;587:270–274. doi: 10.1038/s41586-020-2598-9. [DOI] [PubMed] [Google Scholar]
- Butler T.C., Kardar M., Chakraborty A.K. Quorum sensing allows T cells to discriminate between self and nonself. Proc. Natl. Acad. Sci. U S A. 2013;110:11833–11838. doi: 10.1073/pnas.1222467110. [DOI] [PMC free article] [PubMed] [Google Scholar]
- Calis J.J.A., Maybeno M., Greenbaum J.A., Weiskopf D., De Silva A.D., Sette A., Keşmir C., Peters B. Properties of MHC class I presented peptides that enhance immunogenicity. PLoS Comput. Biol. 2013;9:e1003266. doi: 10.1371/journal.pcbi.1003266. [DOI] [PMC free article] [PubMed] [Google Scholar]
- Campbell K.M., Steiner G., Wells D.K., Ribas A., Kalbasi A. Prediction of SARS-CoV-2 epitopes across 9360 HLA class I alleles. bioRxiv. 2020 2020.03.30.016931. [Google Scholar]
- Channappanavar R., Fett C., Zhao J., Meyerholz D.K., Perlman S. Virus-specific memory CD8 T cells provide substantial protection from lethal severe acute respiratory Syndrome coronavirus infection. J. Virol. 2014;88:11034–11044. doi: 10.1128/JVI.01505-14. [DOI] [PMC free article] [PubMed] [Google Scholar]
- Dahirel V., Shekhar K., Pereyra F., Miura T., Artyomov M., Talsania S., Allen T.M., Altfeld M., Carrington M., Irvine D.J. Coordinate linkage of HIV evolution reveals regions of immunological vulnerability. Proc. Natl. Acad. Sci. U S A. 2011;108:11530–11535. doi: 10.1073/pnas.1105315108. [DOI] [PMC free article] [PubMed] [Google Scholar]
- Daniels M.A., Teixeiro E., Gill J., Hausmann B., Roubaty D., Holmberg K., Werlen G., Holländer G.A., Gascoigne N.R.J., Palmer E. Thymic selection threshold defined by compartmentalization of Ras/MAPK signalling. Nature. 2006;444:724–729. doi: 10.1038/nature05269. [DOI] [PubMed] [Google Scholar]
- Dash P., Fiore-Gartland A.J., Hertz T., Wang G.C., Sharma S., Souquette A., Crawford J.C., Clemens E.B., Nguyen T.H.O., Kedzierska K. Quantifiable predictive features define epitope-specific T cell receptor repertoires. Nature. 2017;547:89–93. doi: 10.1038/nature22383. [DOI] [PMC free article] [PubMed] [Google Scholar]
- Fan Y.Y., Huang Z.T., Li L., Wu M.H., Yu T., Koup R.A., Bailer R.T., Wu C.Y. Characterization of SARS-CoV-specific memory T cells from recovered individuals 4 years after infection. Arch. Virol. 2009;154:1093–1099. doi: 10.1007/s00705-009-0409-6. [DOI] [PMC free article] [PubMed] [Google Scholar]
- Ferguson A.L., Mann J.K., Omarjee S., Ndung’u T., Walker B.D., Chakraborty A.K. Translating HIV sequences into quantitative fitness landscapes predicts viral vulnerabilities for rational immunogen design. Immunity. 2013;38:606. doi: 10.1016/j.immuni.2012.11.022. [DOI] [PMC free article] [PubMed] [Google Scholar]
- Fu L., Wang B., Yuan T., Chen X., Ao Y., Fitzpatrick T., Li P., Zhou Y., Lin Y., Duan Q. Clinical characteristics of coronavirus disease 2019 (COVID-19) in China: a systematic review and meta-analysis. J. Infect. 2020;2019:656–665. doi: 10.1016/j.jinf.2020.03.041. [DOI] [PMC free article] [PubMed] [Google Scholar]
- Gaiha G.D., Rossin E.J., Urbach J., Landeros C., Collins D.R., Nwonu C., Muzhingi I., Anahtar M.N., Waring O.M., Piechocka-Trocha A. Structural topology defines protective CD8 + T cell epitopes in the HIV proteome. Science. 2019;364:480–484. doi: 10.1126/science.aav5095. [DOI] [PMC free article] [PubMed] [Google Scholar]
- Glanville J., Huang H., Nau A., Hatton O., Wagar L.E., Rubelt F., Ji X., Han A., Krams S.M., Pettus C. Identifying specificity groups in the T cell receptor repertoire. Nature. 2017;547:94–98. doi: 10.1038/nature22976. [DOI] [PMC free article] [PubMed] [Google Scholar]
- Grifoni A., Sidney J., Zhang Y., Scheuermann R.H., Peters B., Sette A., Grifoni A., Sidney J., Zhang Y., Scheuermann R.H. A sequence homology and bioinformatic approach can predict candidate targets for immune responses to SARS-CoV-2. Cell Host Microbe. 2020;27 doi: 10.1016/j.chom.2020.03.002. 671–680.e2. [DOI] [PMC free article] [PubMed] [Google Scholar]
- Grifoni A., Weiskopf D., Ramirez S.I., Mateus J., Dan J.M., Moderbacher C.R., Rawlings S.A., Sutherland A., Premkumar L., Jadi R.S. Targets of T Cell responses to SARS-CoV-2 coronavirus in humans with COVID-19 disease and unexposed individuals. Cell. 2020;181:1489–1501.e15. doi: 10.1016/j.cell.2020.05.015. [DOI] [PMC free article] [PubMed] [Google Scholar]
- Hayton E.J., Rose A., Ibrahimsa U., Sorbo M.D., Capone S., Crook A., Black A.P., Dorrell L., Hanke T. Safety and tolerability of conserved region vaccines vectored by plasmid DNA, simian adenovirus and modified vaccinia virus Ankara administered to human immunodeficiency virus type 1-uninfected adults in a randomized, single-blind phase i trial. PLoS One. 2014;9:1–8. doi: 10.1371/journal.pone.0101591. [DOI] [PMC free article] [PubMed] [Google Scholar]
- Kosmrlj A., Jha A.K., Huseby E.S., Kardar M., Chakraborty A.K. How the thymus designs antigen-specific and self-tolerant T cell receptor sequences. Proc. Natl. Acad. Sci. U S A. 2008;105:16671–16676. doi: 10.1073/pnas.0808081105. [DOI] [PMC free article] [PubMed] [Google Scholar]
- Kosmrlj A., Chakraborty A.K., Kardar M., Shakhnovich E.I. Thymic selection of T-cell receptors as an extreme value problem. Phys. Rev. Lett. 2009;103:3–6. doi: 10.1103/PhysRevLett.103.068103. [DOI] [PubMed] [Google Scholar]
- Košmrlj A., Read E., Qi Y., Allen T. Effects of thymic selection of the T cell repertoire on HLA-class I associated control of HIV infection. Nature. 2010;465:350–354. doi: 10.1038/nature08997. [DOI] [PMC free article] [PubMed] [Google Scholar]
- Létourneau S., Im E.J., Mashishi T., Brereton C., Bridgeman A., Yang H., Dorrell L., Dong T., Korber B., McMichael A.J. Design and pre-clinical evaluation of a universal HIV-1 vaccine. PLoS One. 2007;2:1–11. doi: 10.1371/journal.pone.0000984. [DOI] [PMC free article] [PubMed] [Google Scholar]
- Liu W., Fontanet A., Zhang P., Zhan L., Xin Z., Baril L., Tang F., Lv H., Cao W. Two-year prospective study of the humoral immune response of patients with severe acute respiratory Syndrome. J. Infect. Dis. 2006;193:792–795. doi: 10.1086/500469. [DOI] [PMC free article] [PubMed] [Google Scholar]
- Louie R.H.Y., Kaczorowski K.J., Barton J.P., Chakraborty A.K., McKay M.R. Fitness landscape of the human immunodeficiency virus envelope protein that is targeted by antibodies. Proc. Natl. Acad. Sci. U S A. 2018;115:E564–E573. doi: 10.1073/pnas.1717765115. [DOI] [PMC free article] [PubMed] [Google Scholar]
- Luksza M., Riaz N., Makarov V., Balachandran V.P., Hellmann M.D., Solovyov A., Rizvi N.A., Merghoub T., Levine A.J., Chan T.A. A neoantigen fitness model predicts tumour response to checkpoint blockade immunotherapy. Nature. 2017;551:517–520. doi: 10.1038/nature24473. [DOI] [PMC free article] [PubMed] [Google Scholar]
- Mandl J.N., Monteiro J.P., Vrisekoop N., Germain R.N. T cell-positive selection uses self-ligand binding strength to optimize repertoire recognition of foreign antigens. Immunity. 2013;38:263–274. doi: 10.1016/j.immuni.2012.09.011. [DOI] [PMC free article] [PubMed] [Google Scholar]
- Mann J.K., Barton J.P., Ferguson A.L., Omarjee S., Walker B.D., Chakraborty A., Ndung’u T. The fitness landscape of HIV-1 gag: advanced modeling approaches and validation of model predictions by in vitro testing. PLoS Comput. Biol. 2014;10:e1003776. doi: 10.1371/journal.pcbi.1003776. [DOI] [PMC free article] [PubMed] [Google Scholar]
- Minervina A.A., Pogorelyy M.V., Komech E.A., Karnaukhov V.K., Bacher P., Rosati E., Franke A., Chudakov D.M., Mamedov I.Z., Lebedev Y.B. Primary and secondary anti-viral response captured by the dynamics and phenotype of individual T cell clones. Elife. 2020;9:1–21. doi: 10.7554/eLife.53704. [DOI] [PMC free article] [PubMed] [Google Scholar]
- Mo H., Zeng G., Ren X., Li H., Ke C., Tan Y., Cai C., Lai K., Chen R., Chan-Yeung M. Longitudinal profile of antibodies against SARS-coronavirus in SARS patients and their clinical significance. Respirology. 2006;11:49–53. doi: 10.1111/j.1440-1843.2006.00783.x. [DOI] [PMC free article] [PubMed] [Google Scholar]
- Murugan A., Mora T., Walczak A.M., Callan C.G. Statistical inference of the generation probability of T-cell receptors from sequence repertoires. Proc. Natl. Acad. Sci. U S A. 2012;109:16161–16166. doi: 10.1073/pnas.1212755109. [DOI] [PMC free article] [PubMed] [Google Scholar]
- Nerli S., Sgourakis N.G. Structure-based modeling of SARS-CoV-2 peptide/HLA-A02 antigens. Front. Med. Technol. 2020;17 doi: 10.3389/fmedt.2020.553478. [DOI] [PMC free article] [PubMed] [Google Scholar]
- Paules C.I., Marston H.D., Fauci A.S. Coronavirus infections—more than Just the common cold. JAMA. 2020;323:707. doi: 10.1001/jama.2020.0757. [DOI] [PubMed] [Google Scholar]
- Peng Y., Mentzer A.J., Liu G., Yao X., Yin Z., Dong D., Dejnirattisai W., Rostron T., Supasa P., Liu C. Broad and strong memory CD4 (+) and CD8 (+) T cells induced by SARS-CoV-2 in UK convalescent COVID-19 patients. Nat. Immunol. 2020;21:1336–1345. doi: 10.1038/s41590-020-0782-6. [DOI] [PMC free article] [PubMed] [Google Scholar]
- Pereyra F., Heckerman D., Carlson J.M., Kadie C., Soghoian D.Z., Karel D., Goldenthal A., Davis O.B., DeZiel C.E., Lin T. HIV control is mediated in part by CD8+ T-cell targeting of specific epitopes. J. Virol. 2014;88:12937–12948. doi: 10.1128/JVI.01004-14. [DOI] [PMC free article] [PubMed] [Google Scholar]
- Pogorelyy M.V., Minervina A.A., Shugay M., Chudakov D.M., Lebedev Y.B., Mora T., Walczak A.M. Detecting T cell receptors involved in immune responses from single repertoire snapshots. PLoS Biol. 2019;17:e3000314. doi: 10.1371/journal.pbio.3000314. [DOI] [PMC free article] [PubMed] [Google Scholar]
- Prachar M., Justesen S., Steen-Jensen D.B., Thorgrimsen S.P., Jurgons E., Winther O., Bagger F.O. COVID-19 vaccine candidates: prediction and validation of 174 SARS-CoV-2 epitopes. Sci. Rep. 2020;10:20465. doi: 10.1038/s41598-020-77466-4. 2020.03.20.000794. [DOI] [PMC free article] [PubMed] [Google Scholar]
- Rydyznski Moderbacher C., Ramirez S.I., Dan J.M., Grifoni A., Hastie K.M., Weiskopf D., Belanger S., Abbott R.K., Kim C., Choi J. Antigen-specific adaptive immunity to SARS-CoV-2 in acute COVID-19 and associations with age and disease severity. Cell. 2020;183:996–1012.e19. doi: 10.1016/j.cell.2020.09.038. [DOI] [PMC free article] [PubMed] [Google Scholar]
- Shekhar K., Ruberman C.F., Ferguson A.L., Barton J.P., Kardar M., Chakraborty A.K. Spin models inferred from patient-derived viral sequence data faithfully describe HIV fitness landscapes. Phys. Rev. E. 2013;88:62705. doi: 10.1103/PhysRevE.88.062705. [DOI] [PMC free article] [PubMed] [Google Scholar]
- Stadinski B.D., Shekhar K., Gómez-Touriño I., Jung J., Sasaki K., Sewell A.K., Peakman M., Chakraborty A.K., Huseby E.S. Hydrophobic CDR3 residues promote the development of self-reactive T cells. Nat. Immunol. 2016;17:946–955. doi: 10.1038/ni.3491. [DOI] [PMC free article] [PubMed] [Google Scholar]
- Streeck H., Jolin J.S., Qi Y., Yassine-diab B., Johnson R.C., Kwon D.S., Addo M.M., Brumme C., Routy J., Little S. Human immunodeficiency virus type 1-specific CD8+ T-cell responses during primary infection are major determinants of the viral set point and loss of CD4+ T cells. J. Virol. 2009;83:7641–7648. doi: 10.1128/JVI.00182-09. [DOI] [PMC free article] [PubMed] [Google Scholar]
- Tang F., Quan Y., Xin Z.-T., Wrammert J., Ma M.-J., Lv H., Wang T.-B., Yang H., Richardus J.H., Liu W. Lack of peripheral memory B cell responses in recovered patients with severe acute respiratory Syndrome: a six-year follow-up study. J. Immunol. 2011;186:7264–7268. doi: 10.4049/jimmunol.0903490. [DOI] [PubMed] [Google Scholar]
- Vanessa J., Nielsen M. NetMHCpan-4.0: improved peptide− MHC class I interaction predictions integrating eluted ligand and peptide binding affinity data. J. Immunol. 2017;199:3360–3368. doi: 10.4049/jimmunol.1700893. [DOI] [PMC free article] [PubMed] [Google Scholar]
- Vita R., Mahajan S., Overton J.A., Dhanda S.K., Martini S., Cantrell J.R., Wheeler D.K., Sette A., Peters B. The immune epitope database (IEDB): 2018 update. Nucleic Acids Res. 2019;47:D339–D343. doi: 10.1093/nar/gky1006. [DOI] [PMC free article] [PubMed] [Google Scholar]
- Yewdell J.W. Confronting complexity: real-world immunodominance in antiviral CD8+ T cell responses. Immunity. 2006;25:533–543. doi: 10.1016/j.immuni.2006.09.005. [DOI] [PubMed] [Google Scholar]
- Zhao J., Zhao J., Perlman S. T cell responses are required for protection from clinical disease and for virus clearance in severe acute respiratory Syndrome coronavirus-infected mice. J. Virol. 2010;84:9318–9325. doi: 10.1128/JVI.01049-10. [DOI] [PMC free article] [PubMed] [Google Scholar]
Associated Data
This section collects any data citations, data availability statements, or supplementary materials included in this article.
Supplementary Materials
Data Availability Statement
All relevant data are available from the lead contact upon reasonable request. The code for the computational tool is publicly available at https://github.com/andy90/immunogenicity_predictor.