Abstract
Although previous studies have explored the gene expression profiles of human oocytes and granulosa cells by single‐cell RNA sequencing (scRNA‐seq), the dynamic regulatory network at a single‐cell resolution during folliculogenesis remains largely unknown. We identified 10 functional modules by WGCNA, four of which were significantly correlated with primary/antral oocyte and antral/pre‐ovulatory granulosa cells. Functional enrichment analysis showed that the brown module, which was correlated with antral oocyte, was enriched in oocyte differentiation, and two core subnetworks identified by MCODE were involved in cell cycle (blue subnetwork) and oogenesis (red subnetwork). The cell‐specific network (CSN) analysis demonstrated a distinct gene network structure associated with the antral follicular stage, which was notably different from other developmental stages. To our knowledge, this is the first study to explore gene functions during folliculogenesis at single‐cell network level. We uncovered two potential gene subnetworks, which may play an important role in oocyte function beginning at the antral stage, and further established their rewiring process at intra‐network/whole transcriptome level. The findings provide crucial insights from a novel network perspective to be further explored in functional mechanistic studies.
Keywords: antral stage, cell‐specific network, folliculogenesis, single‐cell RNA sequencing
1. INTRODUCTION
Folliculogenesis refers to the biological process by which an ovarian follicle matures through the primordial, primary, secondary, antral and pre‐ovulatory developmental stages. 1 The follicle is comprised of granulosa cells (GCs), which surround and support the immature oocyte. Follicle growth is rapidly increased during the antral stage, when it becomes more responsive to female hormones (eg follicle‐stimulating hormone), and the end of the development process is marked by separation of the oocyte from the GCs in the pre‐ovulatory stage. Although the large majority of follicles never complete the full development process, a small number produce mature oocytes, which are released during ovulation.
The specific gene expression pattern in different follicle maturation stages and their dynamic changes are noted to be a key factor for folliculogenesis regulation. 2 , 3 Previous studies have used single‐cell RNA sequencing (scRNA‐seq) to explore the transcriptomes of the human oocytes and GCs at five follicular stages in vivo and identified candidate secretory biomarkers of ovarian reserve in primordial and primary follicles at gene expression level. 2 However, the gene interactions and dynamic network changes throughout the folliculogenesis developmental stages remain largely unexplored.
Recently, a cell‐specific network (CSN) analysis approach has been developed to explore the comprehensive gene relationships for scRNA‐seq data from a network viewpoint. 4 In contrast to traditional network construction, which examines the relationships between genes at the grouped cell level, the CSN method constructs a separate network for each individual cell, thereby accounting for the cell type heterogeneity. This analysis has been efficiently applied to infer key time‐points of gene functions by revealing the network topology changes during human embryo development. 4 Here, we constructed cell‐specific networks for ovarian follicle development and revealed a potential network rewiring process in antral stage oocytes. Our findings provide a framework of gene relationships during folliculogenesis at the single‐cell level and also lay the foundations to explore characteristic gene functions from a novel network perspective.
2. MATERIALS AND METHODS
2.1. Data sources and sample information
The data set used in the present study was obtained from the Gene Expression Omnibus (GEO) database (https://www.ncbi.nlm.nih.gov/gds) with Accession Number GSE107746. This data set included the scRNA‐seq gene expression profiles with cell type information of 151 human follicle cells (80 oocytes and 71 GCs) at five different developmental stages. 2 Cells with fewer than 2400 genes or 500 000 mapped reads were filtered out. In total, 80 oocytes and 71 GCs at five developmental stages passed the filter standards. To ensure the accuracy of estimated gene expression levels, only genes with FPKM > 1 in at least one cell were analysed. An offset value of 1.0 was added for each gene, and the expression levels were log2‐transformed for further analysis. Cell type information is listed in Table S1.
2.2. Construction of co‐expression modules
The top 5,000 highly variable genes were selected using the FindVariableFeatures function in Seurat (v3.1.2), and weighted gene co‐expression network analysis (WGCNA) was used to identify functional modules in the co‐expression network. 5 WGCNA uses soft thresholding to select an appropriate power for constructing the adjacency matrix from the gene correlation matrix. The power amplifies the differences in gene co‐expression and is selected such that the co‐expression network will have a scale‐free topology (β = 14, Figure S2B). The adjacency matrix is used to construct a topological overlap matrix, which is then used as input for hierarchical clustering to identify gene functional modules. We set the minimum module size to be 30 genes and each module was represented by its eigengene, defined as the first principal component of a given module. The average gene significance (GS) was calculated to identify correlation between module eigengenes and a certain cell type, and module membership (MM) was defined as the Pearson correlation between each gene and the module eigengene.
2.3. Protein‐protein network (PPI) construction and subnetwork identification
The important WGCNA module genes with GS > 0.2 and MM > 0.8 were used as input to construct the PPI network to assess their inter‐relationships at protein level. The PPI network was constructed by the Search Tool for the Retrieval of Interacting Genes (STRING) database and Cytoscape software. Molecular complex detection (MCODE) was used to identify the most densely connected subnetworks in the PPI network with the following parameters: degree cut‐off = 2, node score cut‐off = 0.2, K‐core value = 2 and MCODE score > 5. The Pearson correlation coefficient between genes in each subnetwork was calculated by using the R package corrplot.
2.4. Functional enrichment analysis
Functional enrichment analysis was conducted on four WGCNA gene modules and two PPI subnetworks. Gene Ontology (GO) and Kyoto Encyclopedia of Genes and Genomes (KEGG) analysis were conducted using the R package ClusterProfiler. Only those terms with adjusted P value < 0.05 were considered as significant. The top 20 records ranked by adjusted P value were extracted when more records were returned.
2.5. Cell communication inference
We used an open‐source R package iTALK (https://github.com/Coolgenome/iTALK) to identify and illustrate intercellular signalling communications. This approach was designed to profile the ligand‐receptor (L‐R)–mediated cross‐talk signals from scRNA‐seq data based on a built‐in database, which includes 2648 L‐R pairs classified into four categories: cytokines/chemokines, immune, checkpoint genes, growth factors and others. We ranked the top 100 L‐R pairs based on their expression levels, and the top 20 highly abundant L‐R gene pairs were selected for further visualization.
2.6. Immunohistochemistry
We performed immunohistochemistry staining of the ovarian tissue samples of SD rat (8 week) as previously described. 2 Briefly, the paraffin‐embedded ovarian tissue sections were deparaffinated and rehydrated in xylene and decreasing graded ethanol. Subsequently, the sections were demasked in citrate buffer (pH 6.0) for 20 minutes at 98℃ and cooled down to room temperature and incubated in 0.3% H2O2 for 10 minutes. The sections were treated overnight at 4°C with primary antibodies, followed by consecutive incubations with biotinylated secondary antibody and streptavidin‐peroxidase conjugate. Colour development was achieved using DAB.
2.7. Cell‐specific network construction and network degree matrix transfer
We used MATLAB software to construct a CSN of gene associations for each individual cell in the scRNA‐seq data. 4 In the CSN of cell k, there are m gene nodes and the edge corresponding to the pairwise association between genes x and y is estimated by (Equation 1). The CSN method can be illustrated as a scatter diagram based on the expression values of genes x and y in different cells (Figure S1), in which each dot represents an individual cell (x‐axis shows the expression values of gene X, and y‐axis shows the expression values of gene Y for cell k). The number of dots (ie cell number) in the green, yellow and intersection boxes is denoted as , and , respectively, where n represents the total cell number in the scatter diagram (ie n = 151). We used the default parameter settings for CSN, where , and the coefficient 0.1 denotes the box size.
| (1) |
After hypothesis testing to determine the significance of the edge, the edge weight between genes edge xy (k) was set to either 0 or 1. The network degree matrix (NDM) was then constructed to represent the network features in a lower dimension. For gene x in the network of cell k (Equation 2):
| (2) |
3. RESULTS
3.1. Construction of gene co‐expression network
Based on hierarchical clustering in WGCNA, the oocytes and GCs were correctly divided into two clusters (Figure S2A). When the power value for constructing the adjacency matrix was set to 12, the independence degree was estimated to be 0.9 and the mean connectivity was close to zero, suggesting a scale‐free topology of the co‐expression network (Figure S2B). WGCNA identified ten distinct functional modules ranging in size from 48 genes (purple module) to 935 genes (turquoise module) (Figure 1A). The eigengene adjacency heat map suggested that these ten modules could be classified into two distinct clusters (Figure 1B).
FIGURE 1.
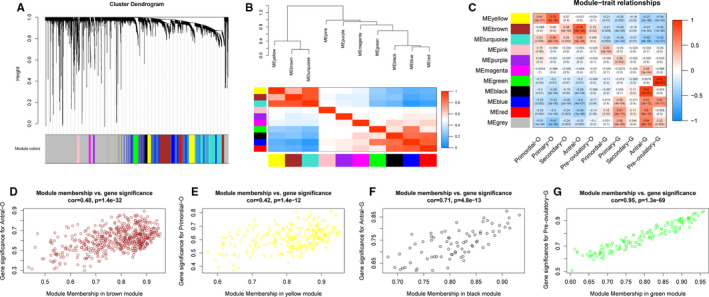
Construction of gene correlation modules. A, The clustering dendrograms of genes. Each gene is represented by one branch, and ten co‐expression modules were constructed and are represented by different colours. B, The eigengene dendrogram and heat map identify groups of correlated eigengenes cross modules. C, Module‐trait relationships. Each row presents a module eigengene, and columns indicate cell type. The corresponding correlation and P value have been marked out. D, Scatter plots of module membership vs. gene significance in brown, yellow, black and green modules
3.2. Quantifying gene co‐expression module‐cell type associations
Modules in the first cluster (including yellow, brown and turquoise modules) were identified to have the highest correlation coefficients between their eigengenes with oocytes; eigengenes of the modules in the other cluster (including pink, purple, magenta, green, black, blue, red modules) had the highest module‐cell type correlation coefficients in GCs (Figure 1B‐C). The yellow and brown modules were more specifically associated with primary and antral stage oocytes, respectively. The black and green modules were more specifically associated with antral and pre‐ovulatory stage GCs, respectively (Figure 1D‐G). These four modules (yellow, brown, black and green) were considered for further downstream analysis.
3.3. Functional enrichment analysis
GO enrichment analysis was performed to uncover the biological function of genes in the four interesting modules (Figure 2A, Figure S3A‐C). The analysis revealed several specifically enriched biological processes related to oocyte development and meiosis (eg GO0009994: oocyte differentiation, GO0048599: oocyte development, GO0051321: meiotic cell cycle, GO0048477: oogenesis, GO0051445: regulation of meiotic cell cycle and GO0000212: meiotic spindle organization) that were only associated with antral stage oocytes (P adjusted < 0.05; Figure 2A). In addition, the brown module had the highest gene significance score (reflecting how strongly the module gene expression values correlate with a certain cell type) across modules (Figure 2B), indicating that genes in the brown module were predominantly up‐regulated in this cell type. The top 30 high‐degree genes in the brown (Figure 2C), yellow, black and green modules (Figure S3D‐F) were denoted in their respective networks.
FIGURE 2.
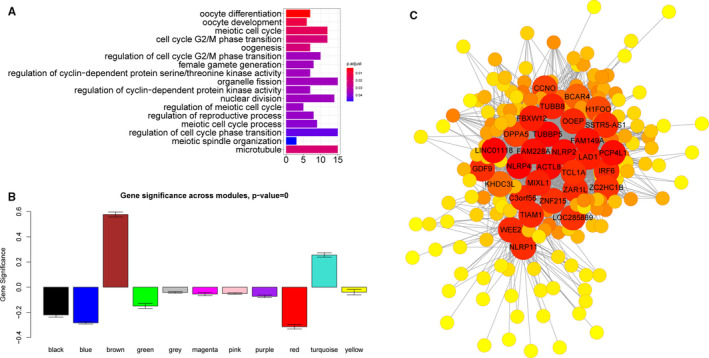
Analysis of the brown module associated with antral stage oocytes. A, GO enrichment results of genes in brown module. B, Gene significance identified as associated with antral stage oocytes crosses modules. C, Co‐expression regulation network in brown module. Red nodes have a high connection degree, and the top 30 degree nodes have been annotated with gene symbols
3.4. Oocyte and granulosa cell communications
We used iTALK to characterize the L‐R–mediated intercellular communication and list the top 100 L‐R pairs in antral stage oocytes and GCs (Table S2). Figure 3A displayed the top 20 highly expressed L‐R interactions. In addition, the box plots showed the expression levels of five L‐R pairs that were included in the brown module (Figure 3B‐F). Most of these genes have high expression levels in the antral stage. Several genes including BMPR2, HDC, HRH2 and TNFSF13 even have the highest expression levels during other developmental stages. The expression levels of HDC in different stage oocytes were supported by immunofluorescence labelling (Figure 3G).
FIGURE 3.
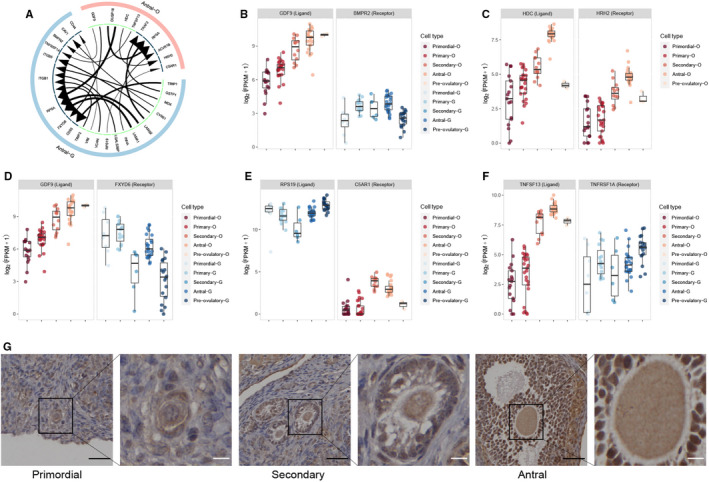
Analysis of cell communication in antral stage follicles. A, Circos plots show the top 20 highly expressed ligand‐receptor interactions in antral stage follicle. B. The expression of GDF9 (ligand)‐BMPR2 (receptor) gene pair. C, The expression of HDC (ligand)‐HRH2 (receptor) gene pair. D, The expression of GDF9 (ligand)‐FXYD6 (receptor) gene pair. E, The expression of RPS19 (ligand)‐C5AR1 (receptor) gene pair. F, The expression of TNFSF13 (ligand)‐TNFRSF1A (receptor) gene pair. G, Immunohistochemistry staining of HDC in primordial, secondary and antral stage oocytes. The scale bars represent 40 μm in low‐magnification view and 10 μm in high‐magnification view
3.5. Pivotal subnetwork identification of genes associated with antral stage oocyte
Genes with both high gene significance (GS > 0.2) and high module membership (MM > 0.8) in the brown module were used to construct the PPI network (Figure 4A), and MCODE was used to extract the pivotal subnetworks as hub modules. We identified two hub modules in the original PPI network (Figure 4B‐C). The blue module (MCODE score = 10.6) consisted of eleven genes, including CDC25C and KIF4A. The red module (MCODE score = 6.0) consisted of seven genes including BMP15, GDF9, ZP1 and ZP2. Furthermore, genes in these two subnetworks were significantly correlated with each other (Figure 4D‐E). GO and KEGG pathway analysis revealed that the blue subnetwork genes were mainly enriched in GO0044839 (cell cycle G2/M phase transition), GO0031570 (DNA integrity checkpoint), GO0000075 (cell cycle checkpoint) and hsa04114 (oocyte meiosis; Figure 5A‐B), whereas red subnetwork genes were highly enriched in GO0009994 (oocyte differentiation), GO0048477 (oogenesis), GO0030509 (BMP signalling pathway), GO0048599 (oocyte development) and hsa04913 (ovarian steroidogenesis; Figure 5C‐D).
FIGURE 4.
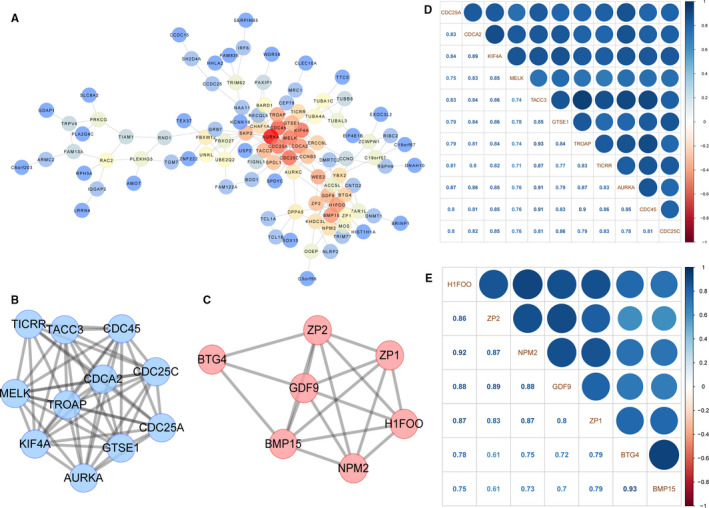
Visualization of PPI network analysis result. A, PPI network of brown module genes with GS > 0.5 and MM > 0.8. B, A subnetwork screened by MCODE, MCODE score = 10.2. C, Another subnetwork screened by MCODE, MCODE score = 6.0. D, Correlation between the blue subnetwork genes. E, Correlation between the red subnetwork genes
FIGURE 5.
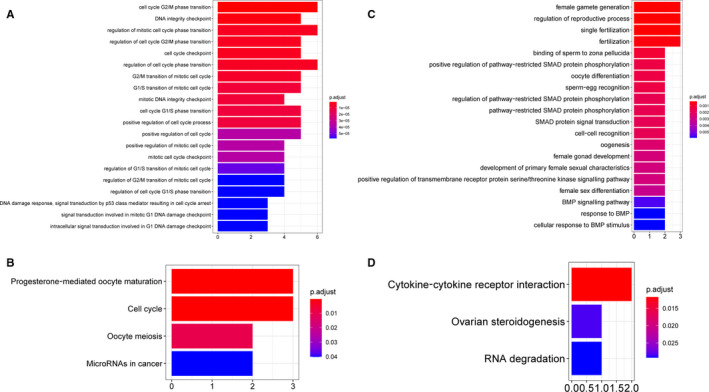
Enrichment analysis of two subnetwork genes. A, Top 20 GO enrichment analysis results of the blue subnetwork genes. B, KEGG enrichment analysis results of the blue subnetwork genes. C, Top 20 GO enrichment analysis results of the red subnetwork genes. D, KEGG enrichment analysis results of the red subnetwork genes
3.6. CSN rewiring in antral stage oocyte
We performed the network rewiring analysis on the two identified subnetworks. We observed that the subnetwork genes were weakly interconnected in primordial, primary and secondary stages, and that the connections between these genes become much stronger in the antral stage. For instance, in the antral stage, strong connections were established between GTSE1, KIF4A, CDCA2, NPM2, H1FOO, BMP15 and other genes. In the antral stage, the gene associations were strongest between CDC25C, NPM2 and ZP1, although the connections between all the genes involved in these two subnetworks were greatly strengthened during this stage. These findings based on the CSN algorithm suggest a drastic network rewiring process during folliculogenesis (Figure 6).
FIGURE 6.
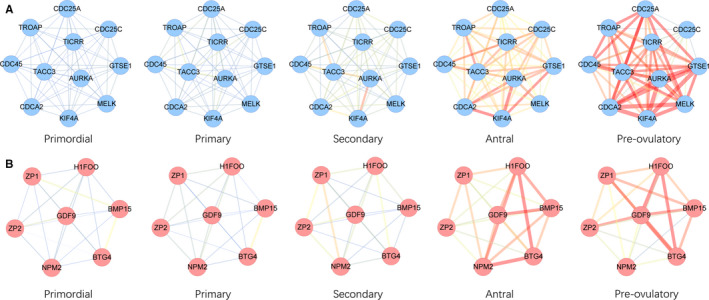
CSN construction among two pivotal subnetworks. A, CSN of the blue subnetwork. Edge colour represents mean connection score in each cell type from blue (low) to red (high). B, CSN of the red subnetwork. Edge colour represents mean connection score in each cell type from blue (low) to red (high)
3.7. Dynamic changes in network degree along folliculogenesis
To explore the gene connections on the whole transcriptome level, we calculated network degrees of each gene in the two subnetworks. The network degrees of CDC25C, TACC3, TICRR, TROAP, NPM2, BMP15 and ZP2 approached their peaks in the antral stage (Figure 7). Additionally, most other genes in the two subnetworks also demonstrated the highest degree in the antral oocytes with the exception of AURKA, KIF4A and MELK (Figure S4). The largest differences in NDM trends across different subnetwork genes were observed in the pre‐ovulatory stage at the conclusion of folliculogenesis.
FIGURE 7.
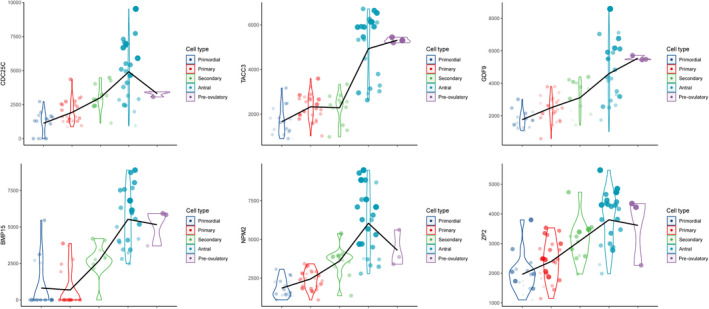
NDM of two subnetwork genes. Differential network degrees of two subnetwork genes in five follicle stages. Point size represents the total connection scores among the subnetworks that the gene belonged to
4. DISCUSSION
With the development of single‐cell sequencing technology, new algorithms have provided an unprecedented opportunity to identify gene associations/networks at the single‐cell resolution level. 4 By integrating the classical WGCNA into the novel CSN analysis, our research aimed to explore the gene functions of follicles, especially at antral stage. Antral stage is an important period in folliculogenesis as antral follicle status plays a critical role in ovarian functions and influence reproductive abilities. 6 , 7 , 8 The biomarkers specific to the antral stage follicle are also representative indicators for the prediction of ovarian response in fertility treatments. 8 , 9
In this study, ten co‐expression gene modules were constructed using the most highly variable genes in 151 oocytes and GCs. 2 Four modules were detected as significantly correlated with a specific oocyte or GC subtype. GO enrichment analysis across the four gene modules identified one module (brown module), which was mainly enriched in meiotic cell cycle and oocyte differentiation, underlying their potential roles in oogenesis. We then confirmed that this functional module had the highest gene significance value in antral stage oocytes, and further used Cytoscape software to show the memberships in this module. The module genes were then sorted based on their connection degree.
The genes with the highest degree connectivity were NLRP4, NLRP2 and NLRP11. The NLRP (nucleotide‐binding oligomerization domain, leucine‐rich repeat and pyrin domain‐containing) gene family has previously been reported to be involved in reproductive functions. 10 , 11 , 12 Various NLRPs were shown to have stage‐dependent expression level during human pre‐implantation development, 13 and they are duplicated and functionally diversified in mammalian reproductive systems. 14 , 15 , 16 Tubulin beta‐eight class VIII (TUBB8) is a subtype of β‐tubulin that only exists in primates, and mutations in TUBB8 are responsible for human oocyte meiotic arrest. 17 As most of these high‐degree genes have previously been reported to be involved in reproductive function, 18 , 19 , 20 , 21 , 22 , 23 we selected the brown module genes for further downstream analysis.
Reciprocal communications between human oocytes and GCs played key roles in folliculogenesis. 24 , 25 , 26 We predicted interactions of GCs‐oocytes, oocytes‐GCs, oocytes‐oocytes and GCs‐GCs in antral stage follicles and showed the top five L‐R pairs involving brown module genes. Growth differentiation factor 9 (GDF9) has been shown to act through miR‐375 to affect BMPR2 expression and Smad signalling pathway activation, 27 which ultimately affected the proliferation, spread and apoptosis of bovine cumulus cells. 28 Exploring the effect of the GDF9‐miR‐375‐BMPR2 molecular pathway on human antral stage follicles may be a valuable future research direction. Another interesting identified gene pair was HDC (ligand) and HRH2 (receptor), which were specifically highly expressed in antral follicles. Transplanted imaginal discs homozygous for an hdc mutation were found to affect oogenesis in the recipient females, 29 although the specific function of HDC and HRH2 remains largely undefined. Our findings provide novel insight into this gene pair interaction, which may be related to autocrine signalling in oocytes.
Hao et al 4 presented a novel algorithm to construct a CSN for individual cells from scRNA‐seq transcriptomic profiles. This method transforms the 'unstable' gene expression form to a more 'stable' gene association form. This is the first technique to enable the identification of gene associations/network at a single‐cell resolution level. We applied the CSN approach to the noteworthy PPI subnetworks and demonstrated that many connections, which were weak in the early development stages, became significantly stronger in the antral stage. Furthermore, network degree connectivity of many subnetwork genes approached their peaks in the oocytes at this period. These results indicate a drastic network rewiring process during the antral stage and further strengthen the evidence that the antral stage may be the key time‐point for the function of the genes in these subnetworks.
Oocyte nucleolus is the most prominent subcellular organelle in the oocyte, and the maternal nucleolus is essential for early embryonic development in mammals. 30 Proteomic analysis identified nucleoplasmin 2 (NPM2) as a dominant component of the oocyte nucleolus. 31 Additionally, oocytes in knockout mice lacking Npm2 (Npm 2‐/‐) could not be transformed into surrounded nucleolus (SN) configuration. 32 Furthermore, the expression of NPM2 alone sufficed to reconstitute the nucleolar structure in enucleated embryos, and rescued their full‐term development. 31 Our result indicates that antral stage oocytes may have special nucleus actions in nucleolus via NPM2 and thus establish a foundation for further cytobiology studies.
TACC3 is a core component of the liquid‐like meiotic spindle domain (LISD) assembly. Mammalian oocytes segregated chromosomes with a specialized non‐centrosomal microtubule spindle through LISD, which was quite different from both somatic cells and male germ cells. TACC3(ΔNT)‐TACC3–depleted oocytes exhibited serious spindle bipolarization delay with spindle instability and fragmentation. 33 The drastic changes in TACC3 in the CSN level may imply that the oocytes may assist in the preparation for the subsequent meiotic division process. Further research should provide insight into the detailed mechanisms of these drastic changes.
The replication helicase is comprised of CMG (CDC45, MCM2‐7 and GINS) in eukaryotic cells. 34 Treslin (encoded by TICRR), which orchestrates assembly of the CMG in human cells, is essential for incorporation of CDC45 into the replicative helicase and helps to trigger the initiation of DNA replication. 35 GTSE1 is an upstream regulator of microtubule stability, chromosome alignment and spindle pole integrity mediated by KIF4A. 36 , 37 The cells depleted of GTSE1 display hyper‐stabilized spindle microtubules, which in turn diminish accumulation of the chromokines in KIF4A, 38 and depletion of KIF4A induces multipolar spindles. 37 GDF9 and BMP15 play vital roles in follicular growth, atresia, ovulation, fertilization, reproduction and maintenance. Numerous studies in both humans and mice have demonstrated a synergy between BMP15 and GDF9, 39 , 40 which is primarily mediated by the bone morphogenetic protein type II receptor (BMPR2). 41 Human ZP is composed of four glycosylated proteins, ZP1‐ZP4, which are synthesized, processed, secreted and assembled into long, cross‐linked fibrils by growing oocytes. A ZP2‐ZP3 dimer is located periodically along ZP fibrils that are cross‐linked by ZP1, a protein with a proline‐rich N terminus. 42 Mutant ZP1 proteins that fail to interact with either ZP2 or ZP3 will cause oocyte degeneration. 43 Our results may provide clues for such reported interactions and other undefined interactions distinctive to antral stage oocytes. We note that the general network degrees of these genes were not strictly related to the total connection scores among the subnetworks they belong to. The dynamic tendency of these genes varies, especially in the pre‐ovulatory stage. Although these results may stem from the specific connection state, another factor that must be considered is the insufficient pre‐ovulatory oocyte numbers (only three cells). More cells are needed to get the unbiased expression information, which directly influenced the CSN connections and network degree values. Furthermore, validation of certain molecular functions should be performed to unveil the complex roles of the genes in the CSN during follicular development.
In summary, our analysis identified two pivotal gene subnetworks, which may play an important role in antral stage oocytes. Genes in these subnetworks demonstrated a drastic intra‐network/whole transcriptome rewiring process that began in the antral stage. This is the first study to identify the gene associations/network for oogenesis at single‐cell resolution, and it establishes the foundations to reveal advanced mechanisms in antral stage folliculogenesis in a new perspective based on the cell‐specific network.
CONFLICT OF INTEREST
The authors have declared no conflict of interest.
AUTHOR CONTRIBUTIONS
shengran wang: Formal analysis (lead); Validation (lead); Visualization (lead); Writing‐original draft (lead); Writing‐review & editing (supporting). yun gong: Conceptualization (equal); Writing‐review & editing (equal). zun wang: Conceptualization (equal); Writing‐review & editing (equal). Jonathan Greenbaum: Conceptualization (equal); Writing‐review & editing (equal). hongmei xiao: Funding acquisition (equal); Writing‐review & editing (lead). hongwen deng: Funding acquisition (equal); Writing‐review & editing (lead).
Supporting information
Fig S1
Fig S2
Fig S3
Fig S4
Table S1
Table S2
ACKNOWLEDGEMENTS
Hong‐Wen Deng was partially supported by grants from the National Institutes of Health (U19AG05537301, R01AR069055, P20GM109036, R01MH104680 and R01AG061917). Hong‐Mei Xiao was partially supported by the National Key R&D Program of China (2017YFC1001100 and 2016YFC1201805). This research was also partially supported by the Hunan Provincial Innovation Foundation for Postgraduate (CX20200302) and the Fundamental Research Funds for the Central Universities of Central South University (1053320191844/2020zzts224).
Wang S, Gong Y, Wang Z, Greenbaum J, Xiao H‐M, Deng H‐W. Cell‐specific network analysis of human folliculogenesis reveals network rewiring in antral stage oocytes. J Cell Mol Med. 2021;25:2851–2860. 10.1111/jcmm.16315
Contributor Information
Hong‐Mei Xiao, Email: hmxiao@csu.edu.cn.
Hong‐Wen Deng, Email: hdeng2@tulane.edu.
DATA AVAILABILITY STATEMENT
The scRNA‐seq data used in this study were available from the GEO data sets with Accession Number GSE107746.
REFERENCES
- 1. Jozkowiak M, Hutchings G, Jankowski M, et al. The stemness of human ovarian granulosa cells and the role of resveratrol in the differentiation of MSCs‐a review based on cellular and molecular knowledge. Cells. 2020;9(6):1418. 10.3390/cells9061418 [DOI] [PMC free article] [PubMed] [Google Scholar]
- 2. Zhang Y, Yan Z, Qin Q, et al. Transcriptome landscape of human folliculogenesis reveals oocyte and granulosa cell interactions. Mol Cell. 2018;72(6):1021‐1034.e4. [DOI] [PubMed] [Google Scholar]
- 3. Ferrero H, Corachán A, Aguilar A, et al. Single‐cell RNA sequencing of oocytes from ovarian endometriosis patients reveals a differential transcriptomic profile associated with lower quality. Hum Reprod. 2019;34(7):1302‐1312. [DOI] [PubMed] [Google Scholar]
- 4. Dai H, Li L, Zeng T, Chen L. Cell‐specific network constructed by single‐cell RNA sequencing data. Nucl Acids Res. 2019;47(11):e62. 10.1093/nar/gkz172 [DOI] [PMC free article] [PubMed] [Google Scholar]
- 5. Langfelder P, Horvath S. WGCNA: an R package for weighted correlation network analysis. BMC Bioinform. 2008;9:559. [DOI] [PMC free article] [PubMed] [Google Scholar]
- 6. Baerwald A, Adams G, Pierson R. Ovarian antral folliculogenesis during the human menstrual cycle: a review. Hum Reprod Update. 2012;18(1):73‐91. 10.1093/humupd/dmr039 [DOI] [PubMed] [Google Scholar]
- 7. Liu L, Zhou C. Anti‐Müllerian hormone and antral follicle count differ in their ability to predict cumulative treatment outcomes of the first complete ovarian stimulation cycle in patients from POSEIDON groups 3 and 4. J Obstet Gynaecol Res. 2020;46(9):1801‐1808. [DOI] [PubMed] [Google Scholar]
- 8. Liao S, Xiong J, Tu H, et al. Prediction of in vitro fertilization outcome at different antral follicle count thresholds combined with female age, female cause of infertility, and ovarian response in a prospective cohort of 8269 women. Medicine. 2019;98(41):e17470. 10.1097/md.0000000000017470 [DOI] [PMC free article] [PubMed] [Google Scholar]
- 9. Kim J, Hwang K, Chae S, Yoon S, Choi Y. Impact of the newly recommended antral follicle count cutoff for polycystic ovary in adult women with polycystic ovary syndrome. Hum Reprod. 2020;35(3):652‐659. 10.1093/humrep/deaa012 [DOI] [PubMed] [Google Scholar]
- 10. McDaniel P, Wu X. Identification of oocyte‐selective NLRP genes in rhesus macaque monkeys (Macaca mulatta). Mol Reprod Dev. 2009;76(2):151‐159. 10.1002/mrd.20937 [DOI] [PubMed] [Google Scholar]
- 11. Li G, Tian X, Lv D, et al. NLRP7 is expressed in the ovine ovary and associated with in vitro pre‐implantation embryo development. Reproduction (Cambridge, England). 2019;158(5):415‐427. 10.1530/rep-19-0081 [DOI] [PMC free article] [PubMed] [Google Scholar]
- 12. Peng H, Liu F, Li W, Zhang W. Knockdown of NLRP5 arrests early embryogenesis in sows. Anim Reprod Sci. 2015;163:151‐156. 10.1016/j.anireprosci.2015.11.004 [DOI] [PubMed] [Google Scholar]
- 13. Zhang P, Dixon M, Zucchelli M, et al. Expression analysis of the NLRP gene family suggests a role in human preimplantation development. PLoS One. 2008;3(7):e2755. 10.1371/journal.pone.0002755 [DOI] [PMC free article] [PubMed] [Google Scholar]
- 14. Tian X, Pascal G, Monget P. Evolution and functional divergence of NLRP genes in mammalian reproductive systems. BMC Evol Biol. 2009;9:202. 10.1186/1471-2148-9-202 [DOI] [PMC free article] [PubMed] [Google Scholar]
- 15. Peng H, Zhang W, Xiao T, Zhang Y. Nlrp4g is an oocyte‐specific gene but is not required for oocyte maturation in the mouse. Reprod Fertil Dev. 2014;26(5):758‐768. 10.1071/rd12409 [DOI] [PubMed] [Google Scholar]
- 16. Docherty L, Rezwan F, Poole R, et al. Mutations in NLRP5 are associated with reproductive wastage and multilocus imprinting disorders in humans. Nat Commun. 2015;6:8086. [DOI] [PMC free article] [PubMed] [Google Scholar]
- 17. Feng R, Sang Q, Kuang Y, et al. Mutations in TUBB8 and human oocyte meiotic arrest. N Engl J Med. 2016;374(3):223‐232. 10.1056/NEJMoa1510791 [DOI] [PMC free article] [PubMed] [Google Scholar]
- 18. Cao Q, Zhao C, Zhang X, et al. Heterozygous mutations in ZP1 and ZP3 cause formation disorder of ZP and female infertility in human. J Cell Mol Med. 2020;24(15):8557‐8566. 10.1111/jcmm.15482 [DOI] [PMC free article] [PubMed] [Google Scholar]
- 19. Sun L, Fang X, Chen Z, et al. Compound heterozygous ZP1 mutations cause empty follicle syndrome in infertile sisters. Hum Mutat. 2019;40(11):2001‐2006. 10.1002/humu.23864 [DOI] [PubMed] [Google Scholar]
- 20. Zheng P, Dean J. Oocyte‐specific genes affect folliculogenesis, fertilization, and early development. Semin Reprod Med. 2007;25(4):243‐251. 10.1055/s-2007-980218 [DOI] [PubMed] [Google Scholar]
- 21. Sanfins A, Rodrigues P, Albertini D. GDF‐9 and BMP‐15 direct the follicle symphony. J Assist Reprod Genet. 2018;35(10):1741‐1750. 10.1007/s10815-018-1268-4 [DOI] [PMC free article] [PubMed] [Google Scholar]
- 22. Oh J, Susor A, Schindler K, Schultz R, Conti M. Cdc25A activity is required for the metaphase II arrest in mouse oocytes. J Cell Sci. 2013;126:1081‐1085. 10.1242/jcs.115592 [DOI] [PMC free article] [PubMed] [Google Scholar]
- 23. Jiao Z, Xu M, Woodruff T. Age‐associated alteration of oocyte‐specific gene expression in polar bodies: potential markers of oocyte competence. Fertil Steril. 2012;98(2):480‐486. 10.1016/j.fertnstert.2012.04.035 [DOI] [PMC free article] [PubMed] [Google Scholar]
- 24. Yefimova M, Lefevre C, Bashamboo A, et al. Granulosa cells provide elimination of apoptotic oocytes through unconventional autophagy‐assisted phagocytosis. Hum Reprod. 2020;35(6):1346‐1362. 10.1093/humrep/deaa097 [DOI] [PubMed] [Google Scholar]
- 25. Sun Z, Zhang H, Wang X, et al. TMCO1 is essential for ovarian follicle development by regulating ER Ca store of granulosa cells. Cell Death Differ. 2018;25(9):1686‐1701. 10.1038/s41418-018-0067-x [DOI] [PMC free article] [PubMed] [Google Scholar]
- 26. Chang H, Qiao J, Leung P. Oocyte‐somatic cell interactions in the human ovary‐novel role of bone morphogenetic proteins and growth differentiation factors. Hum Reprod Update. 2016;23(1):1‐18. 10.1093/humupd/dmw039 [DOI] [PMC free article] [PubMed] [Google Scholar]
- 27. McGee E, Raj R. Regulators of ovarian preantral follicle development. Semin Reprod Med. 2015;33(3):179‐184. 10.1055/s-0035-1552584 [DOI] [PubMed] [Google Scholar]
- 28. Liu C, Yuan B, Chen H, et al. Effects of MiR‐375‐BMPR2 as a key factor downstream of BMP15/GDF9 on the Smad1/5/8 and Smad2/3 signaling pathways. Cell Physiol Biochem. 2018;46(1):213‐225. 10.1159/000488424 [DOI] [PubMed] [Google Scholar]
- 29. Gusachenko A, Akhmamet'eva E, Omel'ianchuk L. Range of potential functions of the Drosophila melanogaster hdc gene. Genetika. 2006;42(1):58‐64. [PubMed] [Google Scholar]
- 30. Ogushi S, Palmieri C, Fulka H, Saitou M, Miyano T, Fulka J. The maternal nucleolus is essential for early embryonic development in mammals. Science (New York, NY). 2008;319(5863):613‐616. 10.1126/science.1151276 [DOI] [PubMed] [Google Scholar]
- 31. Ogushi S, Yamagata K, Obuse C, et al. Reconstitution of the oocyte nucleolus in mice through a single nucleolar protein, NPM2. J Cell Sci. 2017;130(14):2416‐2429. 10.1242/jcs.195875 [DOI] [PMC free article] [PubMed] [Google Scholar]
- 32. De La Fuente R, Viveiros M, Burns K, Adashi E, Matzuk M, Eppig J. Major chromatin remodeling in the germinal vesicle (GV) of mammalian oocytes is dispensable for global transcriptional silencing but required for centromeric heterochromatin function. Dev Biol. 2004;275(2):447‐458. 10.1016/j.ydbio.2004.08.028 [DOI] [PubMed] [Google Scholar]
- 33. So C, Seres K, Steyer A, et al. A liquid‐like spindle domain promotes acentrosomal spindle assembly in mammalian oocytes. Science (New York, NY). 2019;364(6447):eaat9557. 10.1126/science.aat9557 [DOI] [PMC free article] [PubMed] [Google Scholar]
- 34. Bruck I, Kaplan D. The replication initiation protein Sld3/Treslin Orchestrates the assembly of the replication fork helicase during S phase. J Biol Chem. 2015;290(45):27414‐27424. 10.1074/jbc.M115.688424 [DOI] [PMC free article] [PubMed] [Google Scholar] [Retracted]
- 35. Guo C, Kumagai A, Schlacher K, Shevchenko A, Shevchenko A, Dunphy W. Interaction of Chk1 with Treslin negatively regulates the initiation of chromosomal DNA replication. Mol Cell. 2015;57(3):492‐505. 10.1016/j.molcel.2014.12.003 [DOI] [PMC free article] [PubMed] [Google Scholar]
- 36. Bendre S, Rondelet A, Hall C, et al. GTSE1 tunes microtubule stability for chromosome alignment and segregation by inhibiting the microtubule depolymerase MCAK. J Cell Biol. 2016;215(5):631‐647. 10.1083/jcb.201606081 [DOI] [PMC free article] [PubMed] [Google Scholar]
- 37. Tipton A, Wren J, Daum J, Siefert J, Gorbsky G. GTSE1 regulates spindle microtubule dynamics to control Aurora B kinase and Kif4A chromokinesin on chromosome arms. J Cell Biol. 2017;216(10):3117‐3132. 10.1083/jcb.201610012 [DOI] [PMC free article] [PubMed] [Google Scholar]
- 38. Takahashi M, Tanaka K, Wakai T, Hirota T. Phosphoproteomic analysis of human mitotic chromosomes identified a chromokinesin KIF4A. Biomed Res. 2016;37(2):161‐165. 10.2220/biomedres.37.161 [DOI] [PubMed] [Google Scholar]
- 39. Persani L, Rossetti R, Di Pasquale E, Cacciatore C, Fabre S. The fundamental role of bone morphogenetic protein 15 in ovarian function and its involvement in female fertility disorders. Hum Reprod Update. 2014;20(6):869‐883. 10.1093/humupd/dmu036 [DOI] [PubMed] [Google Scholar]
- 40. Peng J, Li Q, Wigglesworth K, et al. Growth differentiation factor 9:bone morphogenetic protein 15 heterodimers are potent regulators of ovarian functions. Proc Natl Acad Sci U S A. 2013;110(8):E776‐E785. 10.1073/pnas.1218020110 [DOI] [PMC free article] [PubMed] [Google Scholar]
- 41. Chen H, Liu C, Jiang H, et al. Regulatory role of miRNA‐375 in expression of BMP15/GDF9 receptors and its effect on proliferation and apoptosis of bovine cumulus cells. Cell Physiol Biochem. 2017;41(2):439‐450. 10.1159/000456597 [DOI] [PubMed] [Google Scholar]
- 42. Litscher E, Wassarman P. Zona pellucida proteins, fibrils, and matrix. Ann Rev Biochem. 2020;89:695‐715. 10.1146/annurev-biochem-011520-105310 [DOI] [PubMed] [Google Scholar]
- 43. Xu Q, Zhu X, Maqsood M, et al. A novel homozygous nonsense ZP1 variant causes human female infertility associated with empty follicle syndrome (EFS). Mol Genet Genom Med. 2020;8(7):e1269. 10.1002/mgg3.1269 [DOI] [PMC free article] [PubMed] [Google Scholar]
Associated Data
This section collects any data citations, data availability statements, or supplementary materials included in this article.
Supplementary Materials
Fig S1
Fig S2
Fig S3
Fig S4
Table S1
Table S2
Data Availability Statement
The scRNA‐seq data used in this study were available from the GEO data sets with Accession Number GSE107746.


