

Abstract
Similar to the brain, the eye is considered an immune‐privileged organ where tissue‐resident macrophages provide the major immune cell constituents. However, little is known about spatially restricted macrophage subsets within different eye compartments with regard to their origin, function, and fate during health and disease. Here, we combined single‐cell analysis, fate mapping, parabiosis, and computational modeling to comprehensively examine myeloid subsets in distinct parts of the eye during homeostasis. This approach allowed us to identify myeloid subsets displaying diverse transcriptional states. During choroidal neovascularization, a typical hallmark of neovascular age‐related macular degeneration (AMD), we recognized disease‐specific macrophage subpopulations with distinct molecular signatures. Our results highlight the heterogeneity of myeloid subsets and their dynamics in the eye that provide new insights into the innate immune system in this organ which may offer new therapeutic targets for ophthalmological diseases.
Keywords: cornea, macrophages, microglia, retina, single‐cell RNA‐seq
Subject Categories: Immunology, Neuroscience
Single‐cell RNA‐sequencing reveals heterogeneity of macrophages in the cornea, ciliary body and retina under homeostatic conditions.

Introduction
Nature has found a way to provide vitally important tissues of the body with immune protection against invading pathogens in a way that greatly reduces the inflammatory response. Beside the brain, certain compartments of the eye such as cornea, lens, retinal pigment epithelium and neural retina, as well as the placenta, ovaries, and testis belong to these tissues. This important feature, known as “immune privilege”, is based on several molecular, microanatomical, and cellular factors that constitute and maintain immune protection in a given tissue (Bechmann, 2005).
Several compartments of the eye reside behind specialized blood–tissue barriers that are formed by tight junctions between endothelial cells and other structural specializations, such as tight junctions among ocular pigment epithelial cells (Streilein, 2003). However, these blood–ocular barriers are quite diverse in their location, anatomy, local immune‐skewing properties, and the immune cells involved (Shechter et al, 2013). For example, the inner blood–retinal barrier, localized within the inner layers of the neural retina, is formed by non‐fenestrated endothelial cells, connected by tight junctions and covered by pericytes and astrocyte end feet. In contrast, the blood–aqueous barrier that can be found at the ciliary body consists of fenestrated endothelial cells on the one side, whereas tight junctions connect non‐pigmented ciliary epithelium on the side proximal to the aqueous humor (Kaur et al, 2008). Finally, the cornea and the anterior chamber are specialized immune‐privileged sites of the eye that are transparent and avascular while other compartments lack blood–tissue barriers such as the choroid or conjunctiva. Despite their different localizations and structures, all immune‐privileged compartments of the eye including cornea, ciliary body, and retina share the presence of specialized innate immune effectors, such as macrophages, that are involved in immune regulatory mechanisms (Shechter et al, 2013). In general, local tissue macrophages are considered as the key regulators ensuring proper tissue homeostasis and immune defense (Varol et al, 2015; Prinz et al, 2019).
Unlike microglia and CNS macrophages (MΦ) at interfaces like perivascular (pv), choroid plexus (cp), and meningeal (m) MΦ, which are derived from yolk sac precursors before birth (Ginhoux et al, 2010; Schulz et al, 2012; Kierdorf et al, 2013a; Goldmann et al, 2016; Kierdorf et al, 2019; Jordão et al, 2019), the macrophages found in the cornea, ciliary body, and even the retina were described to originate from short‐lived blood monocytes after birth that are quickly replaced by bone marrow (BM)‐derived cells (Xu et al, 2007; Kezic et al, 2008; Chinnery et al, 2008). These assumptions were made on the basis of immunohistochemical (Hume et al, 1983) or electron microscopy experiments (Gloor, 1969) that did not allow for longitudinal studies of labeled cells. The assumption of a postnatal origin of eye macrophages was also supported by the fact that retinal microglia increase in numbers around birth and during the first postnatal week (Santos et al, 2008). The systemic transplantation of genetically engineered BM‐derived cells resulted in macrophage engraftment in the inner and outer plexiform layers, the ganglion cell layer and the optic nerve, but not in the photoreceptor layer of the retina (Boettcher et al, 2008). As these experiments used irradiation as conditioning paradigm and injection of BM cells that are not normally present in the circulation, the engraftment of BM cells in the preconditioned eye is likely a result of changes of the blood–ocular barrier and concomitant local induction of chemoattractants as described before for the brain (Mildner et al, 2007; Kierdorf et al, 2013b). Just recently, our knowledge about the origin and turnover of eye macrophages started to change. Using pulse labeling and fate mapping strategies, retinal microglia were shown to originate from the primitive hematopoiesis in the yolk sac while the origin of other macrophages in the eye remains unknown (O’Koren et al, 2019). Additionally, retinal microglia as well as macrophages in the iris/ciliary body were suggested to be long‐lived whereas macrophages in the choroid and optic nerve showed a time‐dependent turnover (O’Koren et al, 2019). Interestingly, depleted retinal microglia can be partially replenished by ciliary body macrophages ex vivo (Huang et al, 2018). Therefore, it is of interest to identify the origin of eye macrophages beside retinal microglia and understand the sources, kinetics, and functions of the myeloid subsets in the eye during health and disease in detail. From a functional point of view, macrophages in the cornea were found to balance the inflammatory response and wound healing after damage (Liu et al, 2017). Retinal microglia are essential to maintain a functional integrity of the retina (Wang et al, 2016). Consequently, a disturbed homeostasis of these cells is associated with neurodegeneration (Ma et al, 2019). Notably, patients suffering from age‐related macular degeneration (AMD) display impaired retinal integrity with local myeloid cell activation and accumulation surrounding choroidal neovascularization (CNV), which can be modeled in rodents, e.g., in the laser‐induced CNV model (Oh et al, 1999). This model covers important features of neovascular AMD found in patients, namely the sprouting of new choroidal vessels preceded by an activation of the resident innate immune system. However, so far the differential functions of resident retinal microglia vs. recruited monocytes and their underlying context‐dependent functions during the development of CNV remain poorly defined due to the lack of appropriate cell‐specific in vivo models.
In this study, a combination of single‐cell RNA sequencing (scRNA‐seq), embryonic and adult cell fate mapping, parabiosis, and use of reporter mouse lines allowed us to thoroughly compare the transcriptional profiles, origin and turnover characteristics of retinal microglia, and resident macrophages in the ciliary body and cornea. In addition, in a model of CNV, we were able to identify new disease‐associated myeloid subpopulations that may represent a novel target for the treatment of AMD.
Results
Molecular survey of myeloid populations in the eye
The eye shows a remarkable anatomical compartmentalization reflecting the multimodal functions of the ocular visual system (Fig 1A). To comprehensively characterize the myeloid cells in the eye, we first asked how transcriptionally similar retinal microglia (rMG), ciliary (cbMΦ), and corneal macrophages (cMΦ) are. For this purpose, we purified the CD45+CD3−CD19−Ly6G− cell fractions from the carefully dissected and separated cornea, ciliary body, and retina for morphological examination in parallel to scRNA‐seq of the sorted cells as described before (Jordão et al, 2019; Masuda et al, 2019; Sankowski et al, 2019). In the retina, we consistently found smaller CD45+CD3−CD19−Ly6G− myeloid cells with basophilic cytoplasm, while cells in the ciliary body and cornea showed a classical macrophage/monocyte appearance (Fig 1B). The morphological diversity of myeloid cells in the investigated eye compartments was also reflected in our scRNA‐seq results that allowed us to clearly distinguish between microglia, macrophages, and a minor proportion of periphery‐derived leukocytes as shown before (Jordão et al, 2019; Sankowski et al, 2019) (Fig 1C). We performed the mCel‐Seq2 protocol followed by analysis using the RaceID3 algorithm (Herman et al, 2018). After the exclusion of contaminating cells consisting of neuronal cells from the retina and epithelial cells mostly from the cornea (Fig EV1), we identified 17 distinct clusters using the t‐distributed stochastic neighbor embedding (t‐SNE) algorithm. Here, we found either microglial (three clusters), macrophage (nine clusters), or peripheral leukocyte gene expression signatures (five clusters) based on previously described cell type‐associated genes (Jordão et al, 2019) (Fig 1D). These clusters were differently enriched in the distinct compartments (Fig 1E and F). Clusters 13, 14, and 15 were exclusively derived from the retina and represent three distinct transcriptional cell states. As an example, cluster 13 shows the highest expression of cathepsin S and D (Ctss, Ctsd) suggesting active processing of phagocytosed antigen reflected by the presence of photoreceptor genes (Rho, Gnat1). The clusters 2, 3, 6, 9, and 16 were significantly enriched in the cornea and the clusters 1, 5, 10, 11, and 12 in the ciliary body based on hypergeometric testing with a cutoff of adjusted P‐value <0.05 (Fig 1F).
Figure 1. Molecular census of myeloid cells in different compartments of the healthy mouse eye.

- Scheme of the murine eye.
- Schematic diagram depicting the workflow for the isolation of single CD45+CD3−CD19−Ly6G− cells from different eye compartments (retina, ciliary body, cornea) under healthy conditions for unbiased single‐cell RNA‐seq (scRNA‐seq). Morphological heterogeneity of sorted myeloid cells revealed by May‐Grünwald‐Giemsa stained cytospins. Scale bars represents 10 µm.
- t‐SNE representation of individual hematopoietic cells from all eye compartments measured by scRNA‐seq. Each dot represents an individual cell. Color code indicates the respective cell types.
- Unbiased cluster analysis of subpopulations of cells found in the steady‐state adult retina (cluster 13, 14, 15), ciliary body (cluster 1, 5, 10, 11, 12), cornea (cluster 2, 3, 6, 9, 16) and of mixed composition (4, 7, 8, 17) could be identified as microglia (cluster 13, 14, 15), macrophages (cluster 1, 2, 3, 6, 7, 8, 9, 10, 16), or peripheral blood leukocytes (cluster 4, 5, 11, 12, 17).
- t‐SNE representation of single cells based on the tissue of origin.
- Stacked bar plot (Marimekko chart) representation of macrophage subsets to a given cluster demonstrating pure microglia populations in clusters 13, 14, and 15. Hypergeometric testing revealed significantly enriched macrophage clusters in the cornea (2, 3, 6, 9, 16) and the ciliary body (1, 5, 10, 11, 12) as indicated by asterisks (*P < 0.05, **P < 0.01, ***P < 0.001).
- Heatmap of the most regulated genes per cluster (adjusted P‐value < 0.05 based on the negative binomial distribution). Clusters are arranged from the left to the right and represent microglia (light green), macrophages (purple), and monocytes/granulocytes/lymphocytes (gray). The scale bar represents color‐coded z‐scores. Genes that were subsequently confirmed on protein level in (H) and (I) are highlighted by asterisks.
- Above: t‐SNE representation of P2ry12 and Tmem119 expression. Below: immunofluorescence images for P2RY12 (red) and TMEM119 (red) in CX3CR1+ (green) retinal microglia (outer plexiform layer) but not in CX3CR1+ cells in the ciliary body and the peripheral stroma and epithelium of the cornea. Representative images out of three animals are shown. Scale bars represent 50 µm.
- Above: t‐SNE plots for Cd74 and H2‐Aa expression. Below: Typical immunofluorescence pictures for CD74 (red) and MHCII (H2‐Aa) (red) in CX3CR1+ (green) cells in the ciliary body and the peripheral stroma and epithelium of the cornea. Two animals were examined. Scale bars represent 50 µm.
Figure EV1. Single‐cell RNA‐seq from all cells in the healthy murine eye.

- t‐SNE representation of individual cells from all eye compartments measured by scRNA‐seq. Each dot represents an individual cell. Color code indicates the respective cell types.
- Unbiased cluster analysis of cell subpopulations found in the retina, ciliary body, and cornea.
- Stacked bar plot (Marimekko chart) representation of macrophage subsets to a given cluster.
- Heatmap of the 30 most regulated genes per cluster (adjusted P‐value < 0.05 based on the negative binomial distribution). The scale bar represents the color‐coded z‐scores. Genes presented in t‐SNE plots in (E) are marked by asterisks.
- t‐SNE plot of typical genes for microglia subsets (P2ry12, Tmem119, Hexb), macrophage cluster (Cd74, H2‐Aa, Apoe), Rods/Cone cluster (Rho, Prph2, Pdc), and epithelial cells cluster (Emp1, Gsto1, Krt5).
Subsequent GO term analysis revealed functional similarities that were common in all compartments, e.g., “phagocytosis” or “mononuclear cell proliferation” (Fig EV2). Of note, other GO terms were only present in single clusters like “monoamine transport” in the rMG cluster 15 or “positive regulation of leukocyte tethering or rolling” in cluster 11, likely being monocytic cells, expressing Plac8 and Ly6c2 (Figs 1G and EV2). Transcripts known to be predominantly expressed by microglia (Cx3cr1, P2ry12, Tmem119, Hexb) were enriched in clusters 13, 14, and 15 of scRNA‐seq data representing rMG (Fig 1G and H).
Figure EV2. Gene ontology enrichment (GO) analysis across all cell clusters of different eye compartments.
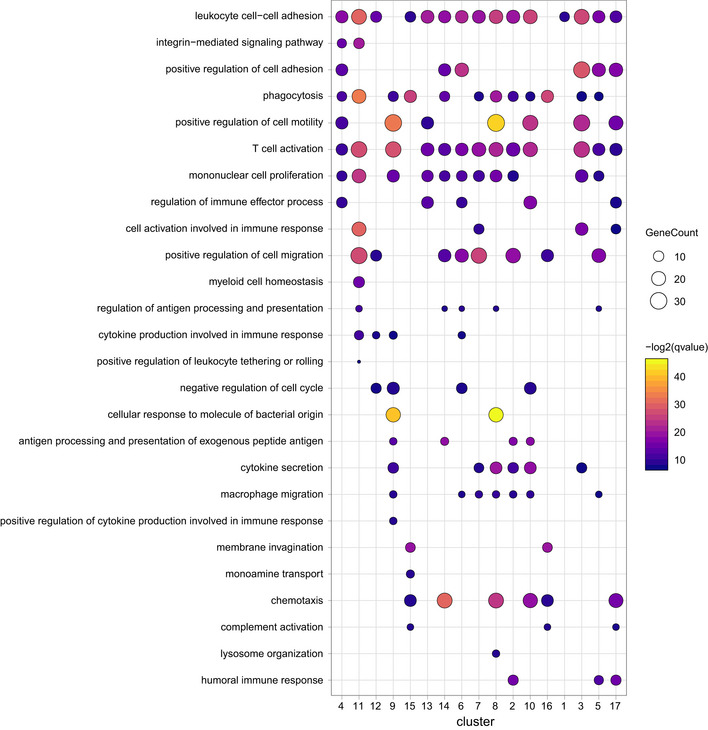
GO pathways were selected and depicted for all cell cluster identified in Fig 1 for the eye compartments retina, ciliary body, and cornea.
Next, we compared eye macrophages with brain macrophages (Jordão et al, 2019). We found that retinal and brain microglia are transcriptionally very similar by sharing a cluster (0) exclusively composed of brain‐ and retina‐derived cells (Fig EV3, EV4, EV5, EV6). Besides several clusters of mixed composition, three of them (3, 4, 5) appear to be significantly enriched with cells from the ciliary body by hypergeometric testing with no contribution from the retina (Fig EV3C). While the microglial cluster 0 clearly overlaps with the “microglia” signature plot, the ciliary body cluster 3 shows an association with the signature of “border‐associated macrophages” and “monocytes” (Fig EV3E).
Figure EV3. Comparison of brain and eye macrophages by single‐cell RNA‐seq.

- t‐SNE representation of single cells based on the tissue of origin.
- Unbiased cluster analysis of subpopulations of cells found in the steady‐state adult brain and eye.
- Stacked bar plot (Marimekko chart) representation of the proportional contribution of macrophage subsets from different tissues to a given cluster demonstrating a pure microglia from both brain and retina in clusters 0. Hypergeometric testing revealed significantly enriched microglia (cluster 0), and macrophage clusters in the ciliary body (3, 4, 5) are indicated by asterisks (*P < 0.05, **P < 0.01, ***P < 0.001).
- Heatmap of the most regulated genes per cluster (adjusted P‐value < 0.05 based on the negative binomial distribution). Clusters are arranged from the left to the right. The scale bar represents the color‐coded z‐scores.
- t‐SNE expression and line plot of homeostatic gene signatures of microglia (Tmem119, Hexb, Slc2a5, P2ry12, Siglech, Trem2), macrophages (Mrc1, Cd163, Lyve1, Siglec1, Stab1, Pf4, Ms4a7, Cbr2, Apoe), boarder‐associated macrophages (Irf7, Crip1, Ccl6, Ccl9, Clec4b1, Ccr2, Vim, Lsp1, Lgals3), monocytes (Ly6c2, Ccr2, Anxa8, Plac8, Nr4a1), dendritic cells (Flt3, Zbtb46, Batf3, Clec9a, Itgae), and antigen‐presenting cells (APCs) (Cd74, H2−Aa, H2−Eb1, H2−Ab1, Cd80, Cd86, Cd40).
Figure EV4. Flow cytometric gating strategy for eye macrophages and monocytes.
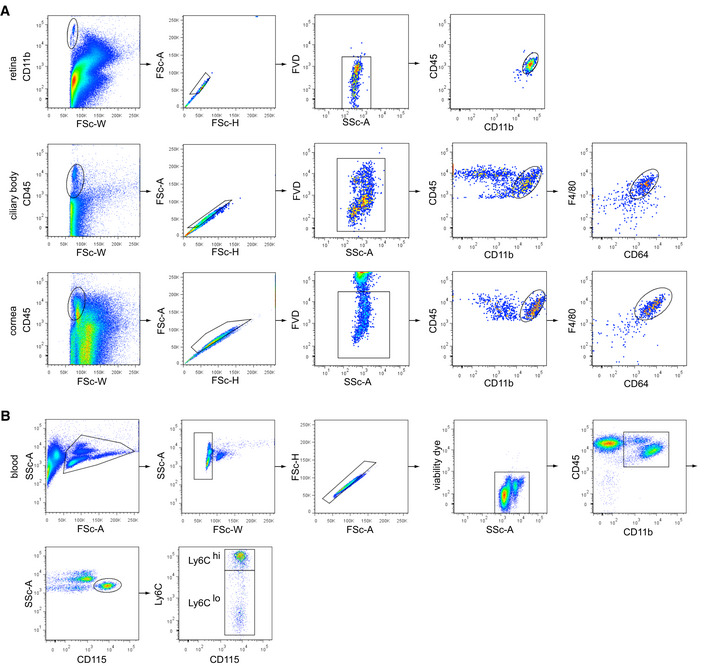
- Gating strategy of eye macrophages. CD11b+ or CD45+ cells underwent doublet exclusion by FSC‐W, ‐A, and ‐H gating and subsequent dead cell exclusion (fixable viability dye, FVD). Retinal microglia were specified as CD45loCD11b+, macrophages in the ciliary body and cornea as CD45loCD11b+CD64+F4/80+.
- Gating strategy of blood monocytes. Leukocytes underwent doublet exclusion by FSC‐W, ‐A, and ‐H gating and subsequent dead cell exclusion (fixable viability dye, FVD). CD45+CD11b+ myeloid blood cells were further subdivided in CD45+CD11b+CD115+Ly6Chi and CD45+CD11b+CD115+Ly6Clo monocytes.
Figure EV5. Molecular survey of all retinal cells during neovascularization.

- t‐SNE representation of cells from control, CNV d3, and CNV d7 conditions.
- t‐SNE plot showing identity of individual cells. Color code indicates different cell types.
- Unbiased cluster analysis of cell populations found in the retina upon CNV induction.
- Heatmap of the 30 most regulated genes per cluster (adjusted P‐value < 0.05 based on the negative binomial distribution). Scale bar represents the color‐coded z‐scores. Selected genes presented in t‐SNE plots shown in (E) are marked by asterisks.
- t‐SNE presentations of genes characteristic for microglia subsets (P2ry12, Tmem119), dendritic cell cluster (Cd74, H2‐Aa), Rods/Cone cluster (Rho, Pdc), and epithelial cells cluster (Krt12, Gsto1).
Figure EV6. Gene ontology enrichment (GO) analysis across all myeloid cell clusters during neovascularization.
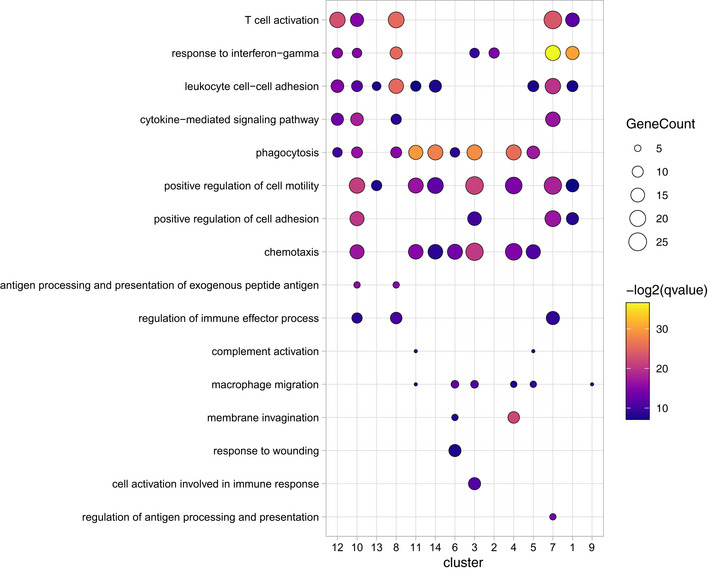
GO pathways were selected and depicted for all cell cluster identified in Fig 7.
In line with that, our bulk RNA‐seq analysis of brain microglia (bMG), rMG, bone marrow monocytes (BM‐Mo), and cMΦ supported our findings of cell type‐specific transcriptional profiles with rMG and bMG being transcriptionally similar (Fig 2). Comparative transcriptional profiling and principal component analysis (PCA) revealed that cMΦ were more comparable to BM‐Mo and clearly separated from bMG and rMG, which both clustered together (Fig 2A–C). As expected, all examined myeloid subtypes expressed Ptprc (CD45), Itgam (CD11b), and Csf1r (CD115) (Fig 2D).
Figure 2. Comparative bulk RNA‐seq analysis of microglia from brain and retina, cornea macrophages, and bone marrow‐derived monocytes.
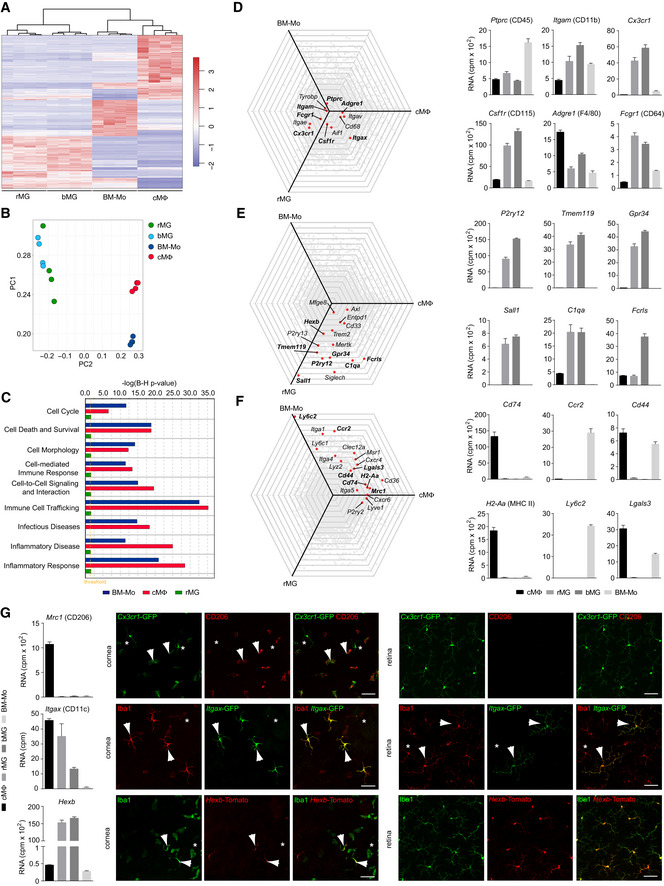
- Heatmap of differentially expressed genes between rMG, bMG, cMΦ, or bone marrow‐derived monocytes (BM‐Mo). The mean centered and s.d. scaled expression values for genes that were significantly and at least twofold more or less abundantly expressed are shown. See Fig EV4 for gating strategy. Data are derived from four independent experiments with 5–10 pooled mice per sample and shown as mean ± s.e.m.
- Principal component analysis of myeloid cell transcripts analyzed by RNA‐seq. Data are derived from four independent experiments with 5–10 pooled mice per sample and shown as mean ± s.e.m.
- Comparison of functional gene clusters between BM‐Mo, cMΦ, and rMG in comparison with bMG (reference population). Data are derived from four independent experiments with 5–10 pooled mice per sample and shown as mean ± s.e.m.
- Left, spider plots showing commonly expressed genes across macrophages in comparison with bMG (reference population, center). Bold genes were plotted as bar graph on the right. Four samples were analyzed per cell type. Data are derived from four independent experiments with 5–10 pooled mice per sample and shown as mean ± s.e.m.
- Left, spider plots showing genes highly enriched in microglia in comparison with bMG (reference population, center). Bold genes are plotted as bar graphs on the right. Data are derived from four independent experiments with 5–10 pooled mice per sample and shown as mean ± s.e.m.
- Left, spider plots showing genes commonly expressed by monocytes and/or cMΦ in comparison with bMG (reference population, center). Bold genes are plotted as bar graphs (right). Data are derived from four independent experiments with 5–10 pooled mice per sample and shown as mean ± s.e.m.
- Left, bar graphs showing expression of the genes Mrc1, Itgax, and Hexb in rMG, bMG, cMΦ, or bone marrow‐derived monocytes (BM‐Mo). Right, validation of Mrc1 (CD206) in Cx3cr1‐GFP mice, Itgax in Itgax‐GFP mice, and Hexb in Hexb‐Tomato mice in the cornea and the retina. Arrows point to CX3CR1+CD206+ cMΦ (top row) or Iba1+CD11c+ cMΦ or rMG (middle row) or Iba1+Hexb+ cMΦ or rMG (bottom row). Asterisks point CX3CR1+CD206− cMΦ (top row) or Iba1+CD11c− cMΦ or rMG (middle row) or Iba1+Hexb− cMΦ or rMG (bottom row). Data are derived from four independent experiments with 5–10 pooled mice per sample and shown as mean ± s.e.m. Scales bar represents 50 µm.
For protein validation of microglia‐ and macrophage‐specific target genes, we used Cx3cr1GFP/ + mice that harbor a targeted replacement of a Cx3cr1 chemokine receptor allele with a cDNA encoding enhanced green fluorescence protein (eGFP) (Jung et al, 2000). In the healthy rodent brain, only microglia and CNS‐associated macrophages (CAMs) such as pvMΦ, cpMΦ, and mMΦ express this marker (Goldmann et al, 2016; Hagemeyer et al, 2016). We were able to identify CX3CR1+ cells in different compartments of the eye but the expression of P2RY12 and TMEM119 was strictly limited to rMG, thereby confirming our scRNA‐ and bulk RNA‐seq data (Figs 1G and H, and 2E). In contrast, genes involved in antigen presentation, such as Cd74 and H2‐Aa, encoding the alpha chain of the MHC class II protein, and the mannose receptor CD206 (Mrc1) were only expressed by macrophages on both transcriptional and protein levels, but absent in rMG (Figs 1G and I, and 2F and G). Next, we extended our validation experiments with fluorescent reporter mouse lines (Fig 2G). In Itgax‐DTR‐GFP mice, we detected a low fraction of Iba1+CD11c+ cells throughout the retina but also in the cornea, as described before (Hamrah et al, 2003; Dando et al, 2016; Fig 2G). In a novel Hexb tdT/tdT reporter mouse model, virtually all rMG were labeled but also cMΦ, to a certain extent underlining the common myeloid nature of these cell types despite their overall diverse expression signatures (Masuda et al, 2020; Fig 2G). Taken together, these data reveal the existence of heterogeneous myeloid subsets in the healthy eye, reflected by distinct morphology and transcriptional signatures validated by the corresponding protein expression.
Prenatal origin of eye macrophages in different compartments
In the past, the origin of myeloid cells in the eye was mainly investigated by the use of lethally irradiated mice undergoing BM transplantation to follow the fate of blood‐derived myeloid cells as a putative source of rMG (Xu et al, 2007; Boettcher et al, 2008), cMΦ (Chinnery et al, 2008; Liu et al, 2017), and cbMΦ (Kezic et al, 2008). We were able to recapitulate these findings and found donor‐derived Iba1+GFP+ rMG mostly in the inner plexiform layer (IPL) of irradiated wild‐type hosts that received BM cells from Acta1GFP /+ mice (Fig 3A–D).
Figure 3. Prenatal source of eye macrophages.
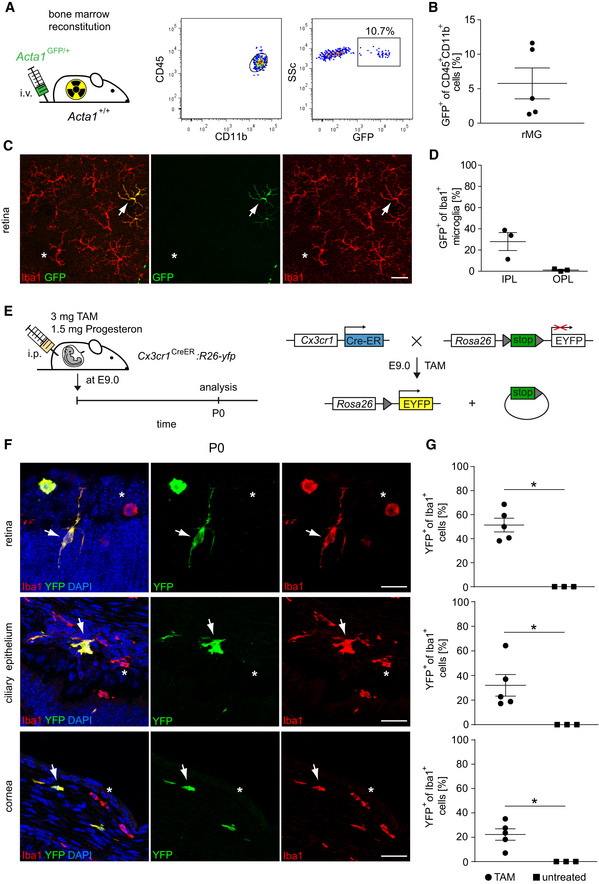
- Left: Creation of Acta1 GFP/+ :Acta1 +/+ bone marrow chimeras. Right: Donor‐derived GFP+CD45loCD11b+ were detectable in the recipient retina by flow cytometry 20 weeks after bone marrow reconstitution. FACS Plots are representative for five animals from one experiment.
- Quantification of GFP+ cells among CD45+CD11b+ retinal microglia by flow cytometry. Data are presented as mean ± s.e.m. One symbol represents one mouse.
- Typical retinal flat mount from Acta1 GFP/+ :Acta1 +/+ bone marrow chimeras 20 weeks after reconstitution. Donor‐derived GFP+Iba1+ cells (arrow) and GFP−Iba1+ resident microglia (asterisks) are shown. Pictures are representative for three animals from one experiment. Scale bars represent 50 µm.
- Microscopy‐based quantification of GFP+Iba1+ retinal microglia in the inner (IPL) and outer plexiform layer (OPL). One symbol represents one mouse. Data are presented as mean ± s.e.m.
- Scheme of a fate mapping experiment using Cx3cr1CreERT2:Rosa26‐YFP female mice. Tamoxifen (TAM) and progesterone injection were performed at embryonic day 9.0 (E9.0). Mice were subsequently evaluated at postnatal day 0 (P0). Administration of TAM leads to intra‐embryonic excision of a stop sequence flanked by loxP sites (gray triangles) in Cx3cr1 expressing cells which causes stable and steady YFP expression under the control of the Rosa26 promotor.
- Direct fluorescence microscopic visualization for YFP (green), the macrophage marker Iba1 (red) and DAPI for the nuclei (blue) at P0. YFP+Iba1+ double‐positive cells are marked by arrows. YFP−Iba1+ single‐positive cells are labeled by asterisks. Representative images out of five examined animals are shown. Scale bars represent 25 µm.
- Quantitative analysis of regional YFP expression in Iba1+ macrophages in TAM‐induced and untreated Cx3cr1CreERT2:Rosa26‐YFP mice. Bars represent means ± s.e.m. Quantification was done from three (untreated) or five (TAM) mice obtained from one (untreated) or two (TAM) independent experiments. Level of significance determined by Mann–Whitney test between TAM and untreated revealed *P < 0.05 and Kruskal–Wallis test between retina, ciliary body, and cornea revealed *P = 0.0204.
In several organs, including the brain, resident macrophages arise from embryonic precursors in the yolk sac or fetal liver that seed the tissue before birth (Schulz et al, 2012; Yona et al, 2013; Kierdorf et al, 2013a; Molawi et al, 2014; Goldmann et al, 2016; Hagemeyer et al, 2016; Ensan et al, 2016). In order to circumvent the irradiation‐induced artifacts of BM chimeras, we used tamoxifen (TAM)‐inducible Cx3cr1CreERT2:Rosa26‐YFP mice for the investigation of a potential prenatal origin of eye macrophages in an embryonic fate mapping approach as described before (Goldmann et al, 2016; Fig 3E–G). By doing so, it was possible to follow irreversibly recombined long‐living CX3CR1+YFP+Iba1+ cells from embryonic day 9 (E9.0) to postnatal day 0 (P0) in the retina, ciliary epithelium, and the cornea (Fig 3F and G). At P0, Iba1+ rMG showed the highest percentage of YFP+ cells (51.36 ± 5.7%) among the investigated eye macrophage populations comparable to the labeling rates we have shown before for bMG and CAMs such as pvMΦ and mMΦ using a similar approach (Goldmann et al, 2016). Of note, rMG were described before to emerge from the yolk sac which was shown with the Runx1‐Mer‐Cre‐Mer mouse model (O’Koren et al, 2019). In addition, we identified for the first time pulse‐labeled cbMΦ (32.0 ± 8.8%) in the developing ciliary body, called ciliary epithelium, and cMΦ (22.26 ± 7.1%) in the cornea (Fig 3G). In conclusion, all investigated compartments of the murine eye contained macrophages (rMG, cbMΦ, and cMΦ) of prenatal origin that derive either from the yolk sac and/or the fetal liver to various degrees.
Different turnover of macrophage subsets in the healthy adult eye
Macrophages in the brain are located either inside the brain parenchyma like microglia or at CNS interfaces like CAMs (Kierdorf et al, 2019). These compartments are separated by the blood–brain barrier and, as a consequence, macrophages residing behind this barrier are long‐lived and self‐maintained with only limited random expansion under physiological conditions (Tay et al, 2017).
To investigate the turnover of macrophages in different compartments of the eye during steady state, we compared the turnover of rMG with cbMΦ and cMΦ in adult mice. At the age of 6 weeks, we injected Cx3cr1CreERT2:Rosa26‐YFP mice subcutaneously twice with TAM to specifically label long‐living macrophages while short‐lived myeloid cells like monocytes lose the label over time (Goldmann et al, 2013; Wieghofer et al, 2015). Next, we quantified the YFP expression in rMG, cbMΦ, and cMΦ at 2, 12, and 24 weeks after TAM administration (Fig 4A–C). Flow cytometry revealed long‐term YFP expression of CD45+CD11b+ rMG (2 weeks: 91.54 ± 2.98%, 12 weeks: 92.13 ± 2.08%, 24 weeks: 96.30 ± 1.62%), which is reminiscent of the low turnover that has been described in the same model for bMG and CAMs such as pvMΦ and mMΦ (Goldmann et al, 2016). CD45+CD11b+CD64+F4/80+ cbMΦ also showed long‐term YFP expression (2 weeks: 82.23 ± 6.33%, 12 weeks: 69.17 ± 7.33%, 24 weeks: 76.90 ± 5.18%) resembling previous results (O’Koren et al, 2019). In contrast, the percentage of YFP+ cells among CD45+CD11b+CD64+F4/80+ cMΦ strongly dropped over time (2 weeks: 66.91 ± 7.10%, 12 weeks: 28.39 ± 4.31, 24 weeks: 17.32 ± 2.03%) comparable to the short‐lived nature of choroidal macrophages (O’Koren et al, 2019).
Figure 4. Contribution of definitive hematopoiesis to eye macrophage subsets during steady‐state.

- Scheme of a fate mapping experiment using adult Cx3cr1CreERT2:Rosa26‐YFP mice. Tamoxifen (TAM) injection was performed at postnatal day 42 (P42). Mice were evaluated at 2, 12, and 24 weeks post‐injections. Administration of TAM leads to the excision of a stop sequence flanked by loxP sites (gray triangles) in Cx3cr1 expressing cells in the eye which causes stable YFP expression under the control of the Rosa26 promotor.
- Flow cytometric measurement of the persistence of YFP+ retinal microglia (rMG), cliliary body (cb) MΦ, and corneal (c) MΦ in adult Cx3cr1CreERT2:Rosa26‐YFP mice. Doublets and dead cells were excluded by FSC‐W and viability dye. Representative flow cytometry plots from two independent experiments with at least six mice are displayed.
- Kinetics of YFP labeling in macrophages of the healthy eye. Symbols represent means ± s.e.m. rMG are shown as squares (2 weeks: n = 10 mice, 12 weeks: n = 9 mice, 24 weeks: n = 12 mice, Kruskal–Wallis ns P > 0.05), cbMΦ are depicted as triangles (2 weeks: n = 4 samples from eight mice, 12 weeks: n = 3 samples from six mice, 24 weeks: n = 6 samples from twelve mice, Kruskal–Wallis ns P > 0.05) and cMΦ as circles (2 weeks: n = 6 mice, 12 weeks: n = 8 mice, 24 weeks: n = 12 mice, one‐way ANOVA ***P < 0.0001). Data were obtained from two (cMΦ: 2 weeks, cbMΦ: 2 and 12 weeks), three (rMG: 2 weeks, cbMΦ: 24 weeks), or four (rMG: 12 and 24 weeks, coMΦ: 12 and 24 weeks) independent experiments.
- Sketch of the Flt3‐dependent Cre‐mediated recombination system with excision of the loxP‐flanked stop‐sequences leading to expression of YFP under the control of the Rosa26 promotor in Flt3Cre:Rosa26‐YFP mice.
- Left: Representative flow cytometric characterization of rMG by CD45 and CD11b and cbMΦ and cMΦ by CD45, CD11b, CD64, and F4/80 in Flt3Cre:Rosa26‐YFP mice. Doublets and dead cell were excluded. Right: representative flow cytometric images depicting YFP expression in eye tissue macrophages of 12‐ or 52‐week‐old Flt3Cre:Rosa26‐YFP mice. Typical images were taken from two independent experiments with six to seven mice.
- Quantification of the percentage of YFP+ eye macrophages at 12 and 52 weeks of age. rMG are shown as squares (12 weeks: n = 7 mice, 52 weeks: n = 6 mice), cbMΦ as triangles (12 weeks: n = 3 samples from six mice, 52 weeks: n = 3 samples from six mice), and cMΦ as circles (12 weeks: n = 7 mice, 52 weeks: n = 6 mice). Data are presented as means ± s.e.m. and were acquired in two independent experiments.
In line with these results, Flt3Cre:Rosa26‐YFP mice, labeling all descendants from the definitive hematopoiesis, showed the highest recombination in cMΦ (12 weeks: 62.24 ± 5.92%, 52 weeks: 72.55 ± 2.6) but only low labeling in cbMΦ (12 weeks: 12.61 ± 0.2%, 52 weeks: 16.7 ± 4.1) that was virtually undetectable in rMG (12 weeks: 0.1 ± 0.04%, 52 weeks: 0.05 ± 0.03%) by flow cytometry (Fig 4D–F). Of note, Flt3 Cre mice are known to target also the prenatal definitive hematopoiesis in the fetal liver, beside the BM in adulthood (Perdiguero et al, 2014). We therefore aimed to confirm our findings from the Cx3cr1CreERT2:Rosa26‐YFP mice by exclusively targeting peripheral blood monocytes without a contribution of the fetal liver and without compromising the blood–ocular barriers as in irradiated BM chimeras. Subsequently, we generated parabiotic mice and analyzed them 2, 12, and 20 weeks after pairing of Acta1GFP/ + with Acta1 +/+ mice (Fig 5A–D). Notably, we did not detect any GFP+Iba1+ rMG in the Acta1 +/+ partner and only low numbers in cbMΦ (2 weeks: 0.27 ± 0.18%, 12 weeks: 0.62 ± 0.31%) (Fig 5A–D). In contrast, the frequency of GFP+Iba1+ cMΦ coming from the parabiotic partner steadily increased over time (2 weeks: 0.46 ± 0.28%, 12 weeks: 5.62 ± 2.27%, 20 weeks: 11.30 ± 2.80%) confirming a contribution of blood‐derived cells from the definitive hematopoiesis to this particular macrophage population (Fig 5A and D).
Figure 5. Peripheral blood‐derived origin of myeloid cells contributing to homeostatic turnover of eye macrophages.

-
ALeft, Experimental setup of surgically connected parabiotic mice. Acta1 GFP/+ and Acta1+/+ mice underwent parabiosis for 2, 12, and 20 weeks before analysis. Right, quantification of GFP+Iba1+ microglia in the retina (rMG, squares, n.d. = not detectable), ciliary body (cbMΦ, triangles, Mann–Whitney ns P > 0.05), and cornea (cMΦ, circles, Kruskal–Wallis **P = 0.0024) of parabiotic mice. Blood chimerism of CD45+CD11b+Ly6ChiGFP+ cells in the analyzed wild‐type mice was 37.7 ± 3.2% (2 weeks), 27.5 ± 2.7% (12 weeks), and 34.7 ± 3.7% (20 weeks). Symbols represent mean ± s.e.m. of three (2 weeks), four (12 weeks) or five (20 weeks) individual mice. Scale bars represent 50 µm.
-
B–DRepresentative immunofluorescence images from the retina (20 weeks), ciliary body (12 weeks), and cornea (20 weeks) from flat mounts of Acta1 +/+ parabiotic mice. GFP+Iba1+ double‐positive cells are marked by arrows, GFP−Iba1+ single‐positive cells are labeled by asterisks and GFP+Iba1− leukocytes are indicated by arrow heads. Pictures are representative of three animals.
-
EFlow cytometric quantification of RFP+ cells in Ccr2‐RFP mice among CD45+CD11b+CD115−Ly6Cint granulocytes (triangles, n = 4), CD45+CD11b+CD115+Ly6Clo monocytes (filled squares, n = 4 mice), CD45+CD11b+CD115+Ly6Chi monocytes (open squares, n = 4 mice), CD45loCD11b+ rMG (squares, n = 6 mice), CD45+CD11b+CD64+F4/80+ cbMΦ (triangles, n = 6 samples from 12 mice), and CD45+CD11b+CD64+F4/80+ cMΦ (filled circles, n = 12 mice, unpaired t‐test ***P < 0.0001). Data were obtained from one (rMG) or two independent experiments (blood, cbMΦ, cMΦ). Data are presented as means ± s.e.m.
-
F–HFlow cytometry of eye macrophages from healthy Ccr2 RFP/+ mice (left) and representative histograms (right, Ccr2 RFP/+ solid red line, Ccr2 +/+ controls dotted gray line).
-
IFlow cytometry of myeloid blood cells from Ccr2 RFP/+ mice. Left: CD45+CD11b+ cells were further subdivided according to the expression of Ly6C and CD115 into CD45+CD11b+CD115−Ly6Cint granulocytes (gate 1), CD45+CD11b+CD115+Ly6Chi inflammatory (gate 2), and CD45+CD11b+CD115+Ly6Clo resident monocytes (gate 3), respectively. Right: representative histograms are shown (Ccr2 RFP/+ solid red line, Ccr2 +/+ controls dotted gray line). Four mice were investigated.
-
JTop left, sketch of Ccr2‐RFP construct. Top right, typical confocal picture for CCR2 (red), Iba1 (green), and collagen IV (Coll IV, white) revealing Ccr2‐RFP expression in a blood vessel (arrow, left image, scale bar represents 20 µm) and no RFP signal in retinal microglia (right images, scale bar represents 100 µm). Bottom, representative pictures of the ciliary body and cornea immunolabeled with F4/80 (green), CCR2 (red), and DAPI (blue). Arrows indicate RFP+F4/80+ cells. Asterisks point to RFP−F4/80+ cells. Representative images from two independent experiments with three mice are displayed. Scale bars represents 20 µm.
To gain more insight into the identity of the cell type in the peripheral blood contributing to the high turnover of cMΦ, we next investigated Ccr2‐RFP mice, in which all short‐lived CCR2+ monocytes and their descendants express the red fluorescent protein (RFP) (Saederup et al, 2010; Fig 5E–I). Again, we did not detect any rMG and only few cbMΦ that expressed RFP by flow cytometry (4.93 ± 1.37%) (Fig 5E–H) or confocal microscopy (Fig 5J). In contrast, up to one third of cMΦ expressed RFP as quantified by flow cytometry (28.94 ± 2.96%) which is in line with previous reports (Liu et al, 2017) and our microscopical evaluation (Fig 5E, H and J). All circulating Ly6Chi and Ly6Clo monocytes expressed RFP serving as a positive control (Fig 5E and I) (Saederup et al, 2010). The low Cre recombination of rMG and cbMΦ in Flt3Cre:Rosa26‐YFP animals suggests that their development occurred largely independent of Flt3 + multipotent hematopoietic precursors in the BM. On the contrary, the high turnover in Cx3cr1CreERT2:Rosa26‐YFP mice, the strong labeling in Flt3Cre:Rosa26‐YFP and Ccr2‐RFP mice and the time‐dependent increase of GFP+ cells during parabiosis is strongly indicative of a role of hematopoietic stem cells in the maintenance of cMΦ.
In sum, these data clearly show different turnover kinetics of macrophages in distinct compartments of the healthy eye, namely that rMG and cbMΦ share their longevity with microglia and CAMs in the brain that have no or negligible input from blood monocytes. In contrast, cMΦ are characterized by a dual origin. They are initially composed of yolk sac‐derived cells; however in adult mice, cMΦ are continuously replaced with cells derived from the definitive hematopoiesis with a short turnover.
Spatial and temporal distribution of myeloid cell subsets during the formation of choroidal neovascularization
To investigate the kinetics of myeloid cell subsets and the appearance of disease‐associated cell populations during retinal pathology, we used a model of experimental CNV. This model is characterized by the formation of new vessels, which mimics the main hallmark of neovascular AMD in humans. For this purpose, CNV was induced by laser treatment in Cx3cr1CreERT2:Rosa26‐tdTomato mice 8 weeks after TAM treatment (Fig 6A). In vivo funduscopic imaging of untreated non‐lesioned mice revealed no signs of retinal damage and tomato+ rMG were evenly distributed in the retina (Fig 6B). Notably, the corresponding retinal pigment epithelium (RPE) was devoid of any Iba1+tomato+ myeloid cells in non‐lesioned mice (Fig 6B). At 7 days after laser treatment, laser‐induced lesions were clearly apparent and tomato+ rMG were increased at the lesion site (Fig 6C). In parallel, fluorescence angiography showed a marked leakage of fluorescein caused by the newly formed immature vessels (Fig 6C). The cellular composition of infiltrating cells changed dramatically after laser‐induced CNV formation in comparison with the control mice. First, Iba1+tomato+ rMG in the retina were morphologically altered with fewer ramifications and Iba1+tomato− recruited macrophages entered the lesioned eye (Fig 6C). Second, the lesion site at the level of the RPE was infiltrated by resident amoeboid Iba1+tomato+ rMG and by Iba1+tomato− recruited macrophages, likely of monocytic origin as suggested by a loss of tomato in peripheral blood monocytes. We next performed semi‐automatic IMARIS‐based image quantification to assess the proportions and kinetics of different myeloid cell subsets during CNV in the whole confocal stack volume of single lesions (Fig 6D and E). In the retina, the percentage and number of Iba1+tomato+ rMG were strongly increased during pathology with minimal engraftment by peripheral monocytes while both Iba1+tomato− recruited macrophages and Iba1+tomato+ rMG were present in the RPE (Fig 6D and E). To confirm a sufficiently high recombination in rMG, we performed flow cytometry and found virtually all CD45+CD11b+ rMG to be positive for tomato (98.75 ± 1.18%) after TAM treatment and only negligible tomato expression in circulating CD45+CD11b+CD115+SScloLy6Chi (0.02 ± 0.02%) and CD45+CD11b+CD115+SScloLy6Clo (1.4 ± 0.24%) monocytes, suggesting specific and permanent labeling of long‐lived CX3CR1+ macrophages in the eye (Boeck et al, 2020; Fig 6F). In addition, we would like to stress that TAM‐independent recombination events occur specifically in tomato reporter mice and were present in around 50% of the CD45+CD11b+ rMG population, as reported before (Chappel‐Maor et al, 2020). However, peripheral blood monocytes were not affected and consequently due to their short‐lived nature no interference with our experimental setup occured (Fig 6G). In conclusion, we identified rMG emerging as the dominant myeloid cell subset present during CNV formation.
Figure 6. Spatiotemporal characteristics of myeloid subsets during experimental neovascularization.

-
AExperimental setup. TAM was applied to 6‐week‐old Cx3cr1CreERT2:Rosa26‐tdTomato mice leading to the excision of the stop sequence followed by robust Tomato expression in microglia. At the age of 14 weeks (8 weeks post‐TAM), three focal argon laser burns were applied to each retina to induce microglia activation and subsequent choroidal neovascularization (CNV). Analysis was performed on days (d) 3, 7, 14, 28, and 56, respectively.
-
BAbove: Representative funduscopic pictures from living healthy Cx3cr1CreERT2:Rosa26‐tdTomato mice on d0. Funduscopy and red fluorescence visualize the fundus and regular distribution of tomato+ microglia before the laser‐induced lesion formation. Below: Corresponding immunofluorescence pictures. Non‐lesioned retina show a regular pattern of Iba1+ (green) tomato+ (red) retinal microglia while macrophages are absent on the retinal pigment epithelium (RPE) under native conditions. Pictures are representative for six mice analyzed in one experiment. Scale bars represent 50 µm.
-
CAbove: In vivo funduscopy on d7 post‐lesion. Funduscopic and red fluorescence image depict the lesions (encircled with dashed white lines) and accumulation of tomato+ microglia in Cx3cr1CreERT2:Rosa26‐tdTomato mice. Intraperitoneal fluorescein application was performed to label retinal vessels and areas of choroidal neovascularization. Below: Representative immunofluorescence for Iba1 (green) in Cx3cr1CreERT2:Rosa26‐tdTomato mice. Resident retinal microglia are Iba1+tomato+ (asterisks) whereas blood‐derived myeloid cells are Iba1+tomato− (arrows) and accumulate at sites of laser‐induced CNV. Overlay is shown left. Typical pictures from six mice obtained from one independent experiment are shown. Scale bars represent 50 µm.
-
DPercentage (left) and absolute numbers (right) of myeloid subsets in the retina at different time points post lesion. Red columns, red lines, and red symbols represent tomato+Iba1+ microglia in Cx3cr1CreERT2:Rosa26‐tdTomato mice whereas green columns, green lines, and green symbols represent blood‐derived tomato−Iba1+ myeloid cells. Left, Wilcoxon test at d3 (ns P = 0.0625), d28 (ns, P = 0.25), and d56 (ns P = 0.125) and paired t‐test at d7 (***P < 0.0001), and d14 (***P < 0.0001; right, absolute numbers Kruskal–Wallis test (tomato+Iba1+ *P < 0.05, tomato−Iba1+ **P < 0.01). Data represent means ± s.e.m. from at least three mice per group (two to six lesion per mouse) out of one (d0, d14, d28, d56) or two (d7, d14) independent experiments.
-
EDistribution (left) and absolute numbers (right) of myeloid cells in the RPE at different time points following laser‐induced lesion. Red columns, red lines, and red symbols represent tomato+Iba1+ microglia in Cx3cr1CreERT2:Rosa26‐tdTomato mice. Green columns, green lines, and green symbols represent blood‐derived tomato−Iba1+ myeloid cells. Left, paired t‐test at d3, d7, d14 (**P < 0.01, ***P < 0.001), Wilcoxon test at d28 and d56 (ns P > 0.05); right, absolute numbers Kruskal–Wallis test (ns P > 0.05). Data represent means ± s.e.m. from at least three mice per group (two to six lesion per mouse) out of one (d0, d14, d28, d56) or two (d7, d14) independent experiments.
-
F, GFlow cytometric measurement of tomato expression in 14‐week‐old Cx3cr1CreERT2:Rosa26‐tdTomato mice 8 weeks after TAM treatment (F) or with no treatment (G). Red lines represent the tomato signal and black lines the corresponding CreER‐negative control. Data are presented as mean ± s.e.m. from four mice analyzed in one experiment.
Identification of myeloid subpopulations associated with choroidal neovascularization
In order to analyze the diversity of myeloid cells on a single‐cell level during pathology, we induced CNV by laser treatment in 8‐week‐old C57BL/6J mice and used non‐lesioned littermates as controls. We FACS‐sorted CD45+CD3−CD19−Ly6G− cell fractions of the carefully excised central part of the retina enriched with lesioned tissue at days 3 and 7 to perform scRNA‐seq and compare it to homeostatic retinal microglial cells (Figs 1 and 7A). Cytospins revealed typical myeloid morphologies of isolated cells (Fig 7B). Contaminating neuronal retinal cells were again excluded from subsequent analysis (Fig EV5). Using the t‐SNE algorithm (Fig 7C–E), we visualized several clusters that were only present in the CNV‐related conditions (clusters 1, 7, 9, 10, 12, 13, 14) while others (4 and 5) were mostly consisting of cells derived from the homeostatic control time point d0 (Fig 7C).
Figure 7. Detection of disease‐associated myeloid cell clusters.
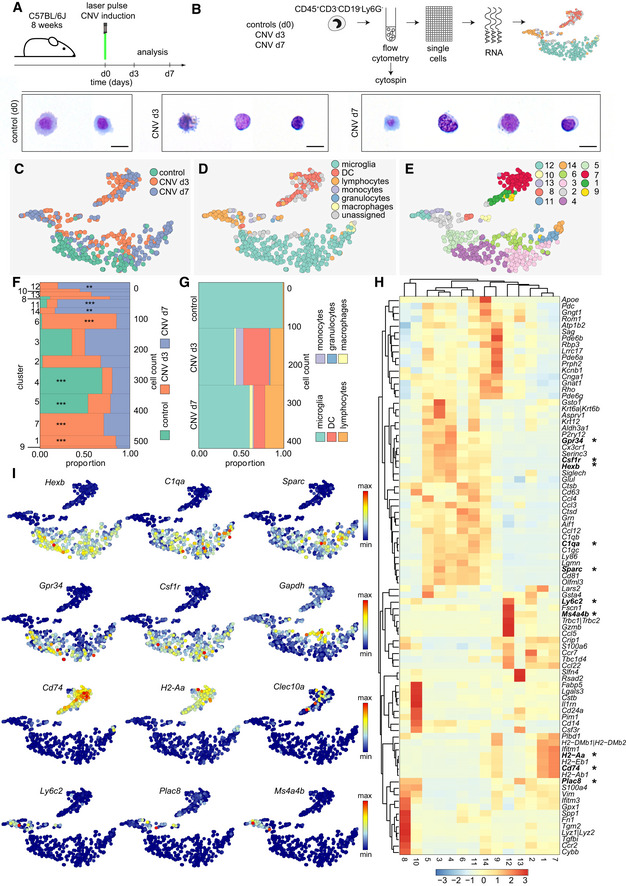
- Schematic diagram depicting the experimental setup.
- Isolation of single myeloid cells from the retina under healthy conditions (d0) and three (d3) or 7 days (d7) after laser pulse for unbiased sampling and single‐cell RNA‐seq (scRNA‐seq). Increased cellular heterogeneity in lesioned mice compared with healthy controls (d0), shown by May‐Grünwald‐Giemsa stained cytospins. Scale bars represents 10 µm.
- t‐SNE representation of individual cells from all conditions analyzed (control represents homeostatic microglial cells), CNV d3, CNV d7, with scRNA‐seq. Each dot represents an individual cell. Color code indicates the different experimental conditions.
- t‐SNE plot depicting different cell types.
- Unbiased cluster analysis of hematopoietic cell subpopulations found at different conditions.
- Marimekko chart showing the clusterwise distribution of 511 cells color‐coded for the experimental conditions (control 122 cells, CNV d3 209 cells, CNV d7 180 cells). Hypergeometric testing revealed significantly enriched clusters for the different conditions (control: cluster 4 and 5; CNV d3: cluster 1, 6 and 7; CNV d7: cluster 11, 12, and 14), indicated by asterisks (*P < 0.05, **P < 0.01, ***P < 0.001).
- Marimekko chart presenting the proportion of cell types among all assigned cells (see Fig 5D) during different experimental conditions demonstrating almost pure microglia populations present at d0, whereas clusters of dendritic cells (DC), lymphocytes, monocytes, granulocytes, and macrophages are present at d3 and d7 of CNV.
- Heatmap of the 30 most regulated genes per cluster (adjusted P‐value < 0.05 based on the negative binomial distribution). Asterisks highlight genes presented in t‐SNE plots shown in (I).The scale bar represents the color‐coded z‐scores.
- Selection of t‐SNE plots representative for different cell subsets using Hexb, C1qa, and Sparc to show differential expression of these genes between microglia subpopulations; Grp34, Csf1r, and Gapdh to depict cluster 6 as the highest activated microglia cluster; Cd74, H2‐Aa, and Clec10a to present dendritic cell cluster; Ly6c2, Plac8, and Ms4a4b to illustrate blood‐derived cell cluster.
Based on the expression of previously described cell type‐enriched gene expression signatures (Jordão et al, 2019), we identified microglia and dendritic cells (DC), as well as other myeloid cells such as macrophages and peripheral blood‐derived monocytes, among all assigned cells (Fig 7D). Only few cells could not be assigned to a certain cell type which represents a methodological limitation due to transcriptionally similar (myeloid) cells (Fig 7D). To clearly correlate the clusters to the control and diseased stages, we performed hypergeometric testing and confirmed a significant enrichment of cells derived from different conditions in specific clusters (Fig 7F). Besides the clusters related to the control (cluster 4, 5), we identified several disease‐associated clusters related to the CNV d3 (cluster 1, 6, 7) and CNV d7 (cluster 11, 12, 14) time point (Fig 7F). The contribution of the different (assigned) cell types to the different stages showed the highest diversity at CNV d3 (Fig 7D and G).
The clusters 4 and 5 were characterized by a high expression of previously reported microglia signature genes, such as Hexb, C1qa, and Sparc (Gautier et al, 2012; Butovsky et al, 2014; Fig 7H and I). In contrast, cluster 6 was the only disease‐associated rMG cluster found to be exclusively associated with CNV d3 and showed a “response to wounding” in the GO term analysis underlining its activated state (Fig EV6). In addition, this cluster shows a lower relative abundance of expression of the microglia signature genes typically expressed under homeostatic conditions, like Gpr34 and Csf1r, but a relatively high expression of Gapdh suggesting an increased glycolytic activity eventually due to local hypoxia (Fig 7H and I). The heterogeneous expression pattern of Clusters 9 and 14 showed up‐regulated genes commonly expressed by both macrophages and photoreceptor cells (Pdegb, Cnga1, Gnat1) indicating active phagocytosis of photoreceptor cell debris after laser coagulation (Fig 7H). Despite the presence of photoreceptor cell‐related genes, cluster 14 was assigned as macrophage, according to our cell type‐enriched gene expression signatures (Jordão et al, 2019) and expresses genes included in the GO term “phagocytosis”, in addition to genes involved in antigen presentation (H2‐Aa, Cd74), interferon response (Ifitm1, Ifitm3), and oxidative stress (Gpx1) (Figs 7H and I, and EV6). DCs also expressed genes typical for antigen presentation including Cd74 and H2‐Aa, encoding MHC class II, but to a much higher degree than macrophages (Fig 7H and I). In addition, the C‐type lectin Clec10a supports the DC identity of these cells besides other genes (Fig 7I). The expression of Ly6c2, Plac8, and Ms4a4b was only found in clusters consisting of lymphocytes, monocytes, and granulocytes (Fig 7H and I). Taken together, our single‐cell profiling identified rMG and myeloid cell cluster associated with choroidal neovascularization, suggesting that homeostatic subsets of endogenous rMG are able to quickly change their phenotypes and generate context‐ and time‐dependent states. Notably, the novel disease‐associated rMG clusters were still transcriptional distinct from cbMΦ and cMΦ.
Pseudotemporal ordering of the transcriptional dynamics during the course of neovascularization
To gain more insights into the gradual transcriptional changes in rMG during choroidal neovascularization, we performed a trajectory analysis using Monocle. This enabled us to identify transcriptionally different gene modules beyond the relative expression changes of single signature genes across clusters. We set up the algorithm to examine transcriptional changes between control, CNV d3, and CNV d7 cells of the microglial and macrophage clusters 3, 4, 5, 6, 11, and 14 and identified three gene modules (Fig 8A). The first module was enriched with control cells and characterized by the expression of microglial genes, like Csf1r, Siglech, Tgfbr1, and Cx3cr1. The second module was enriched with CNV d3 cells and characterized by the expression of genes encoding proteins associated with cytoskeleton reorganization (Actb, Tuba1c, Tmsbx4) and proliferation (Ptma, Pcna, Cdk1). The third module was enriched for CNV d7 cells, and included genes underlying a more diverse regulation pattern, like Sparc, and the genes Ctss, Cd74, and H2‐Aa, typically expressed by APC's. As shown in the minimum spanning tree, CNV d3 represented the acute phase after lesion formation while CNV d7 consisted of cells expressing macrophage‐associated genes and was more similar to the non‐lasered control mice indicating an overall decline in myeloid cell reactivity (Figs 8A and 7G). Despite the presence of diverse cell types in the CNV‐lesioned areas, microglia represent the most abundant cell type at all investigated time points after lesion formation (Figs 6D and E, and 7D and G).
Figure 8. Disease stage‐dependent gene expression pattern in myeloid cells during experimental CNV.

- Trajectory analysis reveals alterations in gene expression pattern over time and disease state (d0, d3, d7). Above: Trajectory heatmap depicting loss of homeostatic microglial gene expression signatures (P2ry12, Tmem119, Csf1r, SiglecH) and induction of genes involved in cytoskeleton modifications (Actb, Tuba1c), cell cycle progression (Cdk1, Ptma), and antigen presentation (Cd74, H2‐Aa). Highlighted molecules (asterisks) were confirmed by immunohistochemistry shown in (B–D). Below: Trajectory plot showing the trajectory followed by myeloid cells upon CNV progress.
- Above: P2ry12 expression is shown by trajectory analysis and represented in a t‐SNE plot. Expression is high in homeostatic microglia (see Figs 1G and H and 7H). Below: Typical immunohistochemistry for P2RY12 (green) in unlesioned and lesioned areas. Arrows indicate lost P2RY12 expression. Asterisks mark microglial cells that maintained P2RY12 expression. Iba1 immunohistochemistry (red) to show microglia. Pictures are representative of two mice. Scale bars represent 25 µm.
- Above: Tmem119 expression visualized by trajectory analysis and represented in a t‐SNE plot. High signals in homeostatic microglia (see Fig 1G and H). Below: TMEM119 immunofluorescence (green) by Iba1+ (red) microglia inside lesioned and non‐lesioned areas in the retina and RPE. Arrows indicate microglia with lost TMEM119 expression whereas asterisks mark microglial cells that maintained TMEM119 expression. Picture is representative of two mice. Scale bars represent 25 µm.
- Above: Ptma expression presented by a t‐SNE plot and its trajectory analysis over the disease course. Ptma expression correlates with proliferation of rMGs at d7 during CNV in Cx3cr1CreERT2:Rosa26‐tdTomato mice. Below: Representative immunofluorescence of proliferating EdU+ (white) Iba1+ (red, Tomato) microglia at sites of CNV on d7 (arrow) next to an EdU−Tomato+Iba1− cell (asterisks) after EdU treatment from d0 to d6. Arrowhead points toward an intravascular myeloid EdU−Tomato−Iba1+ cell. Typical pictures from three mice obtained from one independent experiment are shown. Scale bar represents 25 µm.
Next, we took advantage of Cx3cr1CreERT2:Rosa26‐tdTomato mice to validate the down‐regulation of P2RY12 and TMEM119 and the presence of microglial proliferation indicated by the up‐regulation of the proliferating cell nuclear antigen (Pcna) and prothymosin alpha (Ptma) (Fig 8B–D). Both P2ry12 and Tmem119 expression decreased with disease progression and could only be detected in the clusters 3, 4, and 5, but was lost in cluster 6 (Fig 8B and C). At CNV d7, highly ramified tomato+P2RY12+ microglial cells were found in non‐lesioned area. However, inside and close to the lesions, microglial morphology changed into a more heterogeneous appearance. Here, beside tomato+P2RY12+ cells, we recognized tomato+P2RY12lo microglia in the retina or almost undetectable P2RY12 signals in tomato+ cells on the RPE (Fig 8B). Notably, the protein expression pattern of TMEM119 strongly resembled P2RY12 having highly ramified tomato+TMEM119+ cells in unaffected regions of the retina but a decrease of TMEM119 immunoreactivity and ramification in tomato+ cells close to the lesion site in the same retina and on the RPE corresponding to the lesion at CNV d7 (Fig 8C). In contrast, the increased expression of Pcna and Ptma suggested enhanced proliferation during CNV. We confirmed this by detecting EdU incorporation in tomato+Iba1+ rMG inside the lesion at CNV d7 (Fig 8D).
Validation of murine disease‐associated expression of MHC class II in human neovascular CNV membranes
By comparing our findings in mice with the human situation, we found that H2‐Aa expression in CNV‐lesioned mice mimicks the expression in human CNV membranes of patients with neovascular AMD, both on RNA and protein level (Fig 9A–D). In humans, CNV membranes develop as newly formed fibrotic and vascularized tissue underneath the RPE and were extracted during surgery. In the murine retina, H2‐Aa expression increased during the course of CNV development (Fig 9A). In accordance with these findings, MHC class II expression was absent in the retina distant to the lesion but could be rarely found in the center of the lesion and only very restricted to tomato+ rMGs which were surrounded by MHCII− cells (Fig 9B). By contrast, the diversity increased on the RPE where we found tomato+MHCII+ more abundantly close to tomato+MHC class II− and also tomato−MHC class II+ cells that could represent infiltrating cells (Fig 9B). The human CNV tissue was investigated by a novel sequencing approach specifically tailored for formalin‐fixed and paraffin‐embedded tissue (Boneva et al, 2020). The so‐called Massive Analysis of cDNA ends revealed a high expression of HLA‐DR, the human orthologous gene to the murine H2‐Aa, specifically in the human CNV tissue but was almost absent in the controls (Schlecht et al, 2020). We validated this finding by staining human CNV and control tissue against HLA‐DR. In the control, HLA‐DR was restricted to the choroid and absent in the retina but was more abundantly expressed in the CNV membrane.
Figure 9. Correlative analysis between murine experimental and human neovascular CNV.
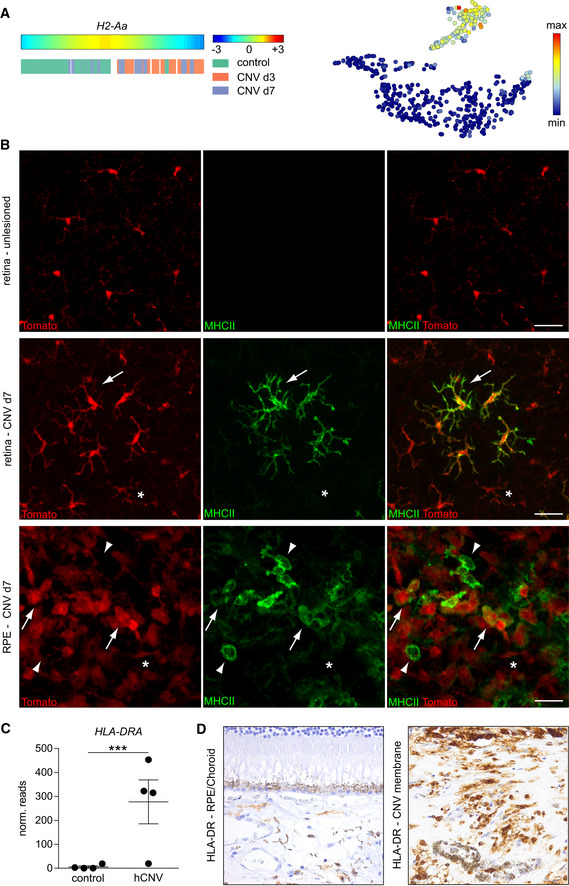
- H2‐Aa expression visualized by trajectory analysis and represented in a t‐SNE plot.
- H2‐Aa immunohistochemistry (green) by Iba1+ (red) microglia inside lesioned and non‐lesioned areas in the retina and RPE. Arrows indicate microglia with acquired MHCII expression whereas asterisks mark microglial cells that remained MHCII negative. Picture is representative of two mice. In the RPE, arrow heads label Tom−MHCII+ cells. Scale bars represent 25 µm.
- HLA‐DRA mRNA expression examined by RNA‐Seq via Massive analysis of cDNA ends (MACE) analysis of human formalin‐fixed and paraffin‐embedded (FFPE) membranes of choroidal neovascularization (CNV). Bars represent means ± s.e.m. of four investigated human samples of age‐related macular degeneration associated with choroidal neovascularization and four control tissues consisting of choroid and RPE. Level of significance was calculated using DESeq (P = 3.61 × 10⁻²¹).
- Immunohistochemistry for HLA‐DR in the RPE/choroid of one control and the CNV membrane of one patient suffering from age‐related macular degeneration associated with choroidal neovascularization.
Taken together on gene and protein levels, we found time‐dependent progression from control to activated proliferating microglia within 3 days following CNV induction. Furthermore, within 7 days of CNV, microglia lost acute reactivity and adopted a macrophage‐like transcriptional profile. Thus microglia displayed a plastic, context‐dependent phenotype. Overall, our results suggest the emergence of unique rMG states especially associated with CNV pathology that are characterized by distinct signatures and contributing to defined disease conditions.
Discussion
Our study provides a high‐resolution view of the transcriptional landscape of tissue macrophages across multiple compartments of the eye and their distinct developmental pathways as well as their different turnover kinetics during homeostasis. Using scRNA‐Seq, we identified several subsets of myeloid cells and their transcriptional states in the cornea, ciliary body, and retina during health. Some identified clusters showed a close relationship between homeostatic cbMΦ and cMΦ, while other clusters were significantly enriched with either cbMΦ or cMΦ. By contrast, rMG were distinct from both and transcriptionally different from myeloid cells found in the steady‐state cornea and ciliary body. By comparing all macrophages from the eye with the brain, rMG showed a close relationship to microglia from the brain. Certain cluster were composed of cells of all compartments, namely brain, retina, cornea, and ciliary body underlining their close relationship. Notably, short‐lived cMΦ exhibited a molecular signature that was similar to BM‐derived monocytes and substantially different from rMG and bMG. In a previous study, it was suggested to differentiate short‐ from long‐lived macrophages based on their differential clustering due to differences in the expression of MHCII and CD11c (O’Koren et al, 2019). CMΦ were not further investigated in this study (O’Koren et al, 2019). In our study, we detected cMΦ and few rMG to express CD11c on protein level despite their long‐lived nature but no MHC class II protein which is in line with previous reports (Hamrah et al, 2003; Dando et al, 2016). Nevertheless, our findings revealed that rMG and cbMΦ were transcriptionally unrelated to circulating myeloid cells representing a new advancement in the field. In the past, blood monocytes were thought to contribute to all of the three investigated macrophage populations in the eye (Xu et al, 2007; Kezic et al, 2008; Chinnery et al, 2008). These conclusions were drawn based on results of irradiation studies, but this is known today to compromise natural barriers when head shielding is not applied.
The origin of tissue macrophages in different organs could be traced back to erythromyeloid precursors in the yolk sac but the origin of macrophages in the different compartments of the eye remained unclear for a long time (Kierdorf et al, 2013a; Goldmann et al, 2016; Hagemeyer et al, 2016; Ensan et al, 2016). Therefore, we applied a conditional embryonic fate mapping model that allowed us to follow yolk sac‐derived macrophages in Cx3cr1CreERT2:Rosa26‐YFP mice until birth. Our results clearly showed a contribution of embryonic precursors to rMG, cbMΦ, and cMΦ which was so far only shown before for rMG (O’Koren et al, 2019). Of note, the labeling efficiency in embryonic pulse labeling approaches is consistently lower than conditional fate mapping in adult mice due to the narrow time frame of developmental stages in the embryo (Ginhoux et al, 2010; Perdiguero et al, 2014; Wieghofer & Prinz, 2015; Goldmann et al, 2016; O’Koren et al, 2019). The relatively low amount of prenatal labeling of cMΦ together with their transcriptional profile resembling peripheral blood monocytes raised the question about a possible steady turnover of these cells. Consequently, we used adult Cx3cr1CreERT2:Rosa26‐YFP mice to follow the turnover of rMG, cbMΦ, and cMΦ for up to 24 weeks after YFP induction. Beside the fact that rMG and cbMΦ remained stable over time as shown before (O’Koren et al, 2019), cMΦ were the only cell type that showed a steady and significant decrease of YFP‐expressing cells indicating a continuous replenishment. To further validate our findings, we applied other models to exclusively target bone marrow‐derived peripheral blood leukocytes by parabiosis and additionally used Flt3Cre:Rosa26‐YFP mice to broadly label myeloid cells of the definitive hematopoiesis (Boyer et al, 2011). Again, cMΦ showed ongoing replenishment during adulthood, revealed by the temporal increase of genetically labeled partner‐derived cells in wild‐type parabionts and the highest contribution of Flt3‐dependent cells to this population. Of note, our results obtained with parabiotic mice confirmed that cMΦ can derive from circulating blood cells during adulthood, but do not necessarily exclude a fetal liver origin.
In several CNS diseases, an infiltration of blood‐derived monocytes is occurring (Ajami et al, 2011; Ma et al, 2017; Ajami et al, 2018; Jordão et al, 2019). To distinguish rMG (tomato+) from infiltrating monocytes (tomato−) during pathology, we used Cx3cr1CreERT2:Rosa26‐tdTomato mice and investigated CNV that mimics many aspects of neovascular AMD in humans. In this model, lesions are formed in the choroid affecting the overlaid retinal pigment epithelium (RPE) and the retina. Here, we found that rMG constitute a major cell population in the diseased retina and RPE with lower numbers of recruited monocytes. This finding is in line with another model mimicking the advanced atrophic variant of AMD by pharmacologically induced injury of the RPE and subsequent photoreceptor damage. Here, endogenous rMG were the most abundant cell type in comparison with exogenously derived infiltrating monocytes (Ma et al, 2017).
Our single‐cell profiling data provided further compelling evidence that rMG responses to pathology are quite complex and characterized by several disease‐associated clusters of rMG. We further identified a broad spectrum of non‐rMG cell types that are involved mainly consisting of DCs, lymphocytes, monocytes, and macrophages. To gain more insight into the temporal gene signature changes across the myeloid cells, we performed a trajectory analysis. Here, the highest diversity of cells was found at CNV d3, the time point that clearly separated from the controls and CNV d7 in the minimum spanning tree of the trajectory analysis. Nevertheless, we found that disease model‐associated rMG clusters greatly differ from the rMG states found under homeostatic conditions. The molecular signatures of the rMG clusters that appeared during CNV were characterized by a down‐regulation of homeostatic genes, such as P2ry12 and Tmem119 which we could confirm on protein level. In addition to other homeostatic microglia signature genes that were dysregulated, like Siglech, Csf1r, or C1qa, it is interesting to note that these were also down‐regulated in models of photoreceptor degeneration (O’Koren et al, 2019). At the same time, other transcripts including Ptma and Pcna that are associated with proliferation were increased. This is in line with EdU incorporation in tomato+ rMG at CNV d7. In both, the CNV model and under photoreceptor degeneration Spp1 and Lgals3 were up‐regulated at later stages of the respective model. Finally, we were able to correlate our findings in mice with the human situation. Here, we confirmed that the increased expression of the murine H2‐Aa (MHC class II) in the experimental CNV model is mirrored by the expression of the human counterpart HLA‐DRA that was increased in surgically extracted CNV membranes, both on gene and protein level.
In conclusion, we identified several subsets of myeloid cells and their transcriptional states in the cornea, ciliary body, and retina during health by single‐cell profiling. CbMΦ, cMΦ, and rMG all showed a contribution from prenatal sources of primitive hematopoiesis but different dependences on bone marrow‐derived cells after birth leading to compartment‐specific turnover rates of eye macrophages. Our results will provide new insights into the biology of myeloid subsets in the healthy and diseased eye that might open new opportunities for the treatment of ophthalmological diseases like AMD.
Materials and Methods
Reagents and Tools table
| Reagent/Resource | Reference or Source | Identifier or Catalog Number |
|---|---|---|
| Acta1GFP/+ | CMV–β‐actin hybrid promoter, Ajami et al 2007 | |
| Ccr2RFP/+ | B6.129(Cg)‐Ccr2tm2.1Ifc/J (Stock No: 017586, JAX mice) | |
| Cx3cr1GFP/+ | B6.129P2(Cg)‐Cx3cr1tm1Litt/J (Stock No: 005582) | |
| Cx3cr1CreERT2 | B6.129P2(C)‐Cx3cr1tm2.1(cre / ERT2)Jung/J (Stock No: 020940) | |
| Flt3‐Cre | Benz et al 2008 | |
| HexbtdT/tdT | Masuda et al 2020 | |
| Itgax‐DTR/EGFP | B6.FVB‐1700016L21RikTg(Itgax‐DTR / EGFP)57Lan/J (Stock No. 004509, JAX mice) | |
| Rosa26‐fl‐stop‐fl‐tdTomato | B6.Cg‐Gt(ROSA)26Sortm9(CAG‐tdTomato)Hze/J ( Stock No: 007909, JAX mice) | |
| Rosa26‐fl‐stop‐fl‐EYFP | B6.129X1‐Gt(ROSA)26Sortm1(EYFP)Cos/J (Stock No: 006148, JAX mice) | |
| Antibodies | ||
| rabbit anti‐Iba‐1, polyclonal, 1:500 (cryo) or 1:1000 (flat‐mount) | WAKO, Osaka, Japan | cat # 019‐19741 |
| rabbit anti‐Iba‐1, polyclonal, 1:500 (cryo) or 1:1000 (flat‐mount) | Synaptic Systems, Göttingen, Germany | cat # 234 013 |
| rabbit anti‐P2RY12, polyclonal, 1:500 | AnaSpec, Fremont, USA | cat # AS‐55043A |
| rabbit anti‐Tmem119, polyclonal, 1:500 | Synaptic Systems, Göttingen, Germany | cat # 400 002 |
| rat anti‐MHC class II (clone M5.114.15.2), monoclonal, 1:500 | BioLegend, USA | cat # 107602 |
| goat anti‐GFP, polyclonal, 1:1000 | Rockland Immunochemicals Inc., Gilbertsville, USA | cat # 600‐106‐215 |
| goat anti‐GFP, polyclonal, 1:1000 | Acris Antibodies Inc., San Diego, USA | cat # R1091P |
| rat anti‐CD74‐Alexa Flour® 647 (clone In1/CD74), monoclonal, 1:100 | BioLegend, USA | cat # 151003 |
| rat anti‐CD206‐Alexa Flour® 647 (clone MR5D3), monoclonal, 1:100 | Bio‐Rad Laboratories, UK | cat # MCA2235A647 |
| rat anti‐F4/80 (clone BM8), monoclonal, 1:100 | Abcam plc., UK | cat# ab16911 |
| donkey anti‐rabbit, Alexa Fluor 568®, polyclonal, 1:500 | Thermo Fisher Scientific Inc., USA | cat # A10042 |
| donkey anti‐goat Alexa Fluor 647®, polyclonal, 1:500 | Thermo Fisher Scientific Inc., USA | cat # A‐21447 |
| goat anti‐rabbit, Alexa Fluor 647®, polyclonal, 1:500 | Thermo Fisher Scientific Inc., USA | cat # A‐21244 |
| goat anti‐rat, Alexa Fluor 568®, polyclonal, 1:500 | Thermo Fisher Scientific Inc., USA | cat # A‐11077 |
| goat anti‐rat, Alexa Fluor 647®, polyclonal, 1:500 | Thermo Fisher Scientific Inc., USA | cat # A‐21247 |
| mouse anti‐HLA‐DP, DQ, DR, (clone CR3/43), monoclonal, 1:200 | Agilent Dako, Santa Clara, CA, USA) | cat # M0775 |
| Fc receptor blocking antibody CD16/CD32 (clone 2.4G2) | BD Pharmingen, BD Biosciences, Heidelberg, Germany | cat # 553141 |
| rat anti‐CD11b‐BV421 (clone M1/70), monoclonal, 1:100 | BioLegend, USA | cat # 101235 |
| rat anti‐CD45‐APC‐e780 (clone 30‐F11), monoclonal, 1:100 | Thermo Fisher Scientific Inc., USA | cat # 47‐0451‐82 |
| rat anti‐CD115‐PE‐Cy7 (AFS98), monoclonal, 1:100 | Thermo Fisher Scientific Inc., USA | cat # 25‐1152‐82 |
| rat anti‐F4/80‐PE‐Cy7 (BM8), monoclonal, 1:100 | Thermo Fisher Scientific Inc., USA | cat # 25‐4801‐82 |
| mouse anti‐CD64‐Alexa647 (clone, X54‐5/7.1), monoclonal, 1:100 | BioLegend, USA | cat # 139322 |
| rat anti‐Ly6C‐FITC (clone AL‐21), monoclonal, 1:100 | BD Pharmingen, BD Biosciences, Heidelberg, Germany | cat # 553104 |
| rat anti‐Ly6G‐PE‐Cy7 (clone 1A8), monoclonal, 1:100 | BD Pharmingen, BD Biosciences, Heidelberg, Germany | cat # 560601 |
| anti‐CD45‐BV421 (clone 30‐F11), monoclonal, 1:100 | BioLegend, USA | cat # 103134 |
| rat anti‐CD3‐PE‐Cy7 (clone 17A2), monoclonal, 1:100 | BioLegend, USA | cat # 100220 |
| rat anti‐CD19‐PE‐Cy7 (clone 6D5), monoclonal, 1:100 | BioLegend, USA | cat # 115519 |
| Oligonucleotides and other sequence‐based reagents | ||
| RNAprotect Tissue Reagent | QIAGEN, Hilden, Germany | cat # 76104 |
| RNeasy Plus Micro Kit | QIAGEN, Hilden, Germany | cat # 74034 |
| Buffer RLT Plus | QIAGEN, Hilden, Germany | cat # 1053393 |
| SMARTer Ultra Low Input RNA Kit for Sequencing v4 | Clontech Laboratories, Inc., Mountain View, CA, USA | cat # 634456 |
| KAPA SYBR FAST ABI Prism Library Quantification Kit | Roche, Basel, Switzerland | cat # KK4835 |
| Illumina TruSeq SR Cluster Kit v3 | Illumina, USA | cat # GD‐401‐3001 |
| TruSeq SBS v3 Reagents | Illumina, USA | cat # FC‐401‐3001 |
| AMPure/RNAClean XP beads | Beckman Coulter, München, Germany | cat # A63987 |
| Quick‐RNA FFPE Kit | Zymo Research, USA | cat # R1008 |
| DNAse I digestion using the Baseline‐ZERO kit | Lucigen Corporation, USA | cat # DB0715K |
| Qubit RNA HS Assay Kit | Thermo Fisher Scientific Inc., USA | cat # Q32852 |
| RNA Pico Sensitivity Assay | Perkin Elmer, USA | cat # CLS960012 |
| Chemicals, enzymes and other reagents | ||
| Fluorescein | Alcon Pharma GmbH | cat # H12588‐0113 |
| Tissue‐Tek® O.C.T.TM Compound | Sakura Finetek Germany GmbH | cat # 4583 |
| in Vitro‐Clud® (R. Langenbrinck GmbH, Emmendingen, Germany). | R. Langenbrinck GmbH, Emmendingen, Germany | cat # 04‐0001 |
| May‐Grünwald (Merck 101424) | Merck | cat # 101424 |
| Giemsa (Merck 109204) | Merck | cat # 109204 |
| Tamoxifen (TAM, T5648‐1G, Sigma‐Aldrich, Taufkirchen, Germany) | Sigma‐Aldrich, Taufkirchen, Germany | cat # T5648‐1G |
| corn oil (Sigma‐Aldrich, C8267‐500ml) | Sigma‐Aldrich, Taufkirchen, Germany | cat # C8267‐500ml |
| Hank's Balanced Salt Solution | Thermo Fisher Scientific Inc., USA | cat # 14170138 |
| eBioscience™ Fixable Viability Dye eFluor™ 506 | Thermo Fisher Scientific Inc., USA | cat # 65‐0866‐14 |
| eBioscience™ Fixable Viability Dye eFluor™ 780 | Thermo Fisher Scientific Inc., USA | cat # 65‐0865‐18 |
| Software | ||
| FACSDiva software | BD Biosciences, Heidelberg, Germany | |
| FlowJo software (7.6.1) | Treestar (BD Biosciences, Heidelberg, Germany) | |
| IMARIS 8.0 | Bitplane, Switzerland | |
| FV10‐ASW 4.2 Viewer | Olympus, Tokyo, Japan | |
| GraphPad Prism (Version 6.0) | GraphPad Software, USA | |
| Other | ||
| RS 2000 Biologica x‐Ray irradiator | Rad Source Technologies, USA | |
| VISULAS 532s | Carl Zeiss Meditec AG, Jena, Deutschland | |
| Olympus BX‐61 fluorescence microscope | Olympus, Tokyo, Japan | |
| Olympus DP71 color camera | Olympus, Tokyo, Japan | |
| BZ‐9000 fluorescence microscope | Keyence, Osaka, Japan | |
| Fluoview FV 1000 confocal microscope | Olympus, Tokyo, Japan | |
| 20x 0.95 NA XLUMPlanFL N objective | Olympus, Tokyo, Japan | |
| 20x 0.75 NA U Plan S Apo objective | Olympus, Tokyo, Japan | |
| 40x 0.95 NA U Plan S Apo objective | Olympus, Tokyo, Japan | |
| DMi‐8 confocal microscope | Leica, Wetzlar, Germany | |
| 20x NA 0.75 CS2 objective | Leica, Wetzlar, Germany | |
| FACSCanto II | BD Biosciences, Heidelberg, Germany | |
| FACSAria III | BD Biosciences, Heidelberg, Germany | |
| MoFlo High Speed Cell Sorter | Beckman Coulter, München, Germany | |
| HiSeq 3000 | Illumina, USA | |
| HiSeq 1000 | Illumina, USA | |
| NextSeq 500 | Illumina, USA | |
| mosquito® HTS Nanolitre Liquid Handler | SPT Labtech, USA | |
| Autostainer | Agilent Dako, Santa Clara, CA, USA | |
| Qubit Fluorometer | Life Technologies, USA | |
| LabChip GXII Touch | Perkin Elmer, USA | |
| 384‐well plates | Biorad, Munich, Germany | |
| RNeasy Plus Micro Kit | QIAGEN, Hilden, Germany | cat # 74034 |
| Click‐iT® EdU Alexa Fluor® 488 Imaging Kit | Thermo Fisher Scientific | cat # C10337 |
| Dako REALTM EnVisionTM Detection System Kit | Agilent Dako, Santa Clara, CA, USA | cat # K406511‐2 |
Methods and Protocols
Mice
In this study, C57BL/6J mice were used as wild‐type (WT) mice. All transgenic lines (Acta1GFP /+, Ccr2RFP /+, Cx3cr1GFP /+, Hexb tdT/tdT, Cx3cr1CreERT2, Flt3 Cre, Rosa26‐fl‐stop‐fl‐EYFP (Rosa26‐YFP), and Rosa26‐fl‐stop‐fl‐tdTomato (Rosa26‐tdTomato)) were bred on a C57BL/6J background under specific pathogen‐free conditions and devoid of Crb1 (RD8) mutations. Itgax‐DTR/EGFP (CD11c‐GFP) mice were purchased from Jackson Laboratory (Stock No. 004509, C57BL/6J background). Cx3cr1CreERT2 were crossed to Rosa26‐YFP or Rosa26‐tdTomato. Flt3 Cre were crossed to Rosa26‐YFP. All animal experiments were approved by local administration and were performed in accordance with the respective national, federal, and institutional regulations.
Tamoxifen treatment
For induction of the nuclear CreER‐T2 recombinase activity in adult animals, 6‐ to 8‐week‐old Cx3cr1CreERT2 mice of mixed gender were treated with 4 mg Tamoxifen (TAM, T5648‐1G, Sigma‐Aldrich, Taufkirchen, Germany) dissolved in 200 µl corn oil (Sigma‐Aldrich, C8267‐500ml) and injected subcutaneously at two time points 48 h apart. For pulse labeling experiments, the CreER‐T2 recombinase activity was induced in Cx3cr1CreERT2:Rosa26‐YFP embryos with 200 µl of 20 mg/ml TAM and 10 mg/ml Progesterone dissolved in corn oil by i.p. injections into pregnant females at 9 days post‐coitum.
BM transplantation
Eight‐week‐old recipient wild‐type mice were irradiated and reconstituted with 5 × 10⁶ bone marrow cells derived from femur and tibia of an adult donor (Acta1 GFP/+) mice, injected into the tail vein of recipients. Mice received whole‐body irradiation (11 Gy) 24 h prior to bone marrow reconstitution with an RS 2000 Biologica x‐Ray irradiator. After 4 weeks, reconstitution efficiency in the blood was assessed by flow cytometry and found to be > 90% in Ly6Chi monocytes.
Parabiosis
Pairs of female WT and Acta1GFP /+ mice were surgically connected for 2, 12, and 20 weeks as previously described (Ajami et al, 2007). Blood sharing was verified between 10 and 15 days after surgery and at the day of dissection by flow cytometry (see below). After transcardial perfusion with PBS, eyes were fixed in 4% paraformaldehyde (PFA, wt/vol) for 1 h at RT and flat‐mounted after free‐floating immunofluorescence staining of the retina (see below).
Laser‐induced choroidal neovascularization model
Mice of mixed gender that underwent induction of choroidal neovascularization (Tobe et al, 1998) were anesthetized with a mixture of ketamine (100 mg/kg) and xylazine (6 mg/kg), and pupils were dilated with a combination of 0.5% tropicamide and neosynephrine‐POS 5%. Corneal gel was applied to maintain hydration of the cornea and reduce media opacifications. Mice were placed in front of an argon laser (VISULAS 532s, ZEISS) after the pupils were completely dilated. A cover slip with a drop of gel was placed on the eye as a contact lens to convert the curved cornea surface to a planar surface. Three laser burns at equal distance from the optic disk were induced by an Argon laser with a wavelength of 532 nm, a power of 150 mW, a fixed diameter of 100 µm, and duration of 100 ms. Only burns that produced a bubble as a sign for retinal pigment epithelial rupture were included in the study. After laser treatment, mice were then placed on a pre‐warmed warming plate at 35°C until they recovered from anesthesia. Fundus imaging and fluorescence angiography was performed by injecting 40 µl Fluorescein (ALCON 10%, H12588‐0113) diluted 1:20 with 0.9% NaCl per 20 g mouse. At the respective days after laser treatment (d3, d7), mice were transcardially perfused with PBS, eyes were fixed in 4% paraformaldehyde (PFA, wt/vol) for 1 h at RT and flat‐mounted after free‐floating immunofluorescence staining of the retina (see below).
Fluorescence microscopy
After transcardial perfusion with phosphate‐buffered saline (PBS), eyes were fixed in 4% PFA for 1 h at RT and processed as previously described for flat mounts (Pitulescu et al, 2010) or dehydrated in 30% sucrose and embedded in Tissue‐Tek® O.C.T.TM Compound (Sakura Finetek Germany GmbH) for cryosections. In brief, eye cups were dehydrated in 30% sucrose after fixation and embedded in Tissue‐Tek. 12 µm sections were then blocked with PBS containing 5% bovine serum albumin and permeabilized with 0.1% Triton X‐100 in blocking solution. Primary antibodies were added over night at a dilution of 1:500 (cryo) or 1:1,000 (flat mount) for Iba‐1 (019‐19741, WAKO, Osaka, Japan; 234 013, Synaptic Systems, Göttingen, Germany), 1:500 for P2RY12 (AS‐55043A, AnaSpec, Fremont, USA), Tmem119 (400 002, Synaptic Systems, Göttingen, Germany) and MHC class II (clone M5.114.15.2, 107602, BioLegend) and 1:1,000 for anti‐GFP (600‐106‐215, Rockland Immunochemicals Inc., Gilbertsville, USA; R1091P, Acris Antibodies Inc., San Diego, USA), 1:100 for CD74‐Alexa Flour® 647 (clone In1/CD74, 151003, BioLegend, USA), and CD206‐Alexa Flour® 647 (clone MR5D3, MCA2235A647, Bio‐Rad Laboratories, UK) at 4°C. Secondary antibodies were added in a dilution of 1:500 (Alexa Fluor® 568 and Alexa Fluor® 647, Thermo Fisher Scientific, Waltham, USA) for 2 h at RT (cryo) or overnight at 4°C (flat mount). Nuclei were counterstained with 4′,6‐Diamidin‐2‐phenylindol (DAPI). Images were taken using a conventional fluorescence microscope (Olympus BX‐61 with a color camera (Olympus DP71)) (Olympus, Tokyo, Japan) or BZ‐9000 (Keyence, Osaka, Japan), and the confocal pictures were taken with a Fluoview FV 1000 (Olympus) using a 20x 0.95 NA XLUMPlanFL N, 20x 0.75 NA U Plan S Apo, or a 40x 0.95 NA U Plan S Apo or a DMi‐8 (Leica) with a 20x NA 0.75 CS2 (Leica 506517).
Cytospin
After sorting of the cells for scRNA‐seq, the same tube was further sorted in another tube containing 500 µl of HBSS and heat‐inactivated fetal calf serum (1:1) and kept on ice until centrifugation. Samples were transferred to centrifugation tubes and centrifuged at 64 g for 5 min. Next samples were transferred to a specific cytochamber system (Hettich Instruments, Tuttlingen, Germany) and centrifuged for 5 min at 36 g; supernatant was removed followed by a drying centrifugation step (3 min, 122 g) and subsequent cell staining. Prior to the staining, May‐Grünwald (Merck 101424) and the diluted Giemsa (Merck 109204) solutions have to be prepared freshly, filtered before use, and were applied at RT. Air‐dried slide with spinned down cells underwent a 4‐min incubation in May‐Grünwald solution (Merck 1.01424). After that, the solution is diluted by adding an equal volume of aqua bidest for another 4 min. Next, the diluted May‐Grünwald solution was discarded and the slides were rinsed with aqua bidest. The Giemsa staining has to be incubated for 15 min at a dilution of 1:10 in aqua bidest and washed off with aqua bidest before a brief incubation in 100% ethanol followed by xylol before embedding.
In vivo EdU proliferation assay
Eight weeks following TAM injection Cx3cr1CreERT2:Rosa26‐tdTomato mice underwent laser treatment to induce choroidal neovascularizations (d0). EdU (100 µg/day) was applied intraperitoneally from day 0 to day 6 once daily. Mice were sacrificed at day 7. EdU was visualized by the Click‐iT® EdU Alexa Fluor® 488 Imaging Kit (Thermo Fisher Scientific, C10337) according to the manufacturers protocol, nuclei by DAPI and myeloid cells by anti‐Iba1 and secondary anti‐rabbit Alexa Fluor® 647 antibody.
Identification of microglia and circulation‐derived monocytes
Cx3cr1CreERT2:Rosa26‐tdTomato mice of mixed gender were lasered 8 weeks after TAM treatment to induce choroidal neovascularization. After perfusion with PBS at the indicated time points following laser treatment, retinal and RPE/choroidal whole‐mounts were fixed, stained, and flat‐mounted. The lesions were imaged on a Fluoview FV1000 (see above). Iba1+ cells were identified in the stack volume using IMARIS and automatically classified as Iba1+tom+ microglia or Iba1+tom− periphery‐derived monocytes, according to the calculated stack‐specific background in the tomato channel. The percentage of tomato+/− was determined among all Iba1+ cells in the whole lesioned stack volume imaged at a 20× magnification.
Flow cytometry
Eyecups were carefully dissected under a binocular to separate retina, cornea and ciliary body. Monocytes were isolated from bone marrow. Cornea and ciliary body tissues were separated into single‐cell suspensions by Collagenase D digestion, resuspension, and filtration through 70 µm cell sieve. Retina was dissociated by resuspension. Two mice were pooled for ciliary body samples if not indicated differently. Dead cell exclusion was performed by incubation with fixable viability dye 506 or 780 (eBioscience), respectively. Anti‐CD16/CD32 Fc block was performed to avoid unspecific binding. Cells were stained with primary antibodies directed against CD11b (M1/70), CD45 (30‐F11), CD115 (AFS98), F4/80 (BM8) (eBioscience), CD64 (X54‐5/7.1), Ly6C (AL‐21), and Ly6G (1A8) at 4°C for 20 min at a concentration of 1:200 if not indicated differently. CD206 (C068C2) (BioLegend) was incubated at 4°C for 45 min. Cells were washed and analyzed using a FACSCanto II or a FACSAria III (RFP detection in Ccr2RFP /+ mice) (BD Biosciences, Heidelberg, Germany). Sorting was performed using a MoFlo High Speed Cell Sorter (Beckman Coulter, München). Data were acquired with FACSDiva software (Becton Dickinson). Postacquisition analysis was performed using FlowJo software. (Gating strategy: Fig EV6).
RNA sequencing and analysis
C57BL/6J mice negative for the RD8 mutation were purchased from Charles River and analyzed at the age of 8 weeks. Total bulk RNA was extracted from directly into RNAprotect buffer (QIAGEN, Hilden, Germany) FACS‐sorted CD45+CD11b+Ly6C−Ly6G− retinal and brain microglia, CD45+CD11b+CD64+F4/80+Ly6C−Ly6G− cornea macrophages and CD45+CD11b+SScloCD115+Ly6Chi BM monocytes, according to the “Purification of total RNA from animal and human cells” protocol of the RNeasy Plus Micro Kit (QIAGEN). In brief, cells were stored and shipped in RNAprotect buffer at 2–8°C. After pelleting, the RNAprotect buffer was replaced by RLT Plus buffer (QIAGEN) and the samples were homogenized by vortexing for 30 s. Genomic DNA contamination was removed using gDNA Eliminator spin columns. Next ethanol was added and the samples were applied to RNeasy MinElute spin columns followed by several wash steps. Finally, total RNA was eluted in 12 μl of nuclease free water. Purity and integrity of the RNA were assessed on the Agilent 2100 Bioanalyzer with the RNA 6000 Pico LabChip reagent set (Agilent, Palo Alto, CA, USA).
The SMARTer Ultra Low Input RNA Kit for Sequencing v4 (Clontech Laboratories, Inc., Mountain View, CA, USA) was used to generate first strand cDNA from 150 to 600 pg total RNA. Double‐stranded cDNA was amplified by LD PCR (12–14 cycles) and purified via magnetic bead cleanup. Library preparation was carried out as described in the Illumina Nextera XT Sample Preparation Guide (Illumina, Inc., San Diego, CA, USA). 150 pg of input cDNA were tagmented (tagged and fragmented) by the Nextera XT transposome. The products were purified and amplified via a limited‐cycle PCR program to generate multiplexed sequencing libraries. For the PCR step, 1:5 dilutions of index 1 (i7) and index 2 (i5) primers were used. The libraries were quantified using the KAPA SYBR FAST ABI Prism Library Quantification Kit (Kapa Biosystems, Inc., Woburn, MA, USA). Equimolar amounts of each library were pooled, and the pools were used for cluster generation on the cBot with the Illumina TruSeq SR Cluster Kit v3. The sequencing run was performed on a HiSeq 1000 instrument using the indexed, 50 cycles single‐read (SR) protocol, and the TruSeq SBS v3 Reagents according to the Illumina HiSeq 1000 System User Guide. Image analysis and base calling resulted in .bcl files, which were converted into .fastq files with the bcl2fastq v2.18 software. RNA extraction, library preparation, and RNA‐seq were performed at the Genomics Core Facility “KFB—Center of Excellence for Fluorescent Bioanalytics” (University of Regensburg, Regensburg, Germany).
Differential Gene Expression Analysis and Data Visualization: Fastq files were quality controlled using FastQC (Andrews, 2010) and FastQ Screen (Winget, 2011) software. Raw data were then mapped to the mouse genome (Gencode version M11 (Mudge & Harrow, 2015)) using the STAR 2.5.2b aligner (Dobin et al, 2013). Subsequently aligned reads were matched with transcriptome annotation, and gene counts were generated using featureCounts 1.5.1 (Liao et al, 2014). Read count normalization and differentially gene expression analysis was performed using the limma/voom pipeline (limma 3.34.0) (Law et al, 2014). Data visualization was performed using the gplots and ggplot2 packages in R. Spider Plots: Log2fold changes vs. brain microglia were calculated through limma/voom for retinal microglia, cornea macrophages, and bone marrow monocytes (Warnes et al, 2016). This three‐dimensional dataset was subsequently projected into two dimensions as previously described van de Laar et al, 2016). Briefly x′ and y′ dimensions were calculated as X′ = cos(0°)*X + cos(120°)*Y + cos(240°)*Z and Y′ = sin(0°)*X + sin(120°)*Y + sin(240°)*Z with X = coMacvsbMG, Y = BM‐MovsbMG, and Z = rMGvsbMG. Visualization was performed using ggplot2.
Single‐cell RNA sequencing
C57BL/6J female mice devoid of the RD8 mutation were purchased by Charles River and analyzed at the age of 8 weeks. After perfusion with PBS and careful dissection of retina, ciliary body, and cornea under a binocular, viable CD45+CD3−CD19−Ly6G− cells from each compartment (retina, ciliary body and cornea) were pooled from five individual mice prior to flow cytometry‐based purification into 384‐well plates (Bio‐Rad, Munich, Germany) (see “flow cytometry” above) in two independent experiments. The data from these mice were used as control for the CNV experiments. For CNV experiments, C57BL/6J female mice underwent laser‐induced choroidal neovascularization (see above). At CNV d3 and d7, lesioned central retina from ten eyes out of seven (d3) or eight (d7) mice was cut out, processed for flow cytometry, and pooled per condition prior to purify viable CD45+CD3−CD19−Ly6G− cells into 384‐well plates. Five non‐lesioned C57BL/6J mice served as controls. The used antibodies were CD45‐BV421 (30F‐11, cat# 103134), CD3‐PE‐Cy7 (17A2, cat# 100220), and CD19‐PE‐Cy7 (6D5, cat# 115519) from BioLegend and Ly6G‐PE‐Cy7 (1A8, cat# 560601, BD Biosciences). Before and after sorting, the 384‐well plate were centrifuged for 2 min at 845 g 4°C. Subsequently, sorted plates were snap‐frozen in liquid nitrogen and stored at −80°C until RNA extraction. Single‐cell RNA sequencing was performed using CEL‐Seq2 method (Hashimshony et al, 2016) with several modifications as previously described (Herman et al, 2018). A fivefold volume reduction was achieved using a nanoliter‐scale pipetting robot (Mosquito HTS, TTP Labtech). 160 nl of reverse transcription reaction mix and 2.2 μl of second strand reaction mix was used to convert RNA into cDNA. cDNA were pooled before cleanup and in vitro transcription, generating two libraries from one 384‐well plate containing the barcodes 1–192. For cleanup, AMPure/RNAClean XP beads (Beckman Coulter) were used at a beads‐to‐sample ratio of 0.8:1. Other steps were performed as described in the original protocol. 18 libraries (1,536 single cells) were sequenced per lane (pair‐end multiplexing run, 100 bp read length) of an Illumina HiSeq 3000 sequencing system at a depth of ~ 130,000–200,000 reads per cell. Paired‐end reads were aligned to the transcriptome using bwa (version 0.6.2‐r126) with default parameters Li & Durbin, 2010). The transcriptome contained all RefSeq gene models based on the mouse ENCODE VM9 release downloaded from the UCSC genome browser comprising 57,207 isoforms with 57,114 isoforms mapping to fully annotated chromosomes (1–19, X, Y, M). All isoforms of the same gene were merged to a single gene locus and gene loci that overlap of > 75% were merged to gene groups resulting in 34,111 gene groups. The 50 bp of the right mate of each read pair were mapped to the ensemble of all genes and to 92 ERCC spike‐ins in sense direction (Baker et al, 2005). Only uniquely mapped reads were retained. The left read contained the barcode information: the first six bases corresponded to the unique molecular identifier (UMI) followed by six bases representing the cell‐specific barcode. The remainder of the left read contained a polyT stretch. The left read was omitted from quantification. For each cell barcode, the number of UMIs per transcript was counted and aggregated across all transcripts derived from the same gene locus. Based on the binomial distribution, the number of observed UMIs was converted into transcript counts (Grün et al, 2014). The number of quantified genes was 21,129 for laser‐induced choroidal neovascularization and 21,427 genes for the comparison between macrophage populations. Identification and visualization of different subpopulations as well as differential gene expression analysis was performed with the RaceID3 algorithm version 0.1.5 (Herman et al, 2018). All samples were processed on the same day. Mitochondrial genes were excluded prior to analysis. Down‐scaling to 1,000 transcripts was used for data normalization, and cells with < 1,500 transcripts were discarded. Furthermore, cells expressing > 2% of Kcnq1ot1, a potential marker for low‐quality cells (Grün et al, 2016), were excluded from analysis. RaceID3 analysis was performed with the following parameters: mintotal = 1,000, minexpr = 5, outminc = 5, FSelect = TRUE, and probthr = 10−8. Differentially expressed genes were identified similar to the DESeq2 algorithm (Anders & Huber, 2010).
Clusterwise enrichment analysis of cells from the respective anatomical locations or treatments was conducted using hypergeometric testing. Here, the number of cells per cluster per condition and the total number of cells per condition were taken into account. Statistical testing was achieved using the phyper function in R for the probability to assess the probability that n or more cells from a given condition are found per cluster by chance.
Trajectory analysis to assess stepwise changes of cell states was performed using Monocle version 2.99.319. Default parameters were applied besides the following adjustments: genes expressed in n ≥ 3 cells with a mean expression of ≥ 0.5; in the newCellDataSet function − lowerDetectionLimit = 0.5; in the detectGenes function − min_expr = 0.5; in the reduceDimensions function − max_components = 2, num_dim = 6, reduction_method=”tSNE”; in the clusterCells function − num_clusters = 11; for the plot_pseudotime_heatmap function differentially expressed genes at a significance level of Pval ≤ 0.01 were included.
Confirmatory trajectory analysis was performed using the StemID2 algorithm version 17. Clusters with n ≥ 5 cells were included. A threshold of Pthr = 0.01 was applied. Trajectories were analyzed as suggested by the plotgraph function with a threshold of scthr = 0.01. For the control‐to‐day7, trajectory clusters 5‐>4‐>3‐>11‐>14 were considered and for the control‐to‐day3 trajectory clusters 5‐>4‐>3‐>6. For pseudotemporal ordering, default parameters were used (Trapnell et al, 2014). Heatmaps were visualized using the pheatmap R package version 1.0.12.
Human tissue
Whole human eyes (ciliary body melanoma) or eye tissue (CNV membrane) were taken with consent with the patients during surgery at the Eye Clinic, University Medical Center Freiburg. MACE RNA Sequencing was performed on four FFPE CNV membranes that were extracted from patients with neovascular Four age‐matched FFPE RPE‐choroidal specimens were obtained from the macular region of enucleated eyes suffering from ciliary body melanoma served as controls. The macular RPE and choroid was unaffected in these eyes as confirmed by routine histology. FFPE tissue was sliced with 7 µm thickness and placed on glass slides. For immunohistochemistry, deparaffinization was performed (15 min xylol followed by descending ethanol concentration, 2× for 1 min for each concentration (100, 96, 70%)) and finally aqua dest at room temperature. Next, citrate buffer (pH = 6) was applied for 40 min at 95°C. The following steps were performed in an Autostainer (Agilent Dako, Santa Clara, CA, USA) with the Dako REAL™ EnVision™ Detection System Kit (K406511‐2, Agilent Dako). Peroxidase blocking reagent (5 min) was rinsed with Tris buffer (0.5 M TRIS, 9% NaCl, 0.5% Tween 20). Primary antibodies (Anti‐HLA‐DP, DQ, DR, M0775, clone CR3/43, 1:400, Agilent Dako, Santa Clara, CA, USA) were incubated for 30 min, washed with Tris, treated with secondary antibody for 20 min, and finally visualized by diaminobenzidin according to the manufacturer’s instructions for 5–10 min. After rinsing with aqua dest, nuclei were counterstained with hematoxylin–eosin for 15 s. After washing with water, the deparaffination protocol was conducted in reverse order before embedding in Vitro‐Clud® (R. Langenbrinck GmbH, Emmendingen, Germany).
RNA sequencing using massive analysis of cDNA ends (MACE)
Total RNA was isolated from formalin‐fixed and paraffin‐embedded (FFPE) sections of all specimens using the Quick‐RNA FFPE Kit (Zymo Research, USA). Following a DNAse I digestion using the Baseline‐ZERO kit (Epicentre, USA), the RNA concentration was measured with the Qubit RNA HS Assay Kit on a Qubit Fluorometer (Life Technologies, USA). The RNA quality was determined with the RNA Pico Sensitivity Assay on a LabChip GXII Touch (PerkinElmer, USA). The fragment size of all RNA samples ranged between 120 and 150 bp. The preparation of massive analysis of cDNA ends (MACE) libraries was carried out using 1 µg of total RNA, as previously described (Zajac et al, 2015). The barcoded libraries (four CNV membranes and four control samples) were sequenced simultaneously on the NextSeq 500 (Illumina, USA) with 1 × 75 bp. Illumina sequence reads and were processed with an in‐house analysis pipeline (GeneXPro, Germany), including TrueQuant PCR bias elimination and mapping against the human reference genome. For MACE analysis, normalization and test for differential gene expression were calculated using the DEGseq (Wang et al, 2010). Differential gene expression was quantified as the log2 ratio of the normalized values between the two libraries (CNV vs. control). The sequencing data reported in the current article have been deposited in the Gene Expression Omnibus database under the accession number GSE146887 (Schlecht et al, 2020).
Statistical analysis
Statistical analysis was performed using GraphPad Prism (GraphPad Software, version 6.0, La Jolla, USA). Data were tested for normality applying the Kolmogorov–Smirnov test. If normality was given, an unpaired t‐test was applied or one‐way ANOVA, if not indicated otherwise. If the data did not meet the criteria of normality, the Mann–Whitney or Kruskal–Wallis test was applied. Differences were considered significant when P‐value < 0.05.
Author contributions
Experiments and data analysis: PW, NH, RS, AS, LA, JK, AH, PZ, SB, TM; CNV‐related turnover analysis: MG; Scientific input: TG, IH, FMVR; Embryonic pulse labeling experiments: NH, TM; Bulk RNA‐Seq data analysis: OS; BM chimera data: CB, JP; scRNA‐seq data analysis: RS; Project supervision and manuscript writing: PW, CL, MP.
Conflict of interest
The authors declare that they have no conflict of interest.
Supporting information
Expanded View Figures PDF
Review Process File
Acknowledgements
The authors thank Marc Leinweber, Gabriele Prinz, Maria Oberle, Johannes Baumann, Katrin Seidel, Eileen Barleon, Constance Hobusch, Angela Ehrlich, Heidrun Kuhrt, and Sylvia Zeitler for excellent technical assistance, M. Follo and team at lighthouse fluorescence technologies core Facility, University Medical Center, Freiburg for cell sorting, CEMT at University of Freiburg for excellent animal care, KFB, Center of Excellence for Fluorescent Bioanalytics, Regensburg for bulk RNA‐seq analysis, Jonas Neher, Tübingen (Ccr2‐RFP), Frédéric Geissmann, New York for providing Flt3 Cre :Rosa26‐YFP mice. Special thanks to Sagar and Dominic Grün, MPI‐IE, Freiburg, for providing excellent support for scRNA‐seq. M.P. is supported by the Sobek Foundation, the Ernst‐Jung Foundation, the German Research Foundation (SFB 992, SFB1160, Reinhart‐Koselleck‐Grant, Gottfried Wilhelm Leibniz Prize) and the Ministry of Science, Research and Arts, Baden‐Wuerttemberg (Sonderlinie “Neuroinflammation”). His research is supported by the German Research Foundation (DFG) under Germany's Excellence Strategy (CIBSS—EXC‐2189—Project ID 390939984). J.P. received additional funding from the Berlin Institute of Health (CRG2aSP6), DFG (SFB/TRR265), and the UK DRI (Momentum Award). CL, MP, JP, CB and IH are supported by the SFB/TRR167. Open Access funding enabled and organized by ProjektDEAL.
The EMBO Journal (2021) 40: e105123.
Contributor Information
Peter Wieghofer, Email: peter.wieghofer@medizin.uni-leipzig.de.
Clemens Lange, Email: clemens.lange@uniklinik-freiburg.de.
Marco Prinz, Email: marco.prinz@uniklinik-freiburg.de.
Data availability
The sequencing data reported in the current article have been deposited in the Gene Expression Omnibus database under the accession numbers GSE160845 (mouse bulk RNA‐seq; https://www.ncbi.nlm.nih.gov/geo/query/acc.cgi?acc=GSE160845) and GSE160797 (mouse single‐cell RNA‐seq; https://www.ncbi.nlm.nih.gov/geo/query/acc.cgi?acc=GSE160797).
References
- Ajami B, Bennett JL, Krieger C, Tetzlaff W, Rossi FMV (2007) Local self‐renewal can sustain CNS microglia maintenance and function throughout adult life. Nat Neurosci 10: 1538–1543 [DOI] [PubMed] [Google Scholar]
- Ajami B, Bennett JL, Krieger C, McNagny KM, Rossi FMV (2011) Infiltrating monocytes trigger EAE progression, but do not contribute to the resident microglia pool. Nat Neurosci 14: 1142–1149 [DOI] [PubMed] [Google Scholar]
- Ajami B, Samusik N, Wieghofer P, Ho PP, Crotti A, Bjornson Z, Prinz M, Fantl WJ, Nolan GP, Steinman L (2018) Single‐cell mass cytometry reveals distinct populations of brain myeloid cells in mouse neuroinflammation and neurodegeneration models. Nat Neurosci 21: 541–551 [DOI] [PMC free article] [PubMed] [Google Scholar]
- Anders S, Huber W (2010) Differential expression analysis for sequence count data. Genome Biol 11: R106 [DOI] [PMC free article] [PubMed] [Google Scholar]
- Andrews S (2010) FastQC: a quality control tool for high throughput sequence data. Available online at: http://www.bioinformatics.babraham.ac.uk/projects/fastqc
- Baker SC, Bauer SR, Beyer RP, Brenton JD, Bromley B, Burrill J, Causton H, Conley MP, Elespuru R, Fero M et al (2005) The External RNA Controls Consortium: a progress report. Nat. Methods 2: 731–734 [DOI] [PubMed] [Google Scholar]
- Bechmann I (2005) Failed central nervous system regeneration: a downside of immune privilege? Neuromolecular Med 7: 217–228 [DOI] [PubMed] [Google Scholar]
- Benz C, Martins VC, Radtke F, Bleul CC (2008) The stream of precursors that colonizes the thymus proceeds selectively through the early T lineage precursor stage of T cell development. J Exp Med 205: 1187–1199 [DOI] [PMC free article] [PubMed] [Google Scholar]
- Boeck M, Thien A, Wolf J, Hagemeyer N, Laich Y, Yusuf D, Backofen R, Zhang P, Boneva S, Stahl A et al (2020) Temporospatial distribution and transcriptional profile of retinal microglia in the oxygen‐induced retinopathy mouse model. Glia 68: 1859–1873 [DOI] [PubMed] [Google Scholar]
- Boettcher C, Ulbricht E, Helmlinger D, Mack AF, Reichenbach A, Wiedemann P, Wagner H‐J, Seeliger MW, Bringmann A, Priller J (2008) Long‐term engraftment of systemically transplanted, gene‐modified bone marrow‐derived cells in the adult mouse retina. Br J Ophthalmol 92: 272–275 [DOI] [PubMed] [Google Scholar]
- Boneva S, Schlecht A, Böhringer D, Mittelviefhaus H, Reinhard T, Agostini H, Auw‐Haedrich C, Schlunck G, Wolf J, Lange C (2020) 3’ MACE RNA‐sequencing allows for transcriptome profiling in human tissue samples after long‐term storage. Lab Invest 100: 1345–1355 [DOI] [PMC free article] [PubMed] [Google Scholar]
- Boyer SW, Schroeder AV, Smith‐Berdan S, Forsberg EC (2011) All hematopoietic cells develop from hematopoietic stem cells through Flk2/Flt3‐positive progenitor cells. Cell Stem Cell 9: 64–73 [DOI] [PMC free article] [PubMed] [Google Scholar]
- Butovsky O, Jedrychowski MP, Moore CS, Cialic R, Lanser AJ, Gabriely G, Koeglsperger T, Dake B, Wu PM, Doykan CE et al (2014) Identification of a unique TGF‐β‐dependent molecular and functional signature in microglia. Nat Neurosci 17: 131–143 [DOI] [PMC free article] [PubMed] [Google Scholar]
- Chappell-Maor L, Kolesnikov M, Kim J-S, Shemer A, Haimon Z, Grozovski J, Boura-Halfon S, Masuda T, Prinz M, Jung S (2020) Comparative analysis of CreER transgenic mice for the study of brain macrophages: a case study. Eur J Immunol 50: 353–362 [DOI] [PubMed] [Google Scholar]
- Chinnery HR, Humphries T, Clare A, Dixon AE, Howes K, Moran CB, Scott D, Zakrzewski M, Pearlman E, McMenamin PG (2008) Turnover of bone marrow‐derived cells in the irradiated mouse cornea. Immunology 125: 541–548 [DOI] [PMC free article] [PubMed] [Google Scholar]
- Dando SJ, Naranjo Golborne C, Chinnery HR, Ruitenberg MJ, McMenamin PG (2016) A case of mistaken identity: CD11c‐eYFP(+) cells in the normal mouse brain parenchyma and neural retina display the phenotype of microglia, not dendritic cells. Glia 64: 1331–1349 [DOI] [PubMed] [Google Scholar]
- Dobin A, Davis CA, Schlesinger F, Drenkow J, Zaleski C, Jha S, Batut P, Chaisson M, Gingeras TR (2013) STAR: ultrafast universal RNA‐seq aligner. Bioinformatics 29: 15–21 [DOI] [PMC free article] [PubMed] [Google Scholar]
- Ensan S, Li A, Besla R, Degousee N, Cosme J, Roufaiel M, Shikatani EA, El‐Maklizi M, Williams JW, Robins L et al (2016) Self‐renewing resident arterial macrophages arise from embryonic CX3CR1(+) precursors and circulating monocytes immediately after birth. Nat Immunol 17: 159–168 [DOI] [PubMed] [Google Scholar]
- Gautier EL, Shay T, Miller J, Greter M, Jakubzick C, Ivanov S, Helft J, Chow A, Elpek KG, Gordonov S et al (2012) Gene‐expression profiles and transcriptional regulatory pathways that underlie the identity and diversity of mouse tissue macrophages. Nat Immunol 13: 1118–1128 [DOI] [PMC free article] [PubMed] [Google Scholar]
- Ginhoux F, Greter M, Leboeuf M, Nandi S, See P, Gokhan S, Mehler MF, Conway SJ, Ng LG, Stanley ER et al (2010) Fate mapping analysis reveals that adult microglia derive from primitive macrophages. Science 330: 841–845 [DOI] [PMC free article] [PubMed] [Google Scholar]
- Gloor BP (1969) Phagocytotic activity of the pigment epithelium after photocaogulation. (On the question of the origin of macrophages in the retina). Albrecht Von Graefes Arch Klin Exp Ophthalmol 179: 105–117 [DOI] [PubMed] [Google Scholar]
- Goldmann T, Wieghofer P, Muller PF, Wolf Y, Varol D, Yona S, Brendecke SM, Kierdorf K, Staszewski O, Datta M et al (2013) A new type of microglia gene targeting shows TAK1 to be pivotal in CNS autoimmune inflammation. Nat Neurosci 16: 1618–1626 [DOI] [PubMed] [Google Scholar]
- Goldmann T, Wieghofer P, Jordão MJC, Prutek F, Hagemeyer N, Frenzel K, Amann L, Staszewski O, Kierdorf K, Krueger M et al (2016) Origin, fate and dynamics of macrophages at central nervous system interfaces. Nat Immunol 17: 797–805 [DOI] [PMC free article] [PubMed] [Google Scholar]
- Grün D, Kester L, van Oudenaarden A (2014) Validation of noise models for single‐cell transcriptomics. Nat. Methods 11: 637–640 [DOI] [PubMed] [Google Scholar]
- Grün D, Muraro MJ, Boisset JC, Wiebrands K, Lyubimova A, Dharmadhikari G, van den Born M, van Es J, Jansen E, Clevers H et al (2016) De novo prediction of stem cell identity using single‐cell transcriptome data. Cell Stem Cell 19: 266–277 [DOI] [PMC free article] [PubMed] [Google Scholar]
- Hagemeyer N, Kierdorf K, Frenzel K, Xue J, Ringelhan M, Abdullah Z, Godin I, Wieghofer P, Costa Jordão MJ, Ulas T et al (2016) Transcriptome‐based profiling of yolk sac‐derived macrophages reveals a role for Irf8 in macrophage maturation. EMBO J 35: 1730–1744 [DOI] [PMC free article] [PubMed] [Google Scholar]
- Hamrah P, Huq SO, Liu Y, Zhang Q, Dana MR (2003) Corneal immunity is mediated by heterogeneous population of antigen‐presenting cells. J Leukoc Biol 74: 172–178 [DOI] [PubMed] [Google Scholar]
- Hashimshony T, Senderovich N, Avital G, Klochendler A, de Leeuw Y, Anavy L, Gennert D, Li S, Livak KJ, Rozenblatt‐Rosen O et al (2016) CEL‐Seq2: sensitive highly‐multiplexed single‐cell RNA‐Seq. Genome Biol 17: 77 [DOI] [PMC free article] [PubMed] [Google Scholar]
- Herman JS, Sagar , Grün D (2018) FateID infers cell fate bias in multipotent progenitors from single‐cell RNA‐seq data. Nat Methods 15: 379–386 [DOI] [PubMed] [Google Scholar]
- Huang Y, Xu Z, Xiong S, Qin G, Sun F, Yang J, Yuan T‐F, Zhao L, Wang K, Liang Y‐X et al (2018) Dual extra‐retinal origins of microglia in the model of retinal microglia repopulation. Cell Discov 4: 9 [DOI] [PMC free article] [PubMed] [Google Scholar]
- Hume DA, Perry VH, Gordon S (1983) Immunohistochemical localization of a macrophage‐specific antigen in developing mouse retina: phagocytosis of dying neurons and differentiation of microglial cells to form a regular array in the plexiform layers. J Cell Biol 97: 253–257 [DOI] [PMC free article] [PubMed] [Google Scholar]
- Jordão MJC, Sankowski R, Brendecke SM, Sagar LG, Tai Y‐H, Tay TL, Schramm E, Armbruster S, Hagemeyer N et al (2019) Single‐cell profiling identifies myeloid cell subsets with distinct fates during neuroinflammation. Science 363: eaat7554 [DOI] [PubMed] [Google Scholar]
- Jung S, Aliberti J, Graemmel P, Sunshine MJ, Kreutzberg GW, Sher A, Littman DR (2000) Analysis of fractalkine receptor CX(3)CR1 function by targeted deletion and green fluorescent protein reporter gene insertion. Mol Cell Biol 20: 4106–4114 [DOI] [PMC free article] [PubMed] [Google Scholar]
- Kaur C, Foulds WS, Ling EA (2008) Blood‐retinal barrier in hypoxic ischaemic conditions: basic concepts, clinical features and management. Prog Retin Eye Res 27: 622–647 [DOI] [PubMed] [Google Scholar]
- Kezic J, Xu H, Chinnery HR, Murphy CC, McMenamin PG (2008) Retinal microglia and uveal tract dendritic cells and macrophages are not CX3CR1 dependent in their recruitment and distribution in the young mouse eye. Invest Ophthalmol Vis Sci 49: 1599–1608 [DOI] [PubMed] [Google Scholar]
- Kierdorf K, Erny D, Goldmann T, Sander V, Schulz C, Perdiguero EG, Wieghofer P, Heinrich A, Riemke P, Hölscher C et al (2013a) Microglia emerge from erythromyeloid precursors via Pu.1‐ and Irf8‐dependent pathways. Nat Neurosci 16: 273–280 [DOI] [PubMed] [Google Scholar]
- Kierdorf K, Katzmarski N, Haas CA, Prinz M (2013b) Bone marrow cell recruitment to the brain in the absence of irradiation or parabiosis bias. PLoS One 8: e58544 [DOI] [PMC free article] [PubMed] [Google Scholar]
- Kierdorf K, Masuda T, Jordão MJC, Prinz M (2019) Macrophages at CNS interfaces: ontogeny and function in health and disease. Nat Rev Neurosci 9: 547–562 [DOI] [PubMed] [Google Scholar]
- van de Laar L, Saelens W, De Prijck S, Martens L, Scott CL, Van Isterdael G, Hoffmann E, Beyaert R, Saeys Y, Lambrecht BN et al (2016) Yolk Sac macrophages, fetal liver, and adult monocytes can colonize an empty niche and develop into functional tissue‐resident macrophages. Immunity 44: 755–768 [DOI] [PubMed] [Google Scholar]
- Law CW, Chen Y, Shi W, Smyth GK (2014) voom: Precision weights unlock linear model analysis tools for RNA‐seq read counts. Genome Biol 15: R29 [DOI] [PMC free article] [PubMed] [Google Scholar]
- Li H, Durbin R (2010) Fast and accurate long‐read alignment with Burrows‐Wheeler transform. Bioinformatics 26: 589–595 [DOI] [PMC free article] [PubMed] [Google Scholar]
- Liao Y, Smyth GK, Shi W (2014) featureCounts: an efficient general purpose program for assigning sequence reads to genomic features. Bioinformatics 30: 923–930 [DOI] [PubMed] [Google Scholar]
- Liu J, Xue Y, Dong D, Xiao C, Lin C, Wang H, Song F, Fu T, Wang Z, Chen J et al (2017) CCR2‐ and CCR2+ corneal macrophages exhibit distinct characteristics and balance inflammatory responses after epithelial abrasion. Mucosal Immunol 10: 1145–1159 [DOI] [PMC free article] [PubMed] [Google Scholar]
- Ma W, Zhang Y, Gao C, Fariss RN, Tam J, Wong WT (2017) Monocyte infiltration and proliferation reestablish myeloid cell homeostasis in the mouse retina following retinal pigment epithelial cell injury. Sci Rep 7: 8433 [DOI] [PMC free article] [PubMed] [Google Scholar]
- Ma W, Silverman SM, Zhao L, Villasmil R, Campos MM, Amaral J, Wong WT (2019) Absence of TGFβ signaling in retinal microglia induces retinal degeneration and exacerbates choroidal neovascularization. Elife 8: e42049 [DOI] [PMC free article] [PubMed] [Google Scholar]
- Masuda T, Sankowski R, Staszewski O, Böttcher C, Amann L, Sagar , Scheiwe C, Nessler S, Kunz P, van Loo G et al (2019) Spatial and temporal heterogeneity of mouse and human microglia at single‐cell resolution. Nature 566: 388–392 [DOI] [PubMed] [Google Scholar]
- Masuda T, Amann L, Sankowski R, Staszewski O, Lenz M, D Errico P, Snaidero N, Costa Jordão MJ, Böttcher C, Kierdorf K et al (2020) Novel Hexb‐based tools for studying microglia in the CNS. Nat Immunol 21: 802–815 [DOI] [PubMed] [Google Scholar]
- Mildner A, Schmidt H, Nitsche M, Merkler D, Hanisch U‐K, Mack M, Heikenwalder M, Brück W, Priller J, Prinz M (2007) Microglia in the adult brain arise from Ly‐6ChiCCR2+ monocytes only under defined host conditions. Nat Neurosci 10: 1544–1553 [DOI] [PubMed] [Google Scholar]
- Molawi K, Wolf Y, Kandalla PK, Favret J, Hagemeyer N, Frenzel K, Pinto AR, Klapproth K, Henri S, Malissen B et al (2014) Progressive replacement of embryo‐derived cardiac macrophages with age. J Exp Med 211: 2151–2158 [DOI] [PMC free article] [PubMed] [Google Scholar]
- Mudge JM, Harrow J (2015) Creating reference gene annotation for the mouse C57BL6/J genome assembly. Mamm Genome 26: 366–378 [DOI] [PMC free article] [PubMed] [Google Scholar]
- O’Koren EG, Yu C, Klingeborn M, Wong AYW, Prigge CL, Mathew R, Kalnitsky J, Msallam RA, Silvin A, Kay JN et al (2019) Microglial function is distinct in different anatomical locations during retinal homeostasis and degeneration. Immunity 50: 723–737.e7 [DOI] [PMC free article] [PubMed] [Google Scholar]
- Oh H, Takagi H, Takagi C, Suzuma K, Otani A, Ishida K, Matsumura M, Ogura Y, Honda Y (1999) The potential angiogenic role of macrophages in the formation of choroidal neovascular membranes. Invest Ophthalmol Vis Sci 40: 1891–1898 [PubMed] [Google Scholar]
- Perdiguero EG, Klapproth K, Schulz C, Busch K, Azzoni E, Crozet L, Garner H, Trouillet C, de Bruijn MF, Geissmann F et al (2014) Tissue‐resident macrophages originate from yolk‐sac‐derived erythro‐myeloid progenitors. Nature 518: 547–551 [DOI] [PMC free article] [PubMed] [Google Scholar]
- Pitulescu ME, Schmidt I, Benedito R, Adams RH (2010) Inducible gene targeting in the neonatal vasculature and analysis of retinal angiogenesis in mice. Nat Protoc 5: 1518–1534 [DOI] [PubMed] [Google Scholar]
- Prinz M, Jung S, Priller J (2019) Microglia biology: one century of evolving concepts. Cell 179: 292–311 [DOI] [PubMed] [Google Scholar]
- Saederup N, Cardona AE, Croft K, Mizutani M, Cotleur AC, Tsou C‐L, Ransohoff RM, Charo IF (2010) Selective chemokine receptor usage by central nervous system myeloid cells in CCR2‐red fluorescent protein knock‐in mice. PLoS One 5: e13693 [DOI] [PMC free article] [PubMed] [Google Scholar]
- Sankowski R, Böttcher C, Masuda T, Geirsdottir L, Sagar , Sindram E, Seredenina T, Muhs A, Scheiwe C, Shah MJ et al (2019) Mapping microglia states in the human brain through the integration of high‐dimensional techniques. Nat Neurosci 22: 2098–2110 [DOI] [PubMed] [Google Scholar]
- Santos AM, Calvente R, Tassi M, Carrasco M‐C, Martín‐Oliva D, Marín‐Teva JL, Navascués J, Cuadros MA (2008) Embryonic and postnatal development of microglial cells in the mouse retina. J Comp Neurol 506: 224–239 [DOI] [PubMed] [Google Scholar]
- Schlecht A, Boneva S, Gruber M, Zhang P, Horres R, Bucher F, Auw‐Haedrich C, Hansen L, Stahl A, Hilgendorf I et al (2020) Transcriptomic characterization of human choroidal neovascular membranes identifies calprotectin as a novel biomarker for patients with age‐related macular degeneration. Am J Path 190: 1632–1642 [DOI] [PubMed] [Google Scholar]
- Schulz C, Gomez Perdiguero E, Chorro L, Szabo‐Rogers H, Cagnard N, Kierdorf K, Prinz M, Wu B, Jacobsen SEW, Pollard JW et al (2012) A lineage of myeloid cells independent of Myb and hematopoietic stem cells. Science 336: 86–90 [DOI] [PubMed] [Google Scholar]
- Shechter R, London A, Schwartz M (2013) Orchestrated leukocyte recruitment to immune‐privileged sites: absolute barriers versus educational gates. Nat Rev Immunol 13: 206–218 [DOI] [PubMed] [Google Scholar]
- Streilein JW (2003) Ocular immune privilege: therapeutic opportunities from an experiment of nature. Nat Rev Immunol 3: 879–889 [DOI] [PubMed] [Google Scholar]
- Tay TL, Mai D, Dautzenberg J, Fernández‐Klett F, Lin G, Sagar , Datta M, Drougard A, Stempfl T, Ardura‐Fabregat A et al (2017) A new fate mapping system reveals context‐dependent random or clonal expansion of microglia. Nat Neurosci 20: 793–803 [DOI] [PubMed] [Google Scholar]
- Tobe T, Ortega S, Luna JD, Ozaki H, Okamoto N, Derevjanik NL, Vinores SA, Basilico C, Campochiaro PA (1998) Targeted disruption of the FGF2 gene does not prevent choroidal neovascularization in a murine model. Am. J. Pathol. 153: 1641–1646 [DOI] [PMC free article] [PubMed] [Google Scholar]
- Trapnell C, Cacchiarelli D, Grimsby J, Pokharel P, Li S, Morse M, Lennon NJ, Livak KJ, Mikkelsen TS, Rinn JL (2014) Pseudo‐temporal ordering of individual cells reveals dynamics and regulators of cell fate decisions. Nat Biotechnol 32: 381–386 [DOI] [PMC free article] [PubMed] [Google Scholar]
- Varol C, Mildner A, Jung S (2015) Macrophages: development and tissue specialization. Annu Rev Immunol 33: 643–675 [DOI] [PubMed] [Google Scholar]
- Wang L, Feng Z, Wang X, Wang X, Zhang X (2010) DEGseq: an R package for identifying differentially expressed genes from RNA‐seq data. Bioinformatics 26: 136–138 [DOI] [PubMed] [Google Scholar]
- Wang X, Zhao L, Zhang J, Fariss RN, Ma W, Kretschmer F, Wang M, Qian HH, Badea TC, Diamond JS et al (2016) Requirement for microglia for the maintenance of synaptic function and integrity in the mature retina. J Neurosci 36: 2827–2842 [DOI] [PMC free article] [PubMed] [Google Scholar]
- Warnes GR, Bolker B, Bonebakker L, Gentleman R, Huber W, Liaw A, Lumley T, Maechler M, Magnusson A, Moeller S et al (2016) Various R Programming Tools for Plotting Data. R package version 3.0.1. Available online at: https://CRAN.R‐project.org/package=gplots
- Wieghofer P, Knobeloch K‐P, Prinz M (2015) Genetic targeting of microglia. Glia 63: 1–22 [DOI] [PubMed] [Google Scholar]
- Wieghofer P, Prinz M (2015) Genetic manipulation of microglia during brain development and disease. Biochim Biophys Acta 1862: 299–309 [DOI] [PubMed] [Google Scholar]
- Winget S (2011) FastQ Screen allows you to screen a library of sequences in FastQ format against a set of sequence databases so you can see if the composition of the library matches with what you expect. Available online at: https://www.bioinformatics.babraham.ac.uk/projects/fastq_screen/
- Xu H, Chen M, Mayer EJ, Forrester JV, Dick AD (2007) Turnover of resident retinal microglia in the normal adult mouse. Glia 55: 1189–1198 [DOI] [PubMed] [Google Scholar]
- Yona S, Kim K‐W, Wolf Y, Mildner A, Varol D, Breker M, Strauss‐Ayali D, Viukov S, Guilliams M, Misharin A et al (2013) Fate mapping reveals origins and dynamics of monocytes and tissue macrophages under homeostasis. Immunity 38: 79–91 [DOI] [PMC free article] [PubMed] [Google Scholar]
- Zajac BK, Amendt J, Horres R, Verhoff MA, Zehner R (2015) De novo transcriptome analysis and highly sensitive digital gene expression profiling of Calliphora vicina (Diptera: Calliphoridae) pupae using MACE (Massive Analysis of cDNA Ends). Forensic Sci Int Genet 15: 137–146 [DOI] [PubMed] [Google Scholar]
Associated Data
This section collects any data citations, data availability statements, or supplementary materials included in this article.
Supplementary Materials
Expanded View Figures PDF
Review Process File
Data Availability Statement
The sequencing data reported in the current article have been deposited in the Gene Expression Omnibus database under the accession numbers GSE160845 (mouse bulk RNA‐seq; https://www.ncbi.nlm.nih.gov/geo/query/acc.cgi?acc=GSE160845) and GSE160797 (mouse single‐cell RNA‐seq; https://www.ncbi.nlm.nih.gov/geo/query/acc.cgi?acc=GSE160797).