

Abstract
Primates and rodents, which descended from a common ancestor around 90 million years ago1, exhibit profound differences in behaviour and cognitive capacity; the cellular basis for these differences is unknown. Here we use single-nucleus RNA sequencing to profile RNA expression in 188,776 individual interneurons across homologous brain regions from three primates (human, macaque and marmoset), a rodent (mouse) and a weasel (ferret). Homologous interneuron types–which were readily identified by their RNA-expression patterns–varied in abundance and RNA expression among ferrets, mice and primates, but varied less among primates. Only a modest fraction of the genes identified as ‘markers’ of specific interneuron subtypes in any one species had this property in another species. In the primate neocortex, dozens of genes showed spatial expression gradients among interneurons of the same type, which suggests that regional variation in cortical contexts shapes the RNA expression patterns of adult neocortical interneurons. We found that an interneuron type that was previously associated with the mouse hippocampus–the ‘ivy cell’, which has neurogliaform characteristics–has become abundant across the neocortex of humans, macaques and marmosets but not mice or ferrets. We also found a notable subcortical innovation: an abundant striatal interneuron type in primates that had no molecularly homologous counterpart in mice or ferrets. These interneurons expressed a unique combination of genes that encode transcription factors, receptors and neuropeptides and constituted around 30% of striatal interneurons in marmosets and humans.
Vertebrate brains contain many specialized brain structures, each with its own evolutionary history. For example, the six-layer neocortex arose in mammals about 200 million years ago2, whereas distinct basal ganglia were already present in the last common ancestor of vertebrates more than 500 million years ago3.
Brain evolution may often be driven by adaptive changes in cellular composition or molecular expression within conserved structures4–6. Examples of modifications to specific cell types within larger conserved brain systems include hindbrain circuits that control species-specific courtship calls in frogs7, the evolution of trichromatic vision in primates8, and neurons that have converted from motor to sensory processing to produce a new swimming behaviour in sand crabs4. Evolution can modify brain structures through diverse means, such as by increasing or reducing the production or survival of cells of a given type, altering the molecular and cellular properties of shared cell types, reallocating or redeploying cell types to new locations, losing a cell type9 or inventing a new cell type (Fig. 1a).
Fig. 1 |. Analysis of cortical interneurons in ferret, mouse, marmoset, macaque and human.

a, Schematic showing possible changes In cellular assemblies across species. b, Experimental workflow, numbers of interneurons sampled in each species, and uniform manifold approximation and projection (UMAP) embedding of datasets. Ctx, neocortex; Hipp, hippocampus; Str, striatum. c, Cortical interneurons in each species. Cells are coloured according to one of four major neocortical types: SSl+, PVALB+, VIP+ or LAMP5+ (dark brown or dark green cells indicate cells that co-express SST and PVALB or LAMP5 and VIP, respectively). n = 2,930 ferret interneurons; n = 10,177 mouse interneurons; n = 63,096 marmoset interneurons; n = 22,305 macaque interneurons; n = 56,648 human interneurons. Coloured dots are plotted over the dots of non-target species (grey). d, Percentage of MGE-derived (SSl+ or PVALB+) and non-MGE-derived (VIP+ or LAMP5+) types across two regions: frontal cortex (mouse) or PFC (other species) and V1 (all species). Error bars represent 95% binomial confidence intervals. e, Examples of genes with similar or distinct cell-type-specific expression patterns across species (Extended Data Fig. 2). Values are scaled expression levels (number of transcripts per 100,000 transcripts) for each of the four main cortical interneuron types. Note that quantitative differences across species summarized across major types could have several underlying causes: for example, selective expression within particular subtypes, versus overall lower expression within a type in a given species. f, Correlation (Pearson’s r) between scaled expression levels for NRG1 in human compared with the other species across major interneuron types. Values were calculated as in e. Dots are coloured as in c. g, Density histograms showing correlation (Pearson’s r) distribution of expressed genes between pairs of species. Red, primate–primate pairs; blue, primate–mouse pairs; yellow, ferret–non-ferret pairs).
Genome and RNA sequencing (RNA-seq) analyses have allowed molecular inventories to be compared across species10,11, and single-cell RNA-seq now enables the detailed comparison of cell types and expression patterns between homologous brain structures8,10,11. A recent study compared neocortical cells between humans and mice11.
Interneurons–which provide the main source of inhibition in neuronal circuits by releasing the inhibitory neurotransmitter GABA (γ-aminobutyric-add)–strongly shape the properties of local circuit assemblies. Interneurons are of particular interest for comparative analysis because they are morphologically and physiologically diverse within any one species, yet major classes of interneurons are shared across amniotes12. Although the main developmental origins for interneurons appear to be conserved, we do not yet know how interneurons are allocated to their destinations within the brain, to what extent local cues shape gene expression in interneurons or to what extent evolution has altered these properties.
Identifying interneurons across species
We used single-nucleus RNA-seq (using Drop-seq13 and 10X Genomics 3′ RNA-seq) to measure RNA expression in brain cell nuclei isolated from the neocortex, hippocampus and striatum of five species: ferret, mouse, common marmoset, rhesus macaque and human (Fig. 1b). We identified interneurons using canonical, conserved markers (for example, GAD1 and GAD2, which encode the glutamate decarboxylases required for the synthesis of GABA) as well as interneuron-specific molecular markers. In total, we sampled 68,739 telencephalic interneurons from marmoset, 61,236 from human, 30,629 from macaque, 22,576 from mouse and 4,730 from ferret.
Regionally specialized interneuron composition
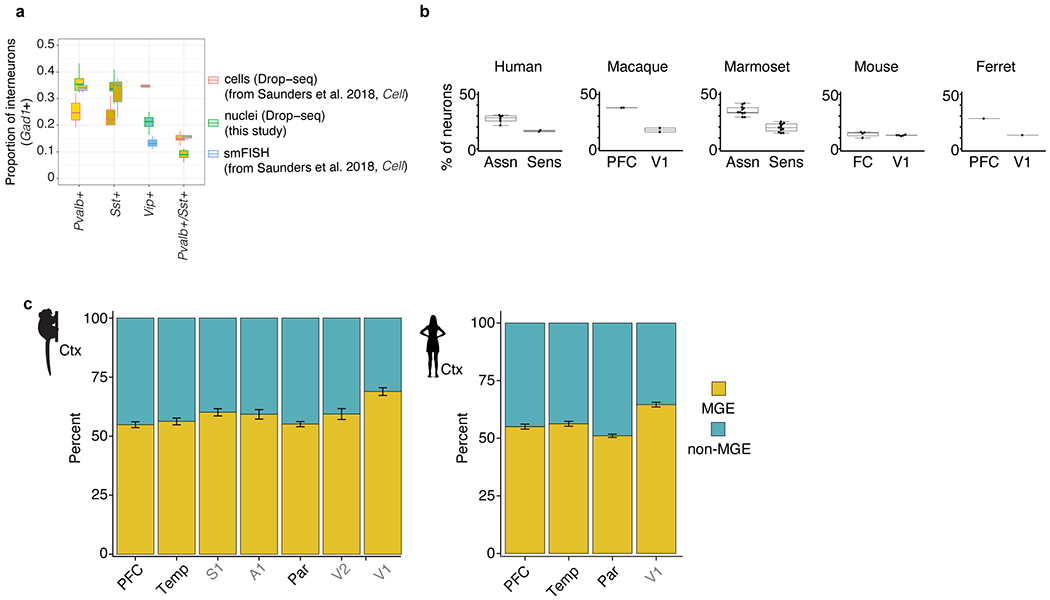
The mammalian neocortex is patterned into functionally specialized fields, called areas, that differ in cytoarchitecture, cell number and connectivity. A basic distinction separates primary sensory areas of the neocortex, which process visual, auditory and tactile information as parts of well-defined hierarchies, from association areas such as prefrontal cortex (PFC), which perform higher-order functions and exhibit widely distributed (rather than predominantly local, hierarchical) patterns of connectivity. Primates–and in particular humans–have neocortices that are disproportionately enlarged relative to those of other mammals and, proportionally, most of that expansion has occurred in the association cortices14. Neocortical expansion may have been accompanied by changes in the cellular composition of the neocortex, as suggested by recent quantitative stereological studies6. In the specific cases for which stereology data were available for comparison, we found that the relative numbers of interneuron subtypes that we measured from the single-nucleus RNA-seq experiments were similar to those measured with stereology, without the selection biases introduced by efforts to capture intact cell soma for single-cell RNA-seq15 (Extended Data Fig. 1a).
Relative numbers of excitatory and inhibitory neurons are important for normal brain function and are tightly regulated during development16. Comparative histological studies have estimated that interneurons comprise approximately 15–20% of cortical neurons in rodents but a larger proportion in primates17. In line with these observations, the neocortices of humans, macaques and marmosets had more interneurons (as a percentage of all neurons) than the mouse cortex did. Moreover, primates (but not mice) had much higher percentages of interneurons in association areas than in sensory areas (median 28.5% versus 16% in humans; 14.5% versus 12.5% in mice). Notably, although the ferret (a carnivore) is an evolutionary outlier relative to the other species, its neocortex contained primate-like proportions of excitatory and inhibitory neurons, including the strong distinction between the PFC and the primary visual cortex (V1) (Extended Data Fig. 1b). This suggests that a cell-composition distinction between these cortical areas may have been lost in an ancestor of laboratory mice.
Across ferrets, mice and primates, the same four genes (SST, PVALB, VIP and LAMP5) were expressed in non-overlapping subsets of neocortical interneurons and together accounted for almost 100% of neocortical interneurons, which suggests that the genes that encode these markers stably delineate a core repertoire of neocortical interneuron types in these species11,15,18 (Fig. 1c). Interneurons are born subcortically from progenitors that reside in transient proliferative zones–including the medial (MGE) and caudal (CGE) ganglionic eminences (the MGE gives rise to SST and PVALB cortical types; the CGE gives rise to VIP and LAMPS cortical types)–and migrate to the neocortex and to subcortical structures during development19. The mouse frontal cortex and ferret PFC contained these interneurons in proportions similar to the proportions in V1. By contrast, in primates the PFC (Fig. 1d) and other association areas (Extended Data Fig. 1c) had a significantly higher proportion (relative to V1) of interneurons from structures other than the MGE. Because MGE-derived interneurons preferentially populate deep layers20, the proportional increase in non-MGE-derived interneurons in primates is consistent with enlargement of upper-layer neocortical compartments21 and with greater recruitment of interneurons from the CGE to the association cortex in primates.
Expression programs in homologous interneurons
Homologous cell types can acquire species-specific functions through changes in gene expression9,15,17. To evaluate the extent to which patterns in gene-expression variation that distinguish interneuron types are shared across species, we compared genome-wide RNA-expression patterns across the four principal interneuron types (PVALB+, SST+, LAMP5+ and VIP+) within each species (Fig. 1e–g and Supplementary Table 1).
We first focused on genes that were selectively expressed in at least one interneuron type (relative to the others in that species)–the types of genes that have historically been used as ‘markers’ of a cell type. A clear pattern emerged: the great majority of human–mouse and human–ferret gene-expression differences were shared by humans with the other two primates. We observed numerous genes with categorical changes in cell-type-specific expression patterns (including NTNG1, IQGAP2 and TRPC3) and, in rare cases, genes that were a specific marker in one cell class in some species but not detected at all in the interneurons of the other species11 (Fig. 1e and Extended Data Fig. 2a). Such expression variation across species creates challenges in choosing selective markers to characterize conserved cell types: only a modest subset of the genes selected for cell-type-specific expression within one species may have this property in another species (Extended Data Fig. 3a), particularly across the evolutionary distances that separate mice (or ferrets) from primates.
We next sought to understand evolutionary constraints on quantitative expression of pan-interneuron (generally pan-neuronal) genes, which were expressed in many or all interneuron types at varying levels. A comparative lens can reveal the extent to which evolution has maintained the quantitative expression level of a gene in different cell types relative to one another. Illustrating one of the main patterns revealed by this analysis, NRG1–which encodes neuregulin 1, a cell-adhesion molecule that is implicated in synaptic plasticity and other functions22–exhibited a pattern ofexpression levels (across interneuron classes) that was highly correlated among humans, macaques and marmosets but quite distinct in mice and ferrets (Fig. 1f). More broadly, cross-species expression correlations were much more consistent among primates than in the primate–mouse or primate–ferret comparisons (Fig. 1g).
Inter-individual variation–although substantial in humans relative to the other species (Extended Data Fig. 3b–d and Supplementary Tables 2, 3)–was far smaller in magnitude and did not attenuate these larger cross-species relationships.
Regionally specialized RNA expression
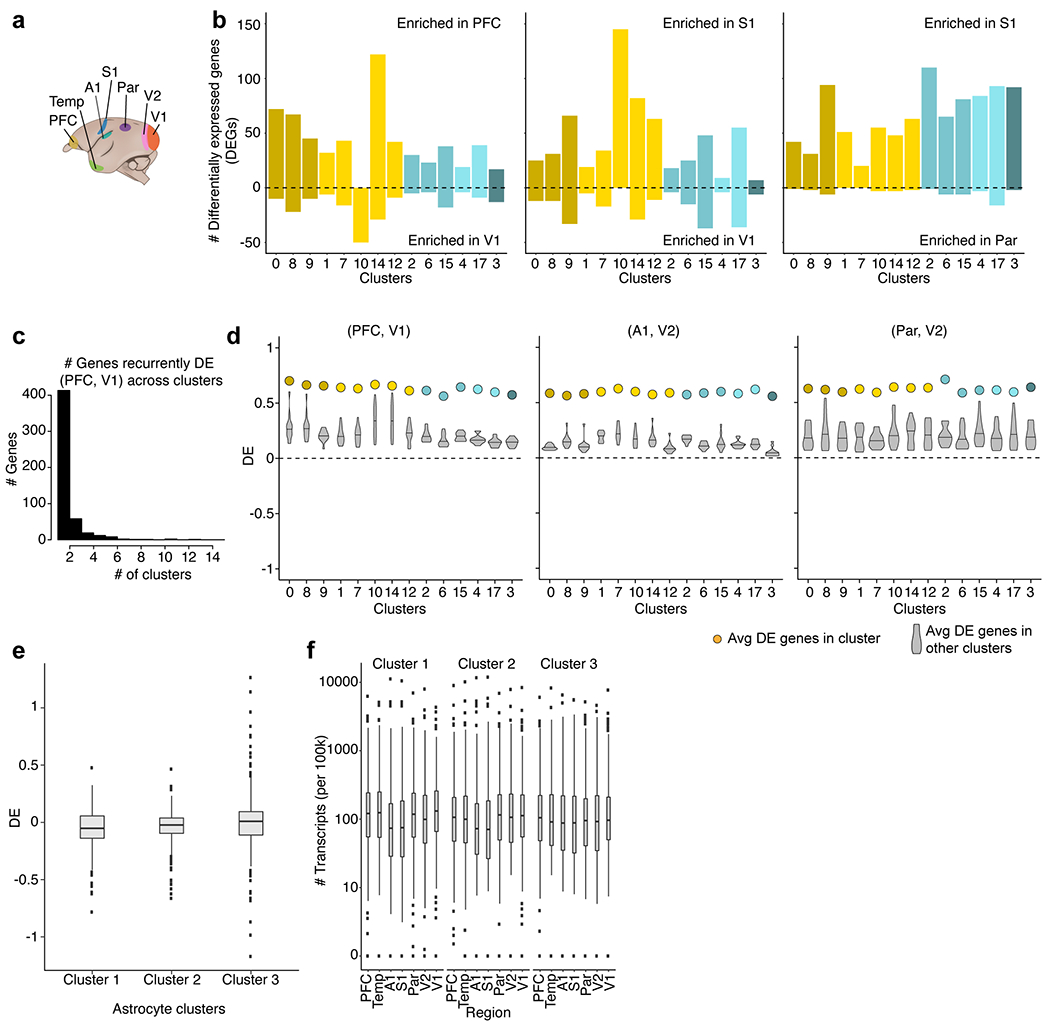
To resolve more-specific subtypes of interneurons, and to compare these types across species and brain regions, we used a computational approach (Liger23) that aligns expression patterns across datasets (corresponding to, for example, brain regions or species). In marmosets, for which we had sampled the most cortical regions (7 regions), each of 17 readily resolvable interneuron types was present in all cortical regions surveyed, confirming that–as described for mice15,18–different cortical regions contain the same basic interneuron types (Fig. 2a). However, and in contrast to what has been observed in mice15,18, gene-expression patterns for these conserved types differed by cortical region in marmosets (Fig. 2b). Across interneuron types, the median number of regionally differentially expressed genes (rDEGs, greater than threefold difference) between PFC and V1 was 55 in marmosets, compared with 12.5 in mouse.
Fig. 2 |. Comparing cortical interneurons within regions and across species.

a, Integrated analysis (using Liger23) of snRNA-seq data from seven marmoset neocortical regions. t-Distributed stochastic neighbour embedding (t-SNE) plots with cells (n = 63,096) coloured by cortical region of origin (left) or cluster assignment (right). A1, primary auditory cortex; Par, parietal association cortex; S1, primary somatosensory cortex; Temp, temporal association cortex; V2, extrastriate visual area. b, Histogram of the number of rDEGs (more than threefold difference in expression) between marmoset PFC and V1 in each cluster for which at least 50 cells per region were available. c, rDEGs (n = 618 unique genes across all clusters) in marmoset (PFC and V1) tend to share regional differences with other species. Left, percentage of genes expressed in the other species that are consistent with marmoset pattern. The dashed line represents chance. Right, log10-transformed magnitude of differential expression (DE). Dots represent cluster averages from the cluster with the most DEGs in common with each marmoset cluster. Box plots represent median and interquartile range. d, Normalized expression of rDEGs (PFC versus V1) across the seven marmoset neocortical regions sampled. The x axis is arranged by anterior–posterior order of the regions shown in a. The top three DEGs for the PVALB+ cluster outlined in a for each contrast (PFC > V1, V1 > PFC) are shown. Dots are individual replicates within each region. e, Dots show averaged spatial correlations across rDEGs identified in each cluster (n = 618 total genes) when regions (n = 5, excluding PFC and V1) are arranged in anterior–posterior order. Grey box plots show averaged correlations of the same rDEGs in each cluster when permuting region order (n = 120 possible orderings). Box plots represent median and interquartile range.
The rDEGs identified in marmosets were also regionally biased in the other species: genes that were enriched in the PFC compared with V1 in marmoset were more likely to be more highly expressed in PFC than in V1 interneurons in the other species, with greater probability and magnitude of difference in humans and macaques than in mice or ferrets (Fig. 2c and Supplementary Table 4). In a control analysis, these patterns were not observed among astrocytes sampled in the same experiments (Extended Data Fig. 4e). These results suggest that interneurons acquire region-specific components of their RNA-expression patterns24,25 (Extended Data Fig. 4) and that these local adjustments are shared across species.
Spatial patterns of gene expression, including macroscale gradients and the distinction between primary and higher-order neocortical areas, configure the layout of neocortical areas during development26,27, persist into adulthood28 and contribute to excitatory neuron diversity29. Unlike excitatory neurons, which are born in the dorsal telecephalon proximal to the neocortical areas in which they ultimately reside, neocortical interneurons are born in the ventral telencephalon and migrate into the neocortex after their birth. To assess whether interneurons acquire local specializations in their ultimate neocortical locations, we investigated how genes differentially expressed between the PFC and V1 also varied in expression across other neocortical regions. This analysis revealed a spatial logic: rDEG expression correlated strongly with anterior–posterior location of the sampled region (Fig. 2d, e). Analysis by single-molecule fluorescence in situ hybridization (smFISH) validated the spatially graded expression of two such genes among PVALB+ interneurons across the marmoset neocortex (Extended Data Fig. 5).
A number of genes had expression levels in the parietal association cortex that were more similar to those of the temporal and prefrontal association cortices than to their levels in more-proximal sensory areas. This might reflect the complex patterns associated with the distinction between primary and higher-order neocortical areas30,31, which were not well captured by linear gradients; definitively parsing more-complex topographies will require a comprehensive sampling of neocortical areas.
Together, these results suggest that the biology of neocortical interneurons becomes attuned to aspects of their final spatial position that vary across the brain at large spatial scales.
Shared and distinct expression patterns
The main classes (PVALB, SST, VIP and LAMP5) of neocortical interneurons each contain many subtypes32. Comparative analysis (using Liger) identified cross-species homologies between marmoset and mouse neocortical interneuron subtypes (Extended Data Fig. 6 and Supplementary Table 5) and allowed us to relate cell types in the marmoset data to homologous types that had previously been identified using SMART-seq data from the human middle temporal gyrus in a recent study11 (Extended Data Fig. 7). Nonetheless, we found that many markers that are widely used to identify specific subtypes of interneurons in mice (such as Calb1, Calb2, Htr3a, Reln, Cck and Nos1)19,33 had different patterns of expression across the corresponding subtypes in primates (Extended Data Fig. 6c). Known species differences in the distribution of such markers may need to be reinterpreted with these data in mind. For example, whereas the increase in the percentage of CALB2+ interneurons in humans relative to rodents has been interpreted as an expansion of a specific (CALB2+) type34, another contributing factor could be the broader expression of CALB2 by additional interneuron types in primates (Extended Data Fig. 6c).
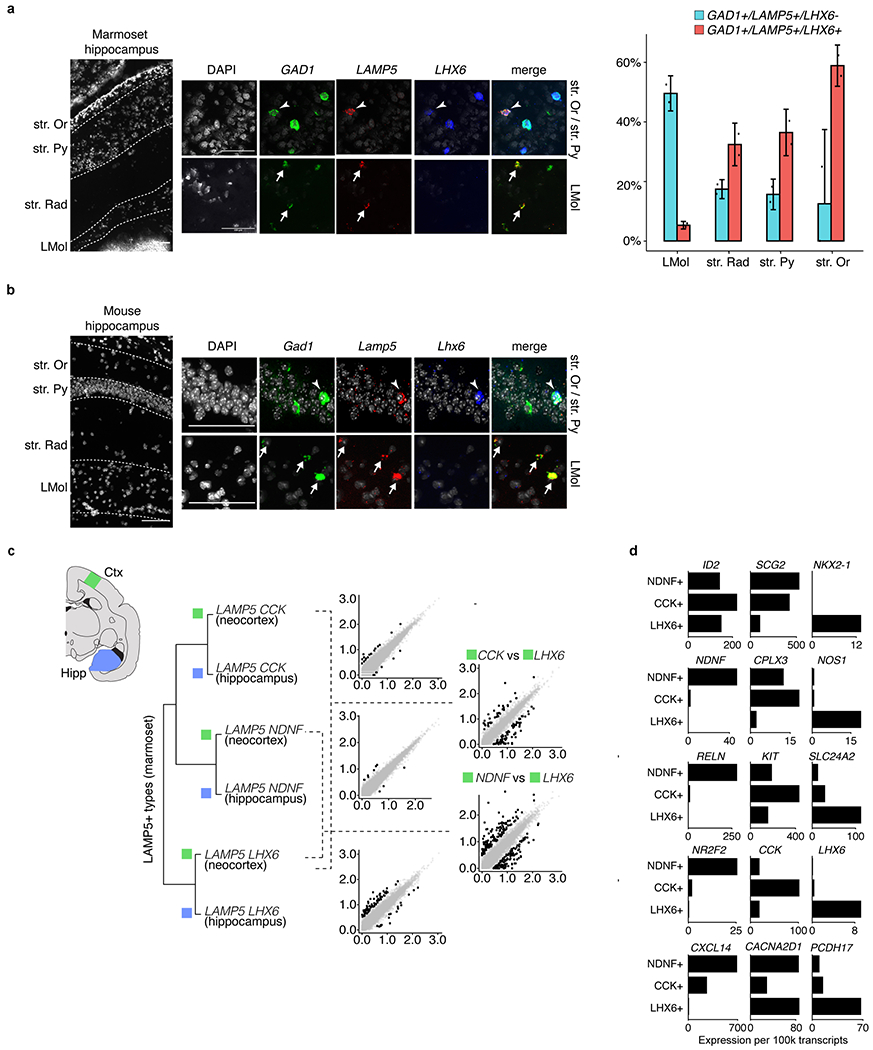
A shared interneuron type in new locations
Although molecularly homologous interneuron types were present in the neocortices of the species examined here, there were marked differences in their abundance. Perhaps the most notable difference in cell-type abundance between primate and non-primate neocortices involved a substantial population of primate LAMP5+ cells that co-expressed the transcription factor LHX6 (Fig. 3a). The proportion of interneurons that were LAMP5+ LHX6+ was approximately eightfold higher in the marmoset, macaque and human cortices than in the mouse cortex (and also much greater than in the ferret cortex), in all cortical regions that we analysed (Fig. 3b).
Fig. 3 |. Cortical LHX6+LAMP5+ interneurons are much more numerous in primates and are molecuiariy similar to conserved hippocampal interneurons.

a, Neocortical cells that express LHX6 and/or LAMP5 from mouse (n = 10,177 interneurons) and marmoset (n = 63,096 interneurons) on UMAP embedding from Fig. 1. Dots from the target species are plotted over all dots from the non-target species. b, Abundances of LHX6+ LAMP5+ cells, expressed as the percentage of GAD1+ interneurons sampled by Drop-seq for each species, by neocortical region. c, Left, smFISH in marmoset neocortex showing an example of an LHX6+LAMP5+GAD1+ cell. Scale bar, 20 μm. Right, quantification by layer of LAMP5+ LHX6− GAD1+ cells (blue) and LAMP5+LHX6+GAD1+ cells (red) in marmoset neocortex (n = 1,796 cells counted across 2 marmosets). Data are mean ± s.e.m.; individual replicates are shown as dots. d, UMAP embedding of Liger integration including marmoset neocortical, hippocampal and striatal interneurons and mouse interneurons across major structures from a previous study15 (n = 12,399 interneurons in mouse; n = 16,563 in marmoset). LAMP5+ subtypes are labelled. e, Hierarchical clustering of marmoset LAMP5+ subtype expression profiles showing that neocortical (n = 5,114 interneurons) and hippocampal (n = 1,589 interneurons) counterparts are more similar to each other than to the other subtypes within the same tissue. Clusters were produced using an independent component analysis-based approach15 (Methods) that, in contrast to Liger, does not explicitly attempt to integrate datasets, and is agnostic to which dataset a given cell comes from. f, A single Nkx2.1 lineage gives rise to Lamp5+Lhx6+ cells in the mouse hippocampus and neocortex. Left, Overview of labelled cells (n = 3 mice). Top middle, the hippocampus is abundantly labelled. Bottom middle, labelling is extremely sparse and mostly restricted to layer 6 (L6) of the neocortex. Labelled cells could be found rarely in layers 2 and 3, but not in layer 1. Right, a biocytin-filled mouse ld2;Nkx2.1 interneuron in neocortical layer 6 (n = 2 mice).
In the mouse, neocortical Lamp5+ interneurons primarily consist of neurogliaform and single-bouquet types, which are the most numerous layer-1 neurons and have distinct morphological, neurochemical and connectivity properties19. Analysis by smFISH revealed that the spatial distribution of primate LAMP5+ LHX6+ neurons was distinct from that of LAMP5+ LHX6− neurons, which were found primarily in the deep cortical layers (Fig. 3c). The expansion of this LAMP5+ LHX6+ cell type throughout the neocortex in diverse primates probably explains a recent observation11 that this cell type is much more abundant in the human temporal lobe than in the mouse V1. The abundance of these interneurons in the neocortex raised intriguing questions because Lhx6–a transcription factor–participates in cell fate determination of MGE types, whereas Lamp5+ neocortical interneurons come from the CGE35. As interneurons migrate from the ganglionic eminences to diverse cortical and subcortical structures, we sought clues from other brain areas. Comparing the expression profile of the primate cortical LAMP5+ LHX6+ population to expression profiles of 17,952 interneurons sampled from eight major structures of the mouse brain15 revealed that primate cortical LAMP5+ LHX6+ cells most closely resembled Lamp5+ Lhx6+ interneurons in the mouse hippocampus (Fig. 3d and Extended Data Fig. 8a, b), which probably comprise the closely related MGE-derived ivy and neurogliaform hippocampal subtypes36.
Hierarchical clustering (Fig. 3e) and patterns of gene expression (Extended Data Fig. 8c, d) confirmed that the marmoset neocortical and hippocampal LAMP5+ LHX6+ populations were more similar to each other than to the other two LAMP5+ neocortical subtypes that did not express LHX6 (Fig. 3d). Notably, marmoset neocortical LAMP5+ LHX6+ interneurons selectively expressed NKX2-1 (Extended Data Fig. 8d), which–in the mouse–is downregulated in MGE-derived interneurons destined for the neocortex37 but persists for unknown reasons in some human cortical interneurons38. Fate mapping of interneurons identified by Id2creERNkx2.1FlpoAi65 mice confirmed that the cortical and hippocampal populations arose from a common (MGE) origin (Fig. 3f).
In contrast to the changed abundance and distribution of these neurons in the cortex, their abundance and distribution within the hippocampus were highly similar between rodents and primates39 (Extended Data Fig. 8a, b).
Striatal interneurons specific to primates
Although the neocortex has greatly expanded and specialized in the primate lineage21,40,41, the subcortical nuclei comprising the basal ganglia are thought to be deeply conserved–so much so that the lamprey, which shares a last common ancestor with mammals more than 500 million years ago, retains nuclei, circuitry and basic cell types that are homologous to those in mice3. We therefore predicted that interneuron types in the striatum, the largest part of the basal ganglia, would be highly conserved across species. To our surprise, the marmoset striatum revealed–in addition to all the major classes of striatal interneurons found in mice15,42–an abundant, transcriptionally distinct interneuron type that did not appear to have a molecularly homologous population among mouse striatal interneurons (Fig. 4a, b). This type expressed VIP and TAC3 (because VIP is also sparsely expressed in other striatal interneuron types42 (Fig. 4b), we hereafter refer to the population as TAC3+). The cells were abundant in male and female marmosets and in all striatal nuclei, including the caudate nucleus, putamen and nucleus accumbens (Extended Data Fig. 9a).
Fig. 4 |. A primate striatal interneuron type not observed in mouse or ferret.
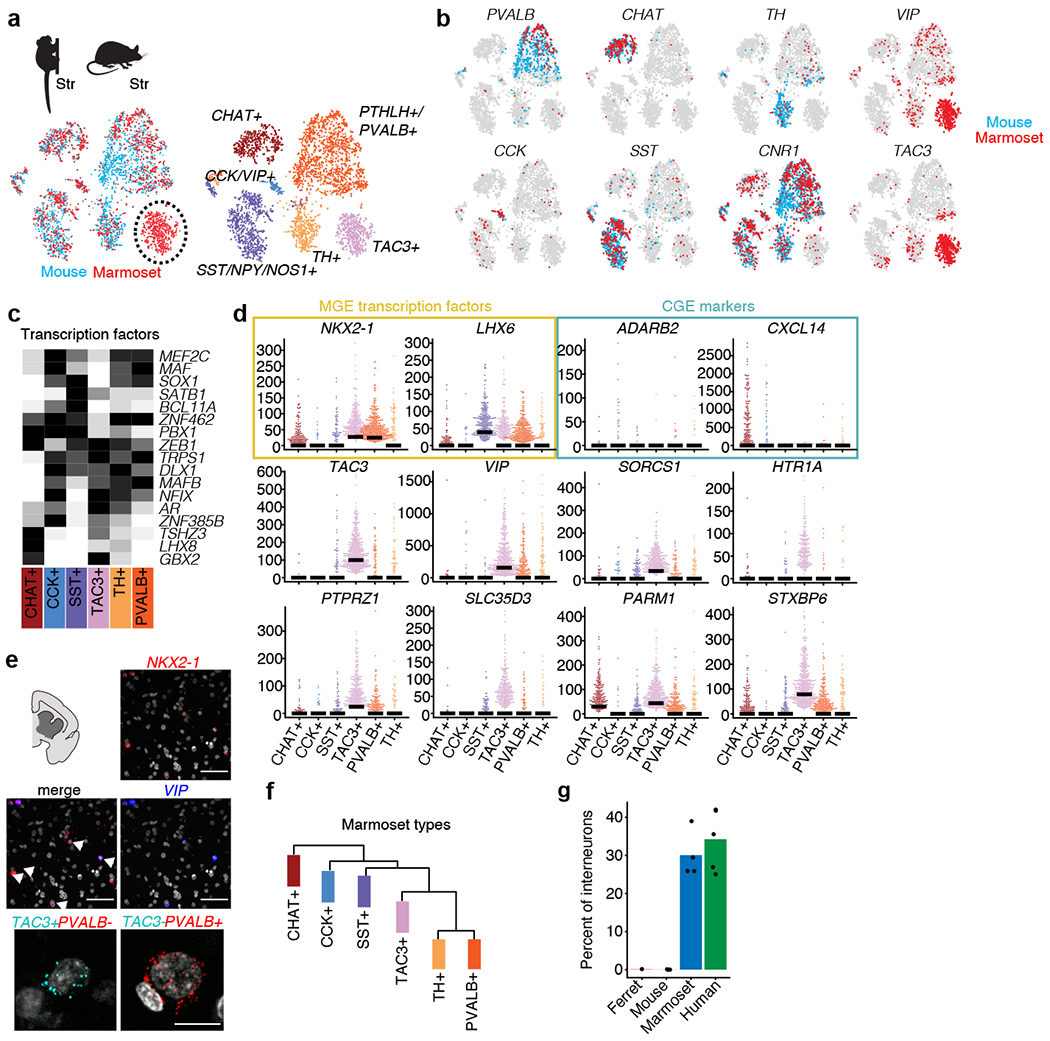
a, integrative cross-species alignment (using Liger) of marmoset (n = 2,227 interneurons) and mouse (n = 2,209 interneurons) striatal interneurons. Left, cells coloured by species (red, marmoset; blue, mouse). Right, cells coloured by cluster (cell type). b, Markers for each interneuron cluster plotted for marmoset (red) and mouse (blue). c, Heat map of transcription factors expression in marmoset striatal subtypes. Each gene is scaled to its maximum value across types (black, maximum value; white, minimum value). d, Beeswarm plots showing additional markers distinguishing TAC3+ interneurons from other interneuron types in marmoset, including MGE transcription factors (yellow) and CGE markers (blue). Dots are individual cells; bars indicate median expression. The y axes show the normalized expression of the indicated genes (number of transcripts per 100,000 transcripts). Top and middle, smFISH for VIP and NKX2-1 in marmoset striatum (n = 1 marmoset). Cells that co-express both genes are identified by arrows. Bottom, smFISH for TAC3 and PVALB identifies non-overlapping populations (n = 1 marmoset). Scale bars, 100 μm. f, Hierarchical clustering of marmoset striatal interneurons. g, Percentage of interneurons per species (out of the indicated total neurons; n = 702 ferret striatal interneurons, n = 2,209 mouse striatal interneurons, n = 3,284 marmoset striatal interneurons, n = 4,303 human striatal interneurons) assigned to the TAC3 cluster when integrated (by Liger) with marmoset data. Dots are individual replicates.
TAC3+ interneurons expressed unique combinations of transcription factors, neuropeptides, transporters and receptors that were not observed in other interneuron subtypes in marmosets or mice (Fig. 4c–e and Extended Data Fig. 9a, b). The genes expressed by this population could provide hints about their developmental origins. Although Vip and Tac2 (the mouse homologue of TAC3) are neuropeptide genes associated with a CGE origin in the mouse19, and although TAC3 and VIP are co-expressed in CGE-derived cells in the marmoset neocortex (Extended Data Fig. 2), the marmoset striatal TAC3+ population expressed MGE-associated transcription factors (Fig. 4d). Because the expression of transcription factors and neuropeptides provided divergent clues, we used the entire genome-wide expression pattern to identify the interneurons that were most similar to the TAC3+ interneurons. Genome-wide RNA-expression patterns suggested that the TAC3+ population is most similar to the SST+, TH+ and PVALB+ populations, all of which are MGE-derived (Fig. 4f). Thus, despite expressing some CGE-associated neuropeptides, the TAC3+ cells are more similar to striatal MGE-derived types than to CGE-derived types.
The TAC3+ interneuron population appeared to be shared between marmosets and humans (Fig. 4g), and constituted 30% and 34% of the interneurons sampled in marmoset and human striatum, respectively.
Joint analysis of the marmoset striatal interneurons with mouse interneurons from eight brain regions15 found no homologous cell population in any of the mouse regions sampled (Extended Data Fig. 9c). We also confirmed that this population was not present in the ferret striatum (Fig. 4g), although TAC3 and VIP were co-expressed in a small population of non-MGE (Adarb2+) ferret nuclei (most similar to the small CCK+ VIP+ ADARB2+ population in marmoset or mice (Extended Data Figs. 9d, 10a)). Other conserved cell populations exhibited both consistency and divergence in gene expression across species (Extended Data. Fig. 10b, c and Supplementary Table 6). These results suggest that an MGE-derived TAC3+ interneuron population appeared in the lineage leading to primates.
The abundance of the previously undescribed TAC3+ interneuron population raised the question of whether it had replaced–or supplemented–conserved interneuron populations. The primates had an expanded representation of interneurons in the striatum overall: whereas interneurons consisted of 5.1% of all striatal neurons in the ferret and 4.1% of all striatal neurons in mice, they consisted of 13.1% of all striatal neurons in marmosets and 10.8% in humans, which is consistent with the stereological estimates of higher interneuron proportions in the primate striatum43. Thus, compared to ferrets and mice, the primate striatum has more than doubled the proportion of interneurons, in substantial part by introducing a previously undescribed interneuron type that has no clear counterpart in the mouse or ferret.
Discussion
‘Cell types’ have been defined as collections of cells that change together over the course of evolution44,45. In this study, we find that although most of the major molecularly defined types of cortical interneurons have clear counterparts in other species, these cell types have undergone surprising degrees of evolutionary change in their abundances, the genes that they express and the levels at which they express pan-neuronal genes. The importance of these changes for the detailed physiological and connectivity properties of interneurons will be essential to understand46.
We found that the primate striatum contains an abundant, molecularly distinct interneuron type that comprises almost one-third of all interneurons in the primate striatum yet has no apparent counterpart in mice or ferrets. RNA-expression patterns indicate that these cells are most similar to other MGE-derived striatal interneuron types. This innovation in the primate lineage was accompanied by a broader expansion in the numbers of interneurons, which doubled their representation as a fraction of all striatal neurons.
We found that an interneuron type that is abundant in the mouse hippocampus–the ivy cell, which has properties similar to neurogliaform cells and is defined by co-expression of Lamp5 and Lhx636–has expanded throughout the neocortex in primates. Primates not only retained ivy cells in the hippocampus but also greatly increased the recruitment of these cells to the neocortex, expanding their distribution throughout neocortical areas and layers. Other neurogliaform (Lamp5+) cell types in the mouse neocortex are preferentially found in upper layers and signal by volume transmission, the diffuse release of the inhibitory neurotransmitter GABA in the absence of conventional synapses47. These cells may contribute diffuse inhibitory signalling in previously unknown neocortical contexts in primates.
The qualitative and quantitative deployment of gene expression across conserved interneuron types indicated that, even for genes that are pan-neuronally expressed, evolution has strongly constrained quantitative gene-expression levels, although substantial differences in gene expression and cellular proportions distinguish primates from mice and ferrets. Understanding such relationships will be important for interpreting the importance of noncoding genetic variation or haplo-insufficiency in humans, and for selecting appropriate animal models with which to study heterozygous mutations ascertained in human patients. Such modelling efforts could be facilitated by systematic datasets that reveal the extent to which the cell-type-specific pattern of expression of each gene is shared by humans and other species48. To support such work, we have developed a web-based data resource that facilitates cross-species comparisons of interneurons (http://interneuron.mccarrolllab.org/).
The innovations among interneurons are notable because the single-cell expression studies of tetrapod species performed so far–in lizards, turtles, mice and primates–had found that the known interneuron types (from mice) are conserved across a broad taxonomic range. Here, however, we found surprising variation in interneurons within and across species. This variation was discordant with our expectations in key ways. First, we had predicted that the primate CGE could contain the greater evolutionary novelties in its interneuron repertoire because it generates a larger proportion of interneurons in primates than in rodents34, because cortical CGE interneurons are born later than MGE interneurons, and because CGE-derived interneurons preferentially occupy the expanded upper neocortical layers49. However, the most marked cellular aspects of the divergence in the cortex, hippocampus and striatum of the primate lineage all involved interneurons for which RNA-expression patterns indicated MGE origins. Second, although the neocortex has attracted considerable interest because it is thought to underlie expansions in the cognitive abilities of primates, it was in the striatum that we identified a primate interneuron type that had no counterpart in mice or ferrets. The systematic analysis of many more species and cell types could reveal more such examples of evolutionary flexibility and innovation.
Methods
Data reporting
The experiments were not randomized and the investigators were not blinded to allocation during experiments and outcome assessment.
Ethical compliance
Human brain tissue was obtained from the Harvard Brain Tissue Resource Center (HBTRC), which acquires de-identified post-mortem human brain tissue under approval from the Partners Human Research Committee and with permission from legal next-of-kin for the use of brain tissue for research. Federal regulation 45 CFR 46 and associated guidance indicates that the generation of data from de-identified post-mortem specimens does not constitute human participant research that requires institutional review board review. Post-mortem tissue collection followed the provisions of the United States Uniform Anatomical Gift Act of 2006 described in the California Health and Safety Code section 7150 and other applicable state and federal laws and regulations. Macaque post-mortem tissue was obtained from terminal experiments that were approved by University of Washington Institutional Animal Care and Use Committees (IACUC 4315-02). Marmoset experiments were approved by and in accordance with Massachusetts Institute of Technology IACUC protocol number 051705020. Mouse experiments were approved by and in accordance with Harvard Medical School IACUC protocol number IS00 000055-3 or NYU Langone IACUC protocol number 160407. Ferrets (Mustela putoriusfuro) were sourced from Marshall Bioresource and used according to protocols approved by the IACUC of Boston Children’s Hospital.
Specimens and donors for single-nucleus RNA-seq
Specimen information is available in Supplementary Table 7. Reagent information is available in Supplementary Table 8. No statistical methods were used to predetermine sample size.
Mouse.
Sections of frontal cortex and V1 were prepared from male and female adult mice (60–70 days old; C57Blk6/N, Charles River, stock no. 027) as previously described15. Mice were deeply sedated with isoflurane and trans-cardially perfused with ice-cold sucrose-HEPES buffer, which contains (in mM) 110 NaCl, 2.5 KCl, 10 HEPES, 7.5 MgCl2, 25 glucose and 75 sucrose (~350 mOsm kg−1). Specifically, 300-μm slabs of frontal cortex and V1 were cut on a Leica VT1000S vibratome. Slabs containing the regions of interest were gently transferred to a dissection dish with ice-cold ‘dissection buffer’ containing (in mM): 82 Na2SO4, 30 K2SO4, 10 HEPES, 10 glucose and 5 MgCl2. Dissection buffer avoided activity-induced toxicity by (1) excluding extracellular Ca2+ and (2) using ionic concentrations that maintain voltage-gated Na channels in an inactivated state (Vm = 30.5 mV, estimated by the Goldman–Hodgkin–Katz equation using the following parameters: inside (mM): K+ = 140, Na+ = 4, Cl− = 24; outside (mM): K+ = 30, Na+ = 82, Cl−=5; P: K+ = 1, Na+ = 0.05, Cl− = 0.45; T = 34 °C. Regions of interest were gently dissected under visual guidance of a stereoscope (Leica, MZ10). Regions were then flash-frozen in liquid nitrogen and stored at −80 °C until use.
Marmoset.
Five adult marmosets (1.5–2.5 years old; three males, two females) were deeply sedated by intramuscular injection of ketamine (20–40 mg kg−1) or alfaxalone (5–10 mg kg−1), followed by intravenous injection of sodium pentobarbital (10–30 mg kg−1). When the pedal withdrawal reflex was eliminated and/or the respiratory rate was diminished, animals were trans-cardially perfused with ice-cold sucrose-HEPES buffer. Whole brains were rapidly extracted into fresh buffer on ice. Sixteen 2-mm coronal blocking cuts were rapidly made using a custom-designed marmoset brain matrix. Slabs were transferred to a dish with ice-cold dissection buffer15, and regions of interest were dissected using a marmoset atlas as reference50. Regions were snap-frozen in liquid nitrogen and stored in individual microcentrifuge tubes at −80 °C.
Macaque.
Whole brains from two healthy, immunologically and treatment-naive adult macaques (two males; 10–11 years old) were obtained from terminal experiments. Animals were deeply sedated with ketamine and euthanized by pentobarbital overdose, and trans-cardially perfused with ice-cold sucrose-HEPES buffer. Brains were rapidly cut in ~5-mm coronal slabs, frozen in liquid nitrogen or isopentane on dry ice and stored at −80 °C until further use.
Human.
Frozen tissue was obtained from the Harvard Brain Tissue Resource Center (HBTRC; McLean Hospital). Five donors were used for the analysis of striatal interneurons, and two for the analysis of neocortical interneurons. History of psychiatric or neurological disorders was ruled out by consensus diagnosis carried out by retrospective review of medical records and extensive questionnaires concerning social and medical history provided by family members. Several regions from each brain were examined by a neuropathologist. The cohort used for this study did not include any individuals with evidence of gross and/or macroscopic brain changes, or a clinical history of a cerebrovascular accident or other neurological disorders. Participants with Braak stages III or higher (modified Bielchowsky stain) were not included. None of the participants had a history of substance dependence within 10 or more years of death, as further corroborated by negative toxicology reports.
Ferret.
Two animals were used for experiments. For single-nucleus RNA-seq (snRNA-seq), animals were perfused with PBS, the brain was extracted and tissue was snap-frozen in liquid nitrogen. For smFISH, unperfused, fresh-frozen tissue was used.
Nucleus Drop-seq library preparation and sequencing
Nucleus suspensions were prepared from frozen tissue and used for nucleus Drop-seq following the protocol we have described at https://doi.org/10.17504/protocols.io.2srged6. Drop-seq libraries were prepared as previously described13 with modifications, quantification and quality control as described in a previous study15, as well as the following modifications optimized for nuclei: in the Drop-seq lysis buffer, 8 M guanidine hydrochloride (pH 8.5) was substituted for water, nuclei were loaded into the syringe at a concentration of 176 nuclei/μl, and cDNA amplification was performed using around 6,000 beads per reaction (15 PCR cycles were used for marmoset nuclei; 16 for macaque and human nuclei). Raw sequencing reads were aligned to the following genome assemblies: MusPutFur1.0 (ferret), GRCm38.81 (mouse), calJac3 (marmoset), Mmul8.0.1 (macaque) and hg19 (human). Reads that mapped to exons or introns of each assembly were assigned to annotated genes.
Mouse single-cell dataset
Interneurons were curated in silico from the previously published single-cell datasets15 from available structures: frontal and posterior neocortex, striatum, cerebellum, thalamus, hippocampus, substantia nigra and entopeduncular nucleus.
10X Chromium single-cell 3′ v.3
Single-nucleus suspensions from frozen tissue (marmoset, ferret and human; see Supplementary Table 7 for specimen information) were generated as for Drop-seq; GEM generation and library preparation followed the manufacturer’s protocol (protocol version #CG000183_ChromiumSingleCell3′_v3_UG_Rev-A).
Single-species independent component analysis
Initial analyses to identify interneurons based on marker expression were conducted on each species separately. Nuclei with fewer than 300 detected genes were removed from analysis. In brief, independent component analysis (ICA, using the fastICA package in R) was performed on the digital gene expression matrix of each species and each region separately after normalization and variable gene selection as previously described15. These first-round individual-species analyses produced clustering solutions with ~8–11 clusters of major cell types (neurons, glia and vasculature), from which interneuron clusters could be identified based on canonical markers (for example, GAD1 and GAD2). The raw digital gene expression matrices were subset to include only cells from these clusters to form new, interneuron-only matrices. Normalization, variable gene selection and ICA were repeated on these interneuron-only matrices, but this time the full ICA curation pipeline that was previously described15 was used to identify doublets, outliers, artefact signals and biological components of interest. Cells identified by this procedure as doublets or outliers were removed from the digital gene expression matrix, and these filtered matrices were then used for integrated analyses across regions and/or species using Liger23.
Interneuron abundances and local specialization in neocortex
Proportions of PVALB+ or SST+ (MGE-derived) and VIP+ or LAMP5+ (non-MGE-derived) were calculated for each species separately for frontal association areas (frontal cortex, mouse; PFC, primates) and V1. Cells were allocated to MGE or non-MGE pools based on their cluster assignment in individual-species ICA clustering. Error bars represent 95% confidence intervals for binomial probability, computed with the R package Hmisc.
Identification of conserved and divergent genetic programs within conserved interneuron types
Interneurons from the neocortex of each species were partitioned into four main classes based on marker expression (VIP, LAMP5, PVALB and SST). We also detected several rare and distinct categories of cortical GABAergic cells, such as MEIS2+ cells–which in mouse reside in deep-layer white matter and make long-range projections–and putative Cajal-Retzius cells, which reside in layer 1 and are scarce in the adult brain. However, in agreement with other reports11, these types were inconsistently observed across individual animals and regions, likely due to laminar location and low abundance, and were not analysed further.
For each species and each of the four main classes, transcripts were pooled across cells, normalized by total number of transcripts, and scaled to 100,000 transcripts, which yielded four vectors of representative gene expression for each class. We then applied a series of filters to search all expressed genes for those that were selectively expressed by at least one of the four cell types in at least one species. Genes with low expression (<10 transcripts per 100,000 in any species) were removed. At least one species had to show a more than threefold difference between the maximum and minimum expression level across the four types. These filters identified an initial set of putative markers in one or more species. To search for genes that were consistent or different across species for each gene (only one-to-one orthologues were considered), Pearson correlations between pairs of species were computed, yielding six correlation values. If a gene was not detected in a given species, values were ignored for pairs that included that species.
Quantitative expression level comparisons across neocortical classes
To examine the extent to which evolution has constrained the quantitative expression level of a gene across the four main neocortical cell classes, we focused on meaningfully expressed genes (4,051 genes that exhibited at least 1.5-fold expression variation across the four classes in at least one species, and were also present with an abundance of at least 10 transcripts per 100,000 in at least one cell class). Pearson correlations were computed on the vector of expression values for each of these genes in all possible pairs of species.
Analysis of inter-individual variability in gene expression
For each of the four main classes of cortical interneuron, we compared normalized gene expression levels (averaged across individual cells) between pairs of individuals of the same species, downsampling cells such that there were similar numbers of unique transcripts per species in each interneuron type. We defined a measure of expression variation ‘mu’ (calculated as the absolute value of the log10-transformed ratio of the expression levels of each individual) in each of the four major cortical interneuron types (PVALB+, SST+, ID2+ and VIP+), filtering to retain genes that were meaningfully expressed (>10 per 100,000 transcripts) in each cell type.
Genes that are dosage-sensitive in humans might have particularly strong evolutionary constraint on their expression levels. To evaluate this, we further focused on genes that exhibit evidence of haplo-insufficiency in humans as determined using pLI, a metric based on sequence variation across 60,706 human genomes that describes the probability that a given gene is intolerant to loss of function in human populations51. For pLI analysis, genes were further stratified by pLI (pLI > 0.9 and pLI < 0.9) to compare resulting distribution of mu scores for each species. Only genes that were meaningfully expressed in at least one cell type in all species were considered.
Cross-species Liger integration of cortical interneurons
Integrated species analyses were performed using Liger23 between species pairs, which had the advantage of allowing each pair of species to jointly determine cluster definition. Homologous genes were identified using homology tables (Ensembl BioMart). Datasets were downsampled to retain similar numbers of interneurons per species. Parameter values were explored over a range using Liger functions to suggest optimal values; the resulting clusters used the parameters described below.
Liger integration of marmoset and mouse neocortical interneurons for identification of shared and distinct markers.
Variance threshold = 0.15, k = 35 (number of factors), lambda = 5 (regularization parameter to penalize dataset-specific influences on alignment), resolution = 1 (to control the resolution of clusters in community detection). Liger-integrated clusters were inspected to identify exemplar genes that had consistent or inconsistent patterns of expression across clusters (Extended Data Fig. 6).
Liger integration of a previously published human data.
The human middle temporal gyrus dataset11 was obtained from https://portal.brain-map.org/atlases-and-data/rnaseq. Intronic and exonic read counts were summed from cells that had previously been identified as interneurons (n = 4,164; including all cells that had labels beginning with ‘Inh’). Human data were combined with marmoset snDrop-seq data from temporal pole samples (n = 6,739 interneurons) with Liger. Parameters were: k = 50; lambda = 5; resolution = 3; varying these parameters around these values produced similar results. The proportional representation of the individual clusters in each dataset (marmoset clusters derived from the ICA-based pipeline; human cluster assignments obtained from the previous study11) was calculated across Liger clusters and plotted as a heat map (Extended Data Fig. 7), providing a visualization of correspondence between the two datasets.
Neocortical rDEGs
To examine gene expression variation across neocortical regions in marmoset, region (n = 7) datasets were pooled into a region-integrated Liger analysis (variance threshold = 0.15, k = 25, lambda = 5, resolution = 0.8). These parameters produced 17 clusters; two clusters were removed as these had fewer than 50 cells from one or more regions, yielding a final set of 15 clusters for cross-region comparisons. For each cluster, differential expression was computed between all region pairs using a fold-difference threshold of 3. The number of rDEGs between PFC and V1 in marmosets and mice was computed using similar numbers of UMIs (132 million and 110 million UMIs, respectively).
Interneuron rDEGs in astrocytes.
Marmoset neocortical astrocytes were analysed by identifying the cluster(s) that expressed known astrocyte markers (for example, AQP4, GFAP, GJA1 or GLUL) from the same individuals used in cortical interneuron analyses. Cells in these clusters were isolated from raw data and clustered using the ICA pipeline described above, which resulted in three astrocyte subtypes. For each astrocyte subcluster, fold differences of rDEGs identified in interneurons (in comparisons between PFC and V1) were computed for PFC and V1 in astrocytes.
Marmoset interneuron rDEGs profiled in macaque, human, mouse and ferret.
Marmoset interneuron rDEGs (identified in comparisons between PFC and V1) were profiled in other species: for each rDEG, fold differences between frontal cortex (mouse) or PFC (other species) and V1 cells were computed for each cluster identified by ICA-based clustering of each species. The percentage and median differential expression (log10-transformed fold differences) of genes that were rDEGs in marmoset was calculated in each species.
Spatial correlations.
For each cluster, expression levels of rDEGs identified in comparisons between PFC and V1 were examined in the other neocortical regions (n = 5). To quantify the existence of spatial gradients, for each gene the Pearson correlation between expression and spatial order along the anterior–posterior axis was computed in the five remaining regions in order (Temp, S1, A1, Par and V2). Mean correlation values were compared to a null distribution obtained by permuting the ordering (120 possible orderings).
Liger integration of striatal datasets
Liger integration analyses were performed for species pairs matched by snRNA-seq platform (Drop-seq, marmoset–mouse, marmoset–human; 10X, marmoset–ferret, marmoset–human), except for mouse–ferret (Drop-seq and 10X). Mouse–ferret parameters, k = 10, lambda = 3, resolution = 0.8; marmoset–mouse parameters, k = 25, lambda = 5, resolution = 0.8; marmoset–ferret parameters, k=12, lambda = 3, resolution = 3; marmoset–human parameters (10X), k = 12, lambda = 3, resolution = 1.2; marmoset–human (Drop-seq), k = 20, lambda = 5, resolution = 0.8. Varying parameters around these values produces similar results. For each Liger analysis, resulting clusters were compared to single-species clustering (by ICA) by calculating the percentage agreement between solutions (Extended Data Figs. 7, 9a).
Hierarchical clustering
Dendrograms of cell-type relationships were produced using hierarchical clustering (using the hclust function, method = complete, in R) of genes normalized (to 100,000 transcripts), using log10-transformed values of all expressed genes (genes with at least 10 transcripts per 100,000 transcripts).
smFISH
All probes are listed in Supplementary Table 8. All smFISH validation experiments were carried out on independent biological replicates from those used for snRNA-seq or single-cell RNA-seq experiments.
PVALB, ASS1 and CRYM experiments.
One adult marmoset (age, 7 years) was perfused with ice-cold saline, followed by 4% paraformaldehyde (PFA). The brain was post-fixed overnight at 4 °C. Then, 50-μm sagittal sections were cut on a vibratome (Leica, VT1000S) and were stored at 4 °C in 70% ethanol before use. Sections were then stained using the generic sample in solution protocol52 (HCR v.3.0; Molecular Instruments) for PVALB (Molecular Instruments, 2475/B225) and for CRYM (Molecular Instruments, PRC961) or ASS1 (Molecular Instruments, PRC959). ASS1 and CRYM showed graded expression in opposing anterior to posterior directions in PVALB+ interneurons, with little or no expression in non-interneuron cell types (CRYM is additionally expressed in a subset of excitatory neurons) in our snRNA-seq data (Fig. 2d). Sections were incubated in TrueBlack Lipofuscin Autofluorescence Quencher (Biotium, 23007) for 3–5 min at room temperature, to reduce autofluorescence in this tissue, before mounting sections on a slide and placing a coverslip on top with ProLong Gold anti-fade reagent (Invitrogen, P36930). Imaging was performed across three large regions (encompassing frontal cortex, mid-cortex and occipital cortex) on the TissueGnostics Tissue Faxs SL slide-scanning, spinning-disk confocal microscope with a 40×/1.2 NA water-immersion objective.
In situ-based quantification of cortical gradients.
Images were segmented using StrataQUEST, a software package from TissueGnostics that enables the quantification of signals within segmented images (similar to CellProfiler). In brief, nuclei were segmented from the image using the DAPI channel. Cell borders were computed around each nucleus and artefacts were removed based on size and intensity. Exclusion ROIs were manually drawn to avoid white matter and large artefacts before computing intensity and various statistical and morphological measurements (20 parameters available per channel).
Segmented cells were further analysed using in-house code. Specifically, 383 (for CRYM experiments) and 261 (for ASS1 experiments) examples of double-negative, double-positive, single-positive and artefact signals were hand-labelled to identify appropriate thresholds using parameters that best discriminated each category. Parameters for each channel included: mean intensity, maximum intensity, minimum intensity, standard deviation of intensity, range and equivalent diameter. These filters were then applied to the unlabelled data to identify single-and double-positive cells. Spatial locations of cells were visualized by plotting the xy coordinates associated with each cell. These were then binned in histograms across the x axis (which corresponds to the rostrocaudal plane of the image) for each of the three regions.
PVALB and TAC3 experiments.
One 3.5-year-old male marmoset was euthanized and perfused with ice-cold saline, followed by 4% PFA. The brain was post-fixed overnight in 4% PFA at 4 °C and then incubated in a cryo-preservative (30% sucrose in PBS) overnight at 4 °C. Coronal sections were cut at 120 μm on a vibratome (Leica, VT1000S) and then stored in 70% ethanol at 4 °C until use. Anterior, middle and posterior sections were stained for TAC3 (Molecular Instruments, PRC843) and PVALB using the HCR v.3.0 protocol (Molecular Instruments) described above, in combination with TrueBlack incubation to reduce autofluorescence. The striatum was imaged in each section using the Tissue Faxs SL with a 40× water-immersion lens.
PVALB, IQGAP2 and VIP experiments.
A 2.5-month-old male C57BL/6J mouse (Jackson Laboratory, 000664) was euthanized and perfused with ice-cold saline, followed by 4% PFA. The brain was post-fixed with 4% PFA at 4 °C overnight, and then cut sagittally at 50 μm on the vibratome and stored in 70% ethanol at 4 °C until use. Sections were stained for Pvalb (Molecular Instruments, PRB790), Iqgap2 (Molecular Instruments, PRC948) and Vip (Molecular Instruments, PRA216) using the HCR v.3.0 protocol (Molecular Instruments) described above. Full sagittal sections were imaged using the Tissue Faxs SL with a 20×/0.8 NA air objective.
Tissue from the 7-year-old male marmoset that was used for the PVALB, ASS1 and CRYM experiments was also used to stain for PVALB, IQGAP2 (Molecular Instruments, PRD126) and VIP (Molecular Instruments, 2697/B839) in the cortex. Sections were stained using the HCR v.3.0 protocol (Molecular Instruments) described above, in combination with TrueBlack incubation to reduce autofluorescence in the marmoset tissue. Cortical samples were imaged using the Tissue Faxs SL with a 40×, water-immersion lens.
VIP and NKX2-1 experiments.
One 6-year-old male marmoset was euthanized and perfused with ice-cold saline. The whole brain was immediately removed, embedded in Optimal Cutting Temperature (OCT) freezing medium, and flash-frozen in an isopropyl ethanol-dry ice bath. Samples were cut into 16-μm sections on a cryostat (Leica, CM 1850), adhered to SuperFrost Plus microscope slides (Fisher Scientific, 12-550-15) and stored at −80 °C until use. Samples were immediately fixed in 4% PFA and stained on the slide according to the Advanced Cell Diagnostics RNAscope Multiplex Fluorescent Reagent Kit v.2 Assay (ACD, 323100) protocol. Samples were stained for VIP (ACD, 554571-C2) and NKX2-1 (ACD, 532751-C3) with antisense probes, and a coverslip was added using Vectashield HardSet Antifade mounting medium with DAPI (Vector Laboratories, H-1500). z-Stack serial images were taken through the whole depth on a Nikon Ti Eclipse inverted microscope with an Andor CSU-W1 confocal spinning-disc unit and an Andor DU-888 EMCCD using a 20×/0.75 NA air objective, and later maximum-projected in Fiji (ImageJ, NIH). Fields of view were randomly chosen across the whole striatal sample. Probes listed in Supplementary Table 8.
In situ-based quantification of neocortical and hippocampal LAMP5+ subtypes.
Frozen, unfixed tissue sections (12 μm) of mouse (60–70-day-old C57BL/6 mice; Charles River; n = 2) and marmoset (n = 2) brain tissue were cut on a cryostat (Leica, CM 1950), adhered to SuperFrost Plus microscope slides (Fisher Scientific, 12-550-15) and processed for three-colour smFISH using the ACD v.2 RNAscope multiplexed fluorescence protocol for fresh-frozen tissue. Probes are listed in Supplementary Table 8. For hippocampus and neocortical area S1, laminar boundaries were identified using DAPI in mouse and marmoset tissue. Neocortical laminae were separated into five bins (layer 1, layer 2/3, layer 4, layer 5 and layer 6); hippocampal laminae within CA1 and CA2 regions were separated into four bins. Within each bin, GAD1+ LAMP5− LHX6−, GAD1+ LAMP5+ LHX6− and GAD1+ LAMP5+ LHX6+ cells were counted in two sections of each replicate. In total, 3,998 cells were counted.
Fate mapping of Lamp5+ Lhx6+ cells in mouse hippocampus and neocortex.
To label Lamp5+ Lhx6+ cells in the mouse neocortex and hippocampus, we used an intersectional genetics approach. In mouse mature cortical interneurons, Id2 and Lamp5 are expressed in nearly identical populations35 (and both are expressed in the cortical Lamp5+ Lhx6+ type), and so we used an Id2creER driver line53 (Jax stock no. 016222) in combination with an Nkx2.1Flpo driver54 (Jax stock no. 028577) and the Cre/Flp-dependent tdTomato reporter Ai6555 (Jax stock no. 021875) to obtain selective labelling of Lamp5+ Lhx6+ cells. Tamoxifen (20 mg/ml in corn oil) was administered to Id2creER Nkx2.1FlpoAi65 animals (3 × 5 mg by oral gavage over 5 days) between postnatal days 30 and 40 to activate CreER, after which animals were either perfused with 4% PFA in PBS and their brains processed for immunohistochemistry (20-μm cryosections; tdTomato signal was enhanced using rabbit anti-RFP from Rockland Immunochemicals; 600-401-379; 1:1,000 dilution), or acute brain slices were prepared for morphological fills as described previously56. Fluorescence images were acquired on a Zeiss Axio lmager.A1 and levels and contrast adjustments were performed using Photoshop (Adobe).
Extended Data
Extended Data Fig. 1 |. Interneuron abundances and gene expression in neocortex.
a, Comparison of measured abundances (expressed as the percentage of all Gad1+ cells) of select interneuron populations across three modalities: single-cell Drop-seq (n = 3,859 cells, n = 7 biological replicates), nucleus Drop-seq (8,622 nuclei, n = 11 biological replicates) and stereological counting of smFISH in mouse cortex (n = 3,891 counted cells, n = 3 biological replicates). Cell Drop-seq and smFISH values were obtained from a previous study15. Box plots show median and interquartile range. b, Percentage of interneurons (expressed as a percentage of all neurons) in sensory and association cortex measured with snRNA-seq. Box plots show the median and interquartile range; dots indicate individual brain regions. Ferret, n = 20,285 neurons; mouse, n = 90,159 neurons; marmoset, n = 576,345 neurons; human, n = 303,733 neurons. c, Proportion of MGE and non-MGE interneurons in cortical association regions (PFC, temporal pole and lateral parietal association cortex) and in cortical sensory regions in marmoset (n = 25,946 interneurons across 7 regions from 1 replicate) and human (n = 42,042 interneurons across 4 regions from 2 replicates). Error bars represent binomial confidence intervals.
Extended Data Fig. 2 |. Marker gene expression across species.

a, Examples of markers that are consistent, or that vary across species, within the four primary interneuron classes. Values are scaled UMI counts per 100,000 transcripts. b, Triple smFISH characterization of IQGAP2, PVALB and VIP in mouse (n = 1 biological replicate) and marmoset (n = 1 biological replicate) cortex. Arrows indicate double-positive cells (either IQGAP2+ PVALB+ or IQGAP2+ VIP+). Scale bar, 10 μm.
Extended Data Fig. 3 |. Comparisons of neocortical interneuron types across and within species.

a, Examples of correlation (Pearson’s r) in fold difference of expressed genes between pairs of MGE-derived and of nonMGE-derived interneuron types across pairs of species. Comparing within and then across species corrects for potential species-specific (for example, sequence-related) influences on RNA sampling, as well as for latent technical variables that might distinguish brains of different species. Genes in red have >3-fold expression difference in either cell type in each species pair, showing that the most extreme DEGs (largely consisting of known ‘markers’ of each type) tended to be consistent between species, despite modest correlations overall. Expression values obtained from n = 10,177 mouse and n = 63,096 marmoset cortical interneurons. b, Cortical interneuron t-SNE plots for each species (same data as Fig. 1c), coloured by individual replicate. c, Measure of inter-individual variability in gene expression (mu) in major interneuron types in mouse, marmoset and human. For each cell type, normalized gene expression levels (averaged across individual cells) are compared between pairs of individuals of the same species. Marmosets and mice both exhibited more modest inter-individual differences than humans did, which probably reflects the effects of life histories, environments and age at sampling, which are more uniform in a laboratory setting. Higher values indicate greater variability. Note that while the mice are isogenic, whole-genome sequencing of the marmosets revealed that they exhibited sequence variation comparable to humans. d, mu scores stratified by pLI gene scores. Human haplo-insufficient (high-pLI) genes tended to have lower expression variability than low-pLI genes in humans but not in marmosets or mice.
Extended Data Fig. 4 |. Regional gene expression variation in neocortex.
a, Schematic of neocortical region locations in marmoset. b, Histogram of the number of rDEGs (>3-fold expression difference) between three representative pairs of regions, in each cell type (cluster) for which there were at least 50 cells per region. c, Histogram of the number of interneuron clusters (cell types) in which a given gene is differentially expressed. At a threshold of >3-fold, most genes are only differentially expressed in a single cell type (cluster). d, Average fold difference of regional enrichment across regions and clusters. Coloured dots represent average fold difference of DEGs in each cluster in marmoset interneurons computed from the region pair depicted. Violin plots represent the distribution of average fold differences in each cluster (cell type) when using rDEGs from other clusters. Three representative region pairs are shown (n = 517 rDEGs genes across clusters for PFC and V1; n = 2,271 genes for A1 and V2; n = 1,622 genes for Par and V2). Horizontal bars on violin plots represent the median differential expression score (when using rDEGs from other clusters). rDEGs identified for any one interneuron type (cluster) tended to also exhibit the same regional bias in the other types (clusters). This suggests that most such differences reflect a common regional signature that is shared by diverse interneurons, rather than being specific to particular interneuron types. e, Fold ratios (log10-transformed) between PFC and V1 for three astrocyte subtypes (n = 32,600 nuclei) in marmosets using rDEGs identified in interneurons in the same brain regions. Box plots show interquartile ranges and medians. Dots show outlier genes. f, As in e but for all seven brain regions. Regions are arranged in anterior–posterior order on the x axis. Box plots show interquartile ranges and medians. Dots show outlier genes.
Extended Data Fig. 5 |. smFISH validation of graded gene expression in PVALB+ interneurons.

a, Top, sagittal sections of marmoset brain (n = 1 marmoset, at least two tissue sections stained per probe set) stained for PVALB and ASS1 (left) or CRYM (right), two genes that showed quantitatively graded expression in the interneuron snRNA-seq data (see Fig. 2d). Bottom, representative cells from each of the three imaged regions (blue boxes in the top panels). Scale bar, 10 μm. b, Top, spatial distribution of PVALB+ and double-positive interneurons plotted from three imaging windows (blue boxes in a) across the sagittal plane. Bottom, proportion of single-positive (PVALB+ only) and double-positive (PVALB+ASS1+ or PVALB+CRYM+) cells binned along the rostrocaudal axis within imaged regions. c, Mean intensity for each probe within cells identified in b (n = 14,195 double-positive cells in the PVALB+ASS1+ experiments and n = 26,194 double-positive cells in the PVALB+CRYM+ experiments). PVALB itself shows a graded expression (in terms of signal intensity per cell) across the rostrocaudal extent in our snRNA-seq data, with the highest expression (and highest cell numbers) located in the caudal pole (V1). Box plots represent the interquantile range and median values.
Extended Data Fig. 6 |. Conserved and divergent gene expression across neocortical types.

a, Liger-integrated marmoset (n = 6,739 interneurons) and mouse (n = 6,852 interneurons) datasets. b, Heat map of exemplar genes that had consistent patterns of expression in Liger-integrated marmoset–mouse clusters from a. Each gene (row) is scaled to the scaled maximum (black) expression (values given outside plots) for each species separately. The coloured top bar codes each cluster as one of the major types (as in Fig. 1). Column labels follow labels in a. c, Heat map of exemplar genes that have divergent expression patterns in Liger-integrated marmoset–mouse clusters from a. Each gene (row) is scaled to the scaled maximum (black) expression (values given outside plots) for each species separately. Exemplar genes include those that are widely used as markers for particular interneuron populations but have divergent gene expression across mice and marmosets, such as CALB1 and CALB2.
Extended Data Fig. 7 |. Integration of marmoset and human interneurons.

a, Liger-integrated marmoset (n = 6,739 interneurons; the same data are used in Extended Data Fig. 6) and human (n = 4,164 interneurons). Human data are from the middle temporal gyrus dataset available from a previously published study11 (SMART-seq v.4). Marmoset data are from temporal lobe interneurons (Drop-seq). b, Heat map of the proportional representation of individual-species clusters (rows) within Liger clusters (columns) labelled as in a. Marmoset clusters were generated from an ICA-based pipeline (see Methods). Human clusters and labels are from a previously publishes study11 (for example, see figure 5d of the previous study11). In both datasets, most clusters contributed predominately to a single Liger cluster, and cells that clustered together in the data for each species (by separate analyses) tended to remain clustered together in the interspecies Liger analysis, suggesting that the integrated analysis preserved the structure present in the individual datasets. Consistent with the finer clustering in the previous study11 (they obtained 45 human interneuron clusters, whereas our marmoset data resolved to 22 clusters), several human clusters often contributed to a Liger cluster, whereas most marmoset clusters singly contributed to a Liger cluster. For example, Liger cluster 22 corresponds to a single marmoset cluster (cluster 1-11) and two distinct (but related) human clusters (Inh L1-2 PAX6 TNFAIP8L3 and Inh L1-2 PAX6 CDH12).
Extended Data Fig. 8 |. Interneuron distributions in cortex and hippocampus.
a, Left, smFISH for GAD1, LAMP5 and LHX6 in marmoset hippocampal layers (CA1/CA2 subfields; n = 2 biological replicates). Arrowhead indicates triple-positive cells; arrow indicates the LHX6− population. Top row, strata oriens (Str. Or) and strata pyramidale (Str. Py). Bottom row, strata lacunosum moleculare (LMol). Scale bars, 100 μm. Right, quantification of GAD1+LAMP5+LHX6+ (red) and GAD1+LAMP5+LHX6− (cyan) cells as a percentage of all GAD1+ cells in marmoset hippocampus (n = 446 GAD1+ cells counted) (compare to previously published mouse data39). Data are mean ± s.e.m.; dots represent biological replicates. b, smFISH for Gad1, Lamp5 and Lhx6 in mouse hippocampal layers (CA1; n = 2 biological replicates). c, Scatter plots of relative normalized gene expression (log10-transformed) across pairs of marmoset LAMP5 types in neocortex and hippocampus. Data from Fig. 3d; neocortical (n = 5,114 interneurons) and hippocampal (n = 1,589 interneurons). d, Scaled, normalized expression of select gene markers that distinguish the three main LAMP5+ types in marmoset.
Extended Data Fig. 9 |. Analysis of striatal interneurons.

a, Clustering of an additional dataset of 2,718 marmoset striatal interneurons (acquired using 10X 3′ Chromium v.3 chemistry) confirms the existence of the large TAC3+ population and reveals additional diversity within the main striatal interneuron clusters. The marmoset TAC3+ population comprises two subtypes; markers distinguishing between the two included SULF1, ASB18, ANGPT1 and PLCXD3 (note these are also expressed at varying levels in some of the other striatal interneuron types). This dataset also identified additional markers for the TAC3+ population as a whole relative to other striatal interneurons, such as genes that encode the extracellular matrix protein LTBP2, corticotropin-releasing hormone receptor 2 (CRHR2), the transcriptional repressor PRDM8 and α-1D adrenergic receptor (ADRA1D). b, Scatter plots showing gene expression (log10-transformed) between TAC3+ and PVALB+ or SST+ populations in marmoset striatum. Differentially expressed (>3-fold difference) neuropeptides and transcription factors are labelled. c, The analysis in Fig. 4a was repeated, but additionally included all mouse extra-striatal interneurons from a previous study15. For display, the t-SNE plot shows marmoset striatal interneurons (red), mouse striatal interneurons (blue) and any extra-striatal mouse interneuron that expressed Vip or Tac2 in the previously published dataset15 (grey). Circled cells indicate marmoset TAC3+ population. d, Liger integration of mouse and ferret striatal interneurons. Right, mouse interneurons in a mouse-only ICA-based t-SNE, with cells coloured according to their Liger clusters to confirm that clusters identified by Liger correspond meaningfully to clusters produced by a single-species analysis.
Extended Data Fig. 10 |. Cross-species patterns of gene expression within striatal interneurons.

a, individual species-based ICA clustering of ferret (10X 3′ v.3, n = 709 interneurons), mouse (Drop-seq, n = 2,166 interneurons), marmoset (10X 3′ v.3, n = 2,707 interneurons) and human (10X 3′ v.3, n = 1,509 interneurons) striatal datasets. Shades of blue are used to represent the diverse populations of ADARB2+ types (non-MGE+ types, including subpopulations of CCK+ types previously identified in mice42). b, Scaled expression of marker genes among the four most numerous striatal interneuron types that are conserved in all species examined (SST+, CHAT,+ TH+ and PVALB+ PTHLH+). Bars coloured according to scheme in a. The differential expression of CALB1 across species is one of the most marked examples observed of human-specific expression of a gene in a conserved cell type. c, Gene expression differences in human caudate interneurons between TAC3+ and PVALB+ (left) or TAC3+ and SST+ (right) populations. Neuropeptides (red), transcription factors (purple) and ion channels (yellow) are labelled. d, Data as in c, but instead highlighting genes that were differentially expressed in both marmoset and human (red, with gene symbols) or only in marmoset (blue).
Supplementary Material
Acknowledgements
This work was supported by the Broad Institute’s Stanley Center for Psychiatric Research, by Brain Initiative grant UO1MH114819 to G. Feng and S.A.M., by the Dean’s Innovation Award (Harvard Medical School) to G. Fishell and S.A.M., and by the Hock E. Tan and K. Lisa Yang Center for Autism Research at MIT, the Poitras Center for Psychiatric Disorders Research at MIT and the McGovern Institute for Brain Research at MIT (G. Feng) and the NINDS RO1NS032457 (C.A.W.). C.A.W. is an Investigator of the Howard Hughes Medical Institute. We thank R. Borges-Monroy for sharing the ferret transcriptome reference; M. W. Baldwin, A. D. Bell, S. Burger, C. Patil and R. L. Buckner for comments on manuscript drafts; C. Mayer for analysis advice; and C. Usher for assistance with manuscript preparation.
Footnotes
Competing interests The authors declare no competing interests.
Supplementary information is available for this paper at https://doi.org/10.1038/s41586-020-2781-z.
Online content
Any methods, additional references, Nature Research reporting summaries, source data, extended data, supplementary information, acknowledgements, peer review information; details of author contributions and competing interests; and statements of data and code availability are available at https://doi.org/10.1038/s41586-020-2781-z.
Reporting summary
Further information on research design is available in the Nature Research Reporting Summary linked to this paper.
Data availability
Sequencing data included in this manuscript are available at GEO (accession number, GSE151761); sample information is described in Supplementary Table 7. Processed sequencing files-including single-nucleus digital gene expression matrices for each region and cluster assignments for marmoset are available through the NIH’s Brain Research through Advancing Innovative Neurotechnologies (BRAIN) Initiative-Cell Census Network (BICCN) at https://biccn.org/. Processed data from all species can also be queried using an interactive web interface that we created (http://interneuron.mccarrolllab.org).
Code availability
Software and core computational analysis to align and process Drop-seq sequencing reads are freely available:https://github.com/broadinstitute/Drop-seq/releases. Published or publicly available algorithms are cited in the text and in Supplementary Table 8. Source code to reproduce the analysis on http://interneuron.mccarrolllab.org is available on the website. Other custom code is available on reasonable request from the corresponding authors.
References
- 1.Kumar S, Stecher G, Suleski M & Hedges SB TimeTree: a resource for timelines, timetrees, and divergence times. Mol. Biol. Evol 34, 1812–1819 (2017). [DOI] [PubMed] [Google Scholar]
- 2.Northcutt RG & Kaas JH The emergence and evolution of mammalian neocortex. Trends Neurosci. 18, 373–379 (1995). [DOI] [PubMed] [Google Scholar]
- 3.Laclef C & Métin C Conserved rules in embryonic development of cortical interneurons. Semin. Cell Dev. Biol 76, 86–100 (2018). [DOI] [PubMed] [Google Scholar]
- 4.Katz PS & Harris-Warrick RM The evolution of neuronal circuits underlying species-specific behavior. Curr. Opin. Neurobiol 9, 628–633 (1999). [DOI] [PubMed] [Google Scholar]
- 5.Herculano-Houzel S The remarkable, yet not extraordinary, human brain as a scaled-up primate brain and its associated cost. Proc. Natl Acad. Sci. USA 109, 10661–10668 (2012). [DOI] [PMC free article] [PubMed] [Google Scholar]
- 6.Kim Y et al. Brain-wide maps reveal stereotyped cell-type-based cortical architecture and subcortical sexual dimorphism. Cell 171, 456–469 (2017). [DOI] [PMC free article] [PubMed] [Google Scholar]
- 7.Barkan CL, Kelley DB & Zornik E Premotor neuron divergence reflects vocal evolution. J. Neurosci 38, 5325–5337 (2018). [DOI] [PMC free article] [PubMed] [Google Scholar]
- 8.Peng Y-R et al. Molecular classification and comparative taxonomics of foveal and peripheral cells in primate retina. Cell 176, 1222–1237 (2019). [DOI] [PMC free article] [PubMed] [Google Scholar]
- 9.Sousa AMM et al. Molecular and cellular reorganization of neural circuits in the human lineage. Science 358, 1027–1032 (2017). [DOI] [PMC free article] [PubMed] [Google Scholar]
- 10.Tosches MA et al. Evolution of pallium, hippocampus, and cortical cell types revealed by single-cell transcriptomics in reptiles. Science 360, 881–888 (2018). [DOI] [PubMed] [Google Scholar]
- 11.Hodge RD et al. Conserved cell types with divergent features in human versus mouse cortex. Nature 573, 61–68 (2019). [DOI] [PMC free article] [PubMed] [Google Scholar]
- 12.Tosches MA & Laurent G Evolution of neuronal identity in the cerebral cortex. Curr. Opin. Neurobiol 56, 199–208 (2019). [DOI] [PubMed] [Google Scholar]
- 13.Macosko EZ et al. Highly parallel genome-wide expression profiling of individual cells using nanoliter droplets. Cell 161, 1202–1214 (2015). [DOI] [PMC free article] [PubMed] [Google Scholar]
- 14.Florio M, Borrell V & Huttner WB Human-specific genomic signatures of neocortical expansion. Curr. Opin. Neurobiol 42, 33–44 (2017). [DOI] [PubMed] [Google Scholar]
- 15.Saunders A et al. Molecular diversity and specializations among the cells of the adult mouse brain. Cell 174, 1015–1030 (2018). [DOI] [PMC free article] [PubMed] [Google Scholar]
- 16.Duan ZRS et al. GABAergic restriction of network dynamics regulates interneuron survival in the developing cortex. Neuron 105, 75–92 (2020). [DOI] [PMC free article] [PubMed] [Google Scholar]
- 17.Džaja D, Hladnik A, Bičanić I, Baković M & Petanjek Z Neocortical calretinin neurons in primates: increase in proportion and microcircuitry structure. Front. Neuroanat 8, 103 (2014). [DOI] [PMC free article] [PubMed] [Google Scholar]
- 18.Tasic B et al. Shared and distinct transcriptomic cell types across neocortical areas. Nature 563, 72–78 (2018). [DOI] [PMC free article] [PubMed] [Google Scholar]
- 19.Kepecs A & Fishell G Interneuron cell types are fit to function. Nature 505, 318–326 (2014). [DOI] [PMC free article] [PubMed] [Google Scholar]
- 20.Batista-Brito R & Fishell G The developmental integration of cortical interneurons into a functional network. Curr. Top. Dev. Biol 87, 81–118 (2009). [DOI] [PMC free article] [PubMed] [Google Scholar]
- 21.Lui JH, Hansen DV & Kriegstein AR Development and evolution of the human neocortex. Cell 146, 18–36 (2011). [DOI] [PMC free article] [PubMed] [Google Scholar]
- 22.Mei L & Xiong W-C Neuregulin 1 in neural development, synaptic plasticity and schizophrenia. Nat. Rev. Neurosci 9, 437–452 (2008). [DOI] [PMC free article] [PubMed] [Google Scholar]
- 23.Welch JD et al. Single-cell multi-omic integration compares and contrasts features of brain cell identity. Cell 177, 1873–1887 (2019). [DOI] [PMC free article] [PubMed] [Google Scholar]
- 24.Wester JC et al. Neocortical projection neurons instruct inhibitory interneuron circuit development in a lineage-dependent manner. Neuron 102, 960–975 (2019). [DOI] [PMC free article] [PubMed] [Google Scholar]
- 25.Lodato S et al. Excitatory projection neuron subtypes control the distribution of local inhibitory interneurons in the cerebral cortex. Neuron 69, 763–779 (2011). [DOI] [PMC free article] [PubMed] [Google Scholar]
- 26.Sur M & Rubenstein JLR Patterning and plasticity of the cerebral cortex. Science 310, 805–810 (2005). [DOI] [PubMed] [Google Scholar]
- 27.Miller JA et al. Transcriptional landscape of the prenatal human brain. Nature 508, 199–206 (2014). [DOI] [PMC free article] [PubMed] [Google Scholar]
- 28.Hawrylycz MJ et al. An anatomically comprehensive atlas of the adult human brain transcriptome. Nature 489, 391–399 (2012). [DOI] [PMC free article] [PubMed] [Google Scholar]
- 29.Nowakowski TJ et al. Spatiotemporal gene expression trajectories reveal developmental hierarchies of the human cortex. Science 358, 1318–1323 (2017). [DOI] [PMC free article] [PubMed] [Google Scholar]
- 30.Margulies DS et al. Situating the default-mode network along a principal gradient of macroscale cortical organization. Proc. Natl Acad. Sci. USA 113, 12574–12579 (2016). [DOI] [PMC free article] [PubMed] [Google Scholar]
- 31.Krienen FM, Yeo BTT, Ge T, Buckner RL & Sherwood CC Transcriptional profiles of supragranular-enriched genes associate with corticocortical network architecture in the human brain. Proc. Natl Acad. Sci. USA 113, E469–E478 (2016). [DOI] [PMC free article] [PubMed] [Google Scholar]
- 32.Tasic B et al. Adult mouse cortical cell taxonomy revealed by single cell transcriptomics. Nat. Neurosci 19, 335–346 (2016). [DOI] [PMC free article] [PubMed] [Google Scholar]
- 33.Rudy B, Fishell G, Lee S & Hjerling-Leffler J Three groups of interneurons account for nearly 100% of neocortical GABAergic neurons. Dev. Neurobiol 71, 45–61 (2011). [DOI] [PMC free article] [PubMed] [Google Scholar]
- 34.Hladnik A, Džaja D, Darmopil S, Jovanov-Miloţević N & Petanjek Z Spatio-temporal extension in site of origin for cortical calretinin neurons in primates. Front. Neuroanat 8, 50 (2014). [DOI] [PMC free article] [PubMed] [Google Scholar]
- 35.Mayer C et al. Developmental diversification of cortical inhibitory interneurons. Nature 555, 457–462 (2018). [DOI] [PMC free article] [PubMed] [Google Scholar]
- 36.Tricoire L et al. Common origins of hippocampal Ivy and nitric oxide synthase expressing neurogliaform cells. J. Neurosci 30, 2165–2176 (2010). [DOI] [PMC free article] [PubMed] [Google Scholar]
- 37.Nóbrega-Pereira S et al. Postmitotic Nkx2-1 controls the migration of telencephalic interneurons by direct repression of guidance receptors. Neuron 59, 733–745 (2008). [DOI] [PMC free article] [PubMed] [Google Scholar]
- 38.Jakovcevski I, Mayer N & Zecevic N Multiple origins of human neocortical interneurons are supported by distinct expression of transcription factors. Cereb. Cortex 21, 1771–1782 (2011). [DOI] [PMC free article] [PubMed] [Google Scholar]
- 39.Tricoire L et al. A blueprint for the spatiotemporal origins of mouse hippocampal interneuron diversity. J. Neurosci 31, 10948–10970 (2011). [DOI] [PMC free article] [PubMed] [Google Scholar]
- 40.Buckner RL & Krienen FM The evolution of distributed association networks in the human brain. Trends Cogn. Sci 17, 648–665 (2013). [DOI] [PubMed] [Google Scholar]
- 41.Florio M et al. Human-specific gene ARHGAP11B promotes basal progenitor amplification and neocortex expansion. Science 347, 1465–1470 (2015). [DOI] [PubMed] [Google Scholar]
- 42.Muñoz-Manchado AB et al. Diversity of interneurons in the dorsal striatum revealed by single-cell RNA sequencing and PatchSeq. Cell Rep. 24, 2179–2190 (2018). [DOI] [PMC free article] [PubMed] [Google Scholar]
- 43.Graveland GA & DiFiglia M The frequency and distribution of medium-sized neurons with indented nuclei in the primate and rodent neostriatum. Brain Res. 327, 307–311 (1985). [DOI] [PubMed] [Google Scholar]
- 44.Arendt D et al. The origin and evolution of cell types. Nat. Rev. Genet 17, 744–757 (2016). [DOI] [PubMed] [Google Scholar]
- 45.Zeng H & Sanes JR Neuronal cell-type classification: challenges, opportunities and the path forward. Nat. Rev. Neurosci 18, 530–546 (2017). [DOI] [PubMed] [Google Scholar]
- 46.Huang ZJ & Paul A The diversity of GABAergic neurons and neural communication elements. Nat. Rev. Neurosci 20, 563–572 (2019). [DOI] [PMC free article] [PubMed] [Google Scholar]
- 47.Oláh S et al. Regulation of cortical microcircuits by unitary GABA-mediated volume transmission. Nature 461, 1278–1281 (2009). [DOI] [PMC free article] [PubMed] [Google Scholar]
- 48.Xu X et al. Species and cell-type properties of classically defined human and rodent neurons and glia. eLife 7, e37551 (2018). [DOI] [PMC free article] [PubMed] [Google Scholar]
- 49.Miyoshi G et al. Genetic fate mapping reveals that the caudal ganglionic eminence produces a large and diverse population of superficial cortical interneurons. J. Neurosci 30, 1582–1594 (2010). [DOI] [PMC free article] [PubMed] [Google Scholar]
- 50.Paxinos G, Watson C, Petrides M, Rosa M & Tokuno H The Marmoset Brain in Stereotaxic Coordinates (Elsevier, 2012). [Google Scholar]
- 51.Lek M et al. Analysis of protein-coding genetic variation in 60,706 humans. Nature 536, 285–291 (2016). [DOI] [PMC free article] [PubMed] [Google Scholar]
- 52.Choi HMT et al. Third-generation in situ hybridization chain reaction: multiplexed, quantitative, sensitive, versatile, robust. Development 145, dev165753 (2018). [DOI] [PMC free article] [PubMed] [Google Scholar]
- 53.Rawlins EL, Clark CP, Xue Y & Hogan BLM The Id2+ distal tip lung epithelium contains individual multipotent embryonic progenitor cells. Development 136, 3741–3745 (2009). [DOI] [PMC free article] [PubMed] [Google Scholar]
- 54.He M et al. Strategies and tools for combinatorial targeting of GABAergic neurons in mouse cerebral cortex. Neuron 91, 1228–1243 (2016). [DOI] [PMC free article] [PubMed] [Google Scholar]
- 55.Madisen L et al. Transgenic mice for intersectional targeting of neural sensors and effectors with high specificity and performance. Neuron 85, 942–958 (2015). [DOI] [PMC free article] [PubMed] [Google Scholar]
- 56.Schuman B et al. Four unique interneuron populations reside in neocortical layer 1. J. Neurosci. 39, 125–139 (2019). [DOI] [PMC free article] [PubMed] [Google Scholar]
Associated Data
This section collects any data citations, data availability statements, or supplementary materials included in this article.