Abstract
Objective:
The dissemination of mitral valve repair as the first line treatment and the introduction of MitraClip for patients who have a prohibitive risk for surgery has changed the landscape of mitral valve intervention. The aim of this study is to provide current and generalizable data regarding the trend of mitral valve interventions and outcomes from 2000-2016.
Methods:
Patients ≥18 years of age who underwent mitral valve interventions were identified using the National Inpatient Sample database. National estimates were generated by means of discharge weights; comorbid conditions were identified using Elixhauser methods. All trends were analyzed with JoinPoint software.
Results:
A total of 656,030 mitral valve interventions (298,102 mitral valve replacement, 349,053 mitral valve repair, and 8,875 MitraClip) were assessed. No changes in rate of procedures (per 100,000 people in the US) were observed over this period (annual percent change=−0.4, 95% CL −1.1 to 0.3, P=0.3). From 2000-2010, the number of replacements decreased by 5.6% per year (P<0.001), while repair increased by 8.4% per year from 2000-2006 (P<0.001) MitraClip procedures increased by 84.4% annually from 2013-2016 (P<0.001). The burden of comorbidities increased throughout the study for all groups, with the highest score for MitraClip recipients. Overall, length of stay has decreased for all interventions, most significantly for MitraClip. In-hospital mortality decreased from 8.5% to 3.7% for all interventions with MitraClip having the most substantial decrease from 3.6% to 1.5%.
Conclusion:
Over a seventeen-year period, mitral valve interventions were associated with improved outcomes despite being applied to an increasingly sicker population.
GRAPHICAL ABSTRACT
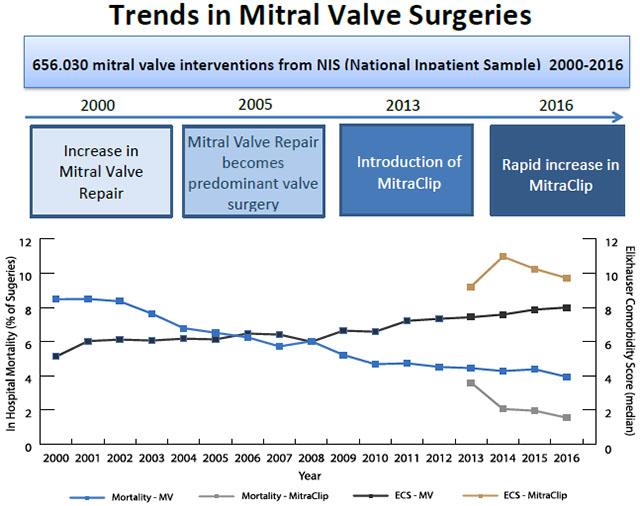
The landscape of mitral valve surgeries has changed over time and will continue to change with the introduction of MitraClip. Moreover, the patients undergoing mitral valve surgeries have changed as well. Patients undergoing surgery in 2016 are sicker with higher comorbidity burden than patients undergoing surgery in 2000. Despite this however, outcomes from surgeries (LOS and mortality) are better for all mitral valve surgeries.
MV = mitral valve; ECS = Elixhauser Comorbidity Score
INTRODUCTION
Valvular heart disease affects 1.8% of the United States population, with disorders of the mitral valve (MV) being the most common. (1) Treatment for severe or symptomatic mitral regurgitation (MR) was originally done by mitral valve replacement (MVR). Mitral valve repair (MVr) was first reported by Lillehei in 1957 and the intervention was substantially improved upon by Carpentier in 1983. (2) Currently, MVr is recommended as the first line of therapy for those with MR. (3–5) Evidence supporting the use of MVr showed superior short-term outcomes compared to MVR, although some studies suggest no long-term difference. (6, 7) The incidence of MV disease increases from 0.5% before 44 years of age to 9.3% after 75 years of age. (1) Given the significant age and comorbidities of the patients affected by MR, surgery may not be an option for some patients. (1) Therefore, there is a large clinical need for new treatment modalities. In 2013, the Food and Drug Administration (FDA) approved the MitraClip (Clip Delivery System) for patients with primary MR determined to be at prohibitive risk for mitral valve surgery. MitraClip is a percutaneous treatment that delivers a clip to approximate the leaflets to reduce MR. In a high surgical risk cohort, it has been shown to decrease MR, improve clinical symptoms, and decrease left ventricle dimensions. (8) MitraClip is currently the only FDA approved percutaneous mitral valve repair device. The aim of this study is to determine the trends in MV interventions overall, stratified by type, and to elucidate the trends in patient outcomes from 2000 through 2016.
METHODS
Database
Data was extracted from the National Inpatient Sample dataset (NIS), which is part of the Healthcare Cost and Utilization Project (HCUP), sponsored by the Agency for Healthcare Research and Quality (AHRQ). The number of states participating in the NIS database has increased from 28 in 2000 to 44 in 2016. Prior to 2012, the NIS was a 20% stratified sample of nonfederal U.S. hospitals which included 100% of those discharges. Starting in 2012, the NIS represents a 20% stratified sample of discharges from all U.S. community hospitals from states participating in NIS. It is the largest publicly available all-payer inpatient health care database in the United States and includes ~7 million hospitalizations per year. We included all mitral valve procedure discharges that occurred between January 1st, 2000 and December 31st, 2016. The institutional review board determined that this study was exempted from human research review.
Patient Population
All patients, 18 years or older, undergoing MVR, MVr, or MitraClip were identified using ICD-9 (January 1st, 2000 through September 30th, 2015) or ICD-10 (October 1st, 2015 through December 31st, 2016) procedure codes listed in Supplemental Table 1. Patients diagnosed with endocarditis or mitral stenosis were excluded. Comorbid conditions were identified using Elixhauser methods as recommended for analysis of the NIS database. A single comorbidity score (CS) was calculated from individual comorbidities based on a prior published algorithm. (10, 11) Concomitant procedures were determined using the ICD-9 and ICD-10 diagnosis and procedure codes listed in Supplemental Table 1. (12) Severity of illness subclass and risk of mortality subclass were included in All Patient Refined Diagnosis Related Groups (APR-DRGs), a severity measure developed using software from 3M Health Information Systems. APR-DRGs were not available for NIS prior to 2002.
Statistical Analysis
Statistical Analysis System (SAS V9.4, SAS Institute Inc., Cary, NC, US) was used for all data extraction and analysis including the SAS survey procedures to control for the complex sampling design. National estimates were generated using discharge trend weights, provided by HCUP, and controlling for stratification and cluster (hospital) variables. To account for changes in NIS design, NIS discharge trend weights were used as recommended. (9, 13) No hospital or state level analysis was performed on the combined dataset due to the redesign of the NIS in 2012. (9) Geographic variation was reported by census regions. Census divisions, were combined into four census regions to be consistent with prior to redesign version of NIS (13).
We described the sample using univariate and bivariate analyses. Continuous variables were presented as mean ± 95% confidence limits (CL) or median [interquartile range (IQR)] while categorical variables were expressed as percentages. Analysis of variance (ANOVA) was used for continuous variables and the Rao-Scott chi-square test was used for categorical variables. Statistical significance was set at 0.05. To account for changes in patients’ baseline characteristics during the study period, a survey logistic regression model was fit with in-hospital mortality as the outcome. Year of intervention, age, sex, admission urgency, comorbidity score, and concomitant procedures were included as covariates in this model. As a confirmatory analysis the weighted multilevel model for survey data was fit using the Glimmix procedure (14). Additionally, we performed a subgroup analysis of isolated mitral replacement, mitral repair and MitraClip. The JoinPoint trend analysis software, developed by the National Cancer Institute, was used to analyze trends over time and to calculate annual percent change (APC).
RESULTS
Patient Characteristics
From 2000 to 2016, a total of 701,032 mitral interventions were performed. After exclusion of endocarditis and stenosis cases, 656,030 (298,102 MVR, 349,053 MVr, and 8,875 MitraClip) MV interventions were identified nationally (Table 1). No changes in rate of procedures (per 100,000 people in the US age 18 and older) were observed for this time period (APC=−0.4, 95% CL −1.1 to 0.3, P=0.3). Similar mean ages were observed in the MVR and MVr groups (66.0 and 64.8, respectively), while the mean age of patients undergoing MitraClip was higher (77.3, P<0.001). Females comprised the majority of MVR surgeries but only the minority of MVr and MitraClip procedures; all three groups were predominantly white. The majority of all three interventions were done during elective admissions. Baseline comorbidities differed between the three groups, as shown in Table 1. Patients undergoing MitraClip were sicker with a median CS score of 10.1, compared to 6.8 in the MVR group and 6.2 in the MVr group (P<0.001). By contrast, MVR appears to comprise patients with the highest degree of severity of illness (SOI) and risk of mortality (ROM).
Table 1.
Baseline Characteristics of Patients Who Underwent Mitral Valve Intervention from 2000 through 2016 by Procedure Type
| MVR (N=298102) | MVr (N=349053) | MitraClip (N=8875) | p | |
|---|---|---|---|---|
| Age (Years), Mean [95% CI] | 64.7 [64.5-65.0] | 64.4 [64.2-64.7] | 77.0 [76.4-77.6] | <.001 |
| Gender (%) | <.001 | |||
| Male | 45.8 | 59.1 | 52.8 | |
| Female | 54.2 | 40.9 | 47.2 | |
| Race (%) | <.001 | |||
| White | 63.0 | 66.1 | 72.7 | |
| Black | 7.7 | 6.5 | 7.0 | |
| Hispanic | 5.7 | 4.3 | 5.5 | |
| Asian/Pacific Islander | 2.3 | 2.1 | 2.8 | |
| Native American | 0.4 | 0.4 | 0.6 | |
| Other | 2.9 | 2.7 | 3.1 | |
| Missing | 18.1 | 18 | 8.3 | |
| Comorbid Conditions* (%) | ||||
| Rheumatic Heart Disease | 31.2 | 16.6 | 9.6 | <.001 |
| Congestive Heart Failure | 51 | 44.5 | 69.9 | <.001 |
| Hypertension | 48.4 | 51.3 | 66.3 | <.001 |
| Peripheral Vascular Disease | 7.1 | 7.1 | 12.5 | <.001 |
| Chronic Lung Disease | 21.3 | 17 | 26.3 | <.001 |
| Pulmonary Circulatory Disease | 24 | 17.4 | 33.5 | <.001 |
| Diabetes Mellitus | 14.4 | 14.3 | 17.6 | 0.002 |
| Diabetes Mellitus with Complication | 3.3 | 3.3 | 6.8 | <.001 |
| Obesity | 7.9 | 7.6 | 8.8 | 0.12 |
| Liver Disease | 1.4 | 1.1 | 2.6 | <.001 |
| Chronic Kidney Disease | 11.2 | 10.1 | 35.6 | <.001 |
| Anemia | 12.7 | 12.5 | 21.1 | <.001 |
| Neurologic Disease | 3.7 | 3.1 | 4.3 | <.001 |
| Hypothyroidism | 9.3 | 8.2 | 17.8 | <.001 |
| Rheumatoid Arthritis | 2.5 | 1.9 | 4.2 | <.001 |
| Alcohol Abuse | 1.5 | 1.8 | 1 | <.001 |
| Drug Abuse | 1 | 0.9 | 0.6 | 0.01 |
| Depression | 4.7 | 4.4 | 6.8 | <.001 |
| Elixhauser Comorbidity Score, Median [IQR] | 6.8 [2.6-11.5] | 6.2 [0.8-10.5] | 10.1 [6.2-14.3] | <.001 |
| Type of Admission (%) | ||||
| Elective | 61.4 | 66.8 | 75.9 | <.001 |
| Emergent/Urgent | 38.6 | 33.2 | 24.1 | |
| Type of Procedures (%) | ||||
| Isolate Mitral Valve | 49.6 | 47.7 | 100 | |
| Concomitant CABG | 28.5 | 34 | 0 | <.001 |
| Concomitant Aortic Valve Replacement | 11.8 | 8.6 | 0 | <.001 |
| Concomitant CABG and AVR | 5.6 | 5.5 | 0 | |
| Concomitant Tricuspid Valve Replacement | 0.2 | 0.3 | 0 | <.001 |
| Concomitant Procedures on the Aorta | 1.4 | 2 | 0 | <.001 |
| Severity of Illness (2002-2016*) (%) | ||||
| Minor | 0 | 23.6 | 1.3 | <.001 |
| Moderate | 23.3 | 10.6 | 52.1 | |
| Major | 47.3 | 43.7 | 36.4 | |
| Extreme | 29.4 | 22.1 | 10.3 | |
| Risk of Mortality (2002-2016*) (%) | ||||
| Minor | 0.1 | 17.8 | 7.4 | <.001 |
| Moderate | 47.2 | 37.9 | 46.3 | |
| Major | 30.7 | 27.6 | 36.1 | |
| Extreme | 21.9 | 16.6 | 10.3 | |
| Observed Outcomes | ||||
| LOS (Days), Median [IQR] | 9.7 [6.4-15.9] | 7.6 [5.0-12.9] | 2.2 [0.9-5.0] | <.001 |
| Died During Hospitalization (%) | 7.8 | 4.2 | 1.7 | <.001 |
| Isolated procedure | ||||
| LOS (Days), Median [IQR] | 8.3 [5.7-13.7] | 5.9 [4.2-8.9] | 2.2 [0.9-5.0] | |
| Died During Hospitalization (%) | 5.0 | 1.7 | 1.8 | <.001 |
Data was not available prior to 2002.
MVR = mitral valve replacement; MVr = mitral valve repair; CABG = coronary artery bypass surgery
Trends in Interventions
The composition of MV interventions changed significantly over time. From 2000-2010, the proportion of MVR decreased an average of 5.6% per year (P<0.001), which stabilized post 2010 (Figure 1), while MVr had an average increase of 8.4% per year from 2000-2006 (P<0.001) at which point it then stabilized (APC=−1.6, 95% CL −3.5 to 0.4, P=0.01). However, the proportion of MVR began to increase in 2008 when stratifying by concomitant CABG (APC=2.9, P<0.001) (Supplemental Figure 1). MitraClip showed the most dramatic increase among all MV interventions; from FDA approval in 2013 to 2016, MitraClip procedures as a proportion of MV surgeries increased an average of 84.4% annually (P<.001).
Figure 1.
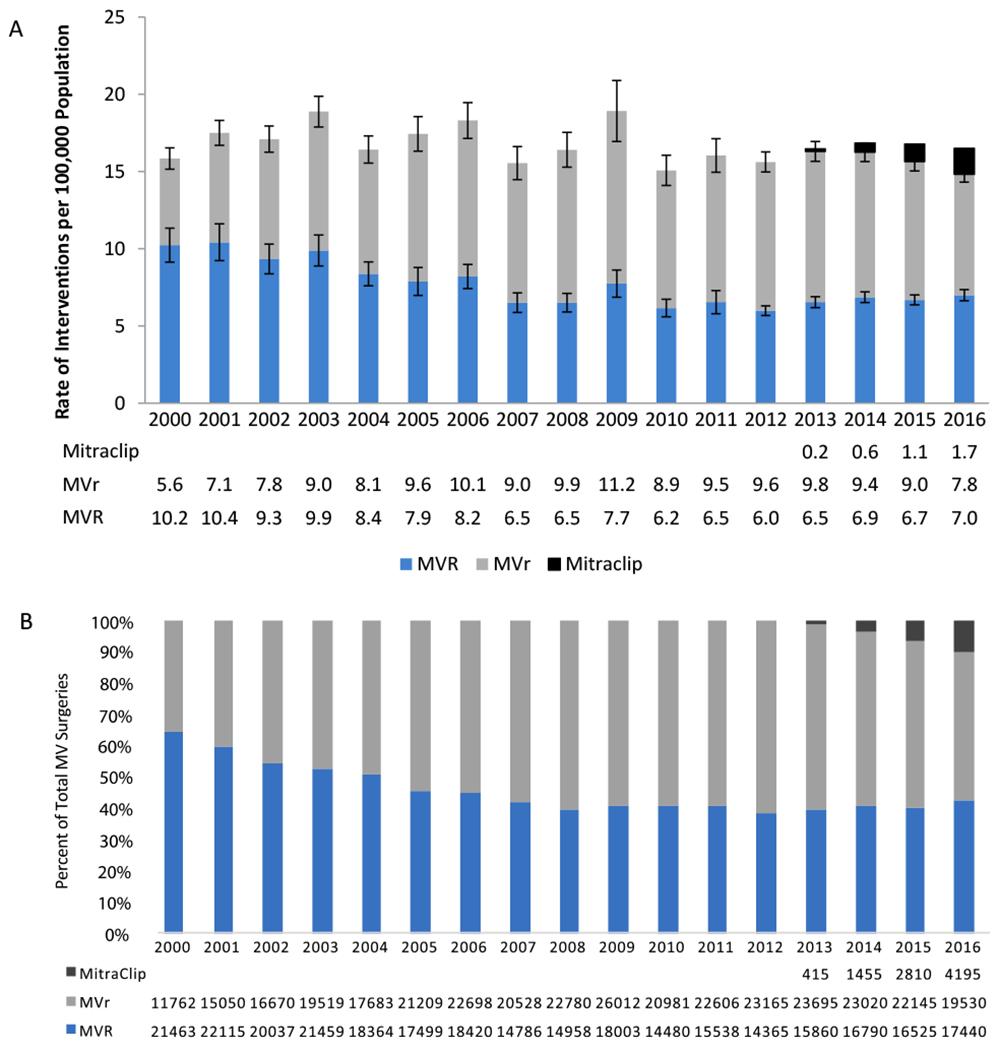
Trends in Mitral Valve Interventions from 2000-2016. A – Rate of Mitral Valve Interventions per 100,000 US Population Age 18 and Older. B - Distribution of Mitral Valve Interventions.
The number of MVR surgeries decreased an average 5.1% per year from 2000-2010 (P<0.001) and then stabilized (APC=1.4, 95% CL [−2.5 to 5.5], P=0.5), while the number of MVr surgeries increased an average 8.4% per year from 2000-2006 (P<0.001) and then stabilized (APC=−1.6, 95% CL [−3.5 to 0.4], P=0.1). The number of MitraClip procedures increased an average 79.8% per year from its introduction in 2013 to 2016 (P<0.001). However, the total number of surgeries did not significantly change (average 0.4% change per year, P=0.3).
Trends in Patient Characteristics
The burden of comorbidities for patients undergoing MV interventions increased from 2000 to 2016 (Table 2). Median CS for the entire cohort increased by 0.5 points per year from 2000-2002 (P=0.03) and 0.3 points per year from 2009-2016 (P<0.001) (Figure 2). Moreover, the severity of disease as reflected by the ROM also increased (Figure 3). Among patients who received MVR, the proportion classified as having “moderate” ROM decreased (APC=−4.3, P<0.001) while those classified as “major” ROM increased (APC=2.9, P<0.001). Change in ROM was even greater in the MVr group, where the proportion of patients with “minor” or “moderate” ROM decreased (APC=−3.0, P<0.001; APC=−3.4, P<0.001; respectively), while the APC of patients with “major” or “extreme” ROM increased (APC=3.7, P<0.001; APC=8.7, P<0.001; respectively).
Table 2.
Changes in Baseline Characteristics, Length of Stay, and In-hospital Mortality of Patients Who Underwent Mitral Valve Intervention from 2000 through 2016 by Procedure Type and Time Periods
| MVR | P | MVr | P | MitraClip | ||||||
|---|---|---|---|---|---|---|---|---|---|---|
| 2000-2005 (N=120938) | 2006-2011 (N=96186) | 2012-2016 (N=80980) | 2000-2005 (N=101893) | 2006-2011 (N=135605) | 2012-2016 (N=111555) | 2013-2016 (N=8875) | ||||
| Age (Years), Mean [95% CI] | 66.0 [65.6-66.4] | 65.9 [65.5-66.3] | 66.2 [66.0-66.4] | 0.05 | 64.6 [64.1-65.1] | 64.8 [64.5-65.2] | 64.8 [64.6-65.0] | 0.09 | 77.3 [76.7-77.9] | |
| Gender(%) | ||||||||||
| Male | 45.8 | 45.0 | 46.6 | 0.02 | 57.4 | 59.0 | 60.7 | <.001 | 52.8 | |
| Female | 54.2 | 55.0 | 53.4 | 42.6 | 41.0 | 39.3 | 47.2 | |||
| Race (%) | <.001 | 0.001 | ||||||||
| White | 60.1 | 60.9 | 69.8 | 59.7 | 63.4 | 75.2 | 72.7 | |||
| Black | 6.0 | 7.7 | 10.3 | 5.0 | 6.7 | 7.6 | 7.0 | |||
| Hispanic | 4.5 | 6.0 | 7.0 | 3.8 | 4.5 | 4.6 | 5.5 | |||
| Asian/Pacific Islander | 1.6 | 2.5 | 3.3 | 1.7 | 2.0 | 2.6 | 2.8 | |||
| Native American | 0.2 | 0.5 | 0.4 | 0.1 | 0.7 | 0.2 | 0.6 | |||
| Other | 2.5 | 2.9 | 3.3 | 2.2 | 2.5 | 3.3 | 3.1 | |||
| Missing | 25.1 | 19.5 | 8.9 | 27.5 | 20.3 | 11.6 | 8.4 | |||
| Clinical History (%) | ||||||||||
| Rheumatic Heart Disease | 29.6 | 31.4 | 33.3 | <.001 | 15.7 | 16.5 | 17.5 | 0.02 | 9.6 | |
| Congestive Heart Failure | 48.9 | 51.4 | 53.6 | <.001 | 44.4 | 44.6 | 44.4 | 0.07 | 69.9 | |
| Hypertension | 40.3 | 50.6 | 58.0 | <.001 | 42.8 | 52.6 | 57.5 | <.001 | 66.3 | |
| Peripheral Vascular Disease | 5.2 | 7.3 | 9.6 | <.001 | 5.8 | 7.7 | 7.5 | <.001 | 12.5 | |
| Chronic Lung Disease | 20.5 | 21.2 | 22.4 | 0.002 | 17.2 | 17.6 | 16.1 | 0.03 | 26.3 | |
| Pulmonary Circulatory Disease | 18.7 | 24.6 | 31.4 | <.001 | 12.9 | 17.1 | 21.9 | <.001 | 33.5 | |
| Diabetes Mellitus | 12.7 | 15.6 | 15.3 | <.001 | 14.0 | 15.2 | 13.4 | 0.001 | 17.6 | |
| Diabetes Mellitus with Complication | 2.2 | 2.4 | 5.9 | <.001 | 2.7 | 2.7 | 4.4 | <.001 | 6.8 | |
| Obesity | 3.8 | 7.8 | 14.0 | <.001 | 3.7 | 7.2 | 11.7 | <.001 | 8.8 | |
| Liver Disease | 1.0 | 1.4 | 2.0 | <.001 | 0.8 | 1.0 | 1.4 | <.001 | 2.6 | |
| Chronic Kidney Disease | 5.1 | 13.6 | 17.4 | <.001 | 4.8 | 11.6 | 13.1 | <.001 | 35.6 | |
| Anemia | 9.6 | 15.2 | 14.4 | <.001 | 9.4 | 14.5 | 12.8 | <.001 | 21.1 | |
| Neurologic Disease | 3.1 | 3.2 | 5.1 | <.001 | 2.3 | 2.8 | 4.2 | <.001 | 4.3 | |
| Hypothyroidism | 7.1 | 9.5 | 12.3 | <.001 | 6.2 | 8.2 | 10.1 | <.001 | 17.8 | |
| Rheumatoid Arthritis | 1.9 | 2.5 | 3.2 | <.001 | 1.5 | 1.8 | 2.5 | <.001 | 4.2 | |
| Alcohol Abuse | 1.1 | 1.6 | 1.9 | <.001 | 1.5 | 1.8 | 2.2 | <.001 | 1.0 | |
| Drug Abuse | 0.7 | 1.0 | 1.5 | <.001 | 0.6 | 0.8 | 1.1 | <.001 | 0.6 | |
| Depression | 2.9 | 4.7 | 7.2 | <.001 | 2.7 | 4.4 | 5.9 | <.001 | 6.8 | |
| Elixhauser Comorbidity Score, Median [IQR] | 6.2 [0.5-9.9] | 7.0 [2.9-11.7] | 9.3 [4.5-14.2] | <.001 | 5.0 [−0.2-9.2] | 6.2 [1.1-10.6] | 6.9 [2.6-11.8] | <.001 | 10.1 [6.2-14.3] | |
| Type of Surgery | ||||||||||
| Elective | 58.8 | 60.8 | 65.8 | <.001 | 61.6 | 66.3 | 72.3 | <.001 | 75.9 | |
| Non-Elective | 41.2 | 39.2 | 34.2 | 38.4 | 33.7 | 27.7 | 24.1 | |||
| Type of Procedures (%) | ||||||||||
| Isolate Mitral Valve | 47.4 | 49.1 | 53.5 | <.001 | 41.8 | 46.1 | 55.1 | <.001 | ||
| Concomitant CABG | 33.3 | 27.3 | 22.6 | <.001 | 42.0 | 34.3 | 26.4 | <.001 | 0.0 | |
| Concomitant Aortic Valve Replacement | 10.3 | 12.1 | 13.7 | 0.02 | 7.3 | 9.0 | 9.4 | <.001 | 0.0 | |
| Concomitant CABG and AVR | 5.7 | 5.9 | 5.1 | <.001 | 5.5 | 6.3 | 4.6 | <.001 | ||
| Concomitant Tricuspid Valve Replacement | 0.0 | 0.1 | 0.5 | <.001 | 0.3 | 0.3 | 0.2 | 0.39 | 0.0 | |
| Concomitant Procedures on the Aorta | 0.9 | 1.4 | 2.0 | <.001 | 1.5 | 2.1 | 2.2 | <.001 | 0.0 | |
| Severity of Illness (2002-2016)* | ||||||||||
| Minor | 0.0 | 0.0 | 0.2 | <.001 | 29.3 | 23.3 | 8.3 | <.001 | 1.3 | |
| Moderate | 29.2 | 18.7 | 22.9 | 10.3 | 7.2 | 30.1 | 52.1 | |||
| Major | 48.0 | 46.8 | 47.4 | 43.0 | 43.9 | 45.1 | 36.4 | |||
| Extreme | 22.8 | 34.4 | 29.5 | 17.4 | 25.6 | 16.5 | 10.3 | |||
| Risk of Mortality (2002-2016)* | ||||||||||
| Minor | 0.1 | 0.1 | 0.1 | <.001 | 20.3 | 16.3 | 19.1 | <.001 | 7.4 | |
| Moderate | 56.0 | 43.8 | 32.2 | 42.8 | 36.2 | 33.5 | 46.3 | |||
| Major | 27.5 | 31.5 | 38.2 | 24.2 | 29.0 | 30.7 | 36.1 | |||
| Extreme | 16.3 | 24.6 | 29.5 | 12.7 | 18.6 | 16.7 | 10.3 | |||
| Outcomes | ||||||||||
| LOS (Days), Median [IQR] | 9.7 [6.4-15.9] | 9.8 [6.5-16.3] | 9.3 [6.2-15.5] | <.001 | 8.1 [5.3-13.7] | 7.8 [5.2-13.2] | 6.9 [4.7-11.7] | <.001 | 2.2 [0.9-5.0] | |
| In-hospital mortality (%) | 9.1 | 7.5 | 6.3 | <.001 | 6.0 | 4.0 | 2.9 | <.001 | 1.9 | |
| Isolated procedure | ||||||||||
| LOS (Days), Median [IQR] | 8.4 [5.7-13.7] | 8.4 [5.8-13.9] | 8.0 [5.7-13.3] | <.001 | 6.1 [4.3-9.4] | 6.0 [4.3-9.1] | 5.7 [4.1-8.5] | <0.001 | ||
| In-hospital mortality (%) | 5.9 | 4.9 | 4 | <0.001 | 2.5 | 1.6 | 1.3 | <0.001 | ||
Data was not available prior to 2002.
MVR = mitral valve replacement; MVr = mitral valve repair; CABG = coronary artery bypass surgery
Figure 2.
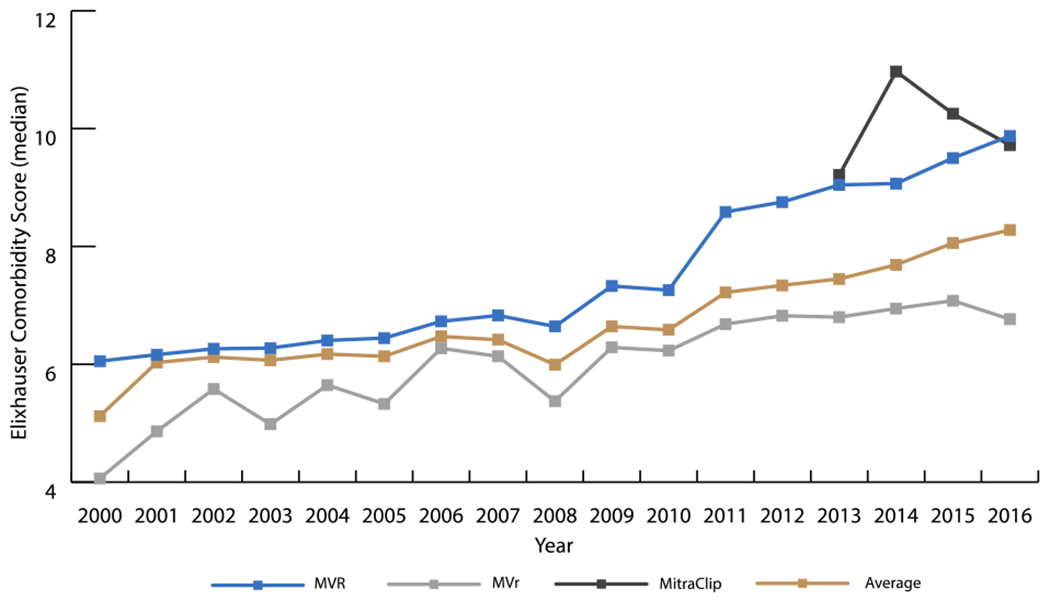
Trends in Median Elixhauser Comorbidity Score from 2000-2016
The Elixhauser Comorbidity Score (CS) for patients undergoing MVR increased 0.1 points per year from 2000-2008 (P<0.001) and 0.4 points per year from 2009-2016 (P<0.001). In patients receiving MVr, the CS increased 0.2 points per year from 2000-2016 (P<0.001). In the MitraClip group, the CS trended toward increasing 0.1 points per year from 2013-2016 (P=0.86). The median CS for the cohort increased 0.5 points per year from 2000-2002 (P=0.03) and 0.3 points per year from 2009-2016 (P<0.001).
MVR = mitral valve replacement; MVr = mitral valve repair
Figure 3.
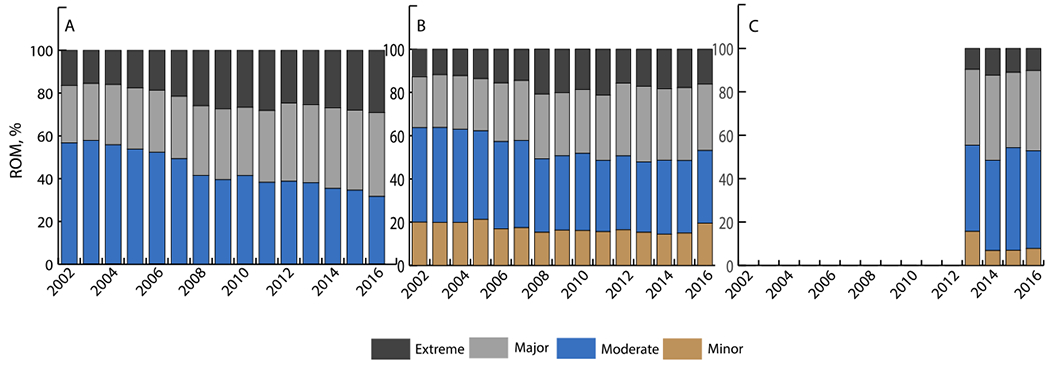
Distribution of Risk of Mortality (Based on APR-DRG) for Patients Undergoing Mitral Valve Intervention from 2002-2016 A – Mitral Valve Replacement; B – Mitral Valve Repair; C – MitraClip
A: The proportion of MVR patients classified as having a “moderate” risk of mortality decreased 4.3% per year (P<0.001) while the proportion of patients classified as having a “major” risk of mortality increased 2.9% per year (P<0.001).
MVR = mitral valve replacement
B: The proportion of MVr patients with “minor” or “moderate” risk of mortality decreased 3.0% and 3.4% per year, respectively (P<0.001 for both), while the percentage of patients with “major” or “extreme” risk of mortality increased 3.7% and 8.7% per year, respectively (P<0.001 for both).
MVr = mitral valve repair
C: The proportion of patients with an “extreme” risk of mortality decreased 5.1% per year (P=0.4).
Trends in Outcomes
Length of stay (LOS) (Figure 4) and in hospital mortality (Figure 5) after MV interventions improved over time. Overall, in-hospital mortality decreased from 8.5% to 3.7% for procedures. LOS for interventions decreased from 8.8 days to 7.0 days. Albeit MVR was associated with the longest LOS and highest mortality rate, the median LOS (2008-2016) decreased an average of 0.13 days per year (P<0.001) and the mortality rate (2000-2016) decreased as well (APC=−3.3, P<0.001). MVr had consistently better performance measures than MVR, with the median LOS decreasing an average 0.15 days per year (2005-2016) (P<0.001) and the mortality rate decreasing from 2000-2016 (APC=−6.3, P<0.001). MitraClip recipients’ LOS decreased from a median of 4.0 days in 2013 to a median of 1.8 days in 2016 (decreased an average 0.85 days/year, P=0.03). In hospital mortality for MitraClip in 2013 was higher than MVr (3.6% versus 3.2%) but has decreased annually to 1.5% in 2016, which is 0.7% lower than MVr. In-hospital mortality for isolated procedures decreased from 5.9% to 4% for MVR, and from 2.5% to 1.3% for MVr during the periods 2000-2005 and 2012-2016, respectively. Concurrently, median LOS decreased from 8.4 to 8 days for MVR and 6.1 to 5.7 days for MVr (Table 2).
Figure 4.
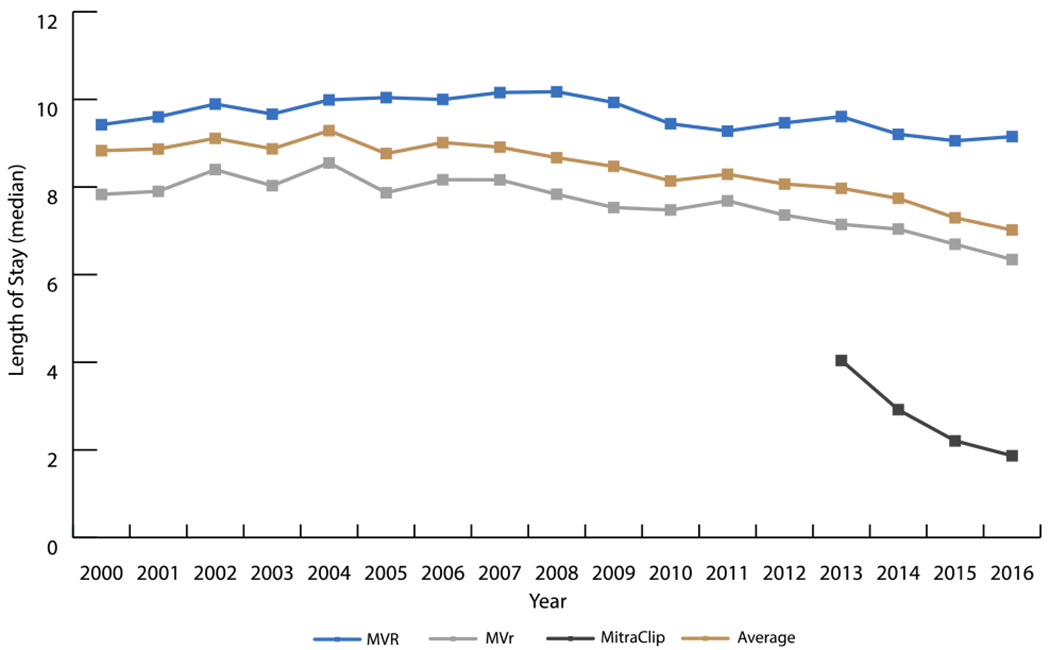
Trends in Median Length of Stay from 2000-2016
The median length of stay (LOS) for MVR patients decreased 0.13 days per year from 2008 to 2016 (P<0.001). For MVr patients, this was a 0.15 days per year decrease from 2005 to 2016 (P<0.001). MitraClip was associated with a much shorter hospital course from its inception and has decreased 0.85 days per year since (P=0.03).
MVR = mitral valve replacement; MVr = mitral valve repair
Figure 5.
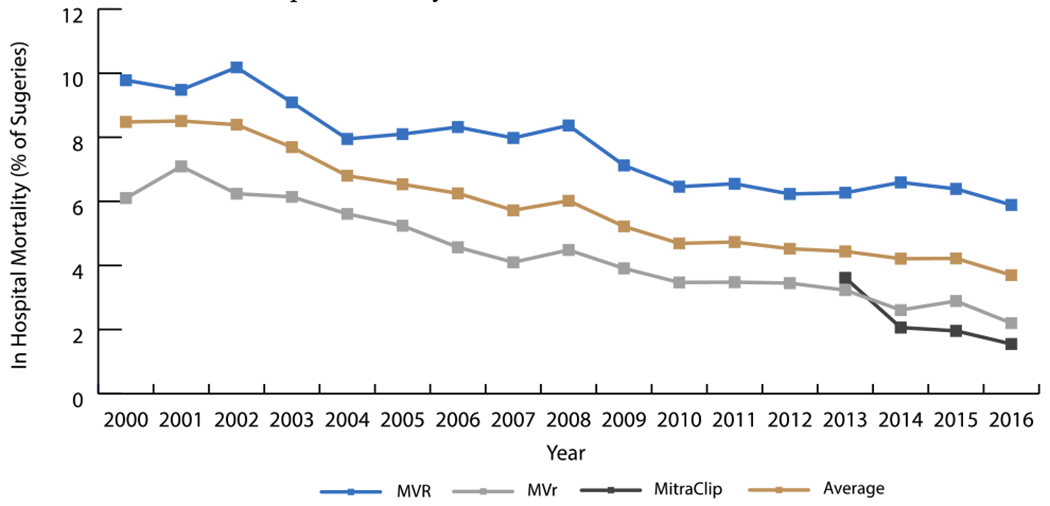
Trends in In-Hospital Mortality Rate from 2000-2016
MVR had the highest in hospital mortality, peaking at just over 10.2% of procedures in 2002 but decreasing 3.2% per year from 2000-2016 (P<0.001). Mortality from MVr was its highest in 2001 at 7.1% in 2001 and decreased 6.3% per year from 2000-2016 (P<0.001). Mortality from MitraClip was around 3.6% when it was first introduced in 2013, but decreased to 1.5% of surgeries in 2016.
MVR = mitral valve replacement; MVr = mitral valve repair
During the study period, risk adjusted in-hospital mortality after mitral valve interventions decreased (OR=0.94, P<0.001). The decrease was more pronounced after MVr (with odds decreasing by 8% annually) versus MVR (5% annually). Risk adjusted in-hospital mortality for MitraClip decreased but not significantly (OR=0.84, 95% CL 0.59-1.18, P=0.32). These results were confirmed by fitting weighted multilevel model (Appendix, Table 2).
Regional variations in the trend of MV interventions showed that all regions had an increase in the prevalence of MVr, the greatest occurring in the Midwest; while all but the Midwest had a decrease in the prevalence of MVR (Supplemental Table 3). Mitraclip showed substantial growth in all regions, but the proportion of MitraClip interventions remained a relatively small percentage of all MV procedures in 2016 (8% in Northeast and 14% of Midwest).
DISCUSSION
Mitral regurgitation is the most common valvular disease in the United States. (1) Severe MR results in progressive left ventricular dysfunction and congestive heart failure, which is associated with ≥5% mortality annually. (15–17) Although medical management alleviates symptoms, it does not halt the progression of the disease. (16) Therefore, current guidelines recommend MVr as the first line of therapy for patient with grade 3 or higher MR and left ventricular dysfunction. An acceptable alternative for patients who cannot undergo MVr is MVR. (3–5) Given the age and comorbidity burden of patients with MR, there is still a significant subset of patients with a prohibitive surgical risk. In 2013, the FDA approved MitraClip for this cohort of patients. The advent of this technology combined with a refinement of surgical technique has led to updates in guidelines and subsequent changes in the MV surgery landscape. In this study, we elucidated the trends of surgical procedures, patient characteristics, and hospital outcomes.
The American Heart Association (AHA)/American College of Cardiology (ACC) recommend MVr over MVR when feasible (4), and our findings appear to fit these guidelines. The number of MVR surgeries performed decreased while the number of MVr surgeries increased, and MVr became the predominant MV surgery in 2005, which continued through 2016. Additionally, MVR rates increased starting in 2008 and as of 2014 for the subgroup that received concomitant CABG. This is consistent with prior publications that show MVR has better durability compared to MVr in this subgroup. (18) In our study, MVr as a percentage of all MV procedures decreased an average 7.2% per year since the introduction of the MitraClip in 2013 (P<0.001). As a percentage of all MV procedures, MitraClip comprised 1.0% in 2013, but 10.2% by 2016, an average growth rate of 84.4% per year (P<0.001). This indicates a favorable perception of this procedure and suggests a substantial future of this approach to treating MR in patients with heart failure. Interestingly, the total number of MV procedures did not significantly change with the advent of MitraClip (P=0.3), contrary to what may have been expected. However, this probably reflects the fact that MitraClip is not being performed on patients with prohibitive surgical risk but rather on the highest risk patients that would have received treatment anyways, thereby not expanding the ranks of those who would receive mitral repair. Other retrospective studies have also noted that the patients receiving MitraClip may not be clinically distinct from the patients undergoing traditional MV surgery and that some may be high surgical risk and not necessarily prohibitive surgical risk. (19–21) Once the FDA has approved expansion of MitraClip for patients with secondary MV regurgitation, which a recent trial supports, an expansion of the total number of MV procedures will likely become apparent. (22)
We also observed significant differences in the baseline characteristics of patients receiving different forms of MV interventions. Recipients of MVr were younger, predominantly male, and had less comorbidities and severe disease compared with the MVR group. This aligns with the AHA/ACC recommendation that MVr be considered as the first line of therapy and MVR only be considered for severely symptomatic patients. (4) Additionally, our findings are consistent with prior literature which supports elective MVR rather than MVr for older and sicker patients (23, 24) MitraClip patients had the highest comorbidity burden compared to MVR and MVr patients (CS=10.1 vs CS=6.8 and CS=6.2 respectively, P<0.001). MitraClip patients were also significantly older (MitraClip 77.3 versus MVR 66.0 and MVr 64.8, P<0.001).
The population receiving MV interventions changed over time as well. Patients undergoing MV intervention in 2016 were sicker than the patients undergoing MV intervention in 2000 (Central Image, Graphical Abstract). The prevalence of all reported comorbidities increased in both MVR and MVr groups, along with the median CS. (25–27) This is likely due to advancements in surgical technique allowing for operations to be performed on older patients with more severe disease.
CENTRAL IMAGE.
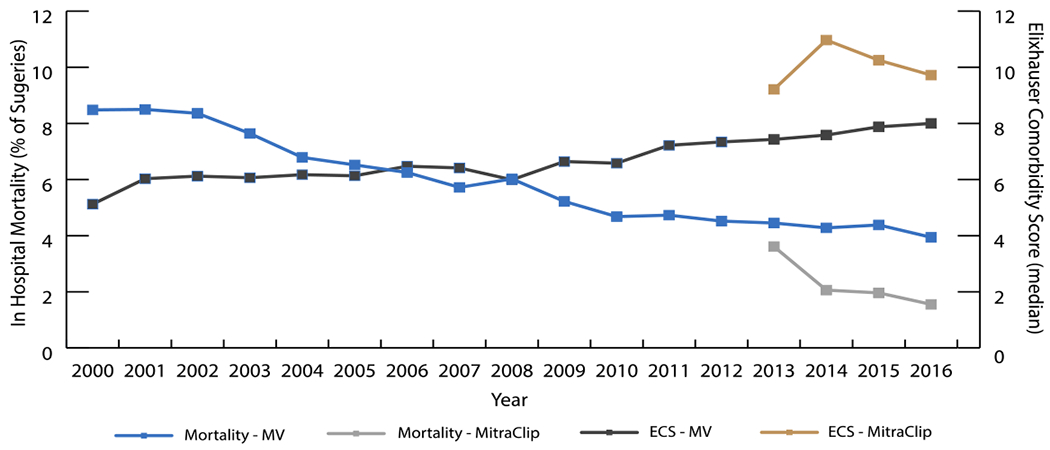
Trend in in-hospital mortality and comorbidity score for mitral valve surgeries (2000-2016)
Despite the sicker patient population undergoing intervention, LOS and in-hospital mortality improved from 2000 to 2016. LOS decreased significantly in all three groups, with MitraClip notably lower than MVR and MVr. The overall decrease in duration of stay may be due to the following: better surgical technique, better post-operative care, and more aggressive discharging. In-hospital mortality decreased for all surgical groups as well; however, MitraClip did not reach statistical significance. This may be attributed to the increase in elective surgery rates over time. Regardless, MitraClip maintained a lower mortality rate than MVR and MVr despite a sicker cohort; in-hospital mortality rate after MitraClip was 1.9% while MVR and MVr had in-hospital mortality rates of 7.8% and 4.2%, respectively (P<0.001). These results are supported by other studies that found early mortality post MitraClip to be between 1.6-4.8%. (21, 28–30) This may be because a larger percent of patients in the MitraClip cohort had elective interventions when compared to other MV procedures. Panaich et al showed that elective procedures were associated with lower rates of in hospital mortality compared to non-elective procedures. (30) Overall, MV interventions, regardless of type, have annually improved outcomes while encompassing a sicker population (Graphical Abstract). MitraClip, in particular, is associated with the best in hospital outcomes while consisting of the sickest patient population.
This study is not without limitations. The broader ICD-9 codes used from 2000 through the first three quarters of 2015 were switched to the more granular ICD-10 codes used in the last quarter of 2015 and 2016. Additionally, there is no ICD diagnosis code to distinguish between primary and secondary mitral regurgitation. The NIS database does not distinguish between preoperative and postoperative diagnoses. To adjust for this, we employed the Elixhauser comorbidity measure, which is maintained by HCUP and designed for administrative data. Furthermore, clinical information such as percent of regurgitation and left ventricle dilation were not available through the NIS database. There was also no data on symptomatic outcomes and long-term clinical outcomes. Despite these limitations, the NIS is the largest and most commonly used nationally representative database for trend analyzes and incorporates patients of all insurances and ages.
CONCLUSION
In conclusion, the landscape of MV interventions has changed but the prevalence has not. Despite being sicker at baseline, patients had better outcomes in 2016 than in 2000. For many years, MVr had been the treatment standard, an increasingly prevalent treatment modality associated with the lowest risk. The advent of MitraClip allows for a sicker patient population to seek surgical treatment and is associated with a shorter duration of stay and lower in hospital mortality. With the expansion of MitraClip’s patient population, further studies are needed to characterize trends for short-term and long-term outcomes in multiple settings.
Supplementary Material
Video.

Trends in Mitral Valve Surgeries. The landscape of MV interventions has changed but the prevalence has not. Despite being sicker at baseline, patients had better outcomes in 2016 than in 2000. The advent of MitraClip allows for a sicker patient population to seek surgical treatment and is associated with a shorter duration of stay and lower in hospital mortality. With the expansion of MitraClip’s patient population, further studies are needed to characterize trends for short-term and long-term outcomes in multiple settings.
CENTRAL MESSAGE.
Although the mitral valve’s population in 2016 was sicker than in 2000, interventions were associated with decreased in-hospital mortality and length of stay.
PERSPECTIVE STATEMENT.
Untreated severe mitral regurgitation results in left ventricular dysfunction and congestive heart failure. The advent of MitraClip promises to change the landscape of mitral valve intervention. Our study elucidates how the field has changed in the last two decades and provides insight into the direction it may take in the future.
Acknowledgments
Funding: 5U01HL088942 NIH/NHLBI grant: Network for Cardiothoracic Surgical Investigations in Cardiovascular Medicine. The funder did not play any role in the design and conduct of the study, in the collection, analysis, and interpretation of the data, and in the preparation, review, or approval of the manuscript.
GLOSSARY OF ABBREVIATIONS
- MV
mitral valve
- MR
mitral regurgitation
- MVR
mitral valve replacement
- MVr
mitral valve repair
- SOI
severity of illness
- ROM
risk of mortality
- LOS
length of stay
- APC
annual percent change
- FDA
food and drug administration
Footnotes
Conflicts of Interest: Dr Ailawadi reports being on consultant boards for Abbott, Edwards, Medtronic, and AtriCure. Dr Gillinov reports being a consultant to AtriCure, Medtronic, Abbott, CryoLife, Edwards LifeSciences, and ClearFlow. Cleveland Clinic has right to royalties from AtriCure.
The remaining authors have nothing to disclose.
IRB: HS#: 19-00755 - On 7/16/2019 the PPHS office determined that the following proposed activity is EXEMPT human research as defined by DHHS regulations (45 CFR 46. 101(b) (4).
REFERENCES
- 1.Benjamin EJ, Muntner P, Alonso A, Bittencourt MS, Callaway CW, Carson AP, et al. Heart Disease and Stroke Statistics-2019 Update: A Report From the American Heart Association. Circulation. 2019:Cir0000000000000659. [DOI] [PubMed] [Google Scholar]
- 2.Carpentier A Cardiac valve surgery--the “French correction”. J Thorac Cardiovasc Surg. 1983;86(3):323–37. [PubMed] [Google Scholar]
- 3.Bonow RO, Carabello BA, Kanu C, de Leon AC Jr., Faxon DP, Freed MD, et al. ACC/AHA 2006 guidelines for the management of patients with valvular heart disease: a report of the American College of Cardiology/American Heart Association Task Force on Practice Guidelines (writing committee to revise the 1998 Guidelines for the Management of Patients With Valvular Heart Disease): developed in collaboration with the Society of Cardiovascular Anesthesiologists: endorsed by the Society for Cardiovascular Angiography and Interventions and the Society of Thoracic Surgeons. Circulation. 2006;114(5):e84–231. [DOI] [PubMed] [Google Scholar]
- 4.Nishimura RA, Otto CM, Bonow RO, Carabello BA, Erwin JP 3rd, Guyton RA, et al. 2014 AHA/ACC guideline for the management of patients with valvular heart disease: a report of the American College of Cardiology/American Heart Association Task Force on Practice Guidelines. J Thorac Cardiovasc Surg. 2014;148(1):e1–e132. [DOI] [PubMed] [Google Scholar]
- 5.Nishimura RA, Otto CM, Bonow RO, Carabello BA, Erwin JP 3rd, Fleisher LA, et al. 2017 AHA/ACC Focused Update of the 2014 AHA/ACC Guideline for the Management of Patients With Valvular Heart Disease: A Report of the American College of Cardiology/American Heart Association Task Force on Clinical Practice Guidelines. J Am Coll Cardiol. 2017;70(2):252–89. [DOI] [PubMed] [Google Scholar]
- 6.Enriquez-Sarano M, Schaff HV, Orszulak TA, Tajik AJ, Bailey KR, Frye RL. Valve repair improves the outcome of surgery for mitral regurgitation. A multivariate analysis. Circulation. 1995;91(4):1022–8. [DOI] [PubMed] [Google Scholar]
- 7.Gillinov AM, Blackstone EH, Nowicki ER, Slisatkorn W, Al-Dossari G, Johnston DR, et al. Valve repair versus valve replacement for degenerative mitral valve disease. J Thorac Cardiovasc Surg. 2008;135(4):885–93, 93.e1–2. [DOI] [PubMed] [Google Scholar]
- 8.Glower DD, Kar S, Trento A, Lim DS, Bajwa T, Quesada R, et al. Percutaneous mitral valve repair for mitral regurgitation in high-risk patients: results of the EVEREST II study. J Am Coll Cardiol. 2014;64(2):172–81. [DOI] [PubMed] [Google Scholar]
- 9.Khera R, Angraal S, Couch T, Welsh JW, Nallamothu BK, Girotra S, et al. Adherence to Methodological Standards in Research Using the National Inpatient Sample. JAMA. 2017;318(20):2011–8. [DOI] [PMC free article] [PubMed] [Google Scholar]
- 10.Elixhauser A, Steiner C, Harris DR, Coffey RM. Comorbidity measures for use with administrative data. Med Care. 1998;36(1):8–27. [DOI] [PubMed] [Google Scholar]
- 11.van Walraven C, Austin PC, Jennings A, Quan H, Forster AJ. A modification of the Elixhauser comorbidity measures into a point system for hospital death using administrative data. Med Care. 2009;47(6):626–33. [DOI] [PubMed] [Google Scholar]
- 12.Chikwe J, Toyoda N, Anyanwu AC, Itagaki S, Egorova NN, Boateng P, et al. Relation of Mitral Valve Surgery Volume to Repair Rate, Durability, and Survival. J Am Coll Cardiol. 2017. [DOI] [PubMed] [Google Scholar]
- 13.Houchens RR D; Elixhauser A Using the HCUP National Inpatient Sample to Estimate Trends. HCUP Methods Series Report #2006-05 ONLINE. January 4, 2016 ed. http://www.hcup-us.ahrq.gov/reports/methods/methods.jsp U.S. Agency for Healthcare Research and Quality; 2015. [Google Scholar]
- 14.[web page]. Pages http://support.sas.com/documentation/cdl/en/statug/66859/HTML/default/viewer.htm#statug_glimmix_examples23.htm.
- 15.Trichon BH, Felker GM, Shaw LK, Cabell CH, O’Connor CM. Relation of frequency and severity of mitral regurgitation to survival among patients with left ventricular systolic dysfunction and heart failure. Am J Cardiol. 2003;91(5):538–43. [DOI] [PubMed] [Google Scholar]
- 16.Carabello BA. The current therapy for mitral regurgitation. J Am Coll Cardiol. 2008;52(5):319–26. [DOI] [PubMed] [Google Scholar]
- 17.Carabello BA. Mitral valve repair in the treatment of mitral regurgitation. Curr Treat Options Cardiovasc Med. 2009;11(6):419–25. [DOI] [PubMed] [Google Scholar]
- 18.Acker MA, Parides MK, Perrault LP, Moskowitz AJ, Gelijns AC, Voisine P, et al. Mitral-valve repair versus replacement for severe ischemic mitral regurgitation. N Engl J Med. 2014;370(1):23–32. [DOI] [PMC free article] [PubMed] [Google Scholar]
- 19.Lim DS, Reynolds MR, Feldman T, Kar S, Herrmann HC, Wang A, et al. Improved functional status and quality of life in prohibitive surgical risk patients with degenerative mitral regurgitation after transcatheter mitral valve repair. J Am Coll Cardiol. 2014;64(2):182–92. [DOI] [PubMed] [Google Scholar]
- 20.Conradi L, Treede H, Rudolph V, Graumuller P, Lubos E, Baldus S, et al. Surgical or percutaneous mitral valve repair for secondary mitral regurgitation: comparison of patient characteristics and clinical outcomes. Eur J Cardiothorac Surg. 2013;44(3):490–6; discussion 6. [DOI] [PubMed] [Google Scholar]
- 21.Alozie A, Paranskaya L, Westphal B, Kaminski A, Sherif M, Sindt M, et al. Clinical outcomes of conventional surgery versus MitraClip(R) therapy for moderate to severe symptomatic mitral valve regurgitation in the elderly population: an institutional experience. BMC Cardiovasc Disord. 2017;17(1):85. [DOI] [PMC free article] [PubMed] [Google Scholar]
- 22.Stone GW, Lindenfeld J, Abraham WT, Kar S, Lim DS, Mishell JM, et al. Transcatheter Mitral-Valve Repair in Patients with Heart Failure. N Engl J Med. 2018;379(24):2307–18. [DOI] [PubMed] [Google Scholar]
- 23.Farid S, Ladwiniec A, Hernandez-Sanchez J, Povey H, Caruana E, Ali A, et al. Early Outcomes After Mitral Valve Repair vs. Replacement in the Elderly: A Propensity Matched Analysis. Heart Lung Circ. 2017. [DOI] [PubMed] [Google Scholar]
- 24.Javadikasgari H, Gillinov AM, Idrees JJ, Mihaljevic T, Suri RM, Raza S, et al. Valve Repair Is Superior to Replacement in Most Patients With Coexisting Degenerative Mitral Valve and Coronary Artery Diseases. Ann Thorac Surg. 2017;103(6):1833–41. [DOI] [PubMed] [Google Scholar]
- 25.Owan TE, Hodge DO, Herges RM, Jacobsen SJ, Roger VL, Redfield MM. Trends in prevalence and outcome of heart failure with preserved ejection fraction. N Engl J Med. 2006;355(3):251–9. [DOI] [PubMed] [Google Scholar]
- 26.Bromfield SG, Bowling CB, Tanner RM, Peralta CA, Odden MC, Oparil S, et al. Trends in hypertension prevalence, awareness, treatment, and control among US adults 80 years and older, 1988-2010. J Clin Hypertens (Greenwich). 2014;16(4):270–6. [DOI] [PMC free article] [PubMed] [Google Scholar]
- 27.Booth JN, Li J, Zhang L, Chen L, Muntner P, Egan B. Trends in Prehypertension and Hypertension Risk Factors in US Adults: 1999-2012. Hypertension. 2017;70(2):275–84. [DOI] [PMC free article] [PubMed] [Google Scholar]
- 28.Takagi H, Ando T, Umemoto T. A review of comparative studies of MitraClip versus surgical repair for mitral regurgitation. Int J Cardiol. 2017;228:289–94. [DOI] [PubMed] [Google Scholar]
- 29.Mendirichaga R, Singh V, Blumer V, Rivera M, Rodriguez AP, Cohen MG, et al. Transcatheter Mitral Valve Repair With MitraClip for Symptomatic Functional Mitral Valve Regurgitation. Am J Cardiol. 2017;120(4):708–15. [DOI] [PubMed] [Google Scholar]
- 30.Panaich SS, Arora S, Badheka A, Kumar V, Maor E, Raphael C, et al. Procedural trends, outcomes, and readmission rates pre-and post-FDA approval for MitraClip from the National Readmission Database (2013-14). Catheter Cardiovasc Interv. 2018;91(6):1171–81. [DOI] [PubMed] [Google Scholar]
Associated Data
This section collects any data citations, data availability statements, or supplementary materials included in this article.


