SUMMARY PARAGRAPH:
Few complete pathways are established for the biosynthesis of medicinal compounds from plants. Accordingly, many plant-derived therapeutics are isolated directly from medicinal plants or plant cell culture.1 A lead example is colchicine, an FDA-approved treatment for inflammatory disorders that is sourced from Colchicum and Gloriosa species.2-5 Here we use a combination of transcriptomics, metabolic logic, and pathway reconstitution to elucidate a near complete biosynthetic pathway to colchicine without prior knowledge of biosynthetic genes, a sequenced genome, or genetic tools in the native host. We have uncovered eight genes from Gloriosa superba for the biosynthesis of N-formyldemecolcine, a colchicine precursor that contains the characteristic tropolone ring and pharmacophore of colchicine.6 Notably, in doing so we have identified a non-canonical cytochrome P450 that catalyzes the remarkable ring expansion reaction required to produce the distinct carbon scaffold of colchicine. We further utilize the newly identified genes to engineer a biosynthetic pathway (16 enzymes total) to N-formyldemecolcine in Nicotiana benthamiana starting from the amino acids phenylalanine and tyrosine. This work establishes a metabolic route to tropolone-containing colchicine alkaloids and provides new insights into the unique chemistry plants use to generate complex, bioactive metabolites from simple amino acids.
INTRODUCTION
Medicinal plants are a major source of bioactive small molecules, and have served as powerful treatments for human disease.7,8 A prominent example is the historical usage of Colchicum and Gloriosa plant species, which have been used to treat inflammatory disorders for centuries, and perhaps millennia.9 The anti-inflammatory action of these plants is due to their production of colchicine, an alkaloid that is approved by the Food and Drug Administration (FDA) as a pharmaceutical treatment for acute cases of gout and familial Mediterranean fever,10 and which has also been used to treat pericarditis and Behçet’s disease.2 Colchicine’s bioactivity is thought to result from its interaction with tubulin dimers and inhibition of microtubule growth, though it is not entirely clear how its impact on microtubule dynamics leads to a decrease in inflammation.2,6 Notably, along with the taxane and Vinca domains, the colchicine-binding domain on tubulin is a target for many small molecule chemotherapeutics.11 Colchicine itself is too potent for use in chemotherapy,6 and even within gout treatment, its dosage must be strictly administered to avoid toxicity.12 However, the anti-mitotic action imparted by colchicine’s interaction with tubulin has made colchicine an important research tool,6 where it has been used to identify the number of human chromosomes,13 study microtubule dynamics,14 and induce polyploidy in plants.15
Our understanding of colchicine biosynthesis was based upon an abundance of feeding studies with isotope-labeled substrates in Colchicum plants,16 as well as from the structural characterization of colchicine-related alkaloids isolated from species of the Colchicaceae family.17 Collectively, these studies led to the development of a well-defined biosynthetic hypothesis in which the alkaloid core is built from the amino acids L-phenylalanine (Phe) and L-tyrosine (Tyr) (Figure 1; see Supplementary Information Scheme 1 for full biosynthetic scheme).18-27 Phe and Tyr are predicted to be processed to 4-hydroxydihydrocinnamaldehyde (4-HDCA) and dopamine,28,29 respectively, which are putatively joined through a Pictet-Spengler reaction to form a 1-phenethylisoquinoline scaffold (1).29 A series of methylations and phenyl ring hydroxylations of this scaffold would produce (S)-autumnaline (7),30 which is poised for para-para phenol coupling to create a bridged tetracycle.31 An unusual oxidative ring expansion is then proposed to generate the characteristic tropolone ring of the colchicine carbon scaffold,32 which is critical for colchicine’s tubulin-binding activity6. Colchicine biosynthesis is then completed through final processing and N-acetylation of the extruded nitrogen atom.33
Figure 1. Summary of predicted colchicine biosynthesis.
The proposed pathway for colchicine biosynthesis is based on extensive radioisotope labeling studies and structural characterization of alkaloids isolated from colchicine-producing plants. The black circle in the structures of O-methylandrocymbine and colchicine indicates the rearrangement of carbon 12 (C12) during the ring expansion reaction. See Supplementary Information Scheme 1 for a full description of the proposed biosynthetic pathway.
RESULTS
Metabolomic and transcriptomic analysis
Biosynthetic pathway genes in plants are often coordinatively regulated, a phenomenon that can be leveraged by RNA sequencing (RNA-seq) and de novo transcriptome assembly to associate genes into co-expressed functional units.34-36 This approach is best employed if a dedicated pathway gene can be used as bait to identify candidate genes via co-expression analysis; however, this requires prior knowledge of a gene in the pathway. Furthermore, co-expression patterns may only be apparent after RNA-seq analysis if the spatial, temporal, or condition-specific production of the compound of interest is known and captured in the dataset.37 Although colchicine alkaloids are found throughout the Colchicum plant, they accumulate to the highest concentrations within the seeds and corms (or in Gloriosa, rhizomes).38 In addition, most of the aforementioned isotope labeling studies were accomplished by feeding substrates into either the corms or the seed pods of Colchicum plants.21,29,30,39 Together, these data suggest enriched expression of colchicine biosynthetic genes in these tissues.
At the onset of this study, there were two publicly available RNA-seq data sets for colchicine-producing plants (https://medplantrnaseq.org/): one from Colchicum autumnale (autumn crocus) and a second from Gloriosa superba (flame lily). We also generated a third RNA-seq dataset that contained multiple replicates of varying tissue samples (leaf, stem, rhizome, root) from 5-week old Gloriosa superba plants. Importantly, accompanying metabolite profiles were also obtained for each tissue in order to compare alkaloid accumulation with transcript expression profiles. We observed striking differences in colchicine accumulation between rhizome, stem, root, and leaf tissues, with rhizomes accumulating the highest levels of colchicine and related metabolites (Supplementary Information Fig. 1).
Discovery of colchicine biosynthetic enzymes
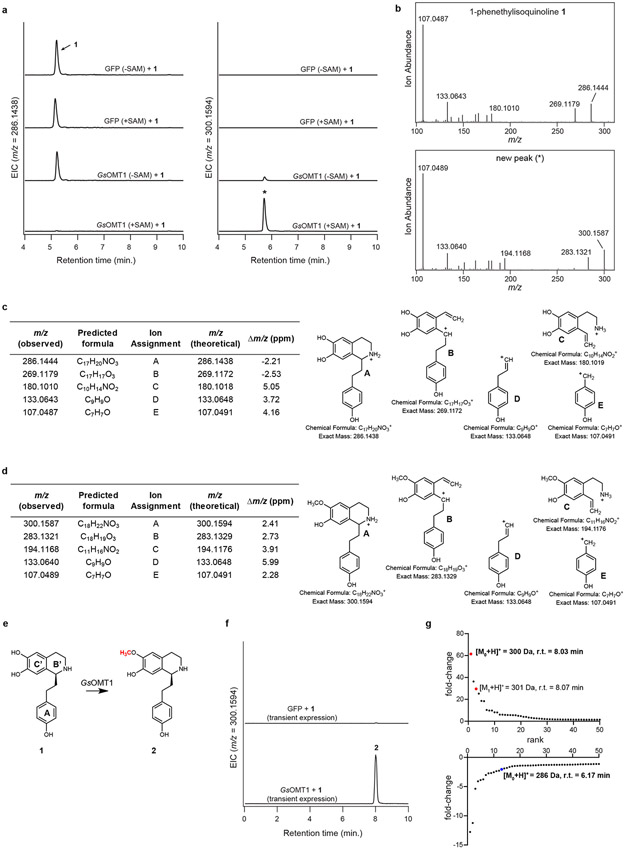
To gain a foothold in the colchicine pathway, we initially focused on S-adenosylmethionine (SAM)-dependent methyltransferase (MT) enzymes that potentially process the predicted 1-phenethylquinoline precursor (1), as labeling studies have indicated that this substrate is initially functionalized with O- and N-methylations.27,29,30 We identified 11 candidate MT genes within the public G. superba transcriptome that exhibited relatively high expression across any tissue type (Figure 2). Each MT was cloned from G. superba cDNA and transiently expressed in N. benthamiana leaves using Agrobacterium-mediated transformation. Crude protein lysates from these leaves were then assayed for in vitro methyltransferase activity with chemically-synthesized 1 ([M+H]+ = 286.1438) as substrate.40 Liquid chromatography-mass spectrometry (LC-MS) analysis revealed that one candidate MT catalyzed the SAM-dependent consumption of 1 and formation of a methylated compound ([M+H]+ = 300.1594 Da; Extended Data Fig. 1). Further MS/MS analysis led us to assign the structure of this compound as 2, in which a methyl group had been added to a ring C’ hydroxyl (see Supplementary Information for further discussion on structural characterization of each molecule; see Supplementary Scheme 2 for carbon and ring annotations). Thus, we refer to this O-methyltransferase gene as GsOMT1.
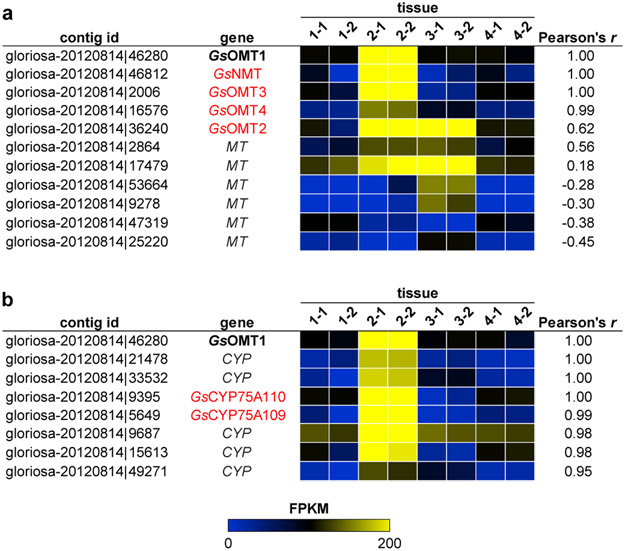
Figure 2. Candidate methyltransferase (MT) and cytochrome P450 (CYP) transcripts identified within the public Gloriosa superba transcriptome via expression correlation analysis.
Discovery of a tentative function for GsOMT1 within colchicine alkaloid biosynthesis prompted its use as a query for Pearson correlation analysis of contig expression within the public G. superba transcriptome (87,123 contigs compared across 8 tissue samples). The expression of each candidate transcript is represented as the fragments per kilobase of trascript per million mapped reads (FPKM). Tissue samples 1 thru 4 represent distinct tissue types with two replicate libraries of each. a) Comparison of GsOMT1 expression to previously cloned MT candidate gene transcripts. b) Identification of CYP transcripts that show strong co-expression with GsOMT1. Candidate genes ultimately found to have a role in colchicine alkaloid biosynthesis are highlighted in red.
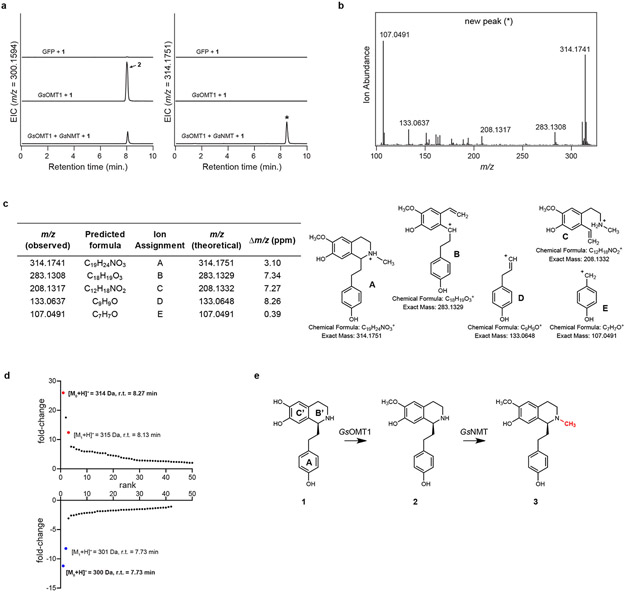
We next attempted direct in planta activity assays by infiltrating 1 into N. benthamiana leaves transiently expressing GsOMT1. Analysis of leaf extracts demonstrated production of 2, indicating that sufficient quantities of 1 accumulate intracellularly after infiltration, thus allowing for GsOMT1 activity (Extended Data Fig. 1). Furthermore, this result suggested that downstream candidate gene testing could be performed by co-infiltrating mixtures of individual Agrobacterium strains that harbor distinct biosynthetic gene candidate constructs. Using this approach, we re-tested the 10 remaining MT candidates in combination with GsOMT1, and found a second MT that consumed 2 to produce a new compound with a mass consistent with the addition of a second methyl group ([M+H]+ = 314.1751 Da; Extended Data Fig. 2). MS/MS fragmentation led us to assign the structure as the N-methylated product 3. As such, this N-methyltransferase gene is referred to as GsNMT.
We noted that GsOMT1 and GsNMT expression was highly correlated in the public G. superba transcriptome (Pearson’s r > 0.99), which indicated that co-expression analysis could help prioritize additional candidate enzymes. Of the 11 cloned MTs, only five (including GsNMT) showed relatively high co-expression (Pearson’s r > 0.5) with GsOMT1 (Figure 2), suggesting these may also function in colchicine biosynthesis. Similarly, expression of seven unique cytochromes P450 (CYPs), a class of enzymes implicated in multiple downstream biosynthetic transformations (e.g. hydroxylations, phenol coupling, and ring expansion),32,41 also co-express strongly with GsOMT1 (Pearson’s r > 0.9; Figure 2), and were thus cloned for transient expression. These candidate MTs and CYPs were each tested via co-expression in N. benthamiana with previously identified pathway genes and co-infiltration of 1 as substrate.
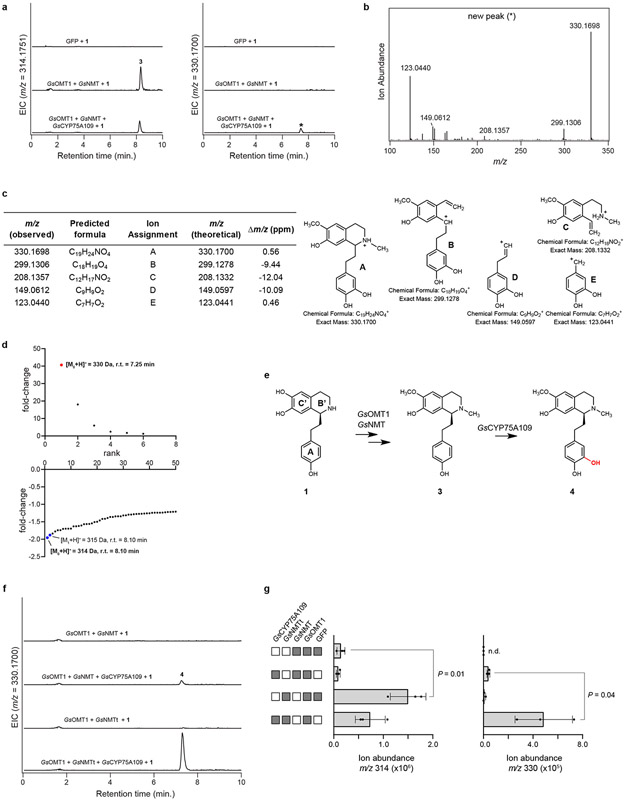
Co-expression of one cloned CYP (GsCYP75A109) resulted in partial consumption of 3 and production of a new compound with a mass corresponding to a single hydroxylation ([M+H]+ = 330.1700 Da; Extended Data Fig. 3). Based on MS/MS analysis, this compound was assigned the structure of 4, in which the new hydroxyl group is at the meta position on ring A.27,30 Relatively low production of 4 led us to examine strategies to improve flux through this system. We identified a putative N-terminal mitochondrial-localization signal in the primary amino acid sequence of GsNMT, and removal of this sequence led to a ~10-fold increase in the yield of 4 (Extended Data Fig. 3). Therefore, this truncated enzyme (GsNMTt) was used for all subsequent experiments.
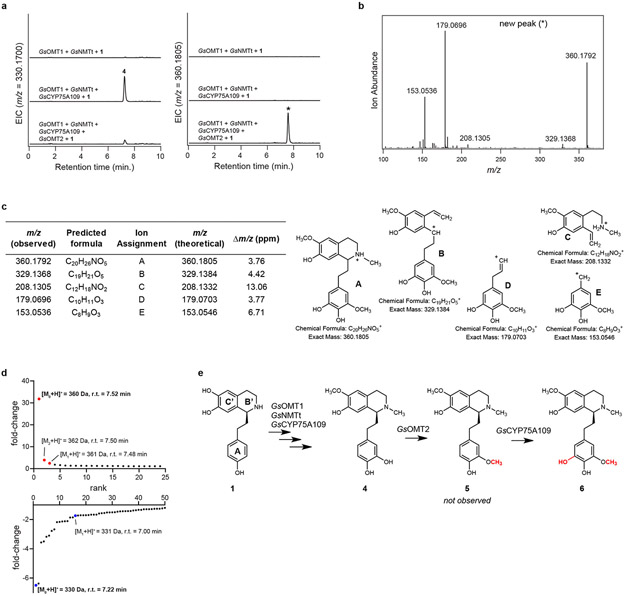
Biosynthesis is next predicted to proceed via methylation of the meta hydroxyl group on ring A,27,30 and we found that co-expression of another candidate MT (GsOMT2) resulted in consumption of 4. However, the new compound had a mass consistent with the addition of both a methyl and a hydroxyl group ([M+H]+ = 360.1805 Da), which MS/MS fragmentation indicated to be on ring A, leading to the assignment of this compound as 6 (Extended Data Fig. 4). One explanation for this result is that GsOMT2 acts as a meta O-methyltransferase to produce 5, a confirmed precursor to colchicine,24,27 and that GsCYP75A109 can subsequently install a second hydroxyl group in the other free meta position on ring A to generate 6. Although we did not observe accumulation of 5, which corresponds to the methylation alone, it is possible that 5 is immediately consumed via the activity of GsCYP75A109. Alternatively, we cannot exclude the possibility that an endogenous N. benthamiana hydroxylase catalyzes this reaction within our heterologous expression system.
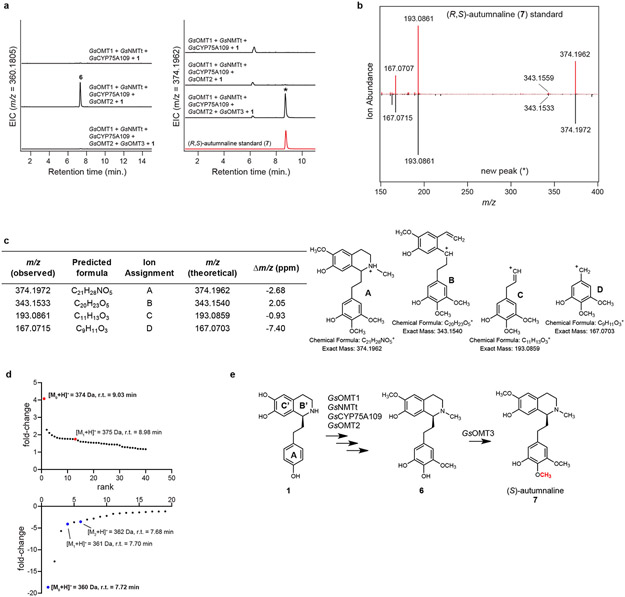
Addition of another candidate MT (GsOMT3) to the established pathway resulted in consumption of 6 and formation of a methylated product ([M+H]+ = 374.1962 Da) that was confirmed to be autumnaline (7) via LC-MS comparison to a racemic standard of 7 (Extended Data Fig. 5)24,30. This was the first intermediate accessed in this biosynthetic reconstitution that represented an isolated alkaloid from colchicine-producing plants,42 and indicated that the pathway we were assembling in N. benthamiana was likely on route to colchicine. Though our result did not indicate the absolute stereochemistry of 7, (S)-autumnaline has been shown to be the substrate for the subsequent CYP-catalyzed para-para phenol coupling reaction,31,41 and thus we predict that our product is likely the (S) enantiomer.
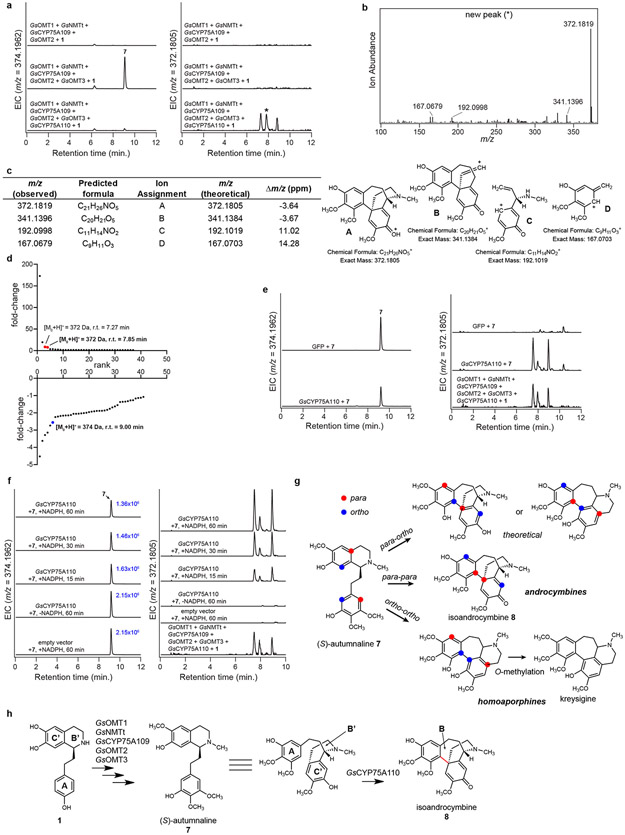
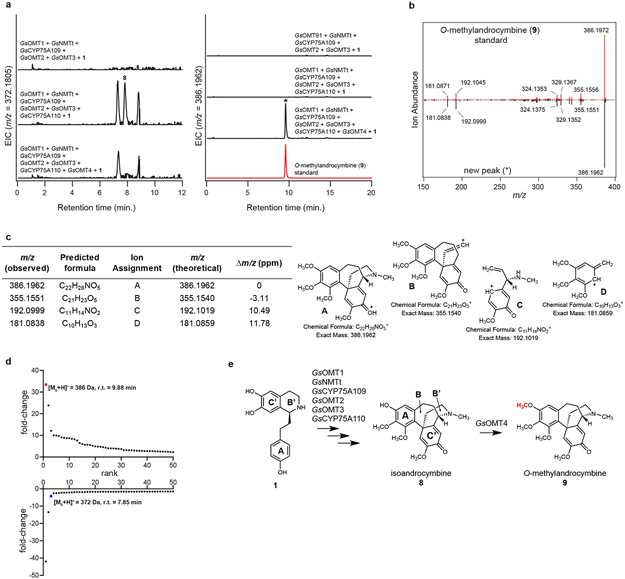
Co-expressing a second CYP candidate (GsCYP75A110) in this transient expression system led to consumption of 7 and formation of three compound peaks (Extended Data Fig. 6), each with a mass indicating a loss of two hydrogens ([M+H]+ = 372.1805 Da). Correspondingly, further characterization of GsCYP75A110 expressed alone in both N. benthamiana and yeast demonstrated similar activity. The exact mass of these products matches that of isoandrocymbine (8), a confirmed precursor to colchicine,41 which is the proposed product from the oxidative para-para phenol coupling of 7 (Extended Data Fig. 6). One of the three compounds produced by GsCYP75A110 is consumed upon the addition of another candidate MT (GsOMT4) into the co-expression system. This activity yielded O-methylandrocymbine (9), a known precursor to colchicine,27,32 as confirmed via comparison to an authentic standard (Extended Data Fig. 7). Thus, we further tentatively assign the consumed substrate as 8, which matches previously established biosynthetic hypotheses.31,41
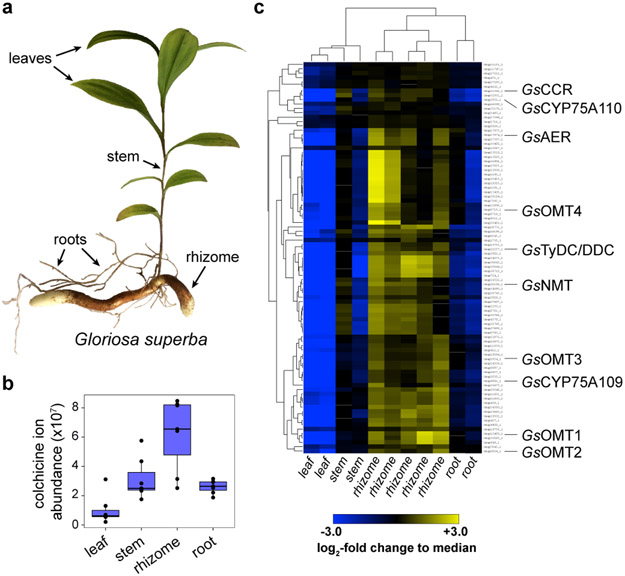
At this point, we re-assessed the co-expression patterns of the identified biosynthetic genes. Hierarchical clustering of contigs from our in-house G. superba RNA-seq data set, which had only been filtered by minimum expression, revealed that the seven genes demonstrated to process 1 into 9 are present in a single cluster of 89 co-expressed transcripts (Figure 3 & Supplementary Information Fig. 2). Remarkably, this represents only 0.23% of the total contigs in our RNA-seq data, suggesting extremely co-regulated expression of colchicine biosynthetic genes.
Figure 3. Combined transcriptomics and metabolomics identify notable co-expression of colchicine biosynthetic genes within Gloriosa superba.
a) Tissues from G. superba plants (leaf, stem, rhizome, and root) were used to quantify colchicine alkaloid accumulation and to isolate RNA for subsequent RNA-seq analysis. b) Colchicine accumulates in all tissues, but to the highest level in the rhizome, suggesting this to be the most active site of biosynthesis. Shown is the extracted ion abundance of colchicine, m/z 400.1755 ± 20 ppm. n=7 independent biological replicates for each tissue type, shown here via box and whisker plots. The center line indicates the median; box limits indicate upper and lower quartiles; whiskers indicate 1.5x interquartile range; points outside of the whiskers indicate outliers. c) Hierarchical clustering analysis (distance metric: uncentered Pearson correlation) was performed on contigs with a TMM-normalized, counts per million (CPM) value greater than 25 (for a total of 11,315 out of 38,466 total contigs compared across 11 tissue samples). This analysis identifies an 89 contig cluster that is populated with a substantial number of colchicine biosynthetic genes, as shown here, indicating a high level of co-expression.
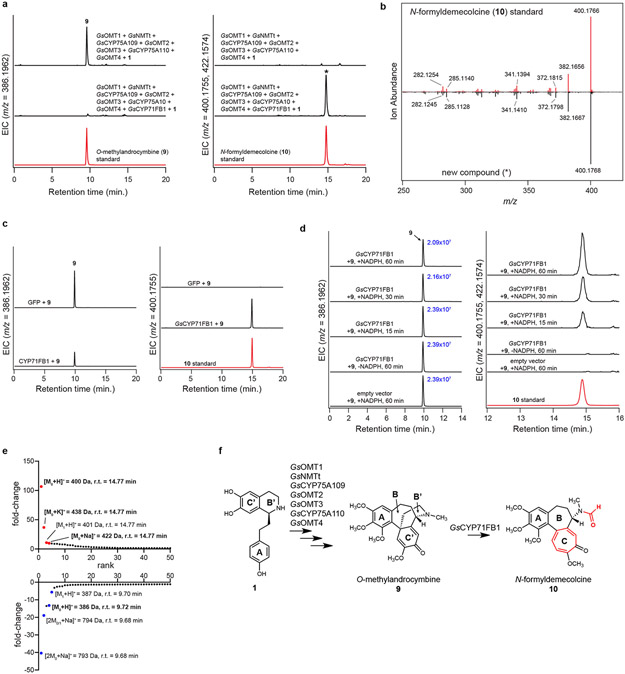
Expansion of the dienone ring C’ of 9, which ultimately results in the formation of a tropolone ring (ring C), has been suggested to be catalyzed by a CYP enzyme.32 While initial CYP candidates from the G. superba transcriptomes did not catalyze this reaction, continued analysis of the public C. autumnale data set (see Supplementary Information for a detailed description of how this CYP was identified) revealed a previously overlooked CYP (CYP71FB1) that shared relatively high co-expression (Pearson’s r > 0.8) with the other identified biosynthetic genes within our G. superba expression data (Supplementary Information Fig. 3 & 4). Addition of GsCYP71FB1 into the transient expression system resulted in consumption of 9 and accumulation of the tropolone-containing compound N-formyldemecolcine (10, [M+H]+ = 400.1755 Da), the proposed product of the ring expansion reaction,43 as confirmed by LC-MS comparison to an authentic standard (Extended Data Fig. 8). Additional characterization of GsCYP71FB1 expressed individually in both N. benthamiana and yeast confirmed this enzyme to be responsible for the ring expansion and rearrangement reaction, which involves breaking and reformation of two C-C bonds, a noteworthy cascade reaction promoted by a single oxidative enzyme.
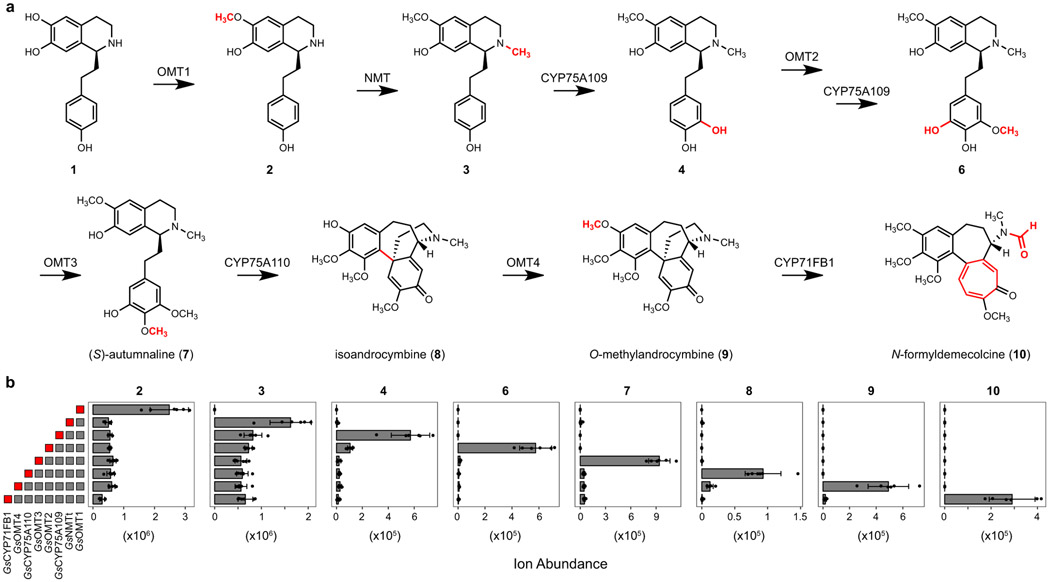
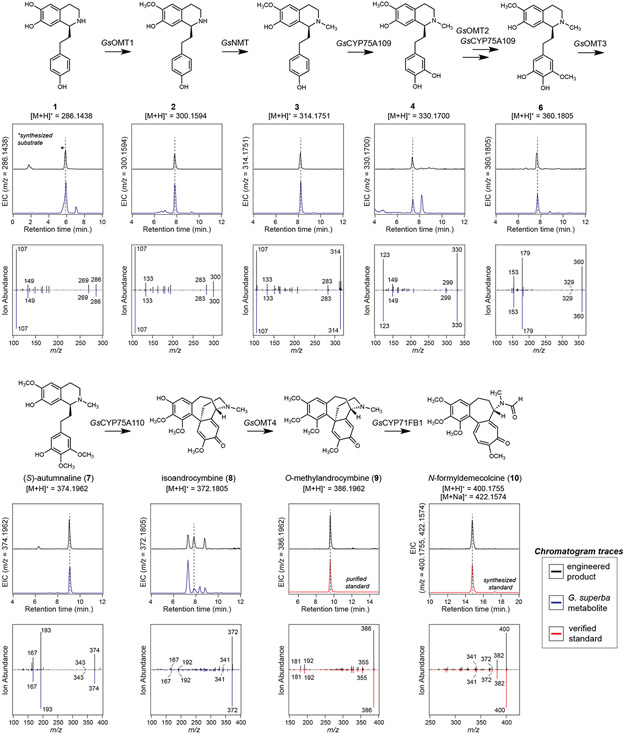
In addition to the authentic standards used to confirm the identities of 7, 9, and 10, we also established that all other proposed intermediates produced heterologously in N. benthamiana (2, 3, 4, 6, and 8) co-elute with metabolites found in G. superba rhizomes that share identical MS/MS spectra (Extended Data Fig. 9). This suggests that the metabolites produced in our transient expression system represent biologically-relevant pathway intermediates. Taken together, the eight new enzymes identified herein from the medicinal plant G. superba establish a biosynthetic route from a phenethylisoquinoline substrate (1) to N-formyldemecolcine (10) (Figure 4). Our data corroborate the proposed biosynthetic pathway that had previously been established through many years of rigorous isotope labeling studies and metabolite isolation from colchicine-producing plants,16 and further demonstrate how plants synthesize the tropolone-containing scaffold of colchicine.
Figure 4. Discovery of a pathway for colchicine alkaloid biosynthesis.
Transient co-expression of eight identified biosynthetic genes from G. superba within N. benthamiana allows for step-by-step conversion of a co-infiltrated 1-phenethylisoquinoline substrate (1) into the tropolone-containing alkaloid N-formyldemecolcine (10) via the proposed pathway shown here. Gray boxes to the left of the bar graphs indicate biosynthetic genes included within a co-expression experiment, with the red box indicating the final acting enzyme within a set of co-expressed genes. Shown for each intermediate is the mean extracted ion abundance (n=6, ± standard deviation) for the exact ion mass [M+H]+ (for 10, both [M+H]+ and [M+Na]+) that corresponds to each compound.
Engineering colchicine alkaloid biosynthesis
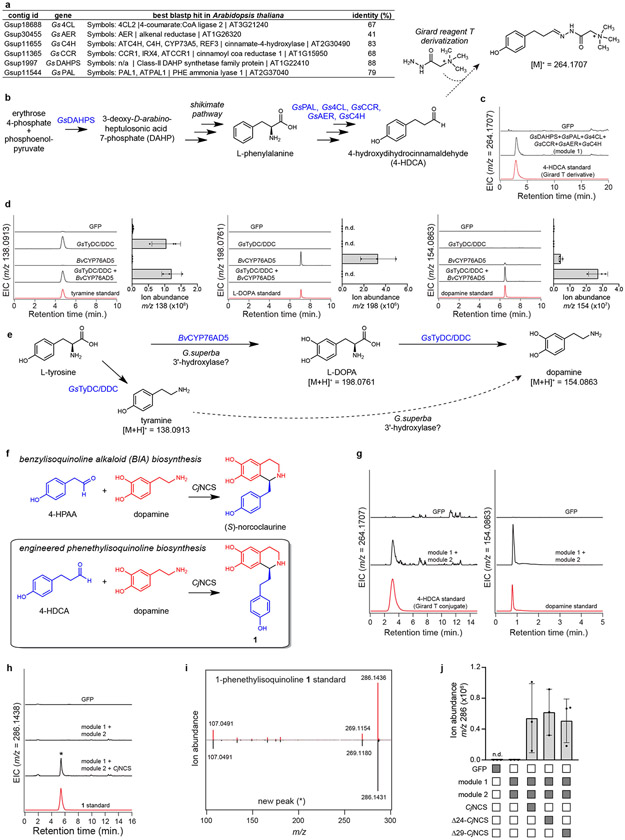
To eliminate the need for a synthetic precursor, we next developed a metabolic engineering strategy for producing 1 within N. benthamiana. Production of 1 tentatively requires the Pictet-Spengler condensation of 4-HDCA and dopamine, which are derived from the amino acids Phe and Tyr, respectively. Labeling studies have indicated that 4-HDCA is produced from Phe via a metabolic route analogous to the biosynthesis of monolignols (Supplementary Information Scheme 3),18,22,28,29 which are building blocks of the lignin polymers ubiquitous to vascular plants.44 The only major distinction in 4-HDCA biosynthesis is the reduction of the olefinic (alkenal) double bond. Notably, hierarchical clustering analysis of our G. superba transcriptomic data demonstrated co-clustering of many monolignol biosynthetic gene orthologs, as well as a putative alkenal reductase (GsAER), with the previously characterized MTs and CYPs (Figure 3 & Supplementary Information Fig. 2).45 We hypothesized that a co-expressed group of these biosynthetic genes (GsPAL, Gs4CL, GsCCR, GsAER, GsC4H, and GsDAHPS; “module 1”) could produce sufficient quantities of 4-HDCA for engineered biosynthesis (Supplementary Information Scheme 3). Indeed, heterologous co-expression of module 1 in N. benthamiana resulted in production of 4-HDCA, which was otherwise not detected (Extended Data Fig. 10).
For dopamine formation, the incorporation of Tyr and tyramine into colchicine19,27 suggests the activity of L-tyrosine/L-DOPA decarboxylase (TyDC/DDC) and 3’-hydroxylase enzymes (Supplementary Information Scheme 1). In support of this, a TyDC/DDC homolog (GsTyDC/DDC) was found to be highly co-expressed with the other colchicine biosynthetic genes, as shown in our hierarchical clustering analysis (Figure 3). To circumvent discovery of a novel 3’-hydroxylase, we utilized a CYP from Beta vulgaris (BvCYP76AD5) that hydroxylates Tyr to form L-DOPA within betalain pigment biosynthesis.46 Accordingly, co-expression of BvCYP76AD5 and GsTyDC/DDC (“module 2”) in N. benthamiana led to production of dopamine (Extended Data Fig. 10).
While Pictet-Spengler condensation of 4-HDCA and dopamine to produce 1 could occur non-enzymatically,47 heterologous co-expression of module 1 and module 2 did not result in accumulation of 1, suggesting a dedicated “Pictet-Spenglerase” enzyme is required (Extended Data Fig. 10). Given that we could not identify an obvious Pictet-Spenglerase candidate in our dataset, we attempted to utilize (S)-norcoclaurine synthase (NCS), a previously characterized plant Pictet-Spenglerase. NCS condenses 4-hydroxyphenylacetaldehyde (4HPAA) and dopamine within benzylisoquinoline alkaloid (BIA) biosynthesis (Extended Data Fig. 10),47 and has been shown to condense a wide range of aldehyde substrates with dopamine.48,49 Notably, the native NCS substrate (4HPAA) is nearly identical in structure to 4-HDCA, suggesting a potential for NCS to utilize 4-HDCA. Indeed, heterologous co-expression of a truncated NCS gene from Coptis japonica (Δ24-CjNCS) with module 1 and module 2 led to production of 1 (Extended Data Fig. 10).
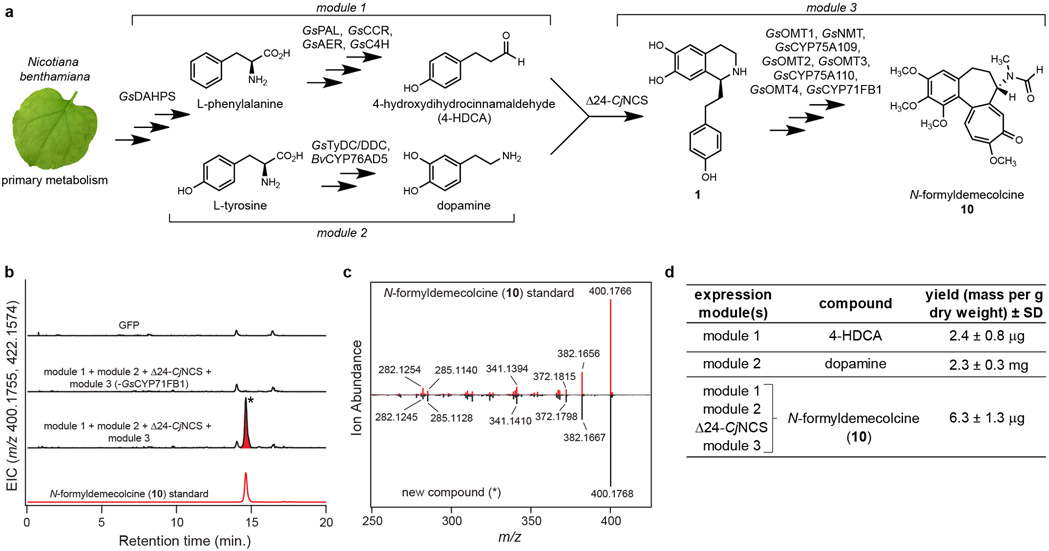
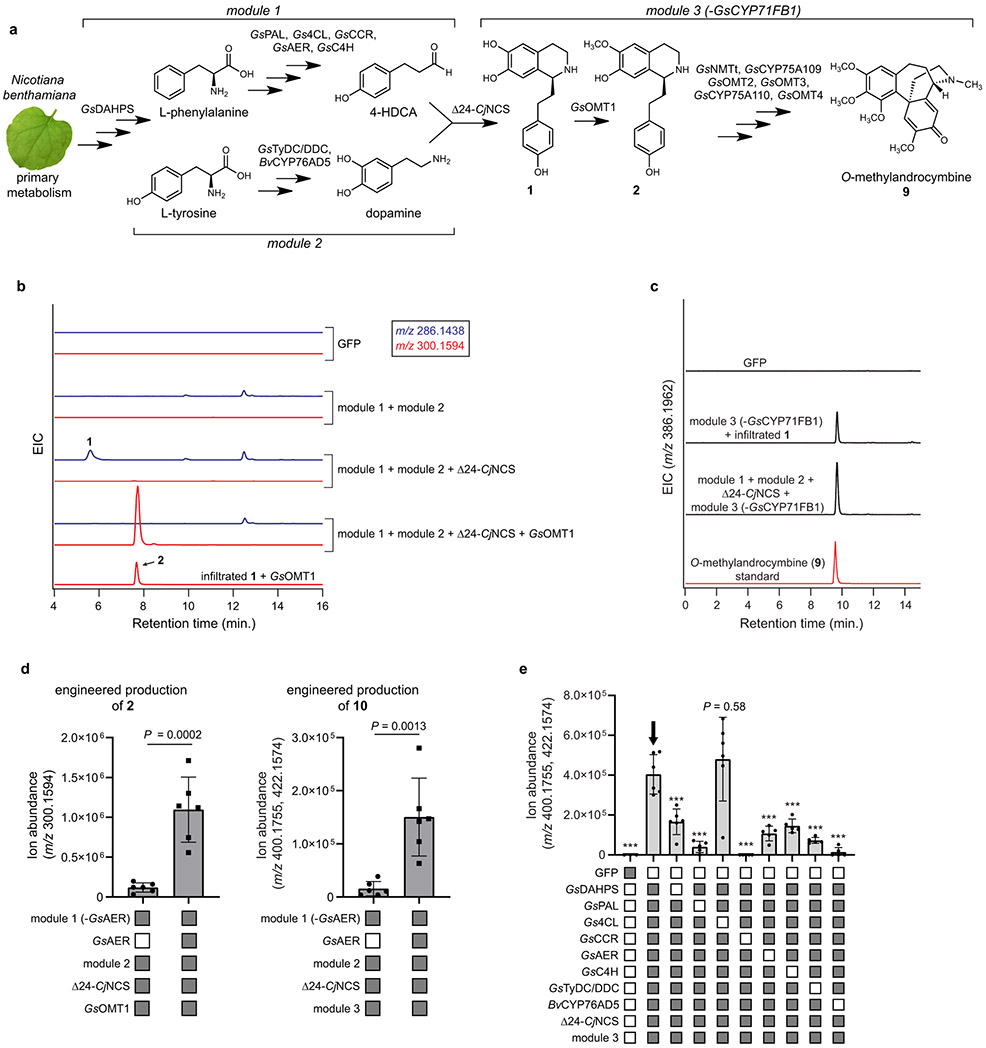
Subsequent addition of the downstream biosynthetic genes (GsOMT1, GsNMTt, GsCYP75A109, GsOMT2, GsOMT3, GsCYP75A110, GsOMT4, and GsCYP71FB1; “module 3”) into this co-expression system enabled biosynthesis of colchicine alkaloids (Extended Data Fig. 11), including a complete pathway to N-formyldemecolcine (10) (Figure 5). Because NCS should specifically catalyze the formation of only the (S) enantiomer of 1,47,50 these data further indicate that the 1-phenethylisoquinlone intermediates between 1 and 7 being produced in this system are likely the (S) enantiomers. Critically, the ability of the module 3 enzymes to utilize these enantiomers aligns with the previous determination of 1-phenethylisoquinoline stereochemistry in colchicine biosynthesis.39
Figure 5. Engineered biosynthesis of N-formyldemecolcine (10) from primary metabolism in Nicotiana benthamiana.
a) Biosynthetic scheme depicting the combination of three biosynthetic modules and CjNCS from benzylisoquinoline alkaloid (BIA) biosynthesis for the engineered production of 10 in N. benthamiana. b) LC-MS chromatograms demonstrating formation of 10 ([M+H]+ = 400.1755 Da, [M+Na]+ = 422.1574 Da) via transient pathway expression in N. benthamiana leaves, as compared to an authentic standard of 10. EIC = extracted ion chromatogram. Metabolic engineering of 10 was repeated >3 times with similar results observed in each experiment. c) MS/MS fragmentation (m/z = 400.1755, 20V) of the new compound highlighted in panel b compared to that of the 10 standard. d) Calculated yield of products synthesized via module 1 (4-HDCA), module 2 (dopamine), and the full engineered pathway (10). Yields are reported as mass of compound per gram dry weight of extracted N. benthamiana leaf tissue (n=3 independent replicates for each experiment), along with the corresponding standard deviation (SD). See Supplementary Information for a discussion of yield comparisons to native colchicine-producing plants.
We further evaluated whether the pathway exists as a metabolic network, as opposed to a strictly linear route, by performing dropout experiments in which each individual enzyme from module 3 was removed from the engineered pathway to 10. In these experiments, we primarily observed accumulation of the proposed pathway intermediates illustrated in Figure 4, and did not detect mass signatures corresponding to alternative pathway intermediates (Extended Data Fig. 12 & Supplementary Information Fig. 5). The only exception identified was the order of the initial O- and N-methylations; we found that GsNMT activity can precede that of GsOMT1, but that initial activity by GsOMT1 is likely the major route (Extended Data Fig. 12).
In a similar dropout experiment, we determined that nearly all module 1 and module 2 genes contribute significantly to the observed yield of colchicine alkaloids produced heterologously in N. benthamiana (Extended Data Fig. 11). The only exception was Gs4CL, which did not appear to affect product accumulation. Although orthologous N. benthamiana enzymes may contribute to some of the early biosynthetic transformations, inclusion of all described enzymes except Gs4CL (16 enzymes total) is necessary for the highest observed biosynthetic capacity (Figure 5 & Extended Data Fig. 11). While the module 1 and module 2 genes do not necessarily reflect the native route of colchicine biosynthesis, they do represent a convenient and logical strategy for producing 4-HDCA and dopamine.
DISCUSSION
Future investigations are still needed to clarify the final metabolic steps in colchicine biosynthesis. In particular, previous investigations have indicated that N-deformylase, N-demethylase, and N-acetyltransferase enzymes are likely required for the conversion of 10 into colchicine (Supplementary Information Scheme 1).25,43 Elucidating these three final biosynthetic transformations, as well as the remaining unidentified native enzymes within early colchicine biosynthesis, will help to finalize our understanding of how this alkaloid is produced in nature.
Through our combined use of metabolomics, transcriptomics, and heterologous expression in N. benthamiana, we have been able to rapidly establish a near complete reconstitution of the complex biosynthetic pathway of colchicine, a plant-derived drug of historical and contemporary importance. By combining biosynthetic genes from the medicinal plant G. superba with enzymes co-opted from other pathways (16 genes total), we demonstrate de novo biosynthetic production of N-formyldemecolcine (10) in this commonly used model plant. Ultimately, our results not only provide a metabolic route to the hallmark tropolone scaffold of colchicine, but also highlight a powerful strategy for accelerating the discovery and engineering of natural product biosynthesis in medicinal plants.
METHODS
Chemicals and Reagents
Unless stated otherwise, general chemicals and reagents, including several colchicine alkaloids (demecolcine [11], N-deacetylcolchicine [12], and colchicine [13]) were purchased commercially from chemical vendors. Authentic standards of (R,S)-autumnaline (7) and O-methylandrocymbine (9) were graciously provided from the Kutchan Lab Natural Product Collection (Professor Toni Kutchan, Danforth Center).
Plant growth
Nicotiana benthamiana plants were sown in PRO MIX HP Mycorrhizae soil (Premier Tech Horticulture) and maintained on growth shelves on a 16-hour light/8-hour dark cycle at room temperature. Plants were grown for 4-5 weeks prior to Agrobacterium infiltration, with periodic watering, as needed. Gloriosa superba seeds were obtained from eBay (seller: therealflorida101). For germination, seeds were soaked in warm water at 30 °C overnight, and then planted in PRO MIX HP Mycorrhizae soil. Plants were grown on a growth shelf under a 16-hour light/8-hour dark cycle at ambient lab temperature with periodic watering, as needed. Plants were harvested 5 weeks after germination to assess the accumulation of putative colchicine biosynthetic intermediates within leaf, stem, root, and rhizome tissues and to extract total RNA from these same tissues. Tissues were immediately snap frozen in liquid nitrogen upon removal from the plant and stored at −80 °C for future use.
RNA isolation, library prep, and RNA sequencing
Liquid nitrogen-frozen G. superba tissues were homogenized using a previously chilled mortar and pestle, and total RNA was extracted using the Spectrum Plant Total RNA Kit (Sigma-Aldrich), according to the manufacturer’s instructions. For cloning of gene candidates, cDNA was prepared from extracted mRNA using the SuperScript III First-Strand Synthesis System (Invitrogen). RNA samples intended for RNA-seq analysis were assessed using an RNA 6000 Nano chip on a 2100 Bioanalyzer (Agilent) to assess RNA quality and quantity. RNA-seq libraries for leaf (x2), stem (x2), root (x2), and rhizome (x5) tissues were prepared from high-quality RNA using the NEBNext® Ultra Directional RNA Library Prep Kit for Illumina® (New England Biolabs) by following the manufacturer instructions. The quality and average length of each library (insert size distribution was ~500-1000 bp) was assessed using a High Sensitivity DNA chip on a 2100 Bioanalyzer (Agilent). Next-generation sequencing (paired-end, 2 x 300 bp) was performed using a single lane on the Illumina MiSeq system at the Stanford Center for Genomics and Personalized Medicine (SCGPM).
RNA-seq data analysis
Transcriptomic data mining and analysis of the Medicinal Plants Consortium data sets
RNA-sequencing data from Gloriosa superba and Colchicum autumnale were downloaded from the Medicinal Plants Consortium database (https://www.medplantrnaseq.org/; the following files were downloaded: Gloriosa_superba.tar.gz, Colchicum_autumnale.tar.gz). For analysis of the public G. superba data, the previously de novo assembled transcriptome (file: contigs.fa) and associated predicted peptides (file: peptides.fa) were used as provided. The number of fragments per kilobase of contig per million mapped reads (FPKM) for each contig was determined using the number of paired aligned reads provided in the associated ‘readcounts’ folder (four libraries total; two different count files for each library; no description of tissues or conditions). Pfam annotations for each contig/protein were provided in the associated ‘annot’ folder. All contigs were annotated with the best BLAST hit (BLASTX) from the Arabidopsis thaliana proteome (The Arabidopsis Information Resource [TAIR], https://www.arabidopsis.org/). Select contigs were further annotated with the best BLASTX hit from the non-redundant Reference Sequence (RefSeq) database available from the National Center for Biotechnology Information (NCBI) website.
The public C. autumnale RNA-seq data contained raw reads from corm (a.k.a. bulb), fruit, and leaf tissue (each with single replicates), along with a previously de novo assembled transcriptome (file: contigs.fa) and associated peptides (file: peptides.fa). The provided reads were used to quantify contig abundance for this transcriptome. Read quality for each library was assessed using FastQC (Babraham Bioinformatics, Babraham Institute), after which they were trimmed accordingly using trimmomatic51 with the following parameters: <ILLUMINACLIP:TruSeq3-PE.fa:2:30:10 HEADCROP:14 LEADING:5 TRAILING:5 SLIDINGWINDOW:4:5 MINLEN:20>. Reads were mapped to the C. autumnale transcriptome using bowtie252 and quantified with eXpress.53 Total read counts generated by eXpress were normalized using the edgeR trimmed mean of M (TMM) method54 and then transformed into counts per million (CPM) values, which were log2-transformed for subsequent analyses. Contigs were annotated using Pfam protein family searches55 and with the best BLAST hit (BLASTX) from the Arabidopsis thaliana proteome.
Transcriptome assembly and analysis of newly acquired Gloriosa superba RNA-seq data
The quality of the raw reads generated from our Illumina MiSeq sequencing of G. superba tissue samples was first assessed with FastQC, then trimmed using trimmomatic <ILLUMINACLIP:TruSeq3-PE.fa:2:30:10 HEADCROP:20 LEADING:10 TRAILING:10 SLIDINGWINDOW:4:10 MINLEN:50>. The trimmed reads were used to assemble individual transcriptomes de novo using Velvet and Oases56 with k-mer sizes of 101-201 at increments of 10. The clustering tool CD-HIT-EST57 was used to identify sequences with greater than 99% identity (word size = 11) for each k-mer assembly, with only the longest representative transcript kept for further processing and analysis. All of the individual k-mer transcriptomes were then combined and clustered further using CD-HIT-EST at a threshold of 99% identity (word size = 11). The combined set of transcripts was further assembled with CAP358 to combine contigs with significant overlaps (minimum 95% identity over at least 100 bp), which resulted in a final working assembly of 38,461 contigs. To provide a unique transcript ID, each contig was annotated with “Gsup” followed by a unique number (Gsup1, Gsup2, etc.). The contigs were then further annotated via searches against the Pfam database and by BLASTX/BLASTP searches using the Arabidopsis proteome as a reference. In addition, BLASTX and BLASTP searches against the NCBI non-redundant protein database were performed as necessary. The best BLASTP hits from the non-redundant protein database and from the Arabidopsis thaliana proteome for each G. superba gene characterized/utilized in this manuscript are listed in Supplementary Information Tables 1 & 2, respectively. The best BLASTP hits from within our G. superba transcriptome for each protein characterized in this study are listed in Supplementary Information Tables 3 (these are defined as the closest BLASTP hits that do not represent the query gene itself; in general, the closest hit with <90% identity is listed). The TargetP 1.1 Server59 was used to predict the presence of transit peptides in the predicted proteins from this transcriptome, as well as from those in the public Gloriosa and Colchicum transcriptomes (Supplementary Information Tables 4).
Trimmed reads for each library were mapped to the assembled transcriptome using bowtie2 and expression quantification was performed using eXpress. The total counts generated by eXpress were normalized using the TMM method within edgeR, and the resulting values were used to calculate CPM values, which were log2-transformed for downstream analyses. It was discovered post hoc that the original transcriptome assembly contained contigs with multiple, distinct coding sequences, which is indicative of in silico over-assembly of the transcriptome. In general, the coding sequences found within these contigs were unrelated, and thus we assumed these to be an artefact of transcriptome assembly. Select contigs of relevance to this study were manually separated between the coding sequences of interest within the transcriptome FASTA file, thus generating two distinct contigs. Following separation of the original contig, the two new contigs were annotated with the original transcript ID plus an appended “-a” or “-b” (e.g. the fused contig Gsup3807 became “Gsup3807-a” and “Gsup3807-b”). The resulting transcriptome assembly consisted of 38,466 contigs. This updated transcriptome was then used for re-quantification of transcript expression and functional annotation, as described above. Upon deposition into the NCBI Transcriptome Shotgun Assembly (TSA) database, 14 contigs were detected as contaminants, and were thus removed from the transcriptome, resulting in a final submission of 38,452 contigs.
Pearson correlation analyses for genes of interest were performed using the stats package available in R (Version 1.0.153). Hierarchical clustering was performed with CLUSTER (version 3.0) using expression data (TMM normalized, log2-transformed, and median-centered CPM) for contigs with a TMM-normalized CPM expression value greater than 25, which resulted in a total of 11,315 contigs in the analysis. These contigs were then clustered using “uncentered Pearson correlation” as a distance metric. The generated clusters and heat maps were visualized within TreeView software (Version: 1.1.6r4).
Cloning of candidate biosynthetic genes
Phusion High-Fidelity DNA Polymerase (Thermo Fisher Scientific) or Q5® High Fidelity DNA Polymerase (New England Biolabs) was used for all PCR amplification steps according to the manufacturer’s instructions. Oligonucleotide primers were purchased from Integrated DNA Technologies (IDT). In general, the open reading frames (ORFs) for candidate genes were cloned from G. superba rhizome cDNA. Native sequence, full-length clones for GsCYP71FB1 (Gsup17435-b) and CjNCS (GenBank accession: AB267399.2) were synthesized as gBlocks® Gene Fragments (IDT). A clone of the BvCYP76AD5 coding sequence (GenBank accession: KM592961.1) was provided by Professor Alan Lloyd (The University of Texas at Austin). For all cloned genes, overlaps with homology to the appropriate plasmid vector were included on the 5’ and 3’ end of each clone for subsequent Gibson assembly reactions. For PCR-amplified genes, this was accomplished by adding the homology regions to the corresponding oligonucleotide primers used for amplification (see Supplementary Information Tables 5 for a list of all primer sequences used in this study). Synthesized genes were ordered with the corresponding 5’ and 3’ homology regions already included in the sequence to be synthesized. Following PCR amplification of candidate gene sequences, DNA products were analyzed on 1% agarose gels, excised, and purified using the Zymoclean Gel DNA Recovery Kit (Zymo Research).
For use in DNA assembly reactions, pEAQ-HT plasmid60 (KanR) was digested with AgeI and XhoI restriction enzymes (New England Biolabs). PCR amplicons were inserted via an isothermal DNA assembly reaction using NEBuilder® HiFi DNA Assembly Mix (New England Biolabs), as per the manufacturer instructions. The assembly reaction mixtures were used directly to transform E. coli TOP10 or NEB 5α cells (New England Biolabs), which were plated for selection on LB agar (50 μg/mL kanamycin) at 37 °C. Positive transformants were determined via colony PCR to confirm the presence of the inserted DNA fragment and were then grown overnight in liquid LB media (50 μg/mL kanamycin) on a culture rotary drum at 37 °C. Plasmid DNA was isolated from E. coli cultures using the QIAprep Spin Miniprep Kit (Qiagen) or the ZR Plasmid Miniprep Kit (Zymo Research). Isolated plasmids harboring the desired insert were assessed with Sanger DNA sequencing (Elim Biopharm, Inc.) to confirm the sequence of the clone of interest.
Confirmed pEAQ-HT expression constructs were transformed into Agrobacterium tumefaciens (GV3101:pMP90) using the freeze-thaw method and plated on LB agar (50 μg/mL kanamycin and 30 μg/mL gentamycin) for selection of positive transformants. After two days of growth, positive colonies were identified via colony PCR. Positive transformants were grown in liquid LB media (50 μg/mL kanamycin and 30 μg/mL gentamycin) at 30 °C on a culture rotary drum for two days, after which 25% glycerol stocks were prepared and stored at −80 °C for future use.
For heterologous expression in Saccharomyces cerevisiae (yeast), coding sequences for GsCYP75A110 and GsCYP71FB1 were PCR amplified from pEAQ-HT constructs with primers containing overlaps for assembly into the yeast expression plasmid pYeDP60 (CarbR for E. coli selection; ADE2 for yeast selection). Prior to assembly, pYeDP60 was digested with EcoRI and BamHI restriction enzymes at 37 °C for 2 hours, after which the reaction was terminated by heating at 65 °C for 30 minutes. Agarose gel-purified PCR amplicons for the genes of interest were inserted into the digested pYeDP60 plasmid using an isothermal DNA assembly reaction, as described above. The assembly mixture was then used to transform NEB10β cells (New England Biolabs), which were plated for selection on LB agar (100 μg/mL carbenicillin). Positive transformants were determined via colony PCR as described above, and grown overnight in liquid LB media (100 μg/mL carbenicillin) on a culture rotary at 37 °C. Plasmid DNA was isolated as described above and constructs were assessed with Sanger sequencing to confirm the sequence of the inserted gene.
Transient expression of candidate genes in Nicotiana benthamiana
Agrobacterium strains harboring the gene constructs of interest were streaked individually on LB plates (50 μg/mL kanamycin and 30 μg/mL gentamicin) at 30 °C for two days, at which point a lawn of cells had developed. Cells/colonies were removed from the plate with a 1 mL pipette tip or sterile inoculating loop and resuspended in 1 mL of LB media. This mixture was centrifuged at 5000 x g for 5 min to pellet cells, after which the supernatant was removed. The cell pellet for each strain was resuspended in Agrobacterium induction buffer (10 mM MES, pH = 5.6, 10 mM MgCl2, 150 μM acetosyringone) and incubated at room temperature for 1-2 hours. Agrobacterium suspensions (OD600 = 0.6 for individually tested strains; OD600 = 0.3 for each strain when used in combination) were mixed in equal concentration (according to the experiment in question) and infiltrated into the abaxial side of N. benthamiana leaves from 4-5 week-old plants with a needleless 1 mL syringe. Unless stated otherwise, each experimental condition being tested consisted of three replicates, with each replicate corresponding to an independently infiltrated leaf. Each leaf among these three replicates was selected from a different N. benthamiana plant, such that no replicates for one experimental condition were taken from the same plant. In general, infiltrated leaves were harvested 4-5 days post-infiltration, snap frozen in liquid nitrogen, and stored at −80 °C for downstream processing.
For substrate co-infiltration studies, 50-250 μM of 1 in water with 0.1-0.5% DMSO (1 was prepared as a 50 mM stock in DMSO) was infiltrated into the abaxial side of previously Agrobacterium-infiltrated leaves with a needleless 1 mL syringe at 4 days post-infiltration. For co-infiltration of (R/S)-autumnaline (7) and O-methylandrocymbine (9) as substrates, 25 μM of substrate in water with 1% methanol (MeOH; 7 and 9 were prepared as 2.5 mM stock solutions in MeOH) was utilized. Substrate infiltration was no more difficult than Agrobacterium strain infiltration. Leaves were harvested 1 day later, snap frozen in liquid nitrogen, and stored at −80 °C for later processing.
In vitro assays with N. benthamiana crude leaf extracts
For in vitro experiments, leaves were infiltrated with Agrobacterium strains harboring the gene construct of interest, as previously described. After four days, the leaves were excised and snap frozen in liquid nitrogen. Approximately 1/3 of the infiltrated N. benthamiana leaf was homogenized with a small scoop of polyvinylpolypyrrolidone (PVPP; Sigma) in liquid nitrogen on a ball mill (Retsch MM 400) using 5 mm diameter stainless steel beads, with shaking at 25 Hz for 2 min. The homogenized leaf was then suspended in 1 mL of Tris buffer (100 mM Tris-HCl, pH 7.4, 10% glycerol, 1 mM phenylmethylsulfonyl fluoride, and 10 mM β-mercaptoethanol) and the suspension was incubated for 30 min on ice with periodic, gentle inversion. Extracts were centrifuged at 12,000 x g at 4 °C for 10 min to pellet debris, after which the clarified plant extract was removed. A 100 μL volume in vitro assay contained 50 μM of compound 1 and 1 mM of S-adenosylmethionine (SAM), with the remaining volume made up of clarified plant protein extract. Assays were run for 2 h at 30 °C before quenching with 1 volume of acetonitrile (ACN). Reactions were then flash frozen in liquid nitrogen, and lyophilized overnight. The dried residue was resuspended in 200 μL of ACN with sonication and filtered through 0.45 μm PTFE filters before metabolite analysis.
Heterologous expression in Saccharomyces cerevisiae
For yeast expression of CYP genes, we utilized S. cerevisiae strain WAT11 (ade2), which harbors a chromosomal copy of the Arabidopsis thaliana NADPH-cytochrome P450 reductase 1 gene (ATR1).61 This strain and the utilized yeast expression plasmid (pYeDP60) were graciously provided to our lab by Franck Pinot (Institut de biologie moléculaire des plantes, France). The WAT11 strain was routinely cultured with YPAD media (10 g/L Bacto yeast extract, 20 g/L Bacto peptone, 20 g/L glucose, and 80 mg/L adenine hemisulfate; 18 g/L agar for plates), and unless noted otherwise, yeast cultures were grown at 30 °C, and with shaking at 250 RPM for liquid cultures.
Competent yeast cells were prepared and transformed with expression constructs (empty vector, GsCYP75A110, and GsCYP71FB1) using the Frozen-EZ Yeast Transformation II Kit (Bio-Rad), and were selected by plating on synthetic drop-out media plates lacking adenine (6.7 g/L yeast nitrogen base without amino acids, 20 g/L glucose, 2 g/L drop-out mix minus adenine, 20 g/L agar; Cold Spring Harbor Protocols, DOI: 10.1101/pdb.rec8190 & 10.1101/pdb.rec8585). Colony PCR was utilized to confirm successful insertion of the genes of interest into pYeDP60, positive clones were re-streaked on synthetic drop-out media plates, and individual colonies from the re-streaked plates were used to inoculate liquid cultures of synthetic drop-out media. After growth for two days, liquid cultures were used to prepare 25% glycerol stocks that were stored at −80 °C.
Growth of yeast cultures and heterologous protein production was performed much as previously described.62 Freshly streaked colonies from each strain of interest were used to inoculate 4 mL synthetic drop-out media, and were then grown at 28 °C with 250 RPM shaking. After two days of growth, 2 mL of the initial culture was used to inoculate 500 mL of YPGE media (10 g/L Bacto yeast extract, 10 g/L Bacto peptone, 5 g/L glucose, and 3% [v/v] ethanol). Cultures were grown overnight at 28 °C with 250 RPM until reaching a density of ~5x10⁷ cells/mL, as determined by counting with a hemocytometer, at which point a sterile aqueous galactose solution was added to a final concentration of 10% (v/v) to induce heterologous gene expression. Cultures were then grown overnight until reaching a density of ~5x10⁸ cells/mL, at which point cultures were immediately prepared for microsomal protein isolation.
Isolation of yeast microsomes
Preparation of yeast microsomal protein fractions was performed according to an established protocol.62 After reaching the desired cell density following galactose induction, cultures were centrifuged at 5,000 x g for 5 min to pellet cells. Cell pellets were then resuspended in 1 mL of TEK buffer (50 mM Tris-HCl, 1 mM EDTA, 100 mM KCl, pH 7.4) per 0.5 g of wet cell pellet mass and incubated at room temperature for 5 min. Cells were then re-pelleted at 5,000 x g for 5 min and resuspended in 5 mL of ice-cold TES B buffer (50 mM Tris-HCl, 1 mM EDTA, 600 mM sorbitol, pH 7.4). All subsequent steps were performed at 4 °C and/or on ice. A volume of glass beads (0.5 mm diameter) roughly equal to that of the cell resuspensions was added to the cells in 500 mL centrifuge tubes, and cells were lysed mechanically by vigorous up-and-down shaking for 10 minutes (30 seconds of shaking followed by 30 seconds on ice). Next, 10 mL of ice-cold TES B buffer was added to the clarified lysate, and the resuspension was removed from the glass beads by pipetting and saved. The glass beads and residual lysate were washed an additional two times with 10 mL of TES B, and each of these fractions was combined with the prior 10 mL fraction (for a total of ~30 mL). The combined lysate was then centrifuged at 23,000 x g for 10 min at 4 °C to pellet large cell debris. The supernatant was removed from the pellet and the pellet was discarded. The supernatant (~30 mL) was then diluted two-fold with ice-cold TES B (to a final volume of ~60 mL), and microsomes were precipitated by the addition of NaCl to a final volume of 150 mM and polyethylene glycol (PEG)-4000 to a final concentration of 0.1 g/mL. After an incubation of ~1 hour on ice with periodic mixing, microsomal protein fractions were collected by centrifugation at 10,000 x g for 10 min at 4 °C. The supernatant was discarded, and the microsomal pellet was resuspended in 1 mL of ice-cold TEG storage buffer (50 mM Tris-HCl, 1 mM EDTA, 20% [v/v] glycerol, pH 7.4). Microsomal protein content was quantified using the Bio-Rad Protein Assay Kit, and 60 μL aliquots were snap frozen in liquid nitrogen and stored at −80 °C for future use.
In vitro assays with microsomes purified from yeast
Microsomal enzyme assays were run in potassium phosphate buffer (50 mM potassium phosphate, 100 mM NaCl, pH 7.5) within a volume of 100 μL. Each reaction contained 40 μg microsomal protein, 25 μM substrate (7 or 9), and 1 mM NADPH. Control reactions were performed in which microsomal protein or NADPH were omitted from the reaction. Reactions were incubated at 30 °C for several time points (15, 30, and 60 min), after which the reactions were quenched by the addition of 50 μL ACN with 0.1% formic acid. Quenched reactions were diluted 10-fold in 1:1 water:ACN with 0.1% formic acid and filtered through 0.45 μm PTFE filters prior to LC-MS analysis.
Metabolite extraction from plant material
Liquid nitrogen-frozen tissues (e.g. leaves from N. benthamiana transient expression experiments and G. superba samples) were lyophilized to dryness and weighed to calculate the dry mass of each sample. The samples were homogenized on a ball mill (Retsch MM 400) using 5 mm diameter stainless steel beads, with shaking at 25 Hz for 2 min. Generally, an 80:20 MeOH/H2O solution was used to extract the plant tissue, with 20 μL per mg dry weight used for N. benthamiana leaves and 100-250 μL per mg dry weight used for G. superba samples. The extracted samples were heated at 65 °C for 10 min, centrifuged at 10,000 x g for 5 min to pellet plant debris, and the remaining solvent was filtered through 0.45 μm PTFE filters before analysis via high-resolution liquid chromatography-mass spectrometry (LC-MS). For detection of aldehydes, samples were derivatized using Girard’s reagent T.63 To accomplish this, 100 μL of filtered plant extract (or standard dissolved in MeOH) was mixed with 100 μL of Girard T reagent in MeOH (20 mg/mL) and 20 μL acetic acid. The samples were mixed and then incubated at 70 °C for 30 min. Samples were cooled to room temperature before LC-MS analysis.
LC-MS analysis
In general, metabolite samples were analyzed by reversed-phase liquid chromatography on an Agilent 1260 HPLC, using a 5 μm, 2 × 100 mm Gemini NX-C18 column (Phenomenex). Water with 0.1% formic acid (A) and ACN with 0.1% formic acid (B) were used as the mobile phase components at a flow rate of 0.4 mL/min with the following 33 min gradient method: 0-1 min, 3% B; 1-21 min, 3-50% B; 21-22 min, 50-97% B; 22-27 min, 97% B; 27-28 min, 97-3% B; 28-33 min, 3% B. In vitro assays were initially analyzed with reversed-phase chromatography as described above with the following 20 min gradient method: 0-1 min, 3% B; 1-11 min, 3-97% B; 11-15 min, 97% B; 15-16 min, 97-3% B; 16-20 min, 3% B.
Analysis of polar intermediates (e.g. tyramine, L-DOPA, and dopamine) was performed using hydrophilic interaction liquid chromatography (HILIC) analysis with either a 1.7μm, 2.1 x 50 mm Acquity UPLC® BEH Amide column (Waters) or a 5 μm, 2.1 x 100 mm XBridge® BEH Amide column (Waters). For HILIC analysis, water with 0.125% formic acid, 10 mM ammonium formate (A) and 95:5 ACN:water with 0.125% formic acid, 10 mM ammonium formate (B) were used as the mobile phase components at a flow rate of 0.6 mL/min with the following 21 min gradient method: 0-2 min, 100% B; 2-12 min, 100-60% B; 12-13 min, 60-100% B; 13-21 min, 100% B. Prior to HILIC analysis, methanolic extracts (as described previously) and standards were diluted 1:10 in ACN with 0.1% formic acid to better match the initial mobile phase for adequate chromatography.
For both reversed-phase and HILIC analysis, a coupled Agilent 6520 Accurate-Mass Q-TOF ESI mass spectrometer was used to collect MS data in positive ion mode (parameters: mass range: 100-1700 m/z; drying gas: 300°C, 11 L/min; nebulizer: 25 psig; capillary: 3500 V; fragmentor: 150 V; skimmer: 65 V; octupole 1 RF Vpp: 750 V; 1000 ms per spectrum). The first 0.5 min of each run was discarded to avoid salt contamination of the MS apparatus. For tandem mass spectrometry (MS/MS) analysis, 5, 10, 20 and 40 V collision energies were used with an m/z window of 1.3 centered on the exact mass of the specific m/z being analyzed.
Metabolomics and MS data analysis
High-resolution mass spectrometry (HRMS) data were analyzed using MassHunter Qualitative Analysis software (Agilent) and XCMS64 (Scripps Center for Metabolomics). For untargeted metabolomics, MassHunter (Agilent) data files were converted to mzXML or mzML format using trapper (Seattle Proteome Center) or MSConvert (ProteoWizard). Grouped mzXML/mzML files were preprocessed and analyzed by XCMS, using the following sample R script:
library(xcms)
xset<-xcmsSet()
xset<-group(xset)
xset2<-retcor(xset,family=“s”,plottype=“m”)
xset2<-group(xset2)
xset3<-retcor(xset2,family=“s”,plottype=“m”)
xset3<-group(xset3)
xset4<-retcor(xset3,family=“s”,plottype=“m”)
xset4<-group(xset4,bw=10)
xset5<-fillPeaks(xset4)
reporttab<-diffreport(xset5, “A”, “B”, “A vs B”, 2000)
The output of this analysis contains a list of identified mass signatures at specific retention times, along with associated m/z values, peak intensity fold change, statistical test outputs (P-value, two-tailed unequal variance Student’s t-test), retention times, and extracted peak intensities. Unless stated otherwise, this list was generally filtered to select for mass signatures with a P-value less than 0.1, a t value greater than 0, a fold change greater than 5, a retention time less than 1800 seconds, and an average peak intensity greater than 5×10⁴. This filtering allowed for the analysis to be focused on a more targeted list of differentially-produced mass signatures. The relative ion abundances for a given mass signature reported in this manuscript were generally determined within the MassHunter Qualitative Analysis software by automated integration (“Agile” method with default settings) of extracted ion chromatograms (EICs) with a 20-50 ppm mass range tolerance.
For all other data sets, statistical analyses of reported data were performed in Microsoft Excel 2016, GraphPad Prism (8.0.2), or JMP Pro (13.0). For each experiment/figure in which statistical tests were performed, the presented/reported values represent individual, distinct samples and not repeated measurements.
Synthesis of 1-phenethylisoquinoline precursor (1)
Synthesis of compound 1 (1-[2-(4-hydroxyphenyl)ethyl]-6,7-dihydroxy-1,2,3,4-tetrahydroisoquinoline) was adapted from a previously described protocol.40 151 mg of 3-(4-hydroxyphenyl)propanal (also referred to 4-hydroxydihydrocinnamaldehyde, or 4-HDCA; Small Molecules, Inc.) and 144 mg of dopamine (Millipore Sigma) in 4 mL of 1:1 ACN to potassium phosphate buffer (0.1 M, pH = 6.0) was stirred at 50 °C for 14 hours. After this incubation, 3 volumes of dichloromethane (DCM) were added to the mixture. The mixture was then extracted several times with Milli-Q water. The aqueous fractions were combined and acidified to pH = 3.0. The mixture was then purified with a Strata-XL-C 100 μm solid phase extraction column (500 mg/3 mL, Phenomenex). 6.8 mg of putative 1 was obtained, and the structure was verified by 1H NMR using a 400 MHz NMR spectrometer (Varian).
1-[2-(4-hydroxyphenyl)ethyl]-6,7-dihydroxy-1,2,3,4-tetrahydroisoquinoline (1): 1H NMR (400 MHz, Methanol-d4) δ 7.05 (d, J = 8.5 Hz, 2H), 6.70 (d, J = 8.4 Hz, 2H), 6.56 (s, 1H), 6.51 (s, 1H), 3.94 (q, J = 3.8 Hz, 1H), 3.28-3.22 (m, 1H), 3.00-2.93 (m, 1H), 2.83 – 2.55 (m, 4H), 2.14-1.94 (m, 2H). (Supplementary Information Fig. 6)
Isolation and purification of an O-methylandrocymbine (9) standard
C. autumnale bulbs (McClure & Zimmerman, Randolph, WI; Odyssey Bulbs, South Lancaster, MA) were purchased in the fall, at which point flower shoots had begun to emerge. Bulb, shoot, and flower tissues were cut into small pieces, snap froze in liquid nitrogen, and lyophilized to dryness. Dried tissue was frozen with liquid nitrogen and ground to a fine powder using mortar/pestle. In general, purification of putative 9 was based upon a previously described purification of this compound.43 For 10-20 g samples of dried tissue, 500 mL of ethanol (EtOH) was added, and this extraction was stirred using a magnetic stir bar at 200 RPM for 24-48 hours. The extract was clarified through filter paper (Fisherbrand® Filter Paper, Qualitative P5), and a small aliquot of this was analyzed with LC-MS for the presence of colchicine alkaloids, including putative 9 ([M+H]+ = 386.1962), which were confirmed to be present. After this confirmation, the EtOH extract was dried under vacuum using a rotary evaporator system. The resulting yellow residue was resuspended in 500 mL water with 2% tartaric acid (pH 2). This fraction was partitioned with 50 mL of diethyl ether or tert-butyl methyl ether (TBME). The separated organic fraction was washed with 2 x 20 mL water with 2% tartaric acid and 2 x 8 mL DI water, after which each of these aqueous fractions were combined with the initial 500 mL aqueous fraction. The pH of the aqueous phase was increased to 8 using saturated sodium bicarbonate, and this was then partitioned with 3 x 500 mL ethyl acetate. The organic fractions were combined and evaporated to dryness on a rotary evaporator.
The dried residue was resuspended in 10:1 DCM:MeOH and filtered through Celite to remove any insoluble particulates. Successive rounds of FLASH chromatography using either 10:1 or 20:1 DCM:MeOH with 2% triethylamine as the mobile phase and silica gel as the stationary phase afforded fractions (analyzed by LC-MS) that contained most of the desired compound (putative 9), but also a significant amount of demecolcine (11, [M+H]+ = 372.1805), which was in much higher abundance, and therefore prevented NMR analysis. Furthermore, significant co-elution of the desired product and demecolcine (11) also occurred under reversed-phase HPLC conditions, thus preventing facile purification. To enable further chromatographic purification, fractions containing the desired product were mixed with acetic formic anhydride, as described below for the synthesis of N-formyldemecolcine (10). This resulted in near complete consumption of demecolcine (11) and production of N-formyldemecolcine (10), which is easily separable from 9 via reversed-phase HPLC. Essentially no loss of 9 occurred in this process. The desired product was then purified by preparative HPLC using an Agilent 1260 Infinity preparative-scale HPLC system with an Agilent 1100 diode array detector and a Clipeus C18 5 μm, 10 x 250 mm semi-prep column (Higgins Analytical, Inc). Water with 0.1% formic acid (A) and ACN with 0.1% formic acid (B) were used as the mobile phase components at a flow rate of 3 mL/min with the following gradient method: 0-1 min, 20% B; 1-21 min, 20-50% B; 21-22 min, 50-97% B, 22-32 min, 97% B; 32-33 min, 97-20% B; 33-45 min, 20% B. Fractions were collected from 1-45 minutes, and those containing the compound of interest (as verified via LC-MS) were combined, frozen, and lyophilized to dryness. In total, ~100-200 μg of putative 9 was obtained. The status of this compound as 9 was confirmed via 1H NMR using a 500 MHz NMR spectrometer (Inova), with comparison of chemical shifts to previously published spectra of 9.32,65,66 Additionally, this compound was compared to an authentic standard of 9 obtained from the Kutchan Lab Natural Product Collection via LC-MS and MS/MS analysis.
O-methylandrocymbine (9): 1H NMR (500 MHz, CDCl3) δ 6.82 (s, 1H), 6.32 (s, 1H), 6.30 (s, 1H), 4.02 (s, 3H), 3.92 (m), 3.83 (s, 6H), 3.64 (s, 3H), 2.97-2.90 (m, 2H), 2.77 (m, 1H), 2.58 (m, 1H), 2.39 (s, 3H), 2.37 (m, 1H), 2.21 (m). *Further upfield shifts not observed due to low abundance of compound and presence of contaminating peaks. (Supplementary Information Fig. 7)
Synthesis of N-formyldemecolcine (10)
N-formyldemecolcine was synthesized via N-formylation of demecolcine (Millipore Sigma), following an adaption of a previously established amine formylation protocol.67 Formic acid (61 μL, 1.62 mmol) and acetic anhydride (153 μL, 1.62 mmol) were mixed under inert gas and stirred at 65 °C for 30 minutes, after which the reaction mix, containing acetic formic anhydride, was allowed to cool to room temperature. This reagent was then added to demecolcine (3.3 mg, 8.9 μmol) dissolved in 100 μL DCM under inert gas, and the mixture was stirred on ice (0-4 °C) for 1 hour. After this incubation, excess MeOH was added to quench the reaction, which was then evaporated to dryness using a rotary evaporator. Success of the reaction was verified by LC-MS, which revealed that nearly all demecolcine (m/z 372.1805) had been consumed, and that a new peak had appeared with a HRMS m/z value of 400.1755 Da ([M+H]+), which is consistent with N-formyldemecolcine (10). 1H NMR analysis of the reaction product was performed using a 400 MHz NMR spectrometer (Varian), which verified its status as N-formyldemecolcine (10), as compared to a published 1H NMR spectrum.68
N-formyldemecolcine (10): 1H NMR (400 MHz, CDCl3) Observed as a mixture of rotamers. δ 8.30 and 8.10 (both s, together 1H), 7.28 (d, 1H, J = 11 Hz), 7.19 and 7.12 (both s, together 1H), 6.82 and 6.80 (both d, together 1H, J = 11 Hz), 6.56 and 6.53 (both s, together 1H), 4.80 and 4.13 (both m, together 1H), 4.00, 3.98, 3.94, 3.91, 3.89, 3.65, and 3.64 (all s, together 12H), 3.24 and 2.83 (both s, together 3H), 2.75-2.03 (m, 4H) (Supplementary Information Fig. 8)
Extended Data
Extended Data Figure 1. Characterization of GsOMT1.
a) LC-MS chromatograms demonstrating activity on substrate (1) by protein lysates from Nicotiana benthamiana leaves transiently expressing GsOMT1. Shown are extracted ion chromatograms (EICs) for 1 (m/z 286.1438; left panel), as well as the methylated product (*) produced in this experiment (m/z 300.1594; right panel). This experiment was performed three times, with similar results each time. b) MS/MS fragmentation spectrum of 1, as well as the generated m/z 300.1594 product (*) at a collision energy of 20V. Fragmentation of both compounds was performed twice, with similar results observed each time. c) Tabulated list and putative structures for ion fragments generated from MS/MS analysis of 1. d) Tabulated list and putative structures for ion fragments generated from MS/MS analysis of the m/z 300.1594 product. See Supplementary Information for a detailed analysis of MS/MS results. e) Proposed reaction catalyzed by GsOMT1 as supported by MS/MS fragmentation and prior labeling studies. f) Transient expression of GsOMT1 in Nicotiana benthamiana with co-infiltrated substrate 1 results in production of methylated product (2), as shown here via LC-MS chromatograms. This experiment was performed >3 times with similar results observed each time. g) Untargeted metabolite analysis (XCMS) comparing transient expression of GFP (negative control) to that of GsOMT1 with co-infiltrated substrate 1 (n=3 independent replicates for each experimental condition). Shown are unique mass signatures (P < 0.1 between samples, as determined via XCMS) in ranked order based upon their increasing (top panel) or decreasing (bottom panel) fold-change in abundance between the two compared conditions (i.e. GFP vs. GsOMT1). The mass isotopologues (M0 and M1) for the presumed product (m/z 300.1594) are highlighted in red, while the substrate (1, m/z 286.1438) is highlighted in blue. r.t. = retention time.
Extended Data Figure 2. Characterization of GsNMT.
a) Co-expression of GsOMT1 and GsNMT in N. benthamiana with co-infiltrated 1 leads to consumption of putative 2 (m/z 300.1594) and production of a new compound corresponding to a methylation (m/z 314.1751), as shown here via LC-MS chromatograms. EIC = extracted ion chromatogram. Activity of full-length GsNMT was confirmed in three separate experiments. b) MS/MS fragmentation spectrum of the generated m/z 314.1751 product (*) at a collision energy of 20V. This was performed twice, with similar results observed each time. c) Tabulated list and putative structures for ion fragments generated from MS/MS analysis of the m/z 314.1751 product. See Supplementary Information for a detailed analysis of MS/MS results. d) Untargeted metabolite analysis (XCMS) comparing the presence vs. absence of GsNMT within the transient co-expression system (n=6 independent replicates for each experimental condition). Shown are unique mass signatures (P < 0.1 between samples, as determined via XCMS) in ranked order based upon their increasing (top panel) or decreasing (bottom panel) fold-change in abundance between the two compared conditions. The mass isotopologues (M0 and M1) of the presumed product (m/z 314.1751) are highlighted in red, while the mass isotopologues of the presumed substrate (m/z 300.1594) are highlighted in blue. r.t. = retention time. e) Proposed reaction catalyzed by GsNMT as supported by MS/MS fragmentation and prior labeling studies.
Extended Data Figure 3. Characterization of GsCYP75A109.
a) Addition of GsCYP75A109 into the N. benthamiana transient expression system with co-infiltrated 1 leads to consumption of 3 (m/z 314.1751) and production of a new compound corresponding to a hydroxylation (m/z 330.1700), as shown here via LC-MS chromatograms. EIC = extracted ion chromatogram. These results were confirmed in two independent experiements. b) MS/MS fragmentation spectrum of the generated m/z 330.1700 product (*) at a collision energy of 20V. Consistent results were obtained in three separate experiments. c) Tabulated list and putative structures for ion fragments generated from MS/MS analysis of the m/z 330.1700 product. See Supplementary Information for a detailed analysis of MS/MS results. d) Untargeted metabolite analysis (XCMS) comparing the presence vs. absence of GsCYP75A109 within the transient co-expression system (n=6 independent replicates for each experimental condition). Shown are unique mass signatures (P < 0.1 between samples, as determined via XCMS) in ranked order based upon their increasing (top panel) or decreasing (bottom panel) fold-change in abundance between the two compared conditions. The presumed product (m/z 330.1700) is highlighted in red, while the mass isotopologues (M0, M1) of the presumed substrate (m/z 314.1751) are highlighted in blue. r.t. = retention time. e) Proposed reaction catalyzed by GsCYP75A109 as supported by MS/MS fragmentation and prior labeling studies. f) An N-terminal truncation of a predicted mitochondrial localization signal from GsNMT (yielding GsNMTt) increases yield of putative 4 (m/z 330.1700) in the transient co-expression system, as shown here via representative LC-MS chromatograms. g) Quantification of the heterologous production of 3 (m/z 314) or 4 (m/z 330) with the use of GsNMT or GsNMTt within the co-expression system. Filled-in boxes (gray) indicate the presence of a gene within the co-expression experiment, while an empty box (white) indicates its absence. Shown for each reaction is the mean of 3 distinct biological replicates along with the corresponding standard deviation. Statistical comparisons were made using a one-tailed Student’s t-test, with an assumption of unequal variance. n.d. = not detected. Direct comparison between the experimental conditions was performed twice with similar results obtained each time. Activity of GsNMTt within pathway engineering was consistent in >3 experiments.
Extended Data Figure 4. Characterization of GsOMT2.
a) Addition of GsOMT2 into the N. benthamiana transient co-expression system with co-infiltrated 1 leads to consumption of putative 4 (m/z 330.1700) and production of a new compound corresponding to both a methylation and a hydroxylation (m/z 360.1805), as shown here via LC-MS chromatograms. EIC = extracted ion chromatogram. This activity was confirmed >3 independent experiments. b) MS/MS fragmentation spectrum of the generated m/z 360.1805 product (*) at a collision energy of 20V. MS/MS fragmentation of this peak was performed twice, with similar results each time. c) Tabulated list and putative structures for ion fragments generated from MS/MS analysis of the m/z 360.1805 product. See Supplementary Information for a detailed analysis of MS/MS results. d) Untargeted metabolite analysis (XCMS) comparing the presence vs. absence of GsOMT2 within the transient co-expression system (n=6 independent replicates for each experimental condition). Shown are unique mass signatures (P < 0.1 between samples, as determined via XCMS) in ranked order based upon their increasing (top panel) or decreasing (bottom panel) fold-change in abundance between the two compared conditions. The mass isotopologues (M0, M1, and M2) for the presumed product (m/z 360.1805) are highlighted in red, while the mass isotopologues (M0, M1) of the presumed substrate (m/z 330.1700) are highlighted in blue. r.t. = retention time. e) Proposed reaction catalyzed by GsOMT2, and tentatively GsCYP75A109, as supported by MS/MS fragmentation and prior labeling studies. Note that compound 5 is not observed within our co-expression system, presumably due to its consumption to 6.
Extended Data Figure 5. Characterization of GsOMT3.
a) Addition of GsOMT3 into the N. benthamiana transient co-expression system with co-infiltrated 1 leads to consumption of 6 (m/z 360.1805) and production of a new compound corresponding to a methylation (m/z 374.1962), as shown here via LC-MS chromatograms. The new peak was compared to a racemic standard of autumnaline (7) - (R,S)-autumnaline - which supports the identity of this new compound as 7. EIC = extracted ion counts. This experiment was repeated >3 times with similar results observed each time. b) MS/MS fragmentation spectrum of the generated m/z 374.1962 product (*) compared to that of racemic 7, each at a collision energy of 20V. This was performed three times, with similar results observed each time. c) Tabulated list and putative structures for ion fragments generated from MS/MS analysis of the m/z 374.1962 product. See Supplementary Information for a detailed analysis of MS/MS results. d) Untargeted metabolite analysis (XCMS) comparing the presence vs. absence of GsOMT3 within the transient co-expression system (n=6 independent replicates for each experimental condition). Shown are unique mass signatures (P < 0.1 between samples, as determined via XCMS) in ranked order based upon their increasing (top panel) or decreasing (bottom panel) fold-change in abundance between the two compared conditions. The mass isotopologues (M0, M1) for the product (m/z 374.1962) are highlighted in red, while the mass isotopologues (M0, M1, and M2) of the presumed substrate (m/z 360.1805) are highlighted in blue. r.t. = retention time. e) Proposed reaction catalyzed by GsOMT3, as supported by MS/MS fragmentation, prior labeling studies, and comparison to a 7 standard.
Extended Data Figure 6. Characterization of GsCYP75A110.
a) Addition of GsCYP75A110 into the N. benthamiana transient co-expression system with co-infiltrated 1 leads to consumption of 7 (m/z 374.1962) and production of a new compound corresponding to a loss of 2 hydrogens (m/z 372.1805), as shown here via LC-MS chromatograms. EIC = extracted ion chromatogram. This experiment was performed >3 times with similar results observed each time. b) MS/MS fragmentation spectrum of the generated m/z 372.1805 product (*) at a collision energy of 20V. This spectrum is shown because it represents the only peak consumed in downstream biosynthesis (see Extended Data Fig. 7). MS/MS fragmentation of this peak was performed twice, with similar results observed each time. c) Tabulated list and putative structures for ion fragments generated from MS/MS analysis of the m/z 372.1805 product. d) Untargeted metabolite analysis (XCMS) comparing the presence vs. absence of GsCYP75A110 within the transient co-expression system (n=6 independent replicates for each experimental condition). Shown are unique mass signatures (P < 0.1 between samples, as determined via XCMS) in ranked order based upon their increasing (top panel) or decreasing (bottom panel) fold-change in abundance between the two compared conditions. The mass signatures for two of the presumed products (m/z 372.1805) are highlighted in red, while the mass signature of the presumed substrate (m/z 374.1962) is highlighted in blue. r.t. = retention time. e) Expression of GsCYP75A110 individually with substrate (7) co-infiltration, as shown through LC-MS chromatograms of substrate (7, m/z 374.1962) and products (m/z 372.1805). Shown for comparison are the products produced via pathway reconstitution in N. benthamiana. This experiment was performed once. f) In vitro assays using microsomal protein isolated from yeast expressing GsCYP75A110. Shown are LC-MS chromatograms of substrate (7) and products (m/z 372.1805) with comparison to the products produced within the N. benthamiana transient expression system. Peak integrations for the substrate (7) are shown in blue text to demonstrate consumption of the substrate in the presence of GsCYP75A110-containing microsomal protein and NADPH. This experiment was performed once. g) Predicted, alternative phenol coupling isomers may explain the three isomeric peaks detected with m/z 372.1805. h) Proposed reaction catalyzed by GsCYP75A110, as supported by MS/MS fragmentation and prior labeling studies.
Extended Data Figure 7. Characterization of GsOMT4.
a) Addition of of GsOMT4 into the N. benthamiana transient co-expression system with co-infiltrated 1 leads to consumption of 8 (m/z 372.1805) and production of a new compound corresponding to a methylation (m/z 386.1962), as shown here via LC-MS chromatograms. Comparison to an O-methylandrocymbine (9) standard purified from Colchicum autumnale plants supports the identity of this compound as 9. EIC = extracted ion chromatogram. This result was confirmed in >3 independent experiments. b) MS/MS fragmentation spectrum of the generated m/z 386.1962 product (*) compared to the purified 9 standard, with both compounds fragmented at a collision energy of 20V. This was performed twice, with similar results observed each time. c) Tabulated list and putative structures for ion fragments generated from MS/MS analysis of the m/z 386.1962 product. d) Untargeted metabolite analysis (XCMS) comparing the presence vs. absence of GsOMT4 within the transient co-expression system (n=6 independent replicates for each experimental condition). Shown are unique mass signatures (P < 0.1 between samples, as determined via XCMS) in ranked order based upon their increasing (top panel) or decreasing (bottom panel) fold-change in abundance between the two compared conditions. The mass signature for the product (9, m/z 386.1962) is highlighted in red, while the mass signature of the presumed substrate (m/z 372.1805) is highlighted in blue. r.t. = retention time. e) Proposed reaction catalyzed by GsOMT4, as supported by MS/MS fragmentation, prior labeling studies, and comparison to an isolated 9 standard.
Extended Data Figure 8. Characterization of GsCYP71FB1.
a) Addition of GsCYP71FB1 into the N. benthamiana transient co-expression system with co-infiltrated 1 leads to consumption of 9 (m/z 386.1962) and production of a new compound with identified masses of m/z 400.1755 [M+H+] and 422.1574 [M+Na]+ as shown here via LC-MS chromatograms. Comparison to an authentic N-formyldemecolcine (10) standard supports formation of this compound. EIC = extracted ion chromatogram. This experiment was performed twice, with similar results observed each time. b) MS/MS fragmentation spectrum of the generated m/z 400.1755 product (*) compared to the 10 standard, with both compounds fragmented at a collision energy of 20V. This was performed three times, with similar results each time. c) Transient expression of GsCYP71FB1 individually in N. benthamiana with substrate (9) co-infiltration, as shown through LC-MS chromatograms of substrate (9, m/z 386.1962) and product (10, m/z 400.1755) with comparison to a 10 standard. This experiment was performed once. d) In vitro assays using microsomal protein isolated from yeast expressing GsCYP71FB1. Shown are LC-MS chromatograms of substrate (9) and product (10) with comparison to the 10 standard. Peak integrations for the substrate (9) are shown in blue text to demonstrate its consumption in the presence of GsCYP71FB1-containing microsomal protein and NADPH. This experiment was performed once. e) Untargeted metabolite analysis (XCMS) comparing the presence vs. absence of GsCYP71FB1 within the transient co-expression system (n=6 independent replicates for each experimental condition). Shown are unique mass signatures (P < 0.1 between samples, as determined via XCMS) in ranked order based upon their increasing (top panel) or decreasing (bottom panel) fold-change in abundance between the two compared conditions. The mass isotopologues (M0, M1) as well as adducts (+Na, +K) for the product (10, m/z 400.1755) are highlighted in red, while the mass isotopologues (M0, M1) and adducts (2M+Na) of the substrate (9, m/z 386.1962) are highlighted in blue. r.t. = retention time. f) Proposed reaction catalyzed by GsCYP71FB1, as supported by MS/MS fragmentation, prior labeling studies, and comparison to an authentic 10 standard.
Extended Data Figure 9. Comparison of intermediates produced in the Nicotiana benthamiana co-expression system to Gloriosa superba metabolites.
Each biosynthetic product downstream of 1 produced in our co-expression system (black traces) were compared to the equivalent mass ion found within G. superba rhizome extracts (blue traces) or to a verified standard (red traces) via LC-MS analysis. EIC = extracted ion chromatogram. Additionally, MS/MS spectra for co-eluting peaks were compared to demonstrate the chemical similarity between these compounds. Collision energies for all shown MS/MS analyses were 20V, with the exception of 1, for which fragmentation at 10V is shown. These LC-MS comparisons were performed once with multiple biological replicates of G. superba metabolite extractions (n=6 biological replicates from four different tissues: leaf, stem, root, and rhizome). The chromatographic traces for G. superba metabolites in this figure are from a representative rhizome extract. Retention time and MS/MS spectra for compounds produced via heterologous expression in N. benthamiana were consistent among individual experiments.
Extended Data Figure 10. Engineering early metabolites in colchicine biosynthesis.
a) List of module 1 biosynthetic genes and their best BLASTP hit in Arabidopsis thaliana. Note that all genes except for GsAER seem to have an ortholog in Arabidopsis with >60% identity, suggesting functional equivalence. b) Generalized pathway for the proposed engineered production of 4-HDCA in N. benthamiana. c) LC-MS chromatograms demonstrating that co-expression of module 1 in N. benthamiana leads to production of 4-HDCA, which was detected as the Girard reagent T derivative (m/z 264.1707). EIC = extracted ion chromatogram. Production of 4-HDCA with module 1 genes was demonstrated three times with similar results each time. d) LC-MS chromatograms (via HILIC analysis) assessing the production of tyramine (left panel, m/z 138.0913), L-DOPA (middle panel, m/z 198.0761), and dopamine (right panel, m/z 154.0863) upon individual and co-expression of GsTyDC/DDC and BvCYP76AD5 (module 2). Next to each set of chromatograms is the corresponding relative quantifications of tyramine (m/z 138), L-DOPA (m/z 198), and dopamine (m/z 154) within each reaction. Shown for each reaction is the mean of 3 distinct biological replicates along with the corresponding standard deviation. n.d. = not detected. Module 2 activity was confirmed in >3 times individual experiments. e) Proposed scheme for the engineered biosynthesis of dopamine. f) Comparison of native CjNCS function within benzylisoquinoline alkaloid (BIA) biosynthesis to the putative reaction required within colchicine alkaloid biosynthesis. g) Co-expression of both module 1 and module 2 genes in N. benthamiana leads to concurrent production of the requisite aldehyde (m/z 264.1707, Girard T derivative), as well as dopamine (m/z 154.0863), as shown here via LC-MS chromatograms. Note that dopamine is observed here with C18 chromatography. Co-expression of both modules was performed >3 times, with similar results each time. h) LC-MS chromatograms for the co-expression of module 1 and module 2 with CjNCS with comparison to an authentic 1 standard. These experiments were performed >3 times, with similar results observed each time. i) MS/MS fragmentation comparison between the newly identified m/z 286.1438 peak (*) and the 1 standard. Both were analyzed with a collision energy of 10V. This MS/MS comparison was performed twice. j) Comparison of wild-type, full-length CjNCS function to N-terminal truncations of 24 (Δ24-CjNCS) and 29 (Δ29-CjNCS) amino acids. Filled-in boxes (gray) indicate the presence of a gene within the co-expression experiment, while an empty box (white) indicates its absence. Shown for each reaction is the mean of 3 biological replicates along with the corresponding standard deviation.
Extended Data Figure 11. Metabolic engineering of colchicine alkaloids in Nicotiana benthamiana.
a) Biosynthetic scheme of the transient metabolic engineering system in N. benthamiana for the production of 2 and 9. b) LC-MS chromatograms for the co-expression of GsOMT1 with module 1, module 2, and Δ24-CjNCS compared to that of GsOMT1 expressed alone with co-infiltration of 1. Shown are the extracted ion chromatograms (EICs) for 1 (blue traces, m/z 286.1438) and the production of 2 (red traces, m/z 300.1594). c) LC-MS chromatograms demonstrating the production of 9 via co-expression of module 3 (without GsCYP71FB1) with module 1, module 2, and Δ24-CjNCS. This is compared to infiltration of 1 (as substrate) with co-expression of module 3 (without GsCYP71FB1), as well as to a standard of O-methylandrocymbine (9). Shown are the EICs specific to the exact mass of 9 (m/z 386.1962). Engineered production of 2 and 9 was demonstrated three times for each molecule. d) Production of two different colchicine alkaloids (2, m/z 300.1594; 10, m/z 400.1755, 422.1574) via metabolic engineering in N. benthamiana when GsAER is either omitted or included. Filled-in boxes (gray) indicate the presence of a module/gene within the co-expression experiment, while an empty box (white) indicates its absence. Shown for each reaction is the mean of 6 biological replicates ± standard deviation for each condition. Statistical significance was assessed using a two-tailed Student’s t-test with an assumption of unequal variance. Production of 2 in this context was assessed once, while production of 10 was performed twice with similar results each time. e) Individual dropout of each module 1 and module 2 gene within the engineered production of 10 (m/z 400.1755, 422.1574). Shown for each reaction is the mean ± standard deviation for each reaction condition. n=3 for GFP control; n=5 for PAL, CCR, AER, C4H, TyDC/DDC, and BvCYP76AD5 dropouts; n=6 for 4CL and DAHPS dropouts and for the no-dropout control. All replicates represent independent biological replicates. Statistical comparisons made using Dunnett’s test (two-tailed) with comparison to the full pathway control (indicated by arrow). *** = P < 0.001. This experiment was performed twice, with similar results each time.
Extended Data Figure 12. Dropout analysis of module 3 biosynthetic genes.
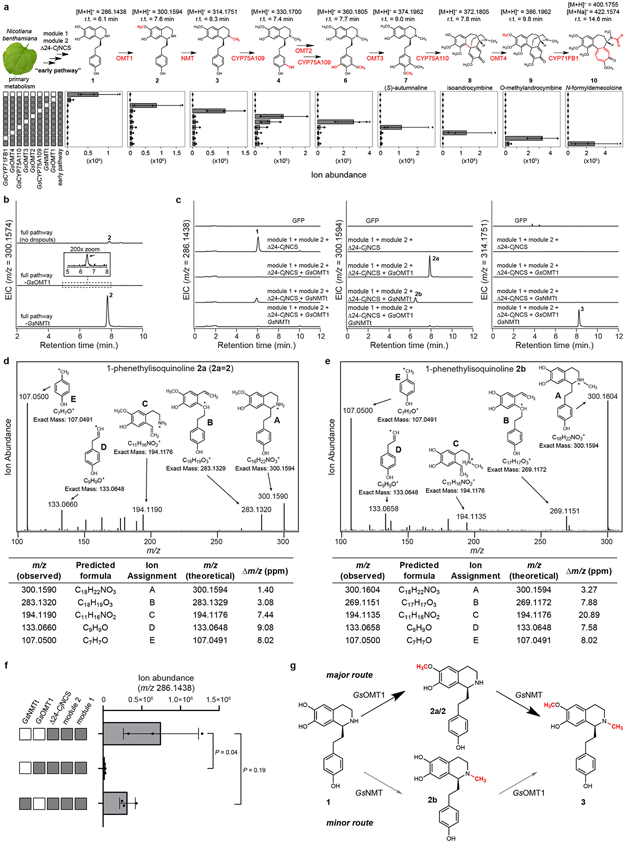
Metabolic engineering of the full pathway to N-formyldemecolcine (10) in N. benthamiana was compared to transient co-expression systems in which individual module 3 enzymes were removed. a) Accumulation of proposed pathway intermediates within dropout experiments. Gray boxes to the left of the graph indicate biosynthetic genes/modules included within a co-expression experiment, while white boxes indicate their absence. Shown for each intermediate is the mean extracted ion abundance (n=3, ± standard deviation) for the exact ion mass [M+H]+ (for 10, both [M+H]+ and [M+Na]+), as well as the retention time (r.t.) that corresponds to each compound. b) Dropout of GsOMT1 from the full engineered pathway leads to accumulation of a new compound with a mass equivalent to 2 (m/z 300.1594), as shown via LC-MS chromatograms. The newly identified peak is indicated via the arrow. EIC = extracted ions chromatogram. c) Transient co-expression of GsOMT1 or GsNMTt with module 1, module 2, and Δ24-CjNCS (for production of 1). Shown are the LC-MS chromatograms for the substrate (1, m/z 286.1438), singly-methylated products (2a and 2b, m/z 300.1574) and doubly-methylated product (3, m/z 314.1751). d) MS/MS fragmentation spectrum of 2a/2 (collision energy of 20V), as well as a tabulated list and putative structures for the ion fragments. e) MS/MS fragmentation spectrum of 2b (collision energy of 20V), as well as a tabulated list and putative structures for the ion fragments. Note that fragment B (m/z 269) supports the placement of the methyl group on the nitrogen. For reference, compare to fragment B of 2a in panel “d”. f) Comparative consumption of 1 by GsOMT1 and GsNMTt. Gray boxes indicate the presence of a gene/module within the co-expression experiment, while a white box indicates its absence. n=3 for each reaction; statistical comparisons made using Dunnett’s test with comparison to the module 1/module 2/Δ24-CjNCS control. g) Proposed scheme for the initial methylations of 1. All experiments shown in this figure were performed once.
Supplementary Material
ACKNOWLEDGEMENTS
We would like to thank Dr. Kevin Smith for his assistance with chemical synthesis and acquisition/interpretation of NMR data. We further acknowledge the Stanford Center for Genomics and Personalized Medicine (SCGPM) for RNA sequencing services and the Stanford Genetics Bioinformatics Service Center for the use of computational resources supported by NIH S10 Instrumentation Grant S10OD023452. Also, we thank Professor David Nelson (University of Tennessee) for his assistance in the systematic naming of the CYP enzymes characterized in this study, Professor George Lomonossoff (John Innes Centre, UK) for providing us with the pEAQ-HT expression plasmid, Professor Alan Lloyd (The University of Texas at Austin) for sharing a clone of the BvCYP76AD5 coding sequence, and Professor Toni Kutchan (Danforth Center) for providing us with authentic standards of 7 and 9. This work was supported by an NIH U01 GM110699, an R01 GM121527, and an HHMI-Simons Faculty Scholar award (to E.S.S.). R.S.N. is a Howard Hughes Medical Institute Fellow of the Life Sciences Research Foundation.
Footnotes
COMPETING INTERESTS
The authors declare no competing financial interests.
Supplementary Information is available for this paper and includes further interpretation and discussion of results, as well as supplementary figures and tables.
DATA AVAILABILITY
All reported data within this study are available via database or by request. Coding DNA sequences for the genes characterized and assessed in this study are provided as FASTA sequences within the Supplementary Information document, and are deposited in the National Center for Biotechnology Information (NCBI) GenBank database with the following accessions: GsOMT1 (MT512039), GsNMT (MT512040), GsNMTt (MT512041), GsCYP75A109 (MT512042), GsOMT2 (MT512043), GsOMT3 (MT512044), GsCYP75A110 (MT512045), GsOMT4 (MT512046), GsCYP71FB1 (MT512047), GsTyDC/DDC (MT512048), GsPAL (MT512049), GsCCR (MT512050), GsAER (MT512051), Gs4CL (MT512052), GsC4H (MT512053), GsDAHPS (MT512054), Δ24-CjNCS (MT512055), Δ29-CjNCS (MT512056). Raw reads from RNA-seq profiling of G. superba are deposited in the NCBI Sequence Read Archive (SRA) database under the BioProject accession PRJNA634925. The corresponding Transcriptome Shotgun Assembly (TSA) project has been deposited at DDBJ/EMBL/GenBank under the accession GIOZ00000000. The version described in this paper is the first version, GIOZ01000000. Gene constructs described in this manuscript will be made available upon request. Synthetic substrates and purified compounds will be made available upon request, as possible. Select data sets that were critical to the conclusions of this study are provided with the online version of this manuscript.
REFERENCES
- 1.Atanasov AG et al. Discovery and resupply of pharmacologically active plant-derived natural products: A review. Biotechnol. Adv 33, 1582–1614 (2015). [DOI] [PMC free article] [PubMed] [Google Scholar]
- 2.Slobodnick A, Shah B, Pillinger MH & Krasnokutsky S Colchicine: old and new. Am. J. Med 128, 461–470 (2015). [DOI] [PMC free article] [PubMed] [Google Scholar]
- 3.Davis MW Colchicine compositions and methods. U.S. Patent No 7,964,647. July 19 (2011).
- 4.Jana S & Shekhawat GS Critical review on medicinally potent plant species: Gloriosa superba. Fitoterapia 82, 293–301 (2011). [DOI] [PubMed] [Google Scholar]
- 5.Sivakumar G Upstream biomanufacturing of pharmaceutical colchicine. Crit. Rev. Biotechnol 38, 83–92 (2018). [DOI] [PubMed] [Google Scholar]
- 6.Bhattacharyya B, Panda D, Gupta S & Banerjee M Anti-mitotic activity of colchicine and the structural basis for its interaction with tubulin. Med. Res. Rev 28, 155–183 (2008). [DOI] [PubMed] [Google Scholar]
- 7.De Luca V, Salim V, Atsumi SM & Yu F Mining the biodiversity of plants: a revolution in the making. Science 336, 1658–1661 (2012). [DOI] [PubMed] [Google Scholar]
- 8.Harvey AL, Edrada-Ebel R & Quinn RJ The re-emergence of natural products for drug discovery in the genomics era. Nat. Rev. Drug Discov 14, 111–29 (2015). [DOI] [PubMed] [Google Scholar]
- 9.Hartung EF History of the use of Colchicum and related medicaments in gout: with suggestions for further research. Ann. Rheum. Dis 13, 190–200 (1954). [DOI] [PMC free article] [PubMed] [Google Scholar]
- 10.Yang LPH Oral colchicine (Colcrys®). Drugs 70, 1603–1613 (2010). [DOI] [PubMed] [Google Scholar]
- 11.Jordan MA & Wilson L Microtubules as a target for anticancer drugs. Nat. Rev. Cancer 4, 253–265 (2004). [DOI] [PubMed] [Google Scholar]
- 12.Finkelstein Y et al. Colchicine poisoning: The dark side of an ancient drug. Clin. Toxicol 48, 407–414 (2010). [DOI] [PubMed] [Google Scholar]
- 13.Makino S & Sasaki M On the chromosome number of man. Proc. Jpn. Acad 35, 99–104 (2018). [Google Scholar]
- 14.Ravelli RBG et al. Insight into tubulin regulation from a complex with colchicine and a stathmin-like domain. Nature 428, 198–202 (2004). [DOI] [PubMed] [Google Scholar]
- 15.Eng WH & Ho WS Polyploidization using colchicine in horticultural plants: A review. Sci. Hortic. (Amsterdam) 246, 604–617 (2019). [Google Scholar]
- 16.Herbert RB The biosynthesis of plant alkaloids and nitrogenous microbial metabolites. Nat. Prod. Rep 20, 494–508 (2001). [DOI] [PubMed] [Google Scholar]
- 17.Larsson S & Rønsted N Reviewing Colchicaceae alkaloids – perspectives of evolution on medicinal chemistry. Curr. Top. Med. Chem 14, 274–289 (2014). [DOI] [PMC free article] [PubMed] [Google Scholar]
- 18.Leete E & Nemeth PE The biogenesis of the alkaloids from Colchicum. I. The incorporation of phenylalanine into colchicine. J. Am. Chem. Soc 82, 6055–6057 (1960). [Google Scholar]
- 19.Battersby AR & Reynolds JJ Biosynthesis of colchicine. Proc. Chem. Soc 50, 346–347 (1960). [Google Scholar]
- 20.Leete E The biosynthesis of the alkaloids of Colchicum. III. The incorporation of phenylalanine-2-C14 into colchicine and demecolcine. J. Am. Chem. Soc 85, 3666–3669 (1963). [Google Scholar]
- 21.Battersby AR, Binks R, Reynolds JJ & Yeowell DA Alkaloid biosynthesis. Part VI. The biosynthesis of colchicine. J. Chem. Soc 4257–4268 (1964). [Google Scholar]
- 22.Battersby AR, Binks R & Yeowell DA Biosynthesis of colchicine. Proc. Chem. Soc 86 (1964). [Google Scholar]
- 23.Leete E Biosynthesis of the tropolone ring of colchicine. Tetrahedron Lett. 333–336 (1965). [Google Scholar]
- 24.Battersby AR, Herbert RB, McDonald E, Ramage R & Clements JH Biosynthesis of colchicine from a 1-phenethylisoquinoline. Chem. Commun 603–605 (1966). doi: 10.1039/c19660000603 [DOI] [PubMed] [Google Scholar]
- 25.Barker AC, Battersby AR, McDonald E, Ramage R & Clements JH Biosynthesis of colchicine: ring expansion and later stages. Structure of speciosine. Chem. Commun 390b – 392 (1967). doi: 10.1039/c1967000390b [DOI] [Google Scholar]
- 26.Battersby AR, Dobson TA, Foulkes DM & Herbert RB Alkaloid biosynthesis. Part XVI. Colchicine: origin of the tropolone ring and studies with the C6-C3-C6-C1 system. J. Chem. Soc. Perkin Trans 1 1730–1736 (1972). [DOI] [PubMed] [Google Scholar]
- 27.Battersby AR, Herbert RB, McDonald E, Ramage R & Clements JH Alkaloid biosynthesis. Part XVIII. Biosynthesis of colchicine from the 1-phenethylisoquinoline system. J. Chem. Soc. Perkin Trans 1 1741–1746 (1972). [DOI] [PubMed] [Google Scholar]
- 28.Herbert RB & Knagg E The biosynthesis of the phenethylisoquinoline alkaloid, colchicine, from cinnamaldehyde and dihydrocinnamaldehyde. Tetrahedron Lett. 27, 1099–1102 (1986). [Google Scholar]
- 29.Herbert RB, Kattah AE & Knagg E The biosynthesis of the phenethylisoquinoline alkaloid colchicine. Early and intermediate stages. Tetrahedron 46, 7119–7138 (1990). [Google Scholar]
- 30.Nasreen A, Gundlach H & Zenk MH Incorporation of phenethylisoquinolines into colchicine in isolated seeds of Colchicum autumnale. Phytochemistry 46, 107–115 (1997). [Google Scholar]
- 31.Maier UH & Zenk MH Colchicine is formed by para-para phenol coupling from autumnaline. Tetrahedron Lett. 38, 7357–7360 (1997). [Google Scholar]
- 32.Rueffer M & Zenk MH Microsome-mediated transformation of O-methylandrocymbine to demecolcine and colchicine. FEBS Lett. 438, 111–113 (1998). [DOI] [PubMed] [Google Scholar]
- 33.Sheldrake PW et al. Biosynthesis. Part 30. Colchicine: studies on the ring expansion step focusing on the fate of the hydrogens at C-4 of autumnaline. J. Chem. Soc. Perkin Trans 1 3003–3010 (1998). doi: 10.1039/a803853h [DOI] [Google Scholar]
- 34.Lau W & Sattely ES Six enzymes from mayapple that complete the biosynthetic pathway to the etoposide aglycone. Science 349, 1224–1228 (2015). [DOI] [PMC free article] [PubMed] [Google Scholar]
- 35.Hodgson H et al. Identification of key enzymes responsible for protolimonoid biosynthesis in plants: Opening the door to azadirachtin production. Proc. Natl. Acad. Sci 116, 17096–17104 (2019). [DOI] [PMC free article] [PubMed] [Google Scholar]
- 36.Miettinen K et al. The seco-iridoid pathway from Catharanthus roseus. Nat. Commun 5, (2014). [DOI] [PMC free article] [PubMed] [Google Scholar]
- 37.Jacobowitz JR & Weng J Exploring uncharted territories of plant specialized metabolism in the postgenomic era. Annu. Rev. Plant Biol 71, 1–28 (2020). [DOI] [PubMed] [Google Scholar]
- 38.Wildman WC Chapter 8: Colchicine and related compounds. in Alkaloids: Chemistry and Physiology (ed. Manske RHF) 6, 247–288 (Academic Press, Inc., 1965). [Google Scholar]
- 39.McDonald E et al. Biosynthesis. Part 27. Colchicine: studies of the phenolic oxidative coupling and ring-expansion processes based on incorporation of multiply labeled 1-phenethylisoquinolines. J. Chem. Soc. Perkin Trans 1 2979–2988 (1998). [Google Scholar]
- 40.Pesnot T, Gershater MC, Ward JM & Hailes HC Phosphate mediated biomimetic synthesis of tetrahydroisoquinoline alkaloids. Chem. Commun 47, 3242 (2011). [DOI] [PubMed] [Google Scholar]
- 41.Nasreen A, Rueffer M & Zenk MH Cytochrome P-450-dependent formation of isoandrocymbine from autumnaline in colchicine biosynthesis. Tetrahedron Lett. 37, 8161–8164 (1996). [Google Scholar]
- 42.Battersby AR, Ramage R & Laboratories RR 1-phenethylisoquinoline alkaloids. Part II. The structures of alkaloids from Colchicum cornigerum (Sweinf.) Tackh. et Drar. J. Chem. Soc 3514–3518 (1971). [DOI] [PubMed] [Google Scholar]
- 43.Barker AC et al. Biosynthesis. Part 28. Colchicine: definition of intermediates between O-methylandrocymbine and colchicine and studies on speciosine. J. Chem. Soc. Perkin Trans 1 2989–2994 (1998). doi: 10.1039/a803851a [DOI] [Google Scholar]
- 44.Bonawitz ND & Chapple C The genetics of lignin biosynthesis: connecting genotype to phenotype. Annu. Rev. Genet 44, 337–363 (2010). [DOI] [PubMed] [Google Scholar]
- 45.Maeda H & Dudareva N The shikimate pathway and aromatic amino acid biosynthesis in plants. Annu. Rev. Plant Biol 63, 73–105 (2012). [DOI] [PubMed] [Google Scholar]
- 46.Sunnadeniya R et al. Tyrosine hydroxylation in betalain pigment biosynthesis is performed by cytochrome P450 enzymes in beets (Beta vulgaris). PLoS One 11, 1–16 (2016). [DOI] [PMC free article] [PubMed] [Google Scholar]
- 47.Luk LYP, Bunn S, Liscombe DK, Facchini PJ & Tanner ME Mechanistic studies on norcoclaurine synthase of benzylisoquinoline alkaloid biosynthesis: An enzymatic Pictet-Spengler reaction. Biochemistry 46, 10153–10161 (2007). [DOI] [PubMed] [Google Scholar]
- 48.Ruff BM, Bräse S & O’Connor SE Biocatalytic production of tetrahydroisoquinolines. Tetrahedron Lett. 53, 1071–1074 (2012). [DOI] [PMC free article] [PubMed] [Google Scholar]
- 49.Nishihachijo M et al. Asymmetric synthesis of tetrahydroisoquinolines by enzymatic Pictet-Spengler reaction. Biosci. Biotechnol. Biochem 78, 701–707 (2014). [DOI] [PubMed] [Google Scholar]
- 50.Stadler R, Kutchan TM & Zenk MH (S)-norcoclaurine is the central intermediate in benzylisoquinoline alkaloid biosynthesis. Phytochemistry 28, 1083–1086 (1989). [Google Scholar]
- 51.Bolger AM, Lohse M & Usadel B Trimmomatic: A flexible trimmer for Illumina sequence data. Bioinformatics 30, 2114–2120 (2014). [DOI] [PMC free article] [PubMed] [Google Scholar]
- 52.Langmead B & Salzberg SL Fast gapped-read alignment with Bowtie 2. Nat. Methods 9, 357–9 (2012). [DOI] [PMC free article] [PubMed] [Google Scholar]
- 53.Roberts A & Pachter L Streaming fragment assignment for real-time analysis of sequencing experiments. Nat. Methods 10, 71–73 (2012). [DOI] [PMC free article] [PubMed] [Google Scholar]
- 54.Robinson MD & Oshlack A A scaling normalization method for differential expression analysis of RNA-seq data. Genome Biol. 11, R25 (2010). [DOI] [PMC free article] [PubMed] [Google Scholar]
- 55.Finn RD et al. The Pfam protein families database: Towards a more sustainable future. Nucleic Acids Res. 44, D279–D285 (2016). [DOI] [PMC free article] [PubMed] [Google Scholar]
- 56.Schulz MH, Zerbino DR, Vingron M & Birney E Oases: Robust de novo RNA-seq assembly across the dynamic range of expression levels. Bioinformatics 28, 1086–1092 (2012). [DOI] [PMC free article] [PubMed] [Google Scholar]
- 57.Li W & Godzik A Cd-hit: A fast program for clustering and comparing large sets of protein or nucleotide sequences. Bioinformatics 22, 1658–1659 (2006). [DOI] [PubMed] [Google Scholar]
- 58.Huang X & Madan, a. A DNA sequence assembly program. Genome Res. 9, 868–877 (1999). [DOI] [PMC free article] [PubMed] [Google Scholar]
- 59.Emanuelsson O, Brunak S, von Heijne G & Nielsen H Locating proteins in the cell using TargetP, SignalP and related tools. Nat. Protoc 2, 953–71 (2007). [DOI] [PubMed] [Google Scholar]
- 60.Sainsbury F, Thuenemann EC & Lomonossoff GP pEAQ: Versatile expression vectors for easy and quick transient expression of heterologous proteins in plants. Plant Biotechnol. J 7, 682–693 (2009). [DOI] [PubMed] [Google Scholar]
- 61.Urban P, Mignotte C, Kazmaier M, Delorme F & Pompon D Cloning, yeast expression, and characterization of the coupling of two distantly related Arabidopsis thaliana NADPH-cytochrome P450 reductases with P450 CYP73A5. J. Biol. Chem 272, 19176–19186 (1997). [DOI] [PubMed] [Google Scholar]
- 62.Pompon D, Louerat B, Bronine A & Urban P Yeast expression of animal and plant P450s in optimized redox environments. Methods Enzymol. 272, 51–64 (1996). [DOI] [PubMed] [Google Scholar]
- 63.Wood P Derivitization of fatty aldehydes and ketones: Girard’s reagent T (GRT). in Lipidomics 1609, 229–232 (2017). [Google Scholar]
- 64.Smith CA, Want EJ, O’Maille G, Abagyan R & Siuzdak G XCMS: Processing mass spectrometry data for metabolite profiling using nonlinear peak alignment, matching, and identification. Anal. Chem 78, 779–787 (2006). [DOI] [PubMed] [Google Scholar]
- 65.Hiroshi H, Hoshino O, Umezawa B & Iitaka T Studies on tetrahydroisoquinoline. Part 13. Total synthesis of (+/−)-O-methylandrocymbine, (+/−)-androcymbine, (+/−)-kreysigine, (+/−)-multifloramine, and their related phenehylisoquinoline alkaloids. J. Chem. Soc 2657–2663 (1979). [Google Scholar]
- 66.Nicolaou KC, Valiulin RA, Pokorski JK, Chang V & Chen JS Bio-inspired synthesis and biological evaluation of a colchicine-related compound library. Bioorganic Med. Chem. Lett 22, 3776–3780 (2012). [DOI] [PMC free article] [PubMed] [Google Scholar]
- 67.Gerack CJ & McElwee-White L Formylation of amines. Molecules 19, 7689–7713 (2014). [DOI] [PMC free article] [PubMed] [Google Scholar]
- 68.Dumont R, Brossi A & Silverton JV Facile conversion of natural colchicine into (±)-congeners and (+)-enantiomers including 2-demethyl analogues. J. Org. Chem 51, 2515–2521 (1986). [Google Scholar]
Associated Data
This section collects any data citations, data availability statements, or supplementary materials included in this article.
Supplementary Materials
Data Availability Statement
All reported data within this study are available via database or by request. Coding DNA sequences for the genes characterized and assessed in this study are provided as FASTA sequences within the Supplementary Information document, and are deposited in the National Center for Biotechnology Information (NCBI) GenBank database with the following accessions: GsOMT1 (MT512039), GsNMT (MT512040), GsNMTt (MT512041), GsCYP75A109 (MT512042), GsOMT2 (MT512043), GsOMT3 (MT512044), GsCYP75A110 (MT512045), GsOMT4 (MT512046), GsCYP71FB1 (MT512047), GsTyDC/DDC (MT512048), GsPAL (MT512049), GsCCR (MT512050), GsAER (MT512051), Gs4CL (MT512052), GsC4H (MT512053), GsDAHPS (MT512054), Δ24-CjNCS (MT512055), Δ29-CjNCS (MT512056). Raw reads from RNA-seq profiling of G. superba are deposited in the NCBI Sequence Read Archive (SRA) database under the BioProject accession PRJNA634925. The corresponding Transcriptome Shotgun Assembly (TSA) project has been deposited at DDBJ/EMBL/GenBank under the accession GIOZ00000000. The version described in this paper is the first version, GIOZ01000000. Gene constructs described in this manuscript will be made available upon request. Synthetic substrates and purified compounds will be made available upon request, as possible. Select data sets that were critical to the conclusions of this study are provided with the online version of this manuscript.


