

Abstract
OBJECTIVE.
The purpose of the present study is to evaluate the diagnostic performance of and interreader agreement for CT colonography (CTC) in the local staging of colon cancer, with emphasis given to the FOxTROT (Fluoropyrimidine, Oxaliplatin, and Targeted-Receptor pre-Operative Therapy [Panitumumab]) trial inclusion criteria, which propose a new tailored treatment paradigm for colon cancer that uses neoadjuvant therapy for patients with a high-risk of locoregional disease as determined by imaging.
MATERIALS AND METHODS.
This biinstitutional retrospective study involved 89 patients (with 93 tumors) who had colon cancer and underwent presurgical CTC. Two radiologists reviewed the CTC studies for local staging, including measurement of the tumor beyond the muscularis propria on a true orthogonal plane. Histopathologic findings for surgical colectomy specimens served as the reference standard for local pathologic staging. The sensitivity, specificity, positive predictive value, and negative predictive value for local determination of the T category, N category, and extramural vascular invasion (EMVI) were calculated separately for each reader. High-risk T category tumors were the same as those as used in the FOxTROT trial. Interreader agreement was assessed using the kappa statistic.
RESULTS.
Thirty-five of 93 tumors (37.6%) were histologically classified as high-risk tumors (T3c, T3d, or T4 tumors). The interreader agreement was substantial (κ = 0.68) for classifying high-risk tumors with the use of CTC, moderate for differentiating N0 from N1 and N2 (κ = 0.44), and slight for detecting EMVI (κ = 0.15). The diagnostic statistics for CTC for the two readers were as follows: for detection of high-risk tumors, sensitivity was 65.7% and 82.9%, and specificity was 81.0% and 87.9%; for detection of N category–positive disease, sensitivity was 50.9% and 69.8%, and specificity was 50.0% and 72.5%; and for detection of EMVI, sensitivity was 18.2% and 66.7%, and specificity was 60.0% and 91.7%.
CONCLUSION.
The present study shows that CTC might be a feasible imaging modality for preoperative local staging of higher-risk colon cancers for which neoadjuvant chemotherapy is more suitable on the basis of the FOxTROT trial criteria. However, further studies are required to allow a better generalization of our results.
Keywords: cancer staging, colon cancer, CT, CT colonography, neoadjuvant therapy
Estimates for the year 2018 showed that colorectal cancer was projected to be the third most common new cancer and the second most common cause of deaths among men and women combined in the United States [1]. From 1930 to 2015, decreases occurred in both the incidence of colon cancer and the number of deaths related to colorectal cancer in the United States [2], mainly as a result of progress in cancer prevention, early diagnosis, and more effective treatment. However, the incidence of colon cancer among patients younger than 50 years has been increasing [3]. Currently, the primary treatment for nonmetastatic colon cancer is colectomy with en bloc removal of regional lymph nodes. Depending on pathologic stage, adjuvant treatment may also be recommended [4].
Neoadjuvant therapy followed by surgery is a well-established treatment of locally advanced rectal cancer, with proven benefits in downstaging the tumor, improving tumor resectability, and reducing local recurrence rate [5–11]. On the other hand, neoadjuvant therapy is not widely accepted as a standard treatment of nonmetastatic colon cancer. The FOxTROT (Fluoropyrimidine, Oxaliplatin and Targeted-Receptor pre-Operative Therapy [Panitumumab]) trial was initiated to evaluate whether neoadjuvant chemotherapy with or without panitumumab reduces the 2-year recurrence rate, compared with standard surgery and adjuvant chemotherapy alone in patients with operable high-risk colon cancer (T4 or T3 cancer with tumor extension more than 5 mm beyond the muscularis propria). The preliminary results were promising and showed lower tumor stages, fewer positive lymph nodes, and fewer positive resection margins in patients who underwent neoadjuvant chemotherapy, compared with patients who underwent surgery immediately, with acceptable toxicity and morbidity [12, 13].
As such, accurate identification of patients for whom neoadjuvant therapy is suitable is crucial. Some studies evaluated the accuracy of CT in identifying patients at high risk for colon cancer, revealing sensitivities of 69–78% and specificities of 49–88% [14–17]. The use of MRI for this purpose has also been investigated and has shown sensitivities of 40–92% and specificities of 75–100% [17–19]. Colon cancer staging studies using CT colonography (CTC) have revealed a wide range of accuracy [20–25]; however, none of these studies has specifically evaluated the criteria used in the FOxTROT trial.
The aim of the present study was to evaluate the accuracy of and interreader agreement for CTC in local staging of colon cancer, emphasizing use of the FOxTROT trial inclusion criteria.
Materials and Methods
The institutional review boards at Memorial Sloan Kettering Cancer Center and the University of Wisconsin approved this retrospective study and waived the requirement for informed consent.
Study Population
The retrospective databases at both study institutions were searched to identify consecutive patients who underwent CTC either in a screening program or after incomplete colonoscopy performed at Memorial Sloan Kettering Cancer Center from January 2000 to May 2016 and at the University of Wisconsin from April 2005 to April 2016. Patients with colon adenocarcinoma who underwent CTC were included in the study; patients with rectal cancer were not included. Patients were excluded if postsurgical pathologic slides were not available for review, if they did not undergo surgery or had surgery performed at an outside hospital, and if they had recurrent disease. Patient accrual is summarized in Figure 1.
Fig. 1—
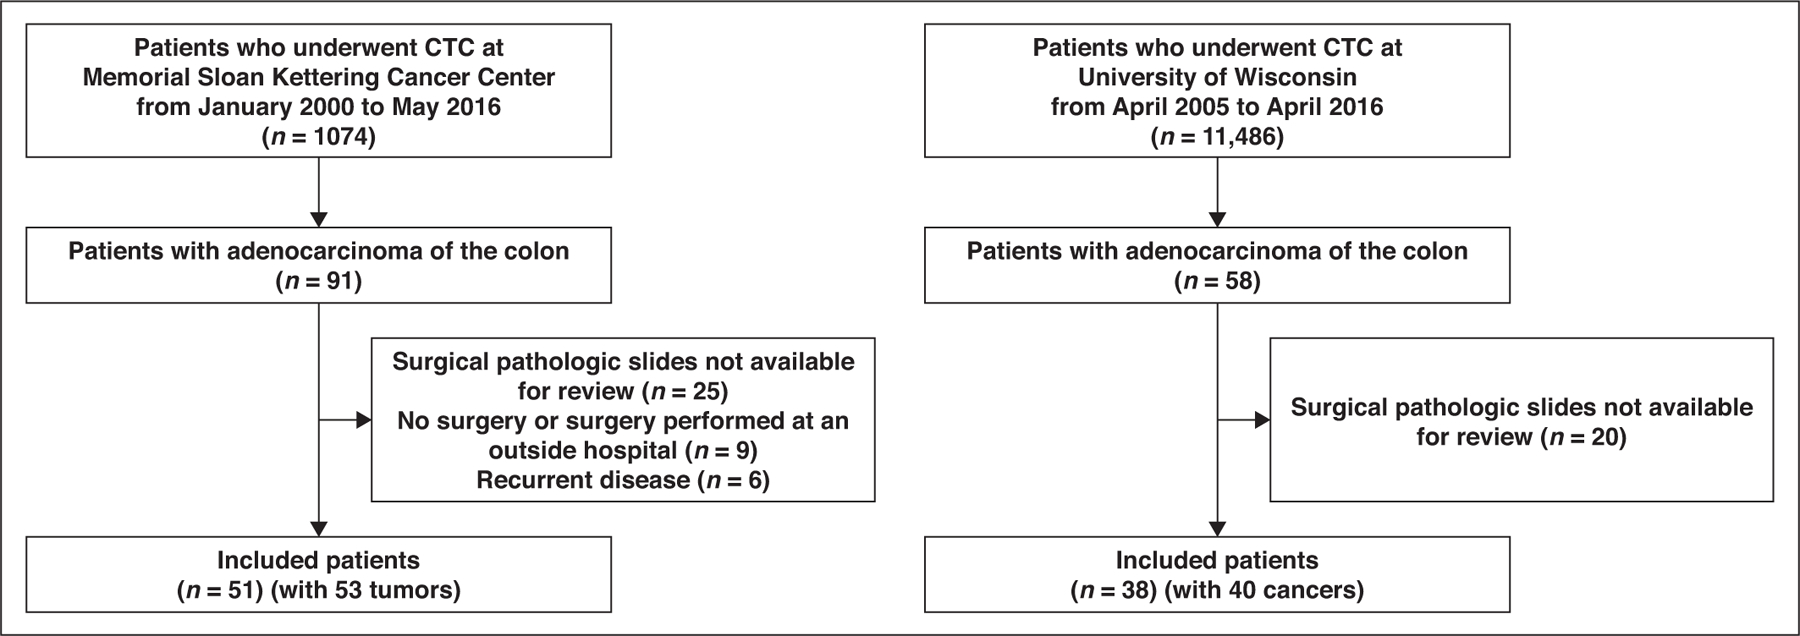
Flowchart summarizing patient accrual. CTC = CT colonography.
CT Colonography Protocol
All patients underwent a colonic cleansing preparation, which varied somewhat over the years of the study. In our study population, 48 patients had fecal tagging, with tagging preparation beginning the night before the examination. Gaseous distention was initially performed with room air by hand pumping and then subsequently with an automated CO2 insufflator (ProtoCO2l, Bracco Imaging) at 18–25 mm Hg. The volume of gas varied according to adequacy of distention, which was judged subjectively by assessing scout and cross-sectional images as well as patient comfort. CTC was performed by obtaining a minimum of two series of images, one with the patient in a supine position and one with the patient in a prone position. When the colon was not completely distended, an additional series of images was obtained with the patient in the lateral decubitus position.
Considering equipment upgrades and initiatives to lower radiation dose, the CT parameters varied over the years. The following parameters were used at both facilities: tube voltage, 110–120 kV; tube current–exposure time potential, 30–300 mAs; pitch, 0.984–1.375; and slice thickness, 1.25–2.5 mm (for colorectal evaluation on CTC) and 5 mm (for extracolonic evaluation). IV contrast agent was used in 37 cases, usually to provide better cancer staging. In these cases, 100–150 mL of 300 mg I/mL iohexol (Omnipaque 300, GE Healthcare) was administered IV at a rate of 2.5–3.0 mL/s by use of a power injector and was followed by a 50-mL saline flush, an injection-to-scan delay of 80 seconds. After IV contrast agent injection, acquisition was performed with the patient in supine position.
CTC scans were anonymized and transferred to a workstation for retrospective diagnostic imaging review. The readers used imaging workstation software (Aquarius, version 4.4.12.138, TeraRecon) to evaluate the CTC scans.
CT Colonography Image Review
Two board-certificated abdominal radiologists who had 1 and 5 years of experience after fellowship independently reviewed the CTC examinations. The radiologists were aware that each patient had colon cancer and knew the location of the tumor; however, they were blinded to the findings from the radiology report and pathologic evaluation. For training purposes, before reviewing the cases, the readers received 1 hour of hands-on instruction using five case examples that were not included in the study sample.
The cases were randomly ordered and deidentified, and the readers reviewed all acquired sequences. The following radiologic features were evaluated: tumor length in the longest longitudinal plane (which is not a significant staging parameter; however, we used this as an additional measurement to evaluate interreader reproducibility); depth of tumor invasion beyond the muscularis propria (short-axis [orthogonal] plane); T category (with T1 indicating that the tumor invades the submucosa; T2, the tumor invades the muscularis propria; T3, the tumor invades through the muscularis propria into the subserosa [with T3a denoting invasion of < 1 mm; T3b, 1–4.9 mm; T3c, 5–15 mm; and T3d, ≥ 15.1 mm]; and T4, the tumor invades other organs); the presence of mucin or necrosis within the tumor based on subjective assessment related to hypoattenuation; the presence of extramural vascular invasion (EMVI), which was characterized by irregularity of the vessels with or without attenuation of the tumor within the vessel with or without focal enlargement of the vessel; and N category (with N0 denoting no regional lymph node and with N1 and N2 indicating regional positive lymph node) [16, 17, 26]. We considered both size and morphologic criteria to define a lymph node as malignant. The morphologic criteria for malignant lymph nodes were as follows: irregular borders, heterogeneous attenuation, and round shape. Lymph nodes larger than 9 mm in the short axis were classified as suspicious regardless of the number of malignant criteria; lymph nodes between 5 and 9 mm had to meet two morphologic criteria; and nodes smaller than 5 mm were required to meet three morphologic criteria [27].
The readers used multiplanar reconstruction to define the longitudinal plane of the tumor to measure the tumor length and the true orthogonal (axial) plane, to calculate the depth of tumor invasion beyond the muscularis propria and therefore determine the T category (Fig. 2). To identify the penetration of the tumor within the colonic wall, the readers initially determined the deepest area of tumor invasion.
Fig. 2—

Tumor length on longitudinal plane and depth of tumor invasion beyond muscularis propria on true axial plane.
A, Graphic illustration shows colonic tumor in longitudinal plane and on true axial plane as well as its most invasive area (arrows). Dashed line corresponds to midline of tumor on its longitudinal plane, and solid arrow corresponds to its true axial plane.
B, 56-year-old woman who underwent screening CT colonography. CT colonographic image with multiplanar reconstruction shows tumor in sigmoid colon in true axial plane. Reader 2 measured 10.4 mm of tumor beyond muscularis propria (category T3c) (arrow), and depth of tumor invasion on pathologic analysis was 9 mm (category T3c). Blue and green lines denote longitudinal and coronal plane of tumor, respectively. A = anterior, div = dividing eyepiece unit, F = feet, P = posterior, H = head.
C, CT colonographic image with multiplanar reconstruction shows tumor in sigmoid colon of same patient shown in B in longitudinal plane. Double-sided arrow corresponds to longitudinal diameter of tumor. Red line denotes perpendicular plane of tumor. L = left, R = right.
D, CT colonographic image with multiplanar reconstruction shows tumor in sigmoid colon of same patient shown in B and C in coronal plane.
Reference Standard
The reference standard was the histopathologic report on the surgical colectomy specimens. All histopathologic slices were reevaluated by two specialized gastrointestinal pathologists with 20 and 17 years of experience, and the findings were assessed in a standardized manner, including T category, depth of the tumor beyond the muscularis propria, N category, tumor length, presence of EMVI, and presence of a mucinous component within the tumor.
Statistical Analysis
Patient and tumor characteristics were reported for the cohort using descriptive statistics. Imaging features and preoperative T and N categories on CTC were measured by two readers and were assessed for interreader agreement using the kappa statistic for binary measures and the weighted kappa statistic for ordinal measures. For continuous measures, the nonparametric intraclass correlation coefficient was calculated to assess agreement [28]. Kappa values were interpreted qualitatively as follows: < 0.00 denoted poor agreement; 0.00–0.20, slight agreement; 0.21–0.40, fair agreement; 0.41–0.60, moderate agreement; 0.61–0.80, substantial agreement; and 0.81–1.00, almost perfect agreement [29].
The sensitivity, specificity, positive predictive value (PPV), and negative predictive value (NPV) of preoperative T and N categories on CTC were calculated separately for each reader. T category was classified in binary groups as T3 and T4 versus T1 and T2, high-risk tumors (T3c, T3d, and T4) versus low-risk tumors (T1, T2, T3a, and T3b), and T4 tumors versus T1, T2, and T3 tumors. The N category was classified as N1 and N2 versus N0. Pathologic T category and N category were used as the reference standard. Sensitivity and specificity were also calculated for two subgroups (with and without IV contrast material injection) and were compared between groups using the Fisher exact test.
Statistical analysis was performed using SAS software (version 9.4, SAS Institute), except for calculation of the nonparametric intraclass coefficient, which was done using the nopaco (nonparametric concordance coefficient) package in R (version 3.5.1, R Foundation).
Results
Patient Characteristics
The study consisted of 89 patients with 93 colonic tumors (four patients had two tumors each, so a total of 93 tumors were included in analysis). The median patient age was 63 years (range, 27–89 years), and 52.8% of the patients were men (Table 1). Forty-eight patients (53.9%) had obstructive colon cancer, and CTC was indicated after an incomplete colonoscopy; 41 patients (46.1%) were in a screening CTC program. Most tumors were located in the sigmoid colon (49/93; 52.7%). With regard to pathologic characteristics, most patients had category pT3 (58/89; 65.2%) or pN1 or pN2 (50/89; 56.2%) tumors and had moderately differentiated adenocarcinoma (64/89; 71.9%). EMVI was detected in 33 patients (37.1%), and a mucinous component was identified in 22 patients (24.7%). With regard to the FOxTROT criteria, 35 of 93 tumors (37.6%) tumors were histologically classified as high risk (i.e., T3c, T3d, or T4).
TABLE 1:
Patient and Tumor Characteristics of 89 Patients With 93 Tumors
| Patient or Tumor Characteristic | Value |
|---|---|
| Age (y), median (range) | 63 (27–89) |
| Male sex | 47 (52.8) |
| Pathologic T category, no. (%) of tumorsa | |
| T1 | 7 (7.5) |
| T2 | 13 (14.0) |
| T3 | 60 (64.5) |
| T3a | 15 (16.1) |
| T3b | 23 (24.7) |
| T3c | 19 (20.4) |
| T3d | 3 (3.2) |
| T4 | 13 (14.0) |
| Pathologic N category | |
| N0 | 39 (43.8) |
| N1 | 30 (33.7) |
| N2 | 20 (22.5) |
| Differentiationa | |
| Well | 18 (20.2) |
| Moderate | 64 (71.9) |
| Poor | 7 (7.9) |
| Depth of tumor invasionb (mm), median (range) | 3 (0–30) |
| Extramural vascular invasion | 33 (37.1) |
| Mucinous component | 22 (24.7) |
| Tumor site, no. (%) of tumors | |
| Cecum | 8 (8.6) |
| Ascending colon or hepatic flexure | 7 (7.5) |
| Transverse colon | 9 (9.7) |
| Descending colon or splenic flexure | 20 (21.5) |
| Sigmoid colon | 49 (52.7) |
Note—Except where indicated otherwise, data are no. (%) of patients.
Highest category and lowest differentiation used for four patients with two tumors each.
Beyond the muscularis propria.
Imaging Features and Interreader Agreement
Table 2 summarizes the imaging features assigned by both readers and interreader agreement. Most patients had category T3 or T4 tumors identified by readers 1 and 2, with interreader agreement considered moderate. Considering the classification based on FOxTROT criteria that categorizes tumors as high risk versus low risk, interreader agreement was substantial (κ = 0.68) and was higher than interreader agreements for classifying T3 and T4 versus T1 and T2 (κ = 0.51, denoting moderate agreement) and T4 versus T1, T2, and T3 (κ = 0.27, denoting fair agreement). The interreader agreement in differentiating N0 from N1 and N2 was moderate (κ = 0.44), whereas in detecting EMVI it was slight (κ = 0.15).
TABLE 2:
Imaging Features on CT Colonography and Interreader Agreement
| Feature | Reader 1 | Reader 2 | Agreementa |
|---|---|---|---|
| T category | 0.42 | ||
| T1 | 1 (1.1) | 2 (2.2) | |
| T2 | 24 (25.8) | 15 (16.1) | |
| T3 | 65 (69.9) | 66 (71.0) | |
| T4 | 3 (3.2) | 10 (10.8) | |
| N category | 0.39 | ||
| N0 | 36 (38.7) | 55 (59.1) | |
| N1 | 29 (31.2) | 31 (33.3) | |
| N2 | 28 (30.1) | 7 (7.5) | |
| Tumor length (mm), median (range) | 42.1 (5.2–150.0) | 36.8 (7.8–120.0) | 0.86 |
| Depth of tumor invasion (mm), median (range)b | 3.7 (0–35.3) | 4.1 (0–28.3) | 0.83 |
| Extramural vascular invasion | 46 (49.5) | 11 (11.8) | 0.15 |
| Mucinous component | 11 (11.8) | 32 (34.4) | 0.29 |
Note—Except where otherwise indicated, data are number (%) of patients. Percentages do not always total 100% because of rounding.
Kappa statistic was reported for binary measures, weighted kappa statistic was reported for ordinal measures, and nonparametric interclass correlation coefficient was reported for continuous measures.
Beyond the muscularis propria.
Among other imaging features, tumor length and depth of tumor invasion beyond the muscularis propria had almost perfect interreader agreement, with kappa values of 0.86 and 0.83 noted, respectively. There was fair agreement (κ = 0.29) regarding the presence of a mucinous component.
Figure 3 shows sample cases of CTC assessing FOxTROT inclusion criteria on the basis of tumor invasion beyond the muscularis propria.
Fig. 3—

Sample cases of CT colonography (CTC) assessing FOxTROT (Fluoropyrimidine, Oxaliplatin, and Targeted-Receptor pre-Operative Therapy [Panitumumab]) trial inclusion criteria based on tumor invasion beyond muscularis propria.
A, 53-year-old man with two synchronous tumors that were correctly categorized by both readers. CTC image shows one tumor was located in ascending colon and was deemed high risk because of more than 5 mm of invasion beyond muscularis propria (reader 1 measured 10.9 mm, and reader 2 measured 13.3 mm). Pathologic evaluation confirmed high-risk tumor, with 10 mm of invasion noted beyond muscularis propria. F = feet, div = dividing eyepiece unit, L = left, H = head, R = right.
B, CTC image shows that second tumor in same patient shown in A was located in cecum with no invasion beyond muscularis propria according to both readers. This finding was confirmed on pathologic analysis. A = anterior, P = posterior.
C, 88-year-old woman with sigmoid cancer classified as high risk on CTC by both readers (with 5.5 and 6.0 mm of invasion beyond muscularis propria measured by reader 1 and reader 2, respectively). On pathologic analysis, tumor had 1 mm of invasion beyond muscularis propria (indicating low risk according to FOxTROT trial criteria.
D, 27-year-old man with sigmoid adenocarcinoma classified as low risk on CTC by both readers (with 2.0 and 4.2 mm of invasion beyond muscularis propria measured by reader 1 and reader 2, respectively); however, on pathologic evaluation, 6 mm of invasion (denoting high-risk tumor) was noted.
Diagnostic Statistics of CT Colonography for T Category, N Category, and Extramural Vascular Invasion
Table 3 presents a comparison between the radiologic and pathologic T category. The sensitivity, specificity, PPV, and NPV of CTC for T category, N category, and EMVI for readers 1 and 2 are summarized in Table 4. With the use of FOxTROT criteria to differentiate high-risk from low-risk tumors, sensitivity varied from 65.7% to 82.9%; specificity, from 81.0% to 87.9%; PPV, from 67.6% to 80.6%; and NPV, from 79.7% to 89.5%. For distinguishing T1 and T2 from T3 and T4, reader 1 achieved a sensitivity, specificity, PPV, and NPV of 82.2%, 60.0%, 88.2%, and 48.0%, respectively; for reader 2, the corresponding values were 90.4%, 50.0%, 86.8%, and 58.8%, respectively. Regarding the N category (N1 and N2 versus N0), sensitivities were 50.9% and 69.8%, specificities were 50.0% and 72.5%, PPVs were 64.9% and 71.1%, and NPVs were 52.7% and 55.6%. For the detection of EMVI, the sensitivities varied from 18.2% to 66.7%, the specificities varied from 60.0% to 91.7%, the PPV varied from 47.8% to 54.5%, and the NPV varied from 67.1% to 76.6%.
TABLE 3:
Comparison Between Radiologic and Pathologic T Category
| Reader and T Category | T1 | T2 | T3a | T3b | T3c | T3d | T4 | Total |
|---|---|---|---|---|---|---|---|---|
| Reader 1 | ||||||||
| T1 | 1 | 0 | 0 | 0 | 0 | 0 | 0 | 1 |
| T2 | 6 | 5 | 8 | 3 | 1 | 0 | 1 | 24 |
| T3a | 0 | 1 | 0 | 0 | 0 | 0 | 0 | 1 |
| T3b | 0 | 4 | 6 | 13 | 6 | 1 | 3 | 33 |
| T3c | 0 | 2 | 1 | 6 | 8 | 1 | 6 | 24 |
| T3d | 0 | 1 | 0 | 1 | 2 | 1 | 2 | 7 |
| T4 | 0 | 0 | 0 | 0 | 2 | 0 | 1 | 3 |
| Total | 7 | 13 | 15 | 23 | 19 | 3 | 13 | 93 |
| Reader 2 | ||||||||
| T1 | 2 | 0 | 0 | 0 | 0 | 0 | 0 | 2 |
| T2 | 4 | 4 | 5 | 1 | 1 | 0 | 0 | 15 |
| T3a | 1 | 3 | 2 | 1 | 0 | 0 | 0 | 7 |
| T3b | 0 | 5 | 7 | 16 | 2 | 1 | 2 | 33 |
| T3c | 0 | 0 | 1 | 4 | 13 | 1 | 5 | 24 |
| T3d | 0 | 0 | 0 | 0 | 2 | 0 | 0 | 2 |
| T4 | 0 | 1 | 0 | 1 | 1 | 1 | 6 | 10 |
| Total | 7 | 13 | 15 | 23 | 19 | 3 | 13 | 93 |
TABLE 4:
Diagnostic Statistics of CT Colonography for T Category, N Category, and Extramural Vascular Invasion (EMVI) With Interreader Agreement
| Comparison and Reader | Sensitivity, % (95% CI) | Specificity, % (95% CI) | Positive Predictive Value, % (95% CI) | Negative Predictive Value, % (95% CI) | κ Statistic |
|---|---|---|---|---|---|
| T3 and T4 versus T1 and T2 | 0.51 | ||||
| Reader 1 | 82.2 (71.5–90.2) | 60.0 (36.1–80.9) | 88.2 (78.1–94.8) | 48.0 (27.8–68.7) | |
| Reader 2 | 90.4 (81.2–96.1) | 50.0 (27.2–72.8) | 86.8 (77.1–93.5) | 58.8 (32.9–81.6) | |
| High-risk tumor vs low-risk tumor | 0.68 | ||||
| Reader 1 | 65.7 (47.8–80.9) | 81.0 (68.6–90.1) | 67.6 (49.5–82.6) | 79.7 (67.2–89.0) | |
| Reader 2 | 82.9 (66.4–93.4) | 87.9 (76.7–95.0) | 80.6 (64.0–91.8) | 89.5 (78.5–96.0) | |
| T4 versus T1, T2, and T3 | 0.27 | ||||
| Reader 1 | 7.7 (0.2–36.0) | 97.5 (91.3–99.7) | 33.3 (0.8–90.6) | 86.7 (77.9–92.9) | |
| Reader 2 | 46.2 (19.2–74.9) | 95.0 (87.7–98.6) | 60.0 (26.2–87.8) | 91.6 (83.4–96.5) | |
| N1 and N2 versus N0 | 0.44 | ||||
| Reader 1 | 69.8 (55.7–81.7) | 50.0 (33.8–66.2) | 64.9 (51.1–77.1) | 55.6 (38.1–72.1) | |
| Reader 2 | 50.9 (36.8–64.9) | 72.5 (56.1–85.4) | 71.1 (54.1–84.6) | 52.7 (38.8–66.3) | |
| EMVI | 0.15 | ||||
| Reader 1 | 66.7 (48.2–82.0) | 60.0 (46.5–72.4) | 47.8 (32.9–63.1) | 76.6 (62.0–87.7) | |
| Reader 2 | 18.2 (7.0–35.5) | 91.7 (81.6–97.2) | 54.5 (23.4–83.3) | 67.1 (55.8–77.1) |
High-risk tumors included T3c, T3d, and T4 tumors, and low-risk tumors included T1, T2, T3a, and T3b tumors.
Effect of IV Contrast Media
No statistical difference existed between the sensitivities and specificities of CTC with and without the use of IV contrast media in differentiating high-risk tumors from low-risk tumors, for both readers. Reader 1 showed significantly higher sensitivity in differentiating T3 and T4 from T1 and T2, differentiating N1 and N2 from N0, and detecting EMVI on CTC performed with IV contrast medium; however, the specificity in diagnosing EMVI decreased on CTC performed with IV contrast medium. Table S1 (which can be viewed in the AJR electronic supplement to this article, available at www.ajronline.org) summarizes the sensitivity and specificity of CTC for the T category, N category, and EMVI with and without IV contrast material injection.
Discussion
The present study showed that CTC might be a feasible imaging modality for assessing local staging of colon cancer according to the depth of tumor invasion beyond the muscularis propria, with respect to high- and low-risk T3 subcategories, as implemented in the FOxTROT study. For the distinction of the four standard T category groups (T1, T2, T3, and T4), agreement between the readers was moderate (κ = 0.42). When further subdivided by T category into high-risk tumors (T3c, T3d, and T4) versus low-risk tumors (T1, T2, T3a, and T3b), the interreader agreement was substantial (κ = 0.68), with sensitivity, specificity, PPV, and NPV all higher than 80% for the radiologist who had more experience and with all these values higher than 65% for the reader who had less experience. We found no significant difference in the performance of CTC using IV contrast media in differentiating high-risk from low-risk tumors. The diagnostic performance of CTC for detecting malignant nodes was more limited, with sensitivity and specificity both less than 70% and with moderate interreader agreement (κ = 0.44). Accurate detection of EMVI was the most challenging aspect for both readers, with sensitivities of only 18% and 67% and slight interreader agreement (κ = 0.15).
In the present study, CTC risk stratification using the T3 subcategory system performed reasonably well and, of importance, had high specificity. Therefore, compared with a strategy of standard CT, use of CTC would likely reduce the chance of overtreatment. Of interest, most of the T2 tumors were overstaged, as was reflected by the poor specificity when considering only T3 and T4 versus T1 and T2. The ability to distinguish T2 from T3 (or T3a) was very limited and may relate to the lack of clear distinction of the muscularis propria at CT. Nonetheless, this distinction would not alter treatment in the current treatment paradigm and therefore poses no significant risk. Furthermore, our study showed substantial interreader agreement for readers with different levels of expertise in CTC, an encouraging finding that requires validation using more readers.
Numerous studies have investigated the diagnostic accuracy of CT in the preoperative staging of colon cancer. These studies have assessed standard T categories, nodes, and distant metastases and have found accuracy to be reasonable for T and N category and very high for metastases [30, 31]. In 2012, Dighe et al. [16] evaluated the accuracy of standard CT in local colon cancer staging, also emphasizing the T subcategory classification used in the FOxTROT trial. They showed that CT had a sensitivity of 87% and a specificity of 49% in identifying high-risk tumors [16]. The present study with CTC showed comparable sensitivity for the most experienced reader (82.9% vs 87.0%), lower sensitivity for the less experienced reader (65.7% vs 87.0%), and higher specificity for both readers (81.0% and 87.9% vs 49.0%). Nerad et al. [32], in a meta-analysis involving four studies using conventional CT, showed an overall sensitivity of 77% (95% CI, 66–85%) and a specificity of 70% (95% CI, 53–83%). Our results showed higher specificity for both readers and higher sensitivity for the most experienced radiologist.
In our cohort, higher specificity (i.e., the avoidance of many false-positive results for T3c, T3d, and T4 tumors) might be directly related to the use of CTC rather than CT. Section thickness in CTC is smaller than that in standard CT, avoiding partial-volume effects. In the meta-analysis by Dighe et al. [30], studies using a slice thickness of 5 mm or less had greater accuracy, supporting this concept. Some authors have even studied section thicknesses of 1–2 mm and have achieved good but still imperfect results [33]. However, it is also likely that the well-distended colon, by obviating wall pseudothickening caused by collapse or contraction, optimized tumor depth measurements. This is supported by the greater accuracies achieved in studies using air distention of the colon [30] as well as in subsequent single-center studies using hydro-CT, with sensitivities as high as 98% and specificities as high as 88% reported for the distinction of T1 and T2 versus T3 and T4 [34, 35]. The unique strength of the present study, in addition to simply using multiplanar MDCT, may be related to the care we took to reconstruct multiplanar reconstruction views to ensure a true orthogonal plane with the tumor, thereby assisting in accurate measurements. For example, in the study of the FOxTROT pilot patients, although emphasis was placed on the use of multiplanar CT, it is not clear from the reported methods whether true orthogonal planes were used for determination of the T category [16]. Some studies also evaluated MRI for T category determination in the diagnosis of high-risk tumors, which showed lower sensitivity and comparable specificity overall [17–19].
The ability to detect involved nodes at CT is less successful than T categorization. The meta-analysis shows an overall sensitivity of 70% and a specificity of 78% among 907 patients [30]. In the present study, the overall sensitivity and specificity were a bit lower. However, of interest is the intriguing finding that IV contrast medium improved the sensitivity for both readers and the specificity for one reader, a finding that should be further pursued. Reader performance at CT for determination of lymph node involvement is highly variable and may require stringent definitions and oncologic radiologic expertise, as has been shown by the good results in the study by Choi et al. [36], in which a tertiary center radiologic reinterpretation improved sensitivity compared with that of a community hospital interpretation and in which positive lymph node findings were defined very specifically [36]. The performance for N categorization on MRI was also limited, as was shown by Nerad et al. [19], which may suggest that morphologic criteria are not reliable, even when obtained with MRI, which has higher contrast resolution.
EMVI is known to confer a worse prognosis for rectal and colon cancers when discovered on histopathologic analysis [37, 38]. Its importance in rectal cancer and its detection by MRI have been exhaustively studied [39]. One study found that 3-year disease-free survival is strongly predicted by the presence of CT-based EMVI (with progressive events noted in 43% vs 14% of patients; hazard ratio, 4.4) [40]. For conventional CT, the reported accuracy is 74%, with a sensitivity of 78%, a specificity of 67%, and a PPV of 81%, with histopathologic analysis used as a reference standard [16]. However, other studies showed that MDCT had sensitivities that varying from 38% to 47% and specificities ranging from 68% to 95%, whereas MRI achieved highly variable sensitivities of 26–100% and specificities of 62–91%. Overall, our results are inferior to the results of these other studies, perhaps because of a lack of familiarity and training or, perhaps, a lower prevalence of this finding. Despite the variability of imaging performance in its identification, EMVI is recognized as a presurgical high-risk factor and has been incorporated into the FOxTROT trial for patient treatment stratification. Further investigation of CT-based detection of EMVI that examines the optimal technique, imaging plane, and reconstruction thickness may be valuable. Our small study cannot conclude that there is any definite inferiority of CTC compared with CT in the detection EMVI, so larger studies are indicated.
The clinical implication of the present study has quite a potential impact. If our results can be confirmed, the routine workup of many or even all patients with colon cancer could change. Although the current recommendations of the National Comprehensive Cancer Network include colonoscopy with biopsy and CT of the chest, abdomen, and pelvis [4], some patients require CTC for incomplete colonoscopy, a practice that would not change. However, if the standard of care were unified to require neoadjuvant chemotherapy for high-risk tumors, the detection of the high-risk criteria used in the present study, as in the FOxTROT trial, could require further imaging (because they are not able to be determined by colonoscopy alone). If our results are confirmed and standard CT is proven inferior to CTC, patients could receive simultaneous colon cancer staging of distant disease and local staging and risk stratification with CTC using IV contrast medium. Such a study could be performed on the same day as colonoscopy, to reduce the need for additional patient preparation. Per our results, there might even be an added advantage of using IV contrast medium for nodal staging. Incorporation of CTC into a clinical trial similar in design to the FOxTROT trial would be one way to investigate this hypothesized paradigm shift.
The present study has several limitations, including its retrospective design and small sample size. In addition, we did not compare CTC directly with CT or MRI; we compared its accuracy on the basis of the results of standard CT and MRI available in the literature [16, 19, 30–33]. Also, 48 of 89 patients (53.9%) had obstructive colonic cancer and underwent CTC because of incomplete colonoscopy, which might not reflect the whole population of patients with colon cancer. Finally, the diagnostic performance of contrast-enhanced and unenhanced CTC was compared in two different groups of patients and not in the same patients. Therefore, larger prospective studies are needed to overcome these limitations and to provide a better generalization of the results of the present study. In addition, the better performance of the most experienced reader in the assessment of high-risk tumors might suggest that there is a learning curve with regard to T category identification, which was not evaluated in the present study. Therefore, further studies evaluating learning curves are also necessary to address the influence of radiologist experience on the accuracy of CTC categorization of higher-risk colon cancers on the basis of the FOxTROT trial criteria.
In conclusion, the present study shows that CTC might be a feasible imaging modality for differentiation of low- or moderate-risk colon cancers from higher-risk colon cancers considered more suitable for neoadjuvant chemotherapy on the basis of the FOxTROT trial criteria. In comparison with the available literature, the present study attained a higher specificity, thus potentially better avoiding overtreatment of patients, likely as a result of the important technical and procedural differences between standard CT and CTC. Although our findings are promising, further studies are needed to validate our results in larger, more diverse populations from both academic and community centers.
Supplementary Material
Acknowledgments
Supported in part by support grant P30 CA008748 from the National Institutes of Health/National Cancer Institute Cancer Center to the Memorial Sloan Kettering Cancer Center.
Footnotes
Supplemental Data
Available online at www.ajronline.org.
References
- 1.American Cancer Society. Cancer facts & figures 2018. American Cancer Society; website. www.cancer.org/research/cancer-facts-statistics/all-cancer-facts-figures/cancer-facts-figures-2018.html. Published 2018. Accessed September 3, 2018 [Google Scholar]
- 2.Siegel RL, Miller KD, Jemal A. Cancer statistics, 2018. CA Cancer J Clin 2018; 68:7–30 [DOI] [PubMed] [Google Scholar]
- 3.Bailey CE, Hu CY, You YN, et al. Increasing disparities in the age-related incidences of colon and rectal cancers in the United States, 1975–2010. JAMA Surg 2015; 150:17–22 [DOI] [PMC free article] [PubMed] [Google Scholar]
- 4.National Comprehensive Cancer Network (NCCN). NCCN clinical practice guidelines in oncology: colon cancer. NCCN website. www.nccn.org/professionals/physician_gls/default.aspx#site. Published 2018. Accessed September 3, 2018 [DOI] [PubMed]
- 5.National Comprehensive Cancer Network. NCCN clinical practice guidelines in oncology: rectal cancer. NCCN website. www.nccn.org/professionals/physician_gls/default.aspx#site. Published 2017. Accessed September 3, 2018 [DOI] [PubMed]
- 6.Habr-Gama A, Perez RO, Nadalin W, et al. Operative versus nonoperative treatment for stage 0 distal rectal cancer following chemoradiation therapy: long-term results. Ann Surg 2004; 240:711–717; discussion, 717–718 [DOI] [PMC free article] [PubMed] [Google Scholar]
- 7.Maas M, Nelemans PJ, Valentini V, et al. Long-term outcome in patients with a pathological complete response after chemoradiation for rectal cancer: a pooled analysis of individual patient data. Lancet Oncol 2010; 11:835–844 [DOI] [PubMed] [Google Scholar]
- 8.Påhlman L, Bohe M, Cedermark B, et al. The Swedish rectal cancer registry. Br J Surg 2007; 94:1285–1292 [DOI] [PubMed] [Google Scholar]
- 9.Trakarnsanga A, Gonen M, Shia J, et al. Comparison of tumor regression grade systems for locally advanced rectal cancer after multimodality treatment. J Natl Cancer Inst 2014; 106:dju248. [DOI] [PMC free article] [PubMed] [Google Scholar]
- 10.Fokas E, Liersch T, Fietkau R, et al. Tumor regression grading after preoperative chemoradiotherapy for locally advanced rectal carcinoma revisited: updated results of the CAO/ARO/AIO-94 trial. J Clin Oncol 2014; 32:1554–1562 [DOI] [PubMed] [Google Scholar]
- 11.Patel UB, Taylor F, Blomqvist L, et al. Magnetic resonance imaging-detected tumor response for locally advanced rectal cancer predicts survival outcomes: MERCURY experience. J Clin Oncol 2011; 29:3753–3760 [DOI] [PubMed] [Google Scholar]
- 12.Reibetanz J, Germer CT. Neoadjuvant chemotherapy for locally advanced colon cancer: initial results of the FOxTROT study [in German]. Chirurg 2013; 84:1000. [DOI] [PubMed] [Google Scholar]
- 13.FOxTROT Collaborative Group. Feasibility of preoperative chemotherapy for locally advanced, operable colon cancer: the pilot phase of a randomised controlled trial. Lancet Oncol 2012; 13:1152–1160 [DOI] [PMC free article] [PubMed] [Google Scholar]
- 14.Nørgaard A, Dam C, Jakobsen A, Pløen J, Lindebjerg J, Rafaelsen SR. Selection of colon cancer patients for neoadjuvant chemotherapy by preoperative CT scan. Scand J Gastroenterol 2014; 49:202–208 [DOI] [PubMed] [Google Scholar]
- 15.Dighe S, Blake H, Koh MD, et al. Accuracy of multidetector computed tomography in identifying poor prognostic factors in colonic cancer. Br J Surg 2010; 97:1407–1415 [DOI] [PubMed] [Google Scholar]
- 16.Dighe S, Swift I, Magill L, et al. Accuracy of radiological staging in identifying high-risk colon cancer patients suitable for neoadjuvant chemotherapy: a multicentre experience. Colorectal Dis 2012; 14:438–444 [DOI] [PubMed] [Google Scholar]
- 17.Rollvén E, Holm T, Glimelius B, Lörinc E, Blomqvist L. Potentials of high resolution magnetic resonance imaging versus computed tomography for preoperative local staging of colon cancer. Acta Radiol 2013; 54:722–730 [DOI] [PubMed] [Google Scholar]
- 18.Hunter C, Siddiqui M, Georgiou Delisle T, et al. CT and 3-T MRI accurately identify T3c disease in colon cancer, which strongly predicts disease-free survival. Clin Radiol 2017; 72:307–315 [DOI] [PubMed] [Google Scholar]
- 19.Nerad E, Lambregts DM, Kersten EL, et al. MRI for local staging of colon cancer: can MRI become the optimal staging modality for patients with colon cancer? Dis Colon Rectum 2017; 60:385–392 [DOI] [PubMed] [Google Scholar]
- 20.Nagata K, Ota Y, Okawa T, Endo S, Kudo SE. PET/CT colonography for the preoperative evaluation of the colon proximal to the obstructive colorectal cancer. Dis Colon Rectum 2008; 51:882–890 [DOI] [PubMed] [Google Scholar]
- 21.Filippone A, Ambrosini R, Fuschi M, Marinelli T, Genovesi D, Bonomo L. Preoperative T and N staging of colorectal cancer: accuracy of contrast-enhanced multi-detector row CT colonography—initial experience. Radiology 2004; 231:83–90 [DOI] [PubMed] [Google Scholar]
- 22.Utano K, Endo K, Togashi K, et al. Preoperative T staging of colorectal cancer by CT colonography. Dis Colon Rectum 2008; 51:875–881 [DOI] [PubMed] [Google Scholar]
- 23.Flor N, Mezzanzanica M, Rigamonti P, et al. Contrast-enhanced computed tomography colonography in preoperative distinction between T1-T2 and T3-T4 staging of colon cancer. Acad Radiol 2013; 20:590–595 [DOI] [PubMed] [Google Scholar]
- 24.Narayanan S, Kalra N, Bhatia A, et al. Staging of colorectal cancer using contrast-enhanced multi-detector computed tomographic colonography. Singapore Med J 2014; 55:660–666 [DOI] [PMC free article] [PubMed] [Google Scholar]
- 25.Sato K, Tanaka T, Sato J, et al. Usefulness of pre-operative CT colonography for colon cancer. Asian J Surg 2017; 40:438–443 [DOI] [PubMed] [Google Scholar]
- 26.Malmstrøm ML, Brisling S, Klausen TW, et al. Staging with computed tomography of patients with colon cancer. Int J Colorectal Dis 2018; 33:9–17 [DOI] [PubMed] [Google Scholar]
- 27.Beets-Tan RGH, Lambregts DMJ, Maas M, et al. Magnetic resonance imaging for clinical management of rectal cancer: updated recommendations from the 2016 European Society of Gastrointestinal and Abdominal Radiology (ESGAR) consensus meeting. Eur Radiol 2018; 28:1465–1475 [DOI] [PMC free article] [PubMed] [Google Scholar]
- 28.Rothery P A nonparametric measure of intraclass correlation. Biometrika 1979; 66:629–639 [Google Scholar]
- 29.Landis JR, Koch GG. The measurement of observer agreement for categorical data. Biometrics 1977; 33:159–174 [PubMed] [Google Scholar]
- 30.Dighe S, Purkayastha S, Swift I, et al. Diagnostic precision of CT in local staging of colon cancers: a meta-analysis. Clin Radiol 2010; 65:708–719 [DOI] [PubMed] [Google Scholar]
- 31.Leufkens AM, van den Bosch MA, van Leeuwen MS, Siersema PD. Diagnostic accuracy of computed tomography for colon cancer staging: a systematic review. Scand J Gastroenterol 2011; 46:887–894 [DOI] [PubMed] [Google Scholar]
- 32.Nerad E, Lahaye MJ, Maas M, et al. Diagnostic accuracy of CT for local staging of colon cancer: a systematic review and meta-analysis. AJR 2016; 207:984–995 [DOI] [PubMed] [Google Scholar]
- 33.Elibol FD, Obuz F, Sökmen S, et al. The role of multidetector CT in local staging and evaluation of retroperitoneal surgical margin involvement in colon cancer. Diagn Interv Radiol 2016; 22:5–12 [DOI] [PMC free article] [PubMed] [Google Scholar]
- 34.Sibileau E, Ridereau-Zins C, Vanel D, et al. Accuracy of water-enema multidetector computed tomography (WE-MDCT) in colon cancer staging: a prospective study. Abdom Imaging 2014; 39:941–948 [DOI] [PubMed] [Google Scholar]
- 35.Venara A, Ridereau-Zins C, Toque L, et al. Waterenema multidetector computed tomography for planning surgery. Int J Colorectal Dis 2015; 30:691–696 [DOI] [PubMed] [Google Scholar]
- 36.Choi AH, Nelson RA, Schoellhammer HF, et al. Accuracy of computed tomography in nodal staging of colon cancer patients. World J Gastrointest Surg 2015; 7:116–122 [DOI] [PMC free article] [PubMed] [Google Scholar]
- 37.Parnaby CN, Scott NW, Ramsay G, et al. Prognostic value of lymph node ratio and extramural vascular invasion on survival for patients undergoing curative colon cancer resection. Br J Cancer 2015; 113:212–219 [DOI] [PMC free article] [PubMed] [Google Scholar]
- 38.Sundov Z, Tomic S, Alfirevic S, et al. Prognostic value of MVD, LVD and vascular invasion in lymph node-negative colon cancer. Hepatogastroenterology 2013; 60:432–438 [DOI] [PubMed] [Google Scholar]
- 39.Siddiqui MRS, Simillis C, Hunter C, et al. A meta-analysis comparing the risk of metastases in patients with rectal cancer and MRI-detected extramural vascular invasion (mrEMVI) vs mrEMVI-negative cases. Br J Cancer 2017; 116:1513–1519 [DOI] [PMC free article] [PubMed] [Google Scholar]
- 40.Yao X, Yang SX, Song XH, Cui YC, Ye YJ, Wang Y. Prognostic significance of computed tomography-detected extramural vascular invasion in colon cancer. World J Gastroenterol 2016; 22:7157–7165 [DOI] [PMC free article] [PubMed] [Google Scholar]
Associated Data
This section collects any data citations, data availability statements, or supplementary materials included in this article.