Abstract
BACKGROUND AND PURPOSE:
Efficient detection of metastases is important for patient’ treatment. This prospective study was to explore the clinical value of contrast-enhanced T2 FLAIR in imaging brain metastases using half-dose gadobenate dimeglumine.
MATERIALS AND METHODS:
In vitro signal intensity of various gadolinium concentrations was explored by spin-echo T1-weighted imaging and T2 FLAIR. Then, 46 patients with lung cancer underwent nonenhanced T2 FLAIR before administration of half-dose gadobenate dimeglumine and 3 consecutive contrast-enhanced T2 FLAIR sequences followed by 1 spin-echo T1WI after administration of half-dose gadobenate dimeglumine. After an additional dose of 0.05 mmol/kg, 3D brain volume imaging was performed. All brain metastases were classified as follows: solid-enhancing, ≥ 5 mm (group A); ring-enhancing, ≥ 5 mm (group B); and lesion diameter of <5 mm (group C). The contrast ratio of the lesions on 3 consecutive phases of contrast-enhanced T2 FLAIR was measured, and the percentage increase of contrast-enhanced T2 FLAIR among the 3 groups was compared.
RESULTS:
In vitro, the maximal signal intensity was achieved in T2 FLAIR at one-eighth to one-half of the contrast concentration needed for maximal signal intensity in T1WI. In vivo, the mean contrast ratio values of metastases on contrast-enhanced T2 FLAIR for the 3 consecutive phases ranged from 63.64% to 83.05%. The percentage increase (PI) values of contrast-enhanced T2 FLAIR were as follows: PIA < PIB (P = .001) and PIA < PIC (P < .001). The degree of enhancement of brain metastases on contrast-enhanced T2 FLAIR was lower than on 3D brain volume imaging (P < .001) in group A, and higher than on 3D brain volume imaging (P < .001) in group C.
CONCLUSIONS:
Small or ring-enhancing metastases can be better visualized on delayed contrast-enhanced T2 FLAIR using a half-dose high-relaxivity contrast agent.
Brain metastases occur in approximately 25% of patients with cancer and account for 40% of adult brain tumors.1 The incidence of brain metastases in patients with lung cancer is highest (19.9%),2 resulting in high morbidity and mortality.3 Small metastases, not combined with vasogenic edema or mass effects, are often missed.1 Improvement of the early detection of small brain metastases will contribute to developing treatment protocols and will affect the outcomes4 because small lesions effectively respond to therapies and can be controlled at a substantially higher rate compared with larger lesions.5,6 For patients with metastases, contrast-enhanced T1WI (CE-T1WI) should be repeatedly performed to assess the progress of brain metastases7,8 or the efficacy of treatment.9,10 The conspicuity and detection rate of brain metastases can be improved with a higher dose of gadolinium-based contrast agents (GBCA).11 However, multiple enhanced examinations or use of higher contrast doses may increase the potential adverse effects, such as nephrogenic systemic fibrosis,12,13 and may lead to higher gadolinium deposition in the brain14 or other tissues.15,16
Therefore, reducing the gadolinium-based contrast agent dose may decrease the adverse effects produced by gadolinium accumulation, which is crucial to the patient’s health. T2 FLAIR is an inversion recovery pulse sequence that is sensitive to low concentrations of GBCA in the tissue.17 It is reported that only one-quarter of the routine dose of GBCA is needed for CE-T2 FLAIR to achieve a signal enhancement comparable with that of CE-T1WI; moreover, CE-T2 FLAIR may offer additional morphologic information compared with CE-T1WI alone.17,18 Due to the suppression of intravascular and CSF signal,19 CE-T2 FLAIR imaging has been used in the detection of various intra- and extra-axial brain lesions, eg, the delineation of meningeal lesions including meningoencephalitis and leptomeningeal metastases.20-22
Previous studies mostly focused on the use of CE-T2 FLAIR after use of the normal GBCA dose; no studies were performed to assess the utility of low-dose CE-T2 FLAIR in the detection of brain metastases. Additionally, an increased delay of CE-T2 FLAIR scanning can improve the diagnosis of leptomeningeal infectious or tumoral diseases,23 which means CE-T2 FLAIR has a relationship with scanning time. The purpose of the present study was to investigate the value of delayed low-dose CE-T2 FLAIR compared with routine-dose CE brain volume imaging (BRAVO; GE Healthcare) for contrast enhancement in brain metastases.
MATERIALS AND METHODS
Phantom Study
Eleven 2-mL tubes filled with gadobenate dimeglumine (Gd-BOPTA, MultiHance; Bracco) at different concentration (0.015, 0.03, 0.06, 0,12, 0.24, 0.48, 0.96, 1.92, 3.84, 7.68, and 15.36 mmol/L) were tested by T2 FLAIR and T1WI, with the following parameters—T2 FLAIR: TR = 8000 ms, TE = 150 ms, TI = 2250 ms; T1WI: TR =1800 ms, TE =24 ms. ROI measurements of the signal intensity were made in axial slices of the test tube in the homogeneous-appearing area.
Clinical Study
Patients.
Our study was conducted under the supervision of the institutional review board of Huashan Hospital, Fudan University, and informed consent was obtained from each patient before the examination. From February 2018 to July 2019, ninety patients were consecutively enrolled into our study; 7 patients had MR imaging contraindications, and 37 patients were excluded because they had undergone radiation therapy, chemotherapy, or gamma knife radiosurgery within the preceding 2 months. The predefined criteria for brain metastasis were as follows:8 1) a new enhancing lesion or size change of a pre-existing lesion detected on 2-month follow-up MR imaging; and 2) the lesion must be located in the brain parenchyma and show enhancement either on CE-BRAVO or CE-T2 FLAIR.
Clinical MR Imaging Protocol.
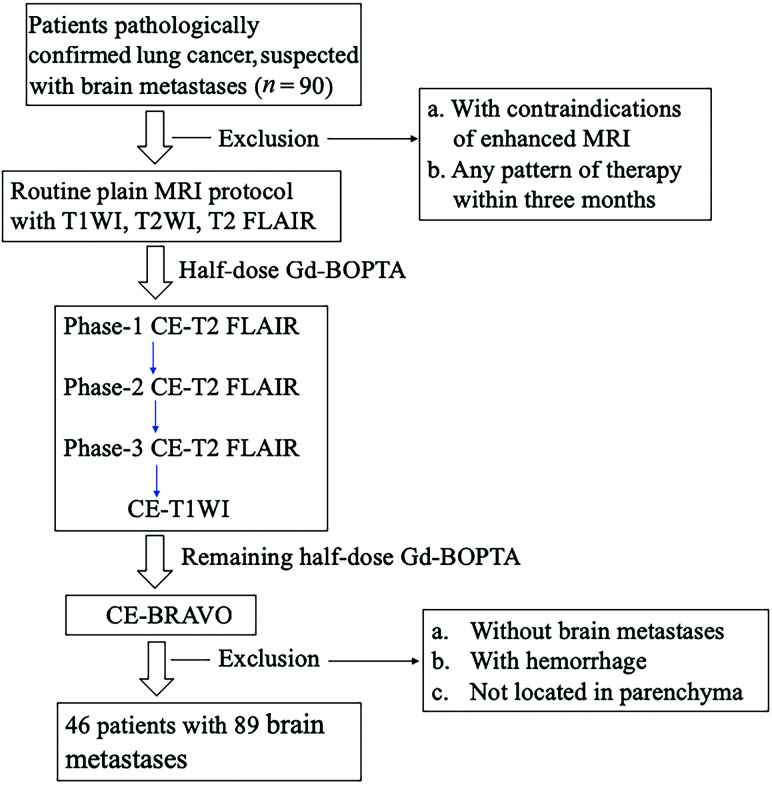
MR imaging of the patients was performed on a 3T MR imaging system (Signa HDxt; GE Healthcare) with an 8-channel phased array coil. Data and information on the patients for this study are presented in the flow chart (Fig 1). All patients underwent precontrast conventional MR imaging, including an axial T1WI (TR/TE = 2050/24 ms), axial T2WI (TR/TE = 3340/120 ms), and axial T2 FLAIR sequences (TR/TE/TI = 8000/150/2250 ms); all sequences had excitations = 1, thickness = 2 mm, and interstitial gap = 1 mm.
FIG 1.
Flow chart of the study population.
After intravenous bolus injection of half-dose (0.05 mmol/kg) Gd-BOPTA, CE-T2 FLAIR was acquired 3 consecutive times (Phase 1 to Phase 3: immediate scanning, 2 minutes 49 seconds, and 5 minutes 38 seconds after contrast application) to observe the optimal delay time; then, half-dose CE-T1WI was performed. Following application of the remaining dose of 0.05 mmol/kg, a 3D contrast-enhanced CE-BRAVO sequence (TR = 7.7 ms, TE = 12 ms, flip angle = 15°, section thickness = 2 mm, section gap = 0 mm) was acquired. The scan time points for each sequence after enhancement were as follows—precontrast T1WI, T2WI, T2 FLAIR, 0.05 mmol/kg of Gd-BOPTA; CE-T2 FLAIR (Phase1: immediate scanning); CE-T2 FLAIR (Phase two: 2 minutes 49 seconds); CE-T2 FLAIR (Phase three: 5 minutes 38 seconds); CE-T1WI (7 minutes 14 seconds), 0.05 mmol/kg of Gd-BOPTA; and CE-BRAVO (9 minutes 7 seconds).
MR Imaging Analysis
The MR imaging data were evaluated and analyzed on an AW4.6 workstation (GE Healthcare).
Lesion Grouping.
The enhancement pattern of brain metastases was assessed and classified into solid- and ring-enhancing lesions. The longest diameter of the lesion was measured on both axial CE-BRAVO and axial CE-T2 FLAIR. The lesions were grouped according to their size (max diameter < or ≥ 5 mm), and the enhancement pattern (solid or rim enhancement) was divided into the following groups:
Group A: solid-enhancing lesions with ≥5-mm diameter
Group B: ring-enhancing lesions with ≥5-mm diameter
Group C: lesions with <5-mm diameter.
Subjective Scoring of Enhancement Degree.
The degree of enhancement on CE-T2 FLAIR, CE-T1WI, and CE-BRAVO was qualitatively assessed using a 3-point scale by 2 experienced radiologists (each with >6 years of experience in neuroradiology). If the scoring was different, both radiologists would reach an agreement after discussion. The scoring criteria were as follows—1 point: poor enhancement (the signal intensity of the lesions was almost equal to that of the adjacent white matter and hardly identifiable; missed lesions were also included in this group); 2 points: moderate enhancement (the signal intensity was moderately higher than that of the adjacent white matter, but reliably identifiable); and 3 points: good enhancement (the signal intensity was significantly higher than that of the adjacent white matter and easily identifiable).
Quantitative Index Measurement.
Contrast ratio (CR) was calculated for the 3 consecutive CE-T2 FLAIR sequences as follows:
CR = [(SICE-T2FLAIR − SINWM)/SINWM] × 100%.
SICE-T2FLAIR represents the signal intensity of the lesion after enhancement, and SINWM represents the signal intensity of ROI-based normal-appearing white matter (NWM) adjacent to the tumor.
Percentage increase (PI) was used to observe the real enhancement degree between the nonenhanced T2 FLAIR and CE-T2 FLAIR1 to avoid an inherent high signal on nonenhanced T2 FLAIR.
PI = [(SICE-T2 FLAIR – SInonenhanced T2 FLAIR)/SInonenhanced T2 FLAIR] ×100%.
SICE-T2 FLAIR represents the signal intensity after enhancement, and SInonenhanced T2 FLAIR represents the signal intensity before enhancement.
ROI.
Two radiologists independently drew the ROIs guided by an experienced neuroradiologist. Each radiologist drew 3 ROIs, and the mean value was recorded as the final value measured by each radiologist. The mean value of the measurements by 2 radiologists was used as the final value of the patient. “Function tool” (AW 4.6 workstation, GE Healthcare) was used to fuse all sequences (including nonenhanced CE-T2 FLAIR and 3 consecutive CE-T2 FLAIR, CE-T1WI, and CE-BRAVO sequences; then, ROIs were drawn on CE-T2 FLAIR images and propagated to all other sequences to make certain that all ROIs were in the same position. If the ROIs were not in the same position in different sequences after propagation, ROIs were independently drawn to keep them in the same position as much as possible. An ROI was drawn to cover the entire lesion and was placed within a homogeneously enhanced area if all lesions had enhancement. If the lesion was ring-enhancing, the ROI was placed on a homogeneous-appearing part of the ring. Hemorrhagic, necrotic, and vascular areas were carefully spared.
Statistical Analysis
Statistical analysis was performed using the SPSS 21.0 software package (IBM). The measured data were presented as mean [SD].
CR and PI values of 3 consecutive CE-T2 FLAIR sequences from all brain metastases were compared among groups A, B, and C using a paired t test for CR values and a Kruskal–Wallis test for PI values. A χ2 test was used to compare the qualitative enhancement degree of the 3 sequences. P < .05 was statistically significant. In pair-wise comparisons, the corrected significance level was set at .017.
RESULTS
Phantom Study
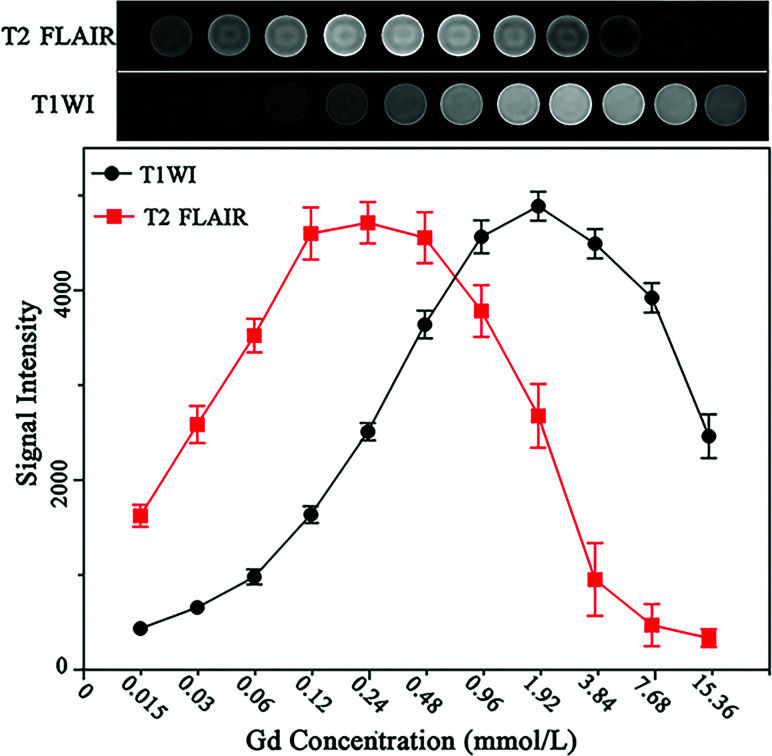
In vitro experiments demonstrated that the concentration of Gd-BOPTA required to generate reliable signal intensities on CE-T2 FLAIR images was approximately 0.12–0.48 mmol/L, corresponding to one-eighth to one-half lower than the concentration needed to achieve comparable signal intensity on CE-T1WI (Fig 2).
FIG 2.
Images of phantom tubes containing increasing concentrations of gadobenate dimeglumine (0.015–15.36 mmol/L) acquired by T2 FLAIR and CE-T1WI. Gd indicates gadolinium.
Clinical Study
Forty-six patients (22 men and 24 women; age range, 35–73 years; mean age, 61.7 years) with a total of 89 brain metastatic lesions were included. Twenty-seven lesions were assigned to group A; 23, to group B; and 39, to group C.
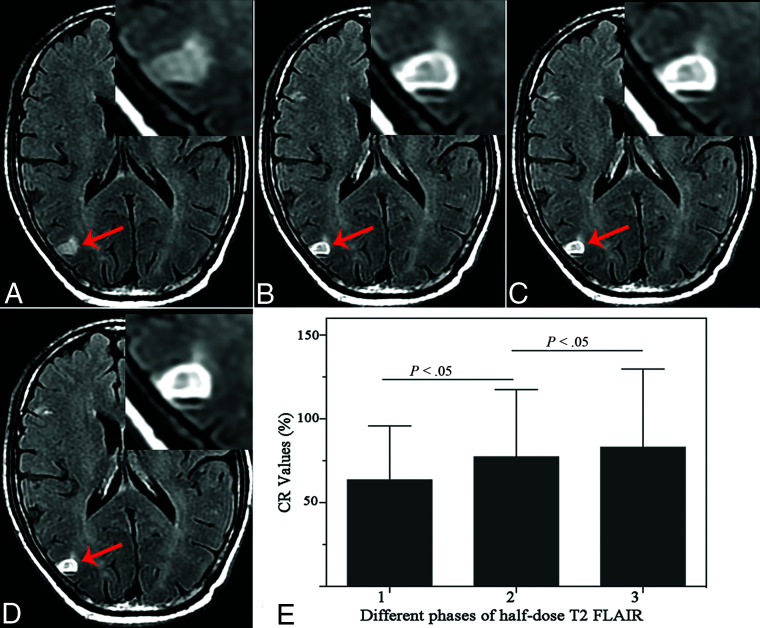
The CR measured on consecutive CE-T2 FLAIR sequences was CRPhase1 = 63.64% [SD, 32.19%], CRPhase2 = 77.34% [SD, 40.19%], and CRPhase3 = 83.05% [SD, 46.65%]. CRphase1 was significantly lower than CRphase2 (P < .001); and CRphase2 was lower than CRphase3 (P = .01); thus, an increasing delay between contrast administration and image acquisition led to a significant CR increase in brain metastases (Fig 3). The mean values of PI on the third phase on CE-T2 FLAIR of groups A, B, and C were PIA = 31.42% [SD, 11.65%], PIB = 58.60% [SD, 27.79%], and PIC = 61.05% [SD, 29.55%], respectively. PIA was significantly lower than PIB (P = .001) and PIC (P < .001). There was no significant difference between PIB and PIC (P = .759).
FIG 3.
A 64-year-old man with brain metastases in the right parietal cortex (arrow). A, Nonenhanced T2 FLAIR. B, Phase 1: half-dose CE-T2 FLAIR shows a ring-enhancing lesion. C, Phase 2: half-dose CE-T2 FLAIR at 2 minutes 49 seconds. D, Phase 3: half-dose CE-T2 FLAIR at 5 minutes 38 seconds. E, The CR value of the ring wall on T2 FLAIR shows a tendency toward an increase with delayed scanning time.
Group A.
The enhancement degree on half-dose CE-T2 FLAIR was lower than that with half-dose CE-T1WI (P = .001) and routine-dose CE-BRAVO (P < .001). No significant difference was found between half-dose CE-T1WI and routine-dose CE-BRAVO (P = .046) (Fig 4).
FIG 4.
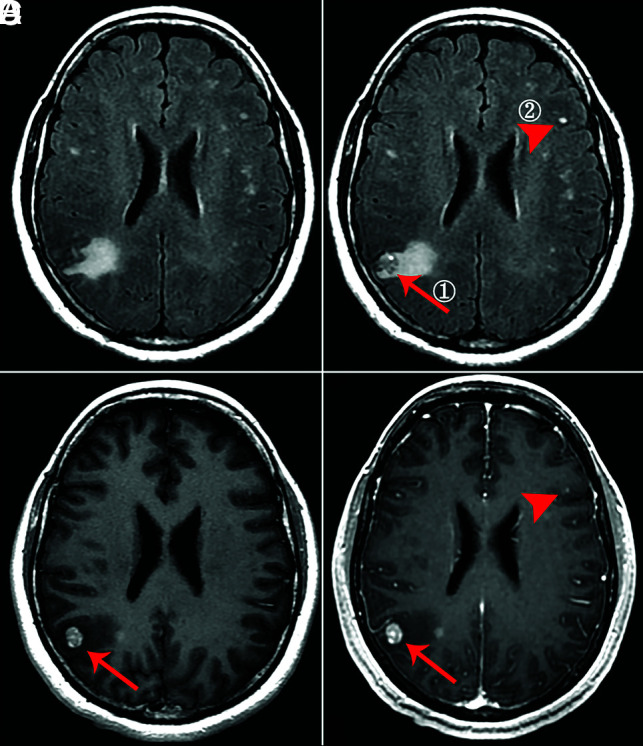
A 48-year-old man with solid brain metastases in the right parietal cortex (①, ≥5 mm, arrow) and left frontal cortex (②, <5 mm, arrowhead). A, Nonenhanced T2 FLAIR. B, Phase 3 half-dose CE-T2 FLAIR (①, 1 point; ②, 3 points). C, Half-dose CE-T1WI (①, 3 points; ②, missed diagnosis). D, Routine-dose CE-BRAVO (①, 3 points; ②, missed diagnosis).
Group B.
The enhancement degree on half-dose CE-T2 FLAIR was higher than that of half-dose CE-T1WI (P = .003) (Fig 5). No significant difference was found between half-dose CE-T2 FLAIR and routine-dose CE-BRAVO (P = .122), or between half-dose CE-T1WI and routine-dose CE-BRAVO (P = .113).
FIG 5.
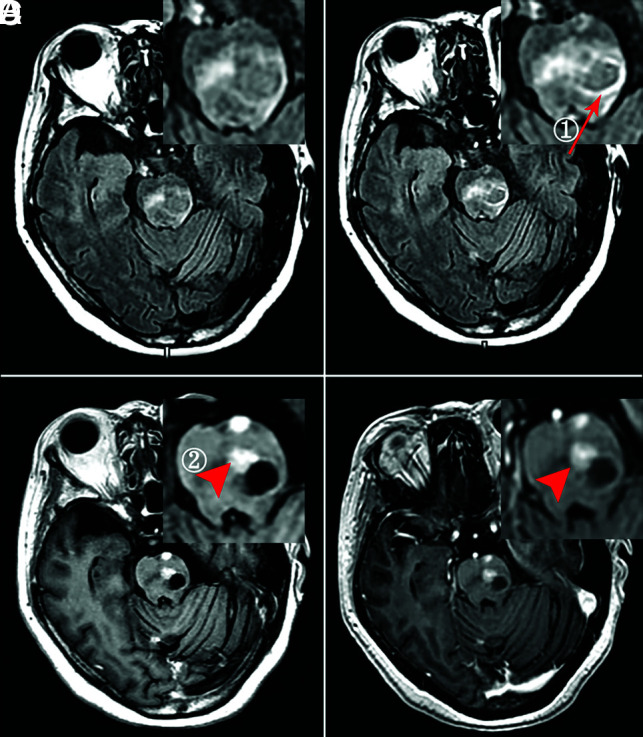
A 62-year-old woman with ring (①, ≥5 mm, arrow) and solid (②, ≥5 mm, arrowhead) enhancing brain metastases. A, Nonenhanced T2 FLAIR. B, Phase 3 half-dose CE-T2 FLAIR (①, 3 points; ②, missed diagnosis). C, Half-dose CE-T1WI (①, 1 point; ②, 3 points). D, Routine-dose CE-BRAVO (①, 2 points; ②, 3 points).
Group C.
The enhancement degree on half-dose CE-T2 FLAIR was significantly higher than that of half-dose CE-T1WI (P < .001) and routine-dose CE-BRAVO (P < .001) (Fig 6). The enhancement degree on routine-dose CE-BRAVO was higher than that on half-dose CE-T1WI (P < .001).
FIG 6.
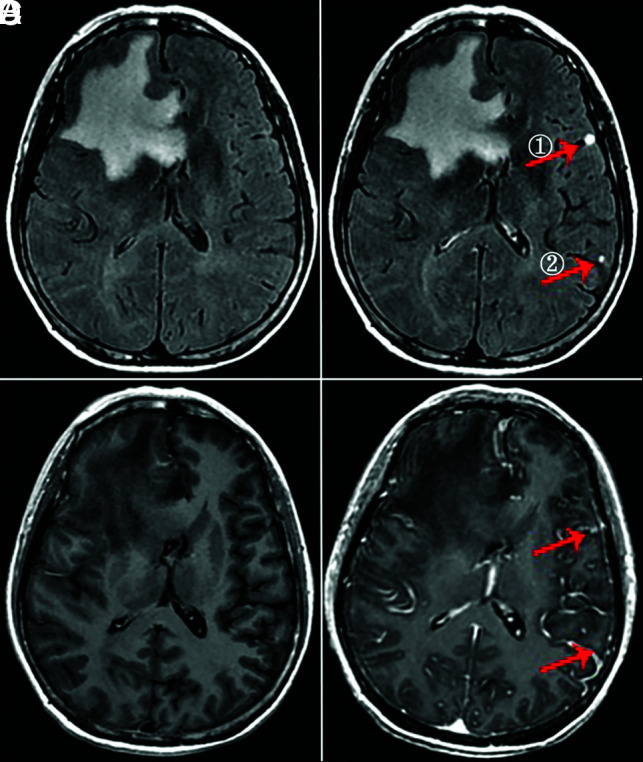
A 56-year-old woman with small brain metastases (① and ②, <5 mm, arrow). A, Nonenhanced T2 FLAIR. B, Phase 3 half-dose CE-T2 FLAIR (①, 3 points; ②, 3 points). C, Half-dose CE-T1WI completely missed the lesions. D, Routine-dose CE-BRAVO (①, 1 point; ②, missed diagnosis).
Of these brain metastases, 1 of 27 was missed in group A with half-dose CE-T2 FLAIR, while 1 of 23 was missed in group B with half-dose CE-T1WI as shown in Tables 1 and 2. Especially for small lesions in group C, 16 of 39 lesions were missed with half-dose CE-T1WI and 9 of 39 with routine-dose CE-BRAVO as shown in Table 3.
Table 1:
Group A, comparison of the enhancement degree of 3 sequences of solid-enhancing lesions with diameters of ≥ 5 mm
| Half-Dose CE-T2 FLAIR | Half-Dose CE-T1WI | Routine-Dose CE-BRAVO | |
|---|---|---|---|
| Three points | 5 | 11 | 20 |
| Two points | 7 | 14 | 6 |
| One point | 15 (1a) | 2 (0a) | 1 (0a) |
| Total | 27 | 27 | 27 |
Missed brain metastases.
Table 2:
Group B, comparison of the enhancement degree of 3 sequences of ring-enhancing lesions with diameters of ≥ 5 mm
| Half-Dose CE-T2 FLAIR | Half-Dose CE-T1WI | Routine-Dose CE-BRAVO | |
|---|---|---|---|
| Three points | 17 | 6 | 11 |
| Two points | 4 | 12 | 10 |
| One point | 2 (0a) | 5 (1a) | 2 (0a) |
| Total | 23 | 23 | 23 |
Missed brain metastases.
Table 3:
Group C, comparison of the enhancement degree of 3 sequences of lesions with diameters of < 5 mm
| Half-Dose CE-T2 FLAIR | Half-Dose CE-T1WI | Routine-Dose CE-BRAVO | |
|---|---|---|---|
| Three points | 32 | 1 | 7 |
| Two points | 6 | 9 | 20 |
| One point | 1 (0a) | 29 (16a) | 12 (9a) |
| Total | 39 | 39 | 39 |
Missed brain metastases.
DISCUSSION
Accurate diagnosis of brain metastases before treatment is important because therapeutic planning is dependent on the presence and number of metastatic lesions;24 however, different imaging methods have different detection efficiencies. In this study, we compared the enhancement degree among half-dose CE-T2 FLAIR, half-dose CE-T1WI, and routine-dose CE-BRAVO in brain metastases and concluded that large and solid-enhancing brain metastases are better visualized on CE-T1WI or CE-BRAVO, while small and ring-enhancing brain metastases are better shown on CE-T2 FLAIR using a half dose of the high-relaxivity contrast agent gadobenate dimeglumine.
A previous study found that when the GBCA concentration was set between 0.1 and 0.3 mmol/L, the difference in signal intensity between T2 FLAIR and T1WI was obvious;25 this concentration was almost the same as that in our in vitro study (0.12–0.48 mmol/L). According to our results from the in vitro measurements, CE-T2 FLAIR was more sensitive to lower GBCA concentrations than CE-T1WI and low-dose CE-T2 FLAIR could provide satisfactory signal intensity. Considering that gadolinium cannot penetrate completely from plasma into the lesion, we speculated that half-dose gadolinium might overlap with the optimum concentration range required for CE-T2 FLAIR. We performed 2 different contrast-enhanced T1-weighted sequences, including spin-echo T1WI and 3D-BRAVO as reference standards to assess the enhancement degree of CE-T2 FLAIR. 3D-BRAVO is a gradient-echo sequence that uses thin-layer and no interlayer spacing scans, combined with variable flip angle spin-echo acquisition technology, which can observe lesions from multiple orientations and angles. Previous studies also demonstrated the higher detectability of small metastases using 3D-BRAVO sequences compared with conventional spin-echo sequences.26 Therefore, in our study, low-dose CE-T2 FLAIR was used to evaluate the conspicuity of cerebral brain metastases with different sizes in comparison with CE-BRAVO after administration of a normal dose (0.1 mmol/kg) of GBCA.
Scanning time is an important factor that affects the signal intensity of lesions, because the infiltration of gadolinium from blood vessels into the extracellular space is a dynamic process. A delay in imaging time may be effective in increasing the signal intensity because it prolongs the perfusion of contrast agent by the leaky neovasculature within the metastases.27 Keremer et al23 studied the role of delayed CE-T2 FLAIR in meningeal diseases. They pointed out that delayed CE-T2 FLAIR could achieve more accurate information compared with delayed CE-T1WI or early CE-T2 FLAIR, but optimal imaging time for CE-T2 FLAIR was not studied in their work. In our study, we performed 3 consecutive phases of CE-T2 FLAIR to observe the effect of scanning time on T2 FLAIR, and we found that the later time points (2 minutes 49 seconds to 5 minutes 38 seconds) of CE-T2 FLAIR acquisitions showed a higher enhancement degree compared with the first acquisition. Thus, a delay of at least 3–5 minutes is suggested for the postcontrast CE-T2 FLAIR imaging. As for spin-echo T1WI, Akeson et al28 suggested that the scan should not be started within 5 minutes after injection; the tumor showed better enhancement when delayed for 5–25 minutes. Thus, we performed CE-T1WI after 3 phases of CE-T2 FLAIR to ensure that all sequences were at their optimum scanning time.
Up to 50% of patients with brain metastasis have 1 lesion.1,29 For these patients, the detection of metastases is extremely important for treatment. Small metastases are not combined with vasogenic edema, and they usually show slight enhancement.1 Therefore, they are often missed using nonenhanced T2 FLAIR or enhanced T1-weighted sequences. As for the small metastases (<5 mm) in our study, we found that half-dose CE-T2 FLAIR showed a better enhancement degree and higher a detection rate than CE-T1WI or CE-BRAVO. Our in vitro experiments suggested that T2 FLAIR may show better enhancement at a lower concentration of gadolinium-based contrast agent. This phenomenon is explained by the unique T1-weighting of the T2 FLAIR sequence. Because of the mild T1-weighting induced by the long TI and T1-shortening caused by gadolinium, the T2 FLAIR sequence is more sensitive to low concentrations than a conventional contrast-enhanced T1 sequence.17,19,25
When the diameter of the lesion is <5 mm, the damage of the blood-brain barrier is mild and the vascular permeability is relatively low,30 leading to a low contrast agent concentration in the extracellular space in tumor tissue. The concentration satisfies the enhancement level of CE-T2 FLAIR but does not satisfy that of CE-BRAVO; hence the enhancement degree on CE-T2 FLAIR was higher than that on CE-BRAVO. The capillary permeability varies with the size of metastases,31,32 and large solid metastases usually have immature vessels with high permeability.33,34 When the metastases become larger, the concentration largely accumulates in the extracellular space due to the severe damage to the blood-brain barrier and progression of angiogenesis,4 dramatically shortening the T2 effect and obscuring the signal-enhanced T1 effect on CE-T2 FLAIR.35
Thus, the high concentration of gadolinium “inverts” the T2 FLAIR signal intensity and makes the lesions invisible, but it fulfills the requirement for CE-BRAVO, consistent with our in vitro findings of signal reduction in higher contrast concentrations. In our in vivo experiments, we also found that low-dose CE-T2 FLAIR could clearly show meningeal metastases because the gadolinium concentration is diluted when it leaks into the adjacent CSF through mildly damaged vessels, corresponding to the low-concentration setting used in an in vitro study.36
In a previous study, it was demonstrated that the peripheral margin of an invasive tumor has a lower vascular permeability,30 leading to a higher sensitivity of CE-T2 FLAIR in the delineation of brain metastases boundaries.22 This effect was found in our study in which brain metastases with rim enhancement showed higher signal enhancement on T2 FLAIR, probably due to a decreased capillary permeability in this part of the tumor.
Although using high-dose contrast on CE-T1WI can increase the detection rate of metastases,37 it may also increase the adverse effects on patients with cancer. Half-dose CE-T2 FLAIR would not only reduce the contrast agent dose but could also improve the detection rate of small cerebral metastases. However, hyperintense signal of the lesion on nonenhanced T2 FLAIR images caused by prolonged T2 signal could mask the real margin of tissue showing contrast enhancement and is not as intuitive as CE-T1WI. This feature might, to some extent, limit the clinical application of CE-T2 FLAIR in central nervous system imaging. Therefore, at least a half-dose CE-T1WI should be acquired after CE-T2 FLAIR to identify the lesion margin or demonstrate metastases with a high concentration of gadolinium. In general, half-dose CE-T2 FLAIR and CE-T1-weighted sequences can provide complementary information.
This study has certain limitations. First, the sample size of each group is relatively small, which may have some negative impact on the statistical results. Second, it would be better to study the signal enhancement of brain metastases on half-dose CE-T2 FLAIR images during a longer time period; however, for ethical reasons, this was not feasible because patients with cancer and brain metastases can undergo MR imaging with only a limited examination time. Third, there is a potential bias in the evaluation of different sequences because the raters were not blinded to the sequence type. Additionally, half-dose CE-T1WI was performed in our study because we intended to ensure that the total dose was halved when our protocol was applied to the clinical practice, but the dosages used for CE-T1WI and CE-BRAVO were different, possibly causing a certain bias in the comparison of the enhancement degree between the 2 sequences.
CONCLUSIONS
CE-T1-weighted sequences and CE-T2 FLAIR are mutually complementary for evaluating brain metastases. Large and solid-enhancing brain metastases are better visualized on CE-T1-weighted sequences, while small and ring-enhancing metastases are better visualized on delayed (3–5 minute) CE-T2 FLAIR sequences using a half-dose of the high-relaxivity contrast agent gadobenate dimeglumine.
Acknowledgments
We thank Yan Ren and Yue Wu for editing the manuscript. In addition, we appreciate colleagues from the Oncology Department of Huashan Hospital for providing the patients’ suspected brain metastases.
ABBREVIATIONS:
- BRAVO
brain volume imaging
- CE
contrast-enhanced
- CR
contrast ratio
- GBCA
gadolinium-based contrast agents
- PI
percentage increase
Footnotes
Teng Jin and Mengxi Ge contributed equally to this work.
This work was funded by Bracco International B.V. as an investigator-initiated trial.
References
- 1.Essig M, Knopp MV, Schoenberg SO, et al. Cerebral gliomas and metastases: assessment with contrast-enhanced fast fluid-attenuated inversion-recovery MR imaging. Radiology 1999;210:551–57 10.1148/radiology.210.2.r99ja22551 [DOI] [PubMed] [Google Scholar]
- 2.Aizer AA, Lee EQ. Brain metastases. Neurol Clin 2018;36:557–77 10.1016/j.ncl.2018.04.010 [DOI] [PubMed] [Google Scholar]
- 3.Sorensen JB, Hansen HH, Hansen M, et al. Brain metastases in adenocarcinoma of the lung: frequency, risk groups, and prognosis. J Clin Oncol 1988;6:1474–80 10.1200/JCO.1988.6.9.1474 [DOI] [PubMed] [Google Scholar]
- 4.Ahn SJ, Chung TS, Chang JH, et al. The added value of double dose gadolinium enhanced 3D T2 fluid-attenuated inversion recovery for evaluating small brain metastases. Yonsei Med J 2014;55:1231–37 10.3349/ymj.2014.55.5.1231 [DOI] [PMC free article] [PubMed] [Google Scholar]
- 5.Park J, Kim J, Yoo E, et al. Detection of small metastatic brain tumors: comparison of 3D contrast-enhanced whole-brain black-blood imaging and MP-RAGE imaging. Invest Radiol 2012;47:136–41 10.1097/RLI.0b013e3182319704 [DOI] [PubMed] [Google Scholar]
- 6.Chang EL, Hassenbusch SJ 3rd, Shiu AS, et al. The role of tumor size in the radiosurgical management of patients with ambiguous brain metastases. Neurosurgery 2003;53:272–72 10.1227/01.NEU.0000073546.61154.9A [DOI] [PubMed] [Google Scholar]
- 7.Park J, Kim EY. Contrast-enhanced, three-dimensional, whole-brain, black-blood imaging: application to small brain metastases. Magn Reson Med 2010;63:553–61 10.1002/mrm.22261 [DOI] [PubMed] [Google Scholar]
- 8.Kim D, Heo YJ, Jeong HW, et al. Usefulness of the delay alternating with nutation for tailored excitation pulse with T1-weighted sampling perfection with application-optimized contrasts using different flip angle evolution in the detection of cerebral metastases: comparison with MPRAGE. AJNR Am J Neuroradiol 2019;40:1469–75 10.3174/ajnr.A6158 [DOI] [PMC free article] [PubMed] [Google Scholar]
- 9.Fahlstrom M, Fransson S, Blomquist E, et al. Dynamic contrast-enhanced magnetic resonance imaging may act as a biomarker for vascular damage in normal appearing brain tissue after radiotherapy in patients with glioblastoma. Acta Radiol Open 2018;7:2058460118808811 10.1177/2058460118808811 [DOI] [PMC free article] [PubMed] [Google Scholar]
- 10.Ozturk K, Soylu E, Tolunay S, et al. Dynamic contrast-enhanced T1-weighted perfusion magnetic resonance imaging identifies glioblastoma immunohistochemical biomarkers via tumoral and peritumoral approach: a pilot study. World Neurosurg 2019;128:e195–208 10.1016/j.wneu.2019.04.089 [DOI] [PubMed] [Google Scholar]
- 11.Mathews VP, King JC, Elster AD, et al. Cerebral infarction: effects of dose and magnetization transfer saturation at gadolinium-enhanced MR imaging. Radiology 1994;190:547–52 10.1148/radiology.190.2.8284414 [DOI] [PubMed] [Google Scholar]
- 12.Rogosnitzky M, Branch S. Gadolinium-based contrast agent toxicity: a review of known and proposed mechanisms. Biometals 2016;29:365–76 10.1007/s10534-016-9931-7 [DOI] [PMC free article] [PubMed] [Google Scholar]
- 13.Endrikat J, Dohanish S, Schleyer N, et al. 10 years of nephrogenic systemic fibrosis: a comprehensive analysis of nephrogenic systemic fibrosis reports received by a pharmaceutical company from 2006 to 2016. Invest Radiology 2018;53:541–50 10.1097/RLI.0000000000000462 [DOI] [PMC free article] [PubMed] [Google Scholar]
- 14.Tedeschi E, Caranci F, Giordano F, et al. Gadolinium retention in the body: what we know and what we can do. Radiol Med 2017;122:589–600 10.1007/s11547-017-0757-3 [DOI] [PubMed] [Google Scholar]
- 15.Semelka RC, Ramalho J, Vakharia A, et al. Gadolinium deposition disease: initial description of a disease that has been around for a while. Magn Reson Imaging 2016;34:1383–90 10.1016/j.mri.2016.07.016 [DOI] [PubMed] [Google Scholar]
- 16.Lord ML, Chettle DR, Grafe JL, et al. Observed deposition of gadolinium in bone using a new noninvasive in vivo biomedical device: results of a small pilot feasibility study. Radiology 2018;287:96–103 10.1148/radiol.2017171161 [DOI] [PubMed] [Google Scholar]
- 17.Mathews VP, Caldemeyer KS, Lowe MJ, et al. Brain: gadolinium-enhanced fast fluid-attenuated inversion-recovery MR imaging. Radiology 1999;211:257–63 10.1148/radiology.211.1.r99mr25257 [DOI] [PubMed] [Google Scholar]
- 18.Oguz KK, Cila A. Rim enhancement of meningiomas on fast FLAIR imaging. Neuroradiology 2003;45:78–81 10.1007/s00234-002-0914-8 [DOI] [PubMed] [Google Scholar]
- 19.Terae S, Yoshida D, Kudo K, et al. Contrast-enhanced FLAIR imaging in combination with pre- and postcontrast magnetization transfer T1-weighted imaging: usefulness in the evaluation of brain metastases. J Magn Reson Imaging 2007;25:479–87 10.1002/jmri.20847 [DOI] [PubMed] [Google Scholar]
- 20.Rumpel H, Chan LL. Serial FLAIR imaging after Gd-DTPA contrast: pitfalls in stroke trial magnetic resonance imaging. Stroke 2003;34:797–98 10.1161/01.STR.0000056528.05390.58 [DOI] [PubMed] [Google Scholar]
- 21.Mathews VP. Show me the gadolinium! AJNR Am J Neuroradiol 2005;26:440–41 [PMC free article] [PubMed] [Google Scholar]
- 22.Ercan N, Gultekin S, Celik H, et al. Diagnostic value of contrast-enhanced fluid-attenuated inversion recovery MR imaging of intracranial metastases. AJNR Am J Neuroradiol 2004;25:761–65 [PMC free article] [PubMed] [Google Scholar]
- 23.Kremer S, Abu Eid M, Bierry G, et al. Accuracy of delayed post-contrast FLAIR MR imaging for the diagnosis of leptomeningeal infectious or tumoral diseases. J Neuroradiol 2006;33:285–91 10.1016/S0150-9861(06)77286-8 [DOI] [PubMed] [Google Scholar]
- 24.Vecht CJ, Haaxma-Reiche H, Noordijk EM, et al. Treatment of single brain metastasis: radiotherapy alone or combined with neurosurgery? Ann Neurol 1993;33:583–90 10.1002/ana.410330605 [DOI] [PubMed] [Google Scholar]
- 25.Jackson EF, Hayman LA. Meningeal enhancement on fast FLAIR images. Radiology 2000;215:922–94 10.1148/radiology.215.3.r00ap45922 [DOI] [PubMed] [Google Scholar]
- 26.Furutani K, Harada M, Mawlan M, et al. Difference in enhancement between spin echo and 3-dimensional fast spoiled gradient recalled acquisition in steady state magnetic resonance imaging of brain metastasis at 3-T magnetic resonance imaging. J Comput Assist Tomogr 2008;32:313–19 10.1097/RCT.0b013e318074fd9d [DOI] [PubMed] [Google Scholar]
- 27.Lüdemann L, Grieger W, Wurm R, et al. Quantitative measurement of leakage volume and permeability in gliomas, meningiomas and brain metastases with dynamic contrast-enhanced MRI. Magn Reson Imaging 2005;23:833–41 10.1016/j.mri.2005.06.007 [DOI] [PubMed] [Google Scholar]
- 28.Akeson P, Nordstrom CH, Holtas S. Time-dependency in brain lesion enhancement with gadodiamide injection. Acta Radiol 1997;38:19–24 10.1080/02841859709171236 [DOI] [PubMed] [Google Scholar]
- 29.Delattre JY, Krol G, Thaler HT, et al. Distribution of brain metastases. Arch Neurol 1988;45:741–44 10.1001/archneur.1988.00520310047016 [DOI] [PubMed] [Google Scholar]
- 30.Hasegawa H, Ushio Y, Hayakawa T, et al. Changes of the blood-brain barrier in experimental metastatic brain tumors. J Neurosurg 1983;59:304–10 10.3171/jns.1983.59.2.0304 [DOI] [PubMed] [Google Scholar]
- 31.Yamada K, Ushio Y, Hayakawa T, et al. Quantitative autoradiographic measurements of blood-brain barrier permeability in the rat glioma model. J Neurosurg 1982;57:394–98 10.3171/jns.1982.57.3.0394 [DOI] [PubMed] [Google Scholar]
- 32.Blasberg RG, Kobayashi T, Patlak CS, et al. Regional blood flow, capillary permeability, and glucose utilization in two brain tumor models: preliminary observations and pharmacokinetic implications. Cancer Treat Rep 1981;65(Suppl 2)3–12 [PubMed] [Google Scholar]
- 33.Zagzag D, Hooper A, Friedlander DR, et al. In situ expression of angiopoietins in astrocytomas identifies angiopoietin-2 as an early marker of tumor angiogenesis. Exp Neurol 1999;159:391–400 10.1006/exnr.1999.7162 [DOI] [PubMed] [Google Scholar]
- 34.Fukumura D, Xu L, Chen Y, et al. Hypoxia and acidosis independently up-regulate vascular endothelial growth factor transcription in brain tumors in vivo. Cancer Res 2001;61:6020–24 [PubMed] [Google Scholar]
- 35.Davis PL, Parker DL, Nelson JA, et al. Interactions of paramagnetic contrast agents and the spin echo pulse sequence. Invest Radiol 1988;23:381–88 10.1097/00004424-198805000-00010 [DOI] [PubMed] [Google Scholar]
- 36.Park YW, Ahn SJ. Comparison of contrast-enhanced T2 FLAIR and 3D T1 black-blood fast spin-echo for detection of leptomeningeal metastases. Investig Magn Reson Imaging 2018;22:86 10.13104/imri.2018.22.2.86 [DOI] [Google Scholar]
- 37.Akeson P, Larsson EM, Kristoffersen DT, et al. Brain metastases–comparison of gadodiamide injection-enhanced MR imaging at standard and high dose, contrast-enhanced CT and non-contrast-enhanced MR imaging. Acta Radiol 1995;36:300–06 10.1177/028418519503600318 [DOI] [PubMed] [Google Scholar]


