

Abstract
BACKGROUND AND PURPOSE:
Contrast-enhancing MS lesions are important markers of active inflammation in the diagnostic work-up of MS and in disease monitoring with MR imaging. Because intravenous contrast agents involve an expense and a potential risk of adverse events, it would be desirable to identify active lesions without using a contrast agent. The purpose of this study was to evaluate whether pre-contrast injection tissue-relaxation rates and proton density of MS lesions, by using a new quantitative MR imaging sequence, can identify active lesions.
MATERIALS AND METHODS:
Forty-four patients with a clinical suspicion of MS were studied. MR imaging with a standard clinical MS protocol and a quantitative MR imaging sequence was performed at inclusion (baseline) and after 1 year. ROIs were placed in MS lesions, classified as nonenhancing or enhancing. Longitudinal and transverse relaxation rates, as well as proton density were obtained from the quantitative MR imaging sequence. Statistical analyses of ROI values were performed by using a mixed linear model, logistic regression, and receiver operating characteristic analysis.
RESULTS:
Enhancing lesions had a significantly (P < .001) higher mean longitudinal relaxation rate (1.22 ± 0.36 versus 0.89 ± 0.24), a higher mean transverse relaxation rate (9.8 ± 2.6 versus 7.4 ± 1.9), and a lower mean proton density (77 ± 11.2 versus 90 ± 8.4) than nonenhancing lesions. An area under the receiver operating characteristic curve value of 0.832 was obtained.
CONCLUSIONS:
Contrast-enhancing MS lesions often have proton density and relaxation times that differ from those in nonenhancing lesions, with lower proton density and shorter relaxation times in enhancing lesions compared with nonenhancing lesions.
MR imaging of the CNS is of great importance in the diagnostic evaluation of multiple sclerosis and in the follow-up and monitoring of disease activity and treatment response.1 With the use of MR imaging, dissemination of lesions in time and space is evaluated according to the revised McDonald criteria.2 New lesions at follow-up scans represent disease activity and may indicate a need for a therapy switch.3 Even though patients with MS are monitored with MR imaging, lesion load does not have a strong predictive value for disability.4 Injection of a gadolinium (Gd)-based contrast agent is included in routine MS MR imaging protocols and is used to detect active MS lesions on the basis of a local disruption of the blood-brain barrier due to acute inflammation. Even though uncommon, Gd administration may be associated with nephrogenic systemic fibrosis5 in patients with reduced renal function, and there is a potential risk for immediate adverse events.6 Furthermore, 2 recent studies reported signal changes in the deep nuclei of the brain with a relationship to an increasing cumulative dose of Gd-based contrast material,7,8 which has been shown to indicate deposition of Gd in the body.9 Apart from the potential adverse events, contrast agents also constitute an additional expense (cost of contrast agent and prolongation of scanning time). Intravenous injections of contrast agents may also cause patient discomfort during MR imaging examinations.
Overall, it would be desirable to develop a method to identify active MS lesions without the administration of contrast agents. Previous studies have reported changes in acute MS lesions regarding MR imaging frequency shift,10 magnetization transfer ratio,11 and relaxation values,12 suggesting the possibility of using quantitative methods to distinguish and characterize the acute lesions. However, so far no method has met the requirements necessary to be considered fully clinically applicable. A new sequence for quantitative MR imaging, quantitative MRI (qMRI), with a clinically acceptable scanning time of approximately 5 minutes has been developed.13,14 The qMRI sequence makes it possible to measure the longitudinal relaxation rate (R1), the transverse relaxation rate (R2), and proton density (PD) from the same scan and also takes the normalized radiofrequency B1 field into account.
This study was performed to compare the relaxation rates and PD of active MS lesions before contrast agent injection with quantitative values from nonenhancing lesions to determine whether active MS lesions can be identified by qMRI without the administration of a Gd-based contrast agent.
Materials and Methods
Subjects
Forty-six patients with a clinical suspicion of MS were consecutively enrolled in a prospective longitudinal cohort study of early MS at the Department of Neurology at the University Hospital in Linköping, Sweden. Two patients were excluded, 1 due to withdrawal of consent and 1 due to the finding of a trigeminal schwannoma, which explained the patient′s clinical findings. The patients were classified as having possible MS or MS according to the revised McDonald criteria.2 Table 1 shows details of patient demographics. MR imaging according to a standard clinical MS protocol with the addition of qMRI before and after administration of a Gd-based contrast agent was performed at inclusion (baseline) and after 1 year. In addition, 4 MR imaging examinations were performed in relation to clinical relapses. Ninety-two MR imaging examinations were performed. The local institutional review board approved the study, and informed written consent was obtained from all patients.
Table 1:
Patient demographics
| Demographics | |
|---|---|
| No. of subjects | 44 |
| Median age at inclusion (yr) | 31 (range, 21–62) |
| Sex (M/F) | 8:36 |
| Diagnosis at inclusion (possible MS/MS) | 23/21 |
| Diagnosis at 1-year follow-up (possible MS/MS) | 16/28 |
| Relapsea at inclusion (yes/no) | 22/22 |
| Relapse at 1-year follow-up (yes/no) | 4/40 |
| Median EDSS at inclusion | 2 (range, 0–5) |
| Median EDSS at 1-year follow-up | 1.25 (range, 0–4) |
Note:—EDSS indicates Expanded Disability Status Scale.
A “relapse” was defined as new symptoms or worsening of previous symptoms, lasting >24 hours and in the absence of increased body temperature and infection.
MR Imaging Acquisition
Images were acquired on a 1.5T MR imaging scanner (Achieva; Philips Healthcare, Best, the Netherlands) by using an 8-channel phased array head coil. The sequence parameters for conventional images were as follows:
T2-weighted fluid-attenuated inversion recovery: axial; FOV, 230 × 183 mm; 43 sections; voxel size, 0.9 × 1.14 × 3 mm; TE, 120 ms; TR, 6000 ms; TI, 2000 ms; scan time, 6 minutes
T1-weighted spin-echo before and after Gd contrast agent injection: axial; FOV, 230 × 183 mm; 43 sections; voxel size, 0.9 × 1.13 × 3 mm; TE, 15 ms; TR, 596 ms; scan time, 5:08 minutes
T2-weighted spin-echo; axial; FOV, 230 × 184 mm; 43 sections; voxel size, 0.6 × 0.78 mm; TE, 100 ms; TR, 4452 ms; scan time, 3:42 minutes.
The quantitative sequence, QMAP,13,14 is a multisection, multiecho, and multisaturation delay qMRI technique, with the following parameters in this study:
qMRI: axial; FOV, 230 × 182; 43 sections; voxel size, 1.5 × 1.5 mm; TE, 14, 28, 42, 56, 70 ms; TR, 4244 ms; TI, 0.0974, 0.5846, 1.8511, 4.0919 seconds; saturation flip angle, 120°; scan time, 6:09 minutes.
All images had a section thickness of 3 mm without an intersection gap. Postcontrast qMRI images were acquired approximately 15 minutes after intravenous injection of 0.2 mL/kg body weight of a 0.5-mmol/mL Gd-based contrast agent (gadopentetate dimeglumine, Magnevist; Bayer HealthCare Pharmaceuticals, Wayne, New Jersey).
Postprocessing and ROI Placement
The qMRI sequence yields quantitative maps of R1, R2, and PD (Fig 1), which are used for measurements and to create synthetic images matching the conventional ones (Fig 2). The postprocessing time of the raw image dataset was approximately 1 minute on an ordinary PC by using SyMRI Diagnostic software (SyntheticMR, Linköping, Sweden) to create the synthetic images. Relaxation time values (T-values) were obtained from R1 and R2 by calculating T = 1/R. Using the software MevisLab, Version 2.4 (MeVis Medical Solutions, Bremen, Germany), we anonymized the synthetic images with corresponding conventional images and presented them to a neuroradiologist in random order. For each patient, synthetic T2-weighted, T2-FLAIR, T1-weighted, and T1-weighted Gd images were displayed side by side. MS lesions were identified by conventional neuroradiologic criteria, described in the McDonald criteria for MS. The MS lesions were then classified by visual assessment as enhancing or nonenhancing. The neuroradiologist had access to the conventional images for confirmation of the findings (Fig 3A).
Fig 1.

An example of quantitative R1 (left), R2 (middle), and proton density (right) maps derived from the qMRI scan in a patient with MS.
Fig 2.

Synthetic T1WI (left), T2WI (middle), and T2-weighted FLAIR (right) imaging, postsynthesized from the quantitative MR imaging scan in a patient with MS.
Fig 3.
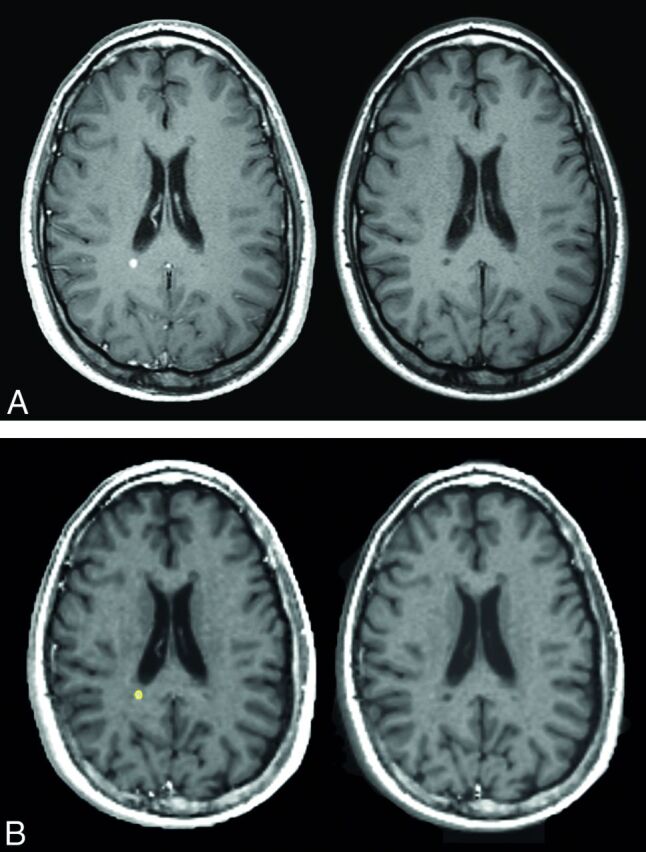
A, Conventional T1WI images corresponding to the synthetic images in B. Postgadolinium imaging is on the left and native on the right. B, An active lesion with ROI placement in the synthetic T1WI after gadolinium-based contrast agent injection (left image). The ROI was then registered onto the synthetic precontrast injection T1WI (right image).
ROIs were placed in the synthetic images within MS lesions of >3 mm in diameter, slightly inside the visual outer rim of the lesion in order to avoid partial volume effects from surrounding tissue. Thus ROI size varied depending on the size of the lesion. ROIs in nonenhancing lesions were drawn in synthetic T2-weighted images. ROIs in enhancing lesions were drawn on the synthetic T1-weighted Gd images (Fig 3B). A transformation matrix between the qMRI volume after contrast agent injection and the qMRI volume before contrast agent injection was calculated. This calculation was done by a registration of the synthetic T1-weighted Gd imaging to the synthetic T1WI by using rigid body registration with the image registration toolkit in MeVisLab. The transformation matrix was then used to register the T1-weighted Gd imaging ROIs of active lesions to the precontrast qMRI volume (Fig 3A).
In the same patients, ROIs were also placed in synthetic T2-weighted images in the normal-appearing white matter (NAWM) in an area in the contralateral hemisphere that corresponded as far as possible to the location of the lesion. However, NAWM ROIs tended to be located more subcortical in the hemisphere due to diffuse signal changes in the periventricular white matter, “dirty appearing white matter” (Fig 4).
Fig 4.
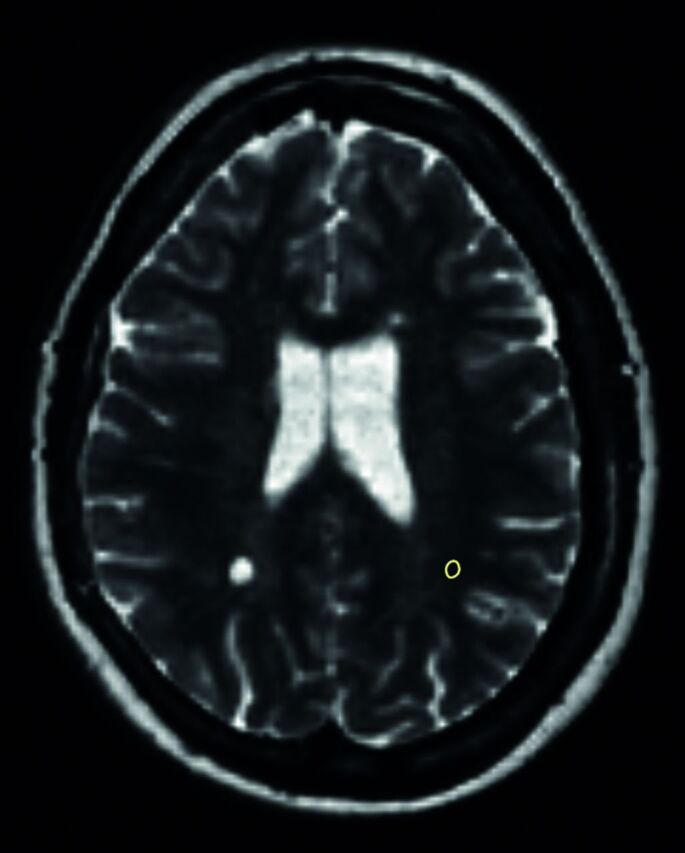
An example of a synthetic T2WI with an ROI placed in the NAWM in the left hemisphere contralateral to a nonenhancing lesion in the right hemisphere.
Statistics
After forming mean values of R1, R2, and PD in each ROI, these means were compared by using a mixed linear model. The fixed effects were the type of ROI (NAWM, enhancing lesion, or nonenhancing lesion) and the time (in years) from the first examination, whereas patient identity was a random effect. For comparisons between types of ROIs, we used the Tukey t test.
In addition, receiver operating characteristic (ROC) analysis was performed after aggregating data to the ROI level and excluding ROIs representing NAWM. Lesions were classified as nonenhancing or Gd-enhancing by using each of the measured entities (R1, R2, and PD) and a linear combination of the 3, obtained with a logistic regression model; the corresponding area under the ROC curve (AUC) was reported.
All statistical calculations were performed in JMP 9.0 (SAS, Cary, North Carolina).
Results
Of the 92 examinations, 14 contained both contrast-enhancing and nonenhancing MS lesions. Forty-four examinations had nonenhancing MS lesions only. These 58 examinations were obtained from 29 individuals. Thirty examinations had no lesions or MS lesions that were <3 mm. Four examinations had white matter lesions assessed as not having a typical MS lesion appearance (unspecific white matter lesions); thus, these examinations were not a part of the quantitative analysis. Forty-three ROIs were drawn in enhancing MS lesions, and 622 ROIs were drawn in nonenhancing MS lesions. In all, 102 ROIs were drawn in NAWM, approximately 2 ROIs per patient with certain MS lesions.
Enhancing MS lesions had significantly higher precontrast mean R1, higher mean R2, and lower mean PD than nonenhancing lesions (Table 2). Precontrast relaxation times for the enhancing lesions were thus shorter than those for the nonenhancing lesions. For enhancing lesions, the mean R1 value was 1.22 s−1 (T1 = 820 ms) and the mean R2 value was 9.8 s−1 (T2 = 102 ms). For nonenhancing lesions, a mean R1 value of 0.89 s−1 (T1 = 1126 ms) and a mean R2 of 7.4 s−1 (T2 = 135 ms) were found. NAWM had a mean R1 of 1.71 s−1 (T1 = 584 ms), and mean R2 was 13.1 s−1 (T2 = 76 ms).
Table 2:
Quantitative measurements of normal-appearing white matter and enhancing and nonenhancing MS lesions before gadolinium-based contrast agent injectiona
| R1 (1/s) | R2 (1/s) | PD (%) | |
|---|---|---|---|
| NAWM (n = 102) | 1.71 ± 0.09 | 13.1 ± 0.67 | 62.4 ± 1.9 |
| Enhancing lesions (n = 43) | 1.22 ± 0.36 | 9.8 ± 2.6 | 77.0 ± 11.2 |
| Nonenhancing lesions (n = 622) | 0.89 ± 0.24 | 7.4 ± 1.9 | 89.8 ± 8.4 |
| Difference between enhancing and nonenhancing lesions | +0.33b | +2.43b | −12.8b |
Data are means. Differences are estimated as least squares means and are tested with the Tukey t test.
P < .001.
Distributions of mean R1, mean R2, and mean PD for enhancing and nonenhancing lesions are shown in Fig 5. As can be seen in Fig 5A, enhancement was rare in lesions with a mean R1 value below 0.8 s−1 (sensitivity, 0.884). On the other hand, above this threshold, enhancing lesions were still less frequent than nonenhancing ones, and the specificity was only 0.360. Very few enhancing lesions had a mean R2 value below 6 s−1 (sensitivity, 0.954), whereas higher mean R2 values were not specific for enhancing lesions (specificity, 0.249) (Fig 5B). Mean PD values above 95% were very seldom found in enhancing lesions (sensitivity, 0.977), but even below this threshold, the enhancing lesions made up a minority of the findings (specificity, 0.317) (Fig 5C). Table 3 shows the sensitivity and specificity for a few different cutoff values in the same parameters for predicting enhancing MS lesions.
Fig 5.
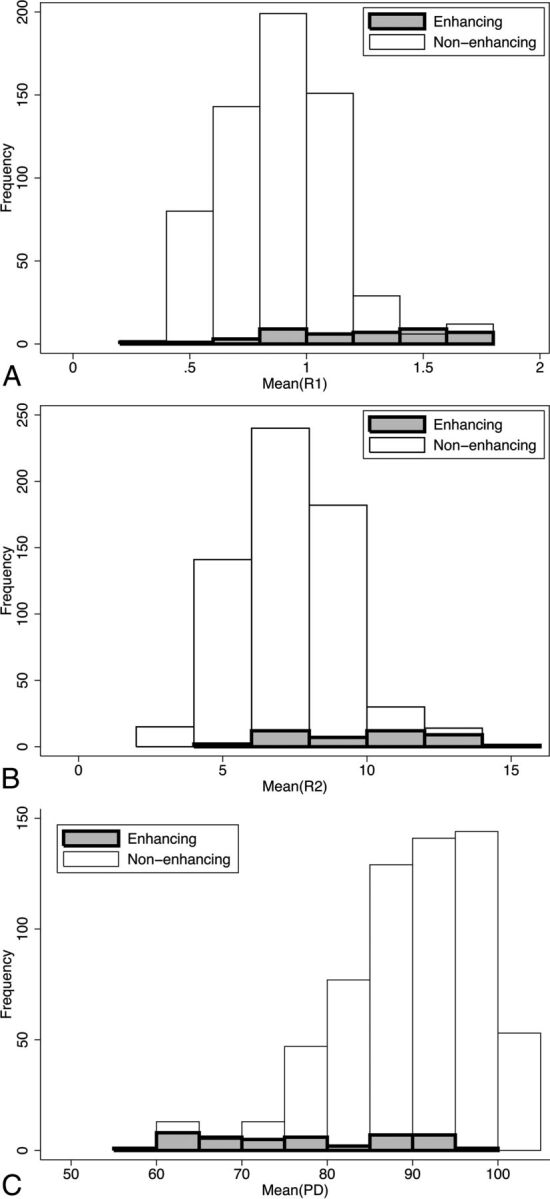
A, Histograms of mean R1 for enhancing and nonenhancing lesions. B, Histograms of mean R2 for enhancing and nonenhancing lesions. C, Histograms of mean PD for enhancing and nonenhancing lesions.
Table 3:
Sensitivity and specificity for different cutoffs for relaxation values to predict enhancing MS lesions
| Relaxation Value | Sensitivity (%) | Specificity (%) | Youden Indexa |
|---|---|---|---|
| R1 measurement | |||
| 1.28 | 47 | 95 | 42 |
| 1.17 | 58 | 90 | 48 |
| 1.10 | 60 | 82 | 42 |
| R2 measurement | |||
| 10 | 51 | 93 | 44 |
| 9.34 | 63 | 87 | 50 |
| 8.70 | 65 | 78 | 43 |
| PD measurement | |||
| 77.69 | 54 | 92 | 46 |
| 79.96 | 61 | 87 | 48 |
| 82.53 | 63 | 82 | 45 |
Youden index = sensitivity + specificity − 100.
When sensitivity and specificity for all possible thresholds were combined in a receiver operating characteristic analysis, the area under the ROC curve was 0.764 for mean R1, 0.760 for mean R2, and 0.811 for mean PD. For the optimal linear combination of the 3 measurements obtained by logistic regression [−3.93 mean (R1) + 0.210 mean (R2) − 0.194 mean (PD)], the AUC was only slightly higher (0.832).
Discussion
There have been attempts to predict the breakdown of the BBB in MS lesions without contrast agents by using conventional images,15,16 but the accuracy has not been satisfactory so far. Previous studies have used features of conventional images (eg, T2 peripheral rim hypointensities16) and mathematic modeling of voxel-based T1 and T2 intensities15 in an attempt to identify active lesions, but they did not attain the desired sensitivity and specificity to fully identify active lesions without a contrast agent. Quantification of diffusion characteristics of acute lesions by using ADC values was previously thought to be a discriminator of acute-versus-chronic MS lesions, but a recent study showed variable diffusion values in acute MS lesions.17 Most previous quantitative relaxation methods yielded measurements of either T1 or T2 relaxation. Some methods do quantify T1 and T2, but they have not been clinically applicable, due to either long scan times, lack of robustness, or complicated and cumbersome postprocessing procedures,18 and relaxation values are thus not part of the clinical routine assessment of MR imaging examinations today.
Previous reports of relaxation time measurements in MS lesions have shown variable results. In the present study, with the use of qMRI, we found significant differences between the quantitative values of enhancing lesions and nonenhancing lesions, which is in line with other studies that have found a difference in quantitative characteristics in acute MS lesions compared with nonenhancing lesions.10–12. We found that enhancing lesions had shorter T2 than nonenhancing lesions but longer T2 than NAWM. This finding is consistent with those in other studies,11,19 whereas some early studies on relaxation times in MS lesions showed a longer T2 in acute than in chronic lesions.20 However, looking at the original studies, Larsson et al21 did not find a difference in T1 and T2 measurements between acute and chronic plaques, but a tendency toward a slight increase in T1 and T2 in the acute plaques and a very high T2 value in the center of the plaque at a later stage. Ormerod et al22 reported a decrease in T1 and T2 relaxation times in serial studies of acute lesions; however the classification of acute or chronic MS lesions of the brain stem was based on the duration of symptoms, not on contrast enhancement in lesions.
Our finding of a shorter T1 in enhancing lesions than in nonenhancing lesions is not in line with the findings of Jurcoane et al.12 However, they used a method for voxel-based automatic calculation of T1 shortening after contrast agent administration, defining all FLAIR hyperintense areas, including dirty-appearing white matter, as lesions. Lesion voxels were then defined as contrast-enhancing if T1 shortening was 2 SDs above the T1 shortening in NAWM. Thus, dirty-appearing white matter would constitute a great part of the nonenhancing lesions, explaining the higher T1 values in enhancing lesions because the relaxation time values of dirty-appearing white matter are lower than those in lesions but higher than those in NAWM.23 In our study, the comparison was made between enhancing and nonenhancing lesions, not including the dirty-appearing white matter.
The finding of shorter T1 and T2 in enhancing lesions than in chronic lesions could be understood on the basis of the pathology involved,24 with the acute lesions being hypercellular due to an accumulation of inflammatory cells. The subsequent edema, intra- and intercellular in origin, results in a slight increase in the relaxation values compared with normal tissue. In chronic lesions, there are hypocellularity, demyelination, and naked axons, and the free water fraction increases, yielding a higher relaxation time value. This is also reflected in the higher PD values in nonenhancing lesions compared with the enhancing lesions.
Despite the significant differences demonstrated, the overlap in T1-, T2-, and PD values between enhancing and nonenhancing lesions results in an imperfect prediction of enhancement from qMRI values. Even after forming an optimal linear combination of the 3 measurements, the AUC was only slightly higher than that for PD, which yielded the best prediction out of the 3 measurements.
In this study, the relaxation measurements in the lesions were made irrespective of their time point in the disease, which means that the age of the lesion was not a factor in the analysis and the dynamics of the evolution of the lesions were not considered. However, Cotton et al25 showed that the acute phase with contrast enhancement has a median duration of 1–2 weeks for most lesions. Patients in this cohort were newly diagnosed with possible MS or MS, and most were in the early stages of the disease.
The ROC analysis gave a maximal AUC of 0.832, which is comparable with that in other studies,15 but the result does not support the use of relaxation time measurements alone for clinical evaluation of the status of the BBB in MS lesions, because the clinical setting requires a higher sensitivity and specificity. Nevertheless, qMRI is a potentially useful complement in the event of contraindications to contrast agents and in combination with the visual assessment of the images with regard to new lesions and in association with clinical findings of a relapse. The quantitative measurement of lesions is clearly a more objective tool than the visual assessment of a radiologist and could be of value in the longitudinal monitoring of patients with MS.
Because the qMRI sequence enables quantitative assessment of tissue relaxation values,26 other uses for this sequence are performing segmentation and volumetric measurements.27,28 The automated volumetric technique could also be an objective tool for the evaluation of brain atrophy development in patients with MS,29 which today is usually performed by visual assessment by the neuroradiologist in the clinical setting. qMRI could therefore complement conventional MR images in the examination of patients with MS regarding brain volume measurements.
This study was performed on a 1.5T scanner, and a previous study27 has shown that the results of tissue segmentation from the qMRI sequence may differ between 1.5T and 3T. This means that the relaxation values of this study cannot be extrapolated to a 3T MR imaging setting. However, the higher field strength at 3T gives a higher signal-to-noise ratio. This enables a higher resolution that potentially could decrease the partial volume effect, which would be beneficial for quantitative measurements. Even if care was taken to place ROIs within the MS lesions to avoid partial volume effects, this study would have been strengthened by an MR imaging protocol with isotropic voxels and even thinner sections for higher accuracy of ROI placement.
In this work, the number of contrast-enhancing lesions was limited, and future work will include follow-up MR imaging at 2 and 4 years, including scans from relapses, which will yield larger subject matter for analysis, looking at the quantitative properties of the brain after Gd-based contrast agent injection, in lesions and in the gray and white matter. In addition, a long-term prospective study could evaluate the predictive prognostic value of qMRI compared with traditional contrast-based assessment. One possibility would be that changes in the quantitative characteristics in acute MS lesions might better represent the pathologic process than visual assessment of contrast enhancement, which merely reflects the damaged BBB. Quantitative MR imaging with relaxation measurements may help elucidate more of the complex mechanisms behind multiple sclerosis.
Conclusions
Contrast-enhancing MS lesions have PD and relaxation times that differ from those in nonenhancing lesions, with lower PD and shorter relaxation times in enhancing lesions compared with nonenhancing lesions. PD, which had the highest AUC value, still had only a moderate ability to predict Gd enhancement. Even though qMRI can provide additional information about the changes occurring in MS, it does not seem to be able to replace Gd injection in the evaluation of MS lesions.
Acknowledgments
The authors wish to thank Anders Grönqvist at Centre for Medical Image Science and Visualization for technical support.
ABBREVIATIONS:
- AUC
area under the curve
- Gd
gadolinium
- NAWM
normal-appearing white matter
- PD
proton density
- qMRI
quantitative MRI
- ROC
receiver operating characteristic
- R1
longitudinal relaxation rate
- R2
transverse relaxation rate
Footnotes
This work was supported by the National Science and Engineering Research Council, University of Linköping, and University Hospital Research Funds.
References
- 1. Rocca MA, Anzalone N, Falini A, et al. Contribution of magnetic resonance imaging to the diagnosis and monitoring of multiple sclerosis. Radiol Med 2013;118:251–64 10.1007/s11547-012-0811-3 [DOI] [PubMed] [Google Scholar]
- 2. Polman CH, Reingold SC, Banwell B, et al. Diagnostic criteria for multiple sclerosis: 2010 revisions to the McDonald criteria. Ann Neurol 2011;69:292–302 10.1002/ana.22366 [DOI] [PMC free article] [PubMed] [Google Scholar]
- 3. Coyle PK. Switching therapies in multiple sclerosis. CNS Drugs 2013;27:239–47 10.1007/s40263-013-0042-5 [DOI] [PubMed] [Google Scholar]
- 4. Barkhof F. The clinico-radiological paradox in multiple sclerosis revisited. Curr Opin Neurol 2002;15:239–45 10.1097/00019052-200206000-00003 [DOI] [PubMed] [Google Scholar]
- 5. Thomsen HS, Morcos SK, Almén T, et al. ; ESUR Contrast Medium Safety Committee. Nephrogenic systemic fibrosis and gadolinium-based contrast media: updated ESUR Contrast Medium Safety Committee guidelines. Eur Radiol 2013;23:307–18 10.1007/s00330-012-2597-9 [DOI] [PubMed] [Google Scholar]
- 6. Prince MR, Zhang H, Zou Z, et al. Incidence of immediate gadolinium contrast media reactions. AJR Am J Roentgenol 2011;196:W138–43 10.2214/AJR.10.4885 [DOI] [PubMed] [Google Scholar]
- 7. Kanda T, Ishii K, Kawaguchi H, et al. High signal intensity in the dentate nucleus and globus pallidus on unenhanced T1-weighted MR images: relationship with increasing cumulative dose of a gadolinium-based contrast material. Radiology 2014;270:834–41 10.1148/radiol.13131669 [DOI] [PubMed] [Google Scholar]
- 8. Errante Y, Cirimele V, Mallio CA, et al. Progressive increase of T1 signal intensity of the dentate nucleus on unenhanced magnetic resonance images is associated with cumulative doses of intravenously administered gadodiamide in patients with normal renal function, suggesting dechelation. Invest Radiol 2014;49:685–90 10.1097/RLI.0000000000000072 [DOI] [PubMed] [Google Scholar]
- 9. McDonald RJ, McDonald JS, Kallmes DF, et al. Intracranial gadolinium deposition after contrast-enhanced MRI. Radiology 2015;275:772–82 10.1148/radiol.15150025 [DOI] [PubMed] [Google Scholar]
- 10. Wiggermann V, Hernández Torres E, Vavasour IM, et al. Magnetic resonance frequency shifts during acute MS lesion formation. Neurology 2013;81:211–18 10.1212/WNL.0b013e31829bfd63 [DOI] [PMC free article] [PubMed] [Google Scholar]
- 11. Levesque IR, Giacomini PS, Narayanan S, et al. Quantitative magnetization transfer and myelin water imaging of the evolution of acute multiple sclerosis lesions. Magn Reson Med 2010;63:633–40 10.1002/mrm.22244 [DOI] [PubMed] [Google Scholar]
- 12. Jurcoane A, Wagner M, Schmidt C, et al. Within-lesion differences in quantitative MRI parameters predict contrast enhancement in multiple sclerosis. J Magn Reson Imaging 2013;38:1454–61 10.1002/jmri.24107 [DOI] [PubMed] [Google Scholar]
- 13. Warntjes JB, Dahlqvist O, Lundberg P. Novel method for rapid, simultaneous T1, T*2, and proton density quantification. Magn Reson Med 2007;57:528–37 10.1002/mrm.21165 [DOI] [PubMed] [Google Scholar]
- 14. Warntjes JB, Leinhard OD, West J, et al. Rapid magnetic resonance quantification on the brain: optimization for clinical usage. Magn Reson Med 2008;60:320–29 10.1002/mrm.21635 [DOI] [PubMed] [Google Scholar]
- 15. Shinohara RT, Goldsmith J, Mateen FJ, et al. Predicting breakdown of the blood-brain barrier in multiple sclerosis without contrast agents. AJNR Am J Neuroradiol 2012;33:1586–90 10.3174/ajnr.A2997 [DOI] [PMC free article] [PubMed] [Google Scholar]
- 16. Treabă CA, Bălaşa R, Podeanu DM, et al. Cerebral lesions of multiple sclerosis: is gadolinium always irreplaceable in assessing lesion activity? Diagn Interv Radiol 2014;20:178–84 10.5152/dir.2013.13313 [DOI] [PMC free article] [PubMed] [Google Scholar]
- 17. Eisele P, Szabo K, Griebe M, et al. Reduced diffusion in a subset of acute MS lesions: a serial multiparametric MRI study. AJNR Am J Neuroradiol 2012;33:1369–73 10.3174/ajnr.A2975 [DOI] [PMC free article] [PubMed] [Google Scholar]
- 18. Deoni SC, Peters TM, Rutt BK. High-resolution T1 and T2 mapping of the brain in a clinically acceptable time with DESPOT1 and DESPOT2. Magn Reson Med 2005;53:237–41 10.1002/mrm.20314 [DOI] [PubMed] [Google Scholar]
- 19. Papanikolaou N, Papadaki E, Karampekios S, et al. T2 relaxation time analysis in patients with multiple sclerosis: correlation with magnetization transfer ratio. Eur Radiol 2004;14:115–22 10.1007/s00330-003-1946-0 [DOI] [PubMed] [Google Scholar]
- 20. MacKay AL, Vavasour IM, Rauscher A, et al. MR relaxation in multiple sclerosis. Neuroimaging Clin N Am 2009;19:1–26 10.1016/j.nic.2008.09.007 [DOI] [PubMed] [Google Scholar]
- 21. Larsson HB, Frederiksen J, Petersen J, et al. Assessment of demyelination, edema, and gliosis by in vivo determination of T1 and T2 in the brain of patients with acute attack of multiple sclerosis. Magn Reson Med 1989;11:337–48 10.1002/mrm.1910110308 [DOI] [PubMed] [Google Scholar]
- 22. Ormerod IE, Bronstein A, Rudge P, et al. Magnetic resonance imaging in clinically isolated lesions of the brain stem. J Neurol Neurosurg Psychiatry 1986;49:737–43 10.1136/jnnp.49.7.737 [DOI] [PMC free article] [PubMed] [Google Scholar]
- 23. West J, Aalto A, Tisell A, et al. Normal appearing and diffusely abnormal white matter in patients with multiple sclerosis assessed with quantitative MR. PLoS One 2014;9:e95161 10.1371/journal.pone.0095161 [DOI] [PMC free article] [PubMed] [Google Scholar]
- 24. Filippi M, Rocca MA, Barkhof F, et al. ; Attendees of the Correlation between Pathological MRI Findings in MS Workshop. Association between pathological and MRI findings in multiple sclerosis. Lancet Neurol 2012;11:349–60 10.1016/S1474-4422(12)70003-0 [DOI] [PubMed] [Google Scholar]
- 25. Cotton F, Weiner HL, Jolesz FA, et al. MRI contrast uptake in new lesions in relapsing-remitting MS followed at weekly intervals. Neurology 2003;60:640–46 10.1212/01.WNL.0000046587.83503.1E [DOI] [PubMed] [Google Scholar]
- 26. West J, Warntjes JB, Lundberg P. Novel whole brain segmentation and volume estimation using quantitative MRI. Eur Radiol 2012;22:998–1007 10.1007/s00330-011-2336-7 [DOI] [PubMed] [Google Scholar]
- 27. West J, Blystad I, Engström M, et al. Application of quantitative MRI for brain tissue segmentation at 1.5 T and 3.0 T field strengths. PLoS One 2013;8:e74795 10.1371/journal.pone.0074795 [DOI] [PMC free article] [PubMed] [Google Scholar]
- 28. Warntjes JB, Tisell A, Landtblom AM, et al. Effects of gadolinium contrast agent administration on automatic brain tissue classification of patients with multiple sclerosis. AJNR Am J Neuroradiol 2014;35:1330–36 10.3174/ajnr.A3890 [DOI] [PMC free article] [PubMed] [Google Scholar]
- 29. Vågberg M, Lindqvist T, Ambarki K, et al. Automated determination of brain parenchymal fraction in multiple sclerosis. AJNR Am J Neuroradiol 2013;34:498–504 10.3174/ajnr.A3262 [DOI] [PMC free article] [PubMed] [Google Scholar]