Abstract
BACKGROUND AND PURPOSE:
A thorough knowledge of fetal growth and development is key to understanding both the normal and abnormal fetal MR imaging findings. We investigated the size and signal intensity of the normal pituitary gland and the intrasphenoidal ossification around the Rathke pouch in formalin-fixed fetuses on MR imaging.
MATERIALS AND METHODS:
Thirty-two fetuses with undamaged brains were included in this study (mean age, 19.93 weeks; age range, 12–31 weeks). Visual inspection of the pituitary and ossification around the Rathke pouch in the sphenoid bone or the postsphenoid ossification was conducted. The extent of pituitary and postsphenoid ossification, pituitary/pons signal ratio, and postsphenoidal ossification/sphenoid bone signal ratio was compared according to gestational age.
RESULTS:
The pituitary gland was identified as a hyperintense intrasellar structure in all cases, and postsphenoid ossification was identified as an intrasphenoidal hyperintense area in 27 of the 32 cases (84%). The mean pituitary/pons signal ratio was 1.13 ± 0.18 and correlated weakly with gestational age (R2 = 0.243), while the mean postsphenoid ossification/sphenoid bone signal ratio was 2.14 ± 0.56 and did not show any increase with gestational age (R2 = 0.05). No apparent change in the size of pituitary hyperintensity was seen with gestational age (R2 = 0.001). Postsphenoid ossification showed an increase in size with gestational age (R2 = 0.307).
CONCLUSIONS:
The fetal pituitary gland was hyperintense on T1-weighted images and the pituitary/pons ratio and extent of postsphenoid ossification correlated weakly with gestational age.
The pituitary gland of fetuses and neonates is hyperintense on T1-weighted images, with no distinct signal differences between the anterior and posterior lobes, thus differing it from the adult pituitary gland.1 The pituitary gland plays an essential role in the maintenance of homeostasis, metabolism, reproduction, growth, and lactation and comprises 2 different parts in terms of function and embryologic origin: the adenohypophysis and the neurohypophysis. During embryologic development, the adenohypophysis is formed by the Rathke pouch, which is derived from oral ectoderm from the roof of the stomodeum. Conversely, the neurohypophysis is derived from neural ectoderm. The ventral diencephalon extends downward, forming the infundibular process, which later differentiates into the neurohypophysis.2–5
The Rathke pouch is supposed to elongate, forming the adenohypophyseal stalk and connecting to the stomodeum through a cleft surrounded by the ossification centers of the medial hypophyseal cartilages. Several disagreements remain regarding the development of the pituitary gland, such as whether remnant pituitary tissue exists at the pharynx in adulthood6,7 or at the craniopharyngeal canal.8 The postsphenoid contains 2 medial and 2 lateral ossification centers, and the medial centers usually fuse to form a single ossification center,9 but normal variations in timing are speculated to exist in terms of complete fusion of the ossification centers.10–12 The adenohypophyseal stalk would normally be obliterated later and fully separated from the stomodeum by the development and ossification of the postsphenoid skull base cartilages. Defects in this fusion will lead to nonobliteration of the adenohypophyseal stalk connecting the Rathke pouch to the stomodeum, creating a patent canal connecting the sella turcica and pharynx, known as the craniopharyngeal canal.13–15 A patent craniopharyngeal canal with a small diameter can be observed in healthy patients.8 We will refer to the ossification around the Rathke pouch as “postsphenoid ossification” for simplicity in this study.6,16
Fetal MR imaging offers a useful tool for assessing congenital anomalies in fetuses.17 Recent advances in MR imaging, such as the development of much faster imaging sequences, have increased the use of fetal MR imaging applications as complementary studies to ultrasonography, particularly for congenital anomalies of the fetal brain. Fetal MR imaging before 18 weeks' gestation is limited by the small size of the fetus and the higher frequency of fetal motion, in addition, some congenital anomalies may not have formed yet. Fetal MR imaging has been reported to be most beneficial in the assessment of central nervous system anomalies for which interventions can be performed, such as neural tube defects.18–20 Congenital hypopituitarism due to either a pituitary developmental abnormality with or without additional hypothalamic and forebrain structural deformities is associated with genetic abnormalities in transcription factors and signaling molecules; therefore, visualization of the fetal pituitary is important for management of hypopituitarism.21 Interpreting images from fetal pituitary MR imaging can be challenging due to the limited training opportunities.19,22 Fetal MR imaging also involves challenges such as positioning the pregnant mother in the scanner and the lack of suitable coils for pregnant women. Knowledge of normal findings for fetal pituitary, sellar, and parasellar structures is particularly important in the diagnosis of craniopharyngeal canal anomalies, but fetal MR imaging for early-stage pregnancy is currently challenging.
A thorough knowledge of fetal growth and development is key to understanding both normal and abnormal fetal MR imaging findings. The purpose of this study was to investigate the size and signal intensity of the normal pituitary gland and postsphenoid ossification for formalin-fixed fetuses on MR imaging.
Materials and Methods
Kyoto Collection
This study was approved by the local institutional review board and written informed consent was waived. About 44,000 aborted fetuses are collected and stored at the Congenital Anomaly Research Center of Kyoto University; in most cases, pregnancy was terminated for socioeconomic reasons, under the Maternity Protection Law of Japan.23 Seventy-six induced aborted fetuses (mean age, 21.32 weeks; age range, 12–40 weeks) were randomly chosen for this study, from which the 32 fetuses (mean age, 19.93 weeks; age range, 12–31 weeks) with undamaged brains were included in the final analysis. None of the cases included in this study showed any apparent intracranial cephaloceles or tumors.
MR Imaging Parameters
All scans were conducted with a 1.5T MR imaging system (Excelart Vantage, powered by Atlas; Toshiba Medical Systems, Tokyo, Japan) with knee or head coils. After obtaining localizers, a 3D gradient-echo sequence was used for T1-weighted images with the following parameters: TR, 30 ms; TE, 7 ms; flip angle, 50°; FOV, 180 × 135 mm; matrix, 256 × 192; 120 sections with a thickness of 0.70 mm, resulting in isotropic resolution of 0.70 mm; number of averages, 2; bandwidth, 122; total scan time, 25 minutes 21 seconds.
Visual Assessment
The fetal intrasellar pituitary gland was visually evaluated to compare signal intensities of the pituitary and pons and to determine whether the anterior and posterior lobes of the pituitary could be recognized and differentiated.
Postsphenoid ossification was visually evaluated to determine whether it could be recognized. If recognized, the shape of postsphenoid ossification was classified as condensed hyperintensity, diffusely spreading hyperintensity, or rim-shaped hyperintensity.
Visual inspections were performed separately by 2 neuroradiologists (Y.F., with 17 years of experience, T.M.M., with 5 years of experience). They reached a consensus in any case with a discrepancy.
ROI Analysis
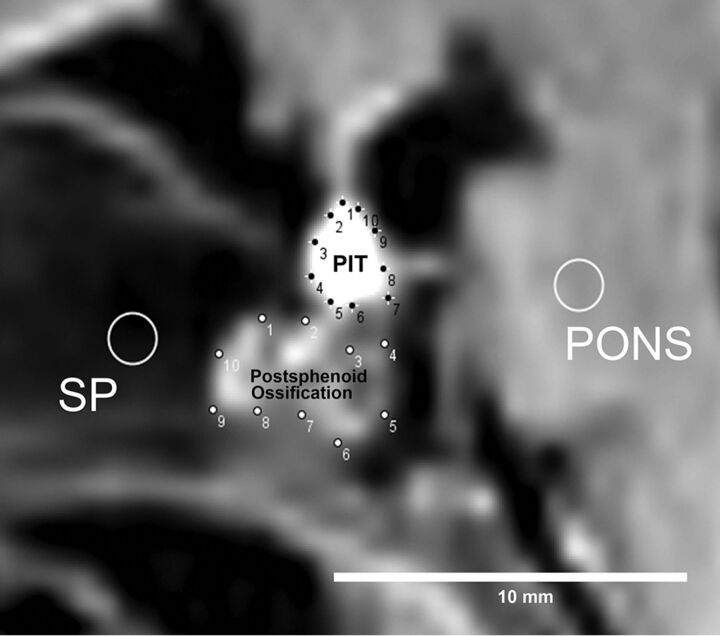
ROIs were defined by 2 neuroradiologists (Y.F., 17 years of experience, T.M.M., 5 years of experience). ROIs were placed for the pituitary, pons, postsphenoid ossification, and sphenoid bone (SP) on sagittal T1WI. We used the convex hull function of ImageJ software (National Institutes of Health, Bethesda, Maryland) for pituitary gland and postsphenoid ossification, by manually choosing 10 points on the contour of the pituitary gland and postsphenoid ossification. A fixed, round ROI (diameter, 5 pixels) was used for the SP and pons (Fig 1). The ROI of the SP was placed so as not to include hyperintensity, which corresponds to ossification in the presphenoid. The area and mean signal intensity of each ROI were calculated. The pituitary/pons ratio and postsphenoid ossification/SP signal intensity ratios were calculated. The averages of each ROI by 2 observers were adopted for further analysis.
Fig 1.
Method of ROI analysis. First, 10 points are manually placed on the contour of both the pituitary (PIT) and postsphenoid ossification, and a round ROI (diameter, 5 pixels) is drawn on both the pons and sphenoid bone. With the convex hull function of ImageJ software, these 10 points are automatically connected to provide an ROI defining the contours of both the pituitary gland and postsphenoid ossification.
Statistical Analysis
Interobserver agreement (κ coefficient values) between the 2 observers was calculated for both signal intensity ratios and area. Linear regression analysis was conducted to reveal any changes in the pituitary/pons or postsphenoid ossification/SP signal ratios and pituitary or postsphenoid ossification area with gestational age. R2 values were calculated.
Results
Damage to the brain associated with the abortion procedure and formalin-fixation process was found in 44 cases, which were then excluded from analysis. The 32 cases with undamaged brains were included in the final analysis. No CNS abnormalities were apparent in these fetal brains.
Pituitary Gland
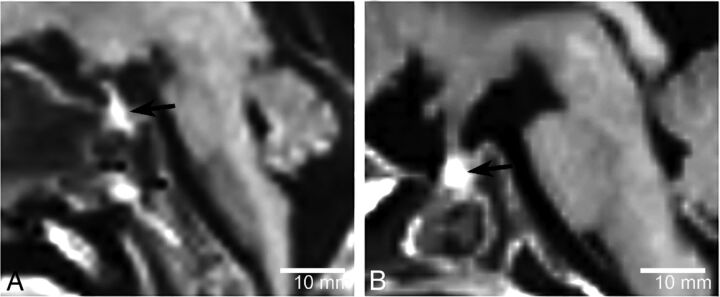
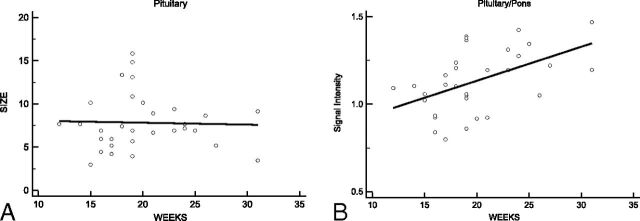
All fetuses showed a characteristic appearance of a homogeneous hyperintense pituitary gland compared with the pons, and no cases showed any distinction between the anterior and posterior lobes of the pituitary gland on visual inspection (Fig 2). No change in size of the pituitary hyperintensity was apparent with gestational age (R2 = 0.001, Fig 3A).
Fig 2.
Sagittal T1WI of a 12-week-old fetus (A) and a 31-week-old fetus (B). The fetal pituitary gland shows homogeneous hyperintensity on T1WI (arrows). No clear distinction between the anterior and posterior lobes of the pituitary gland is visualized.
Fig 3.
Area of the pituitary hyperintensity as a function of gestational age in weeks (A). No apparent change in the hyperintense area is seen with increasing gestational age in weeks (R2 = 0.001). The pituitary/pons signal ratios as a function of gestational age in weeks are shown (B). The pituitary/pons signal ratio shows a weak increase with gestational age (R2 = 0.243).
The mean pituitary/pons signal ratio was 1.13 ± 0.18, and a slight increase with gestational age was identified (R2 = 0.243; Fig 3B). Interobserver agreement was substantial (κ = 0.67) for the pituitary/pons signal ratio.
Postsphenoid Ossification
Postsphenoid ossification was identified as an intrasphenoidal hyperintensity on T1WI in 27 of the 32 cases (84%). The shape of the postsphenoid ossification was recognized as condensed hyperintensity in 15 cases (55%), diffusely spread hyperintensity in 4 (15%), and rim-shaped hyperintensity in 8 (30%) (Fig 4).
Fig 4.
Postsphenoid ossification was identified as an intrasphenoidal hyperintense area on T1WI in 27 of the 32 cases (84%). Representative images are shown of different shapes of postsphenoid ossification hyperintensity on sagittal T1WI: a 19-week-old fetus showing condensed hyperintensity (A), a 19-week-old fetus showing diffusely spreading hyperintensity (B), and a 31-week-old fetus showing rim-shaped hyperintensity (C). The most common shape of postsphenoid ossification hyperintensity was condensed hyperintensity, appearing in 15 of 27 cases (55%).
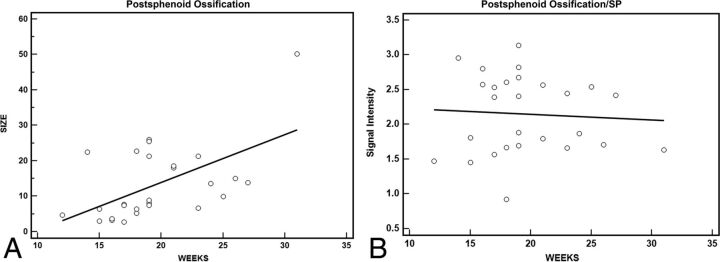
Postsphenoid ossification showed an increase in size with increasing gestational age (R2 = 0.307, Fig 5A).
Fig 5.
Postsphenoid ossification hyperintensity area as a function of gestational age in weeks (A). A positive correlation is seen between the postsphenoid ossification hyperintensity area and gestational age in weeks (R2 = 0.307). The postsphenoid ossification/SP signal ratio as a function of gestational age in weeks (B). The postsphenoid ossification/SP signal ratio does not show any increase with gestational age (R2 = 0.05).
Th mean postsphenoid ossification/SP signal ratio was 2.14 ± 0.56 and did not show any increase with gestational age (R2 = 0.05, Fig 5B). Interobserver agreement was moderate (κ = 0.59) for postsphenoid ossification/SP signal ratio.
Discussion
The pituitary gland showed a homogeneous hyperintense signal on MR imaging in all fetuses, and no distinction between adenohypophysis and neurohypophysis was evident in this study. Although previous reports have shown pituitary hyperintensity in neonates and fetus older than 21 weeks,1,20 hyperintensity of the pituitary gland was also demonstrated in fetal specimens younger than 21 weeks of gestation in this study. Histologic changes within the anterior pituitary lobe with increasing amounts of endoplasmic reticulum, high-level synthesis of pituitary protein, and the higher fraction of bound water molecules due to hormonal secretion are thought to cause hyperintensity of the anterior lobe on T1WI.20 Such hormonal hyperactivity was also observed in women during pregnancy and postpartum as anterior pituitary hyperintensity.24,25 A weak correlation between the pituitary/pons signal ratio and gestational weeks was shown in this study; these findings were contradictory to those in previous studies targeting prematurely born neonates.1,26 The population of fetuses in this study was approximately 11–12 gestational weeks, younger than the ages in previous reports; this difference may be the cause of the discrepancy in the relationship between the pituitary signal and gestational weeks. The pituitary gland did not show any increase in size with gestational age in our study population, probably because an increase in pituitary size may not be evident during a period of weeks or the pituitary may remain nonfunctional, with the fetus relying solely on maternal hormones.23
Postsphenoid ossification was visualized as a hyperintense intrasphenoidal structure just inferior to the sellar floor. Postsphenoid ossification showed different shapes and increasing size with gestational age and would be expected to progress to mature bone tissue. Postsphenoid ossification showed a hyperintense intrasphenoidal signal on T1WI in 84% of fetuses in this study along the route of the adenohypophyseal stalk of the postsphenoid. The medial ossification centers of the postsphenoid, which later form the sella turcica, usually unite to form a single ossification center, but such unity may not happen as soon as the individual centers form, which may, in turn, cause the variable timing in the disappearance of the craniopharyngeal canal, not restricted to a specific gestational age.10,14,16,27
Imaging findings for postsphenoid ossification have been discussed in the literature only as hyperattenuation on CT and low intensity on T2-weighted images,16 and the characteristic appearance of postsphenoid ossification on T1WI as shown in this study has not been previously reported, to our knowledge, due to a lack of fetal MR imaging data on intrasphenoid lesions. Calcification usually appears as a low signal on both T1WI and T2WI, but calcium salts interact with water protons in the process of ossification, in turn slowing the precession to near the Larmor frequency and potentially leading to short T1 relaxation times.28,29 Knowledge of the origins of such intrasphenoid hyperintensities and the various shapes (condensed, diffusely spreading, and rim-shaped) (Fig 4) may be beneficial for neuroradiologists in understanding the developmental process and avoiding a misdiagnosis of intrasphenoid tumor. Variations in the appearance of postsphenoid ossification may be attributable to the different physical shapes at different steps of the ossification process and the amount of water protons surrounding the calcium salts, but further study is required.
Several limitations to this study must be considered when interpreting these results. All fetuses included in our study were aborted fetuses that had been fixed in formaldehyde. Formaldehyde fixation has been reported to modify T1 and T2 relaxation times of tissues through alteration of tissue microstructures. Such effects mean that our results might differ from those of in vivo fetal MR imaging, but several MR imaging studies have covered formalin-fixed fetal specimens,16,30 and we have demonstrated the similar appearance of fetal pituitary hyperintensity reported from in vivo studies.1,31 Further in vivo fetal MR imaging studies may be expected for validation of our results. Another limitation was the small number of cases included in this study, and a larger number of cases might have more precisely clarified the relationship between gestational age and the size of the pituitary gland or postsphenoid ossification. Because negative correlations between pituitary hyperintensity and postnatal time were revealed in 88 neonates1 and 121 infants,26 more cases may be required for better evaluation of correlations in this study. In the future, more detailed volumetric analysis of the fetal pituitary gland and postsphenoid ossification with a larger in vivo study population and radiologic-histologic correlations will further enhance the relevance of the present results.
Conclusions
This study demonstrated that the fetal pituitary gland was hyperintense on T1WI, and both the pituitary/pons ratio and the size of postsphenoid ossification correlated weakly with gestational age.
ABBREVIATION:
- SP
sphenoid bone
Footnotes
Disclosures: Yasutaka Fushimi—RELATED: Grant: This work was supported by Japan Society for the Promotion of Science KAKENHI grant Nos. 25461815, 15K08134, 15H01121, 26220004, 24119002; and R&D of Molecular Imaging Equipment for Malignant Tumor Therapy Support, supported by New Energy and Industrial Technology Development Organization, Japan.* Tsutomu Okada—RELATED: Grant: Japan Society for the Promotion of Science KAKENHI grant No. 26461824. *Money paid to the institution.
This work was supported by Japan Society for the Promotion of Science KAKENHI grant Nos. 25461815, 15K08134, 15H01121, 26220004, 24119002; and R&D of Molecular Imaging Equipment for Malignant Tumor Therapy Support, supported by the New Energy and Industrial Technology Development Organization, Japan.
References
- 1. Kitamura E, Miki Y, Kawai M, et al. T1 signal intensity and height of the anterior pituitary in neonates: correlation with postnatal time. AJNR Am J Neuroradiol 2008;29:1257–60 10.3174/ajnr.A1094 [DOI] [PMC free article] [PubMed] [Google Scholar]
- 2. Dubois PM, Elamraoui A. Embryology of the pituitary gland. Trends Endocrinol Metab 1995;6:1–7 10.1016/1043-2760(94)00090-Q [DOI] [PubMed] [Google Scholar]
- 3. Dorton AM. The pituitary gland: embryology, physiology, and pathophysiology. Neonatal Netw 2000;19:9–17 [DOI] [PubMed] [Google Scholar]
- 4. Bancalari RE, Gregory LC, McCabe MJ, et al. Pituitary gland development: an update. Endocr Dev 2012;23:1–15 10.1159/000341733 [DOI] [PubMed] [Google Scholar]
- 5. Ikeda H, Suzuki J, Sasano N, et al. The development and morphogenesis of the human pituitary gland. Anat Embryol (Berl) 1988;178:327–36 10.1007/BF00698663 [DOI] [PubMed] [Google Scholar]
- 6. Hori A, Schmidt D, Rickels E. Pharyngeal pituitary: development, malformation, and tumorigenesis. Acta Neuropathol 1999;98:262–72 10.1007/s004010051079 [DOI] [PubMed] [Google Scholar]
- 7. Pugnale N, Waridel F, Bouzourène H, et al. Pharyngeal pituitary non-functioning adenoma with normal intra-sellar gland: massive tumor shrinkage on octreotide therapy. Eur J Endocrinol 2003;148:357–64 10.1530/eje.0.1480357 [DOI] [PubMed] [Google Scholar]
- 8. Abele TA, Salzman KL, Harnsberger HR, et al. Craniopharyngeal canal and its spectrum of pathology. AJNR Am J Neuroradiol 2014;35:772–77 10.3174/ajnr.A3745 [DOI] [PMC free article] [PubMed] [Google Scholar]
- 9. Madeline LA, Elster AD. Suture closure in the human chondrocranium: CT assessment. Radiology 1995;196:747–56 10.1148/radiology.196.3.7644639 [DOI] [PubMed] [Google Scholar]
- 10. Kjaer I. Radiographic determination of prenatal basicranial ossification. J Craniofac Genet Dev Biol 1990;10:113–23 [PubMed] [Google Scholar]
- 11. Ricciardelli EJ. Embryology and anatomy of the cranial base. Clin Plast Surg 1995;22:361–72 [PubMed] [Google Scholar]
- 12. Zhang Q, Wang H, Udagawa J, et al. Morphological and morphometric study on sphenoid and basioccipital ossification in normal human fetuses. Congenit Anom (Kyoto) 2011;51:138–48 10.1111/j.1741-4520.2011.00322.x [DOI] [PubMed] [Google Scholar]
- 13. Arey LB. The craniopharyngeal canal reviewed and reinterpreted. Anat Rec 1950;106:1–16 10.1002/ar.1091060102 [DOI] [PubMed] [Google Scholar]
- 14. Cho KH, Chang H, Yamamoto M, et al. Rathke's pouch remnant and its regression process in the prenatal period. Childs Nerv Syst 2013;29:761–69 10.1007/s00381-012-2015-2 [DOI] [PubMed] [Google Scholar]
- 15. Kjaer I, Russell BG. The craniopharyngeal canal indicating the presence of pharyngeal adenopituitary tissue. Eur J Radiol 1995;20:212–14 10.1016/0720-048X(95)00642-4 [DOI] [PubMed] [Google Scholar]
- 16. Nemzek WR, Brodie HA, Hecht ST, et al. MR, CT, and plain film imaging of the developing skull base in fetal specimens. AJNR Am J Neuroradiol 2000;21:1699–706 [PMC free article] [PubMed] [Google Scholar]
- 17. Glenn OA, Barkovich J. Magnetic resonance imaging of the fetal brain and spine: an increasingly important tool in prenatal diagnosis: part 2. AJNR Am J Neuroradiol 2006;27:1807–14 [PMC free article] [PubMed] [Google Scholar]
- 18. Garel C. Imaging the fetus: when does MRI really help? Pediatr Radiol 2008;38(suppl 3):S467–70 [DOI] [PubMed] [Google Scholar]
- 19. Levine D. Timing of MRI in pregnancy, repeat exams, access, and physician qualifications. Semin Perinatol 2013;37:340–44 10.1053/j.semperi.2013.06.011 [DOI] [PubMed] [Google Scholar]
- 20. Schmook MT, Brugger PC, Weber M, et al. Forebrain development in fetal MRI: evaluation of anatomical landmarks before gestational week 27. Neuroradiology 2010;52:495–504 10.1007/s00234-010-0701-x [DOI] [PubMed] [Google Scholar]
- 21. Mehta A, Hindmarsh PC, Mehta H, et al. Congenital hypopituitarism: clinical, molecular and neuroradiological correlates. Clin Endocrinol (Oxf) 2009;71:376–82 10.1111/j.1365-2265.2009.03572.x [DOI] [PubMed] [Google Scholar]
- 22. Al-Mukhtar A, Kasprian G, Schmook MT, et al. Diagnostic pitfalls in fetal brain MRI. Semin Perinatol 2009;33:251–58 10.1053/j.semperi.2009.04.008 [DOI] [PubMed] [Google Scholar]
- 23. Shiota K. Development and intrauterine fate of normal and abnormal human conceptuses. Congenit Anom 1991;31:67–80 10.1111/j.1741-4520.1991.tb00360.x [DOI] [Google Scholar]
- 24. Elster AD, Sanders TG, Vines FS, et al. Size and shape of the pituitary gland during pregnancy and post partum: measurement with MR imaging. Radiology 1991;181:531–35 10.1148/radiology.181.2.1924800 [DOI] [PubMed] [Google Scholar]
- 25. Miki Y, Asato R, Okumura R, et al. Anterior pituitary gland in pregnancy: hyperintensity at MR. Radiology 1993;187:229–31 10.1148/radiology.187.1.8451418 [DOI] [PubMed] [Google Scholar]
- 26. Argyropoulou MI, Xydis V, Kiortsis DN, et al. Pituitary gland signal in pre-term infants during the first year of life: an MRI study. Neuroradiology 2004;46:1031–35 10.1007/s00234-004-1285-0 [DOI] [PubMed] [Google Scholar]
- 27. Sasaki H, Kodama G. Developmental studies on the postsphenoid of the human sphenoid bone. In: Bosma JF, ed. Symposium on the Development of the Basicranium. Bethesda: National Institutes of Health; 1976:177–91 [Google Scholar]
- 28. Elster AD, Burdette JH. Questions & Answers in Magnetic Resonance Imaging. St. Louis; Mosby; 2001 [Google Scholar]
- 29. Wehrli FW. Magnetic resonance of calcified tissues. J Magn Reson 2013;229:35–48 10.1016/j.jmr.2012.12.011 [DOI] [PMC free article] [PubMed] [Google Scholar]
- 30. Kinoshita Y, Okudera T, Tsuru E, et al. Volumetric analysis of the germinal matrix and lateral ventricles performed using MR images of postmortem fetuses. AJNR Am J Neuroradiol 2001;22:382–88 [PMC free article] [PubMed] [Google Scholar]
- 31. Caruso RD, Rosenbaum AE, Sherry RG, et al. Pituitary gland: variable signal intensities on MRI—a pictorial essay. Clin Imaging 1998;22:327–32 10.1016/S0899-7071(98)00024-2 [DOI] [PubMed] [Google Scholar]


