Abstract
BACKGROUND AND PURPOSE:
Quantitative MR imaging allows segmentation of different tissue types and automatic calculation of intracranial volume, CSF volume, and brain parenchymal fraction. Brain parenchymal fraction is calculated as (intracranial volume − CSF volume) / intracranial volume. The purpose of this study was to evaluate whether the automatic calculation of intracranial CSF volume or brain parenchymal fraction could be used as an objective method to monitor volume changes in the ventricles.
MATERIALS AND METHODS:
A lumbar puncture with drainage of 40 mL of CSF was performed in 23 patients under evaluation for idiopathic normal pressure hydrocephalus. Quantitative MR imaging was performed twice within 1 hour before the lumbar puncture and was repeated 30 minutes, 4 hours, and 24 hours afterward. For each time point, the volume of the lateral ventricles was manually segmented and total intracranial CSF volume and brain parenchymal fraction were automatically calculated by using Synthetic MR postprocessing.
RESULTS:
At 30 minutes after the lumbar puncture, the volume of the lateral ventricles decreased by 5.6 ± 1.9 mL (P < .0001) and the total intracranial CSF volume decreased by 11.3 ± 5.6 mL (P < .001), while brain parenchymal fraction increased by 0.78% ± 0.41% (P < .001). Differences were significant for manual segmentation and brain parenchymal fraction even at 4 hours and 24 hours after the lumbar tap. There was a significant association using a linear mixed model between change in manually segmented ventricular volume and change in brain parenchymal fraction and total CSF volume, (P < .0001).
CONCLUSIONS:
Brain parenchymal fraction is provided rapidly and fully automatically with Synthetic MRI and can be used to monitor ventricular volume changes. The method may be useful for objective clinical monitoring of hydrocephalus.
Standard MR imaging used in clinical practice is mainly qualitative, and morphologic evaluations are based on visual assessment. Quantitative MR imaging has the potential advantage of providing objective data on treatment effects and longitudinal follow-up data in neurologic conditions.1
One such neurologic condition is idiopathic normal pressure hydrocephalus (iNPH), with symptoms of gait disturbance, cognitive impairment, and urinary incontinence.2,3 The brain morphology in iNPH is characterized by large ventricles, enlarged Sylvian fissures, tight convexity sulci, and a small callosal angle.4–6 The symptoms can be relieved by removal of CSF in patients with iNPH, either permanently by shunt implantation or temporarily by a lumbar puncture as a prognostic test (CSF tap test).7 Radiologic evaluation of the size of the ventricles and sulci is also important in patients with other types of hydrocephalus (eg, secondary to a subarachnoid hemorrhage). However, with standard imaging, a reduction in ventricle size postshunting in patients with iNPH is difficult to detect with traditional morphologic measures such as the Evans index8 or by visual inspection, even if the patient is clinically improved.9 An objective, more sensitive quantitative measure of the CSF spaces, replacing the present visual estimation, would be advantageous, especially for longitudinal evaluation of treatment effects. Such a quantitative method must be rapid and easy to perform to be implemented in clinical practice.
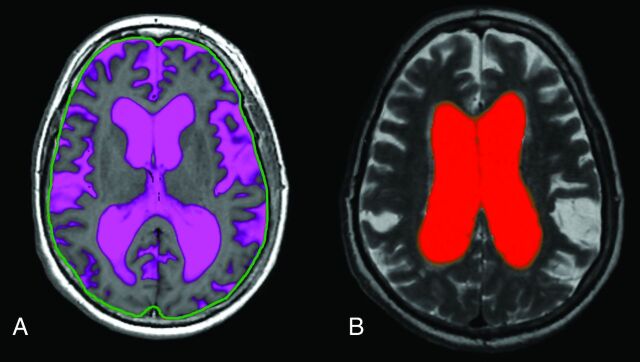
The MR imaging sequence QRAPMASTER10 provides a rapid simultaneous quantification of longitudinal relaxation time (T1), the transverse relaxation time (T2), and proton density. The dedicated postprocessing software SyntheticMR (SyMRI; SyntheticMR, Linköping, Sweden) uses combinations of T1, T2, and proton density values to segment intracranial volume (ICV), GM, WM, and CSF. Summation of the tissues over the complete imaging volume automatically produces GM, WM, and CSF volumes (Fig 1A). SyMRI can be implemented in any PACS.
Fig 1.
A, Fully automatic calculation of total intracranial CSF by using SyMRI. The green line is an intracranial mask used to automatically calculate the intracranial volume (the line was originally red but was colored green in external graphics-editing software to increase clarity). B, Manual segmentation of the lateral ventricles by using SyMRI.
We reported in a previous study of patients with iNPH, by using a manual approach that is available in the same software, that the volume of the lateral ventricles decreases at 30 minutes and 4 hours following a lumbar puncture with removal of 40 mL of CSF (Fig 1B).11 The drawback with the manual method is that it requires detailed anatomic knowledge and is rather time-consuming.
Potential alternatives to manual segmentation of the ventricular volume are calculation of total intracranial CSF volume or the brain parenchymal fraction (BPF). BPF is calculated as (ICV − CSF volume) / ICV. The BPF value is regarded as a robust measure for monitoring the relative brain and CSF volumes, for example, in patients with multiple sclerosis.12 Normalization with ICV has an advantage because it eliminates the effect of head size differences among patients and limits the impact of incomplete coverage of the imaging volume. Potentially, the use of BPF reduces the impact of signal voids due to a shunt because these artifacts would decrease both the CSF and ICV volumes, leaving the BPF relatively unaffected. Calculation of CSF volume and BPF is fully automated in SyMRI, with a postprocessing time of <2 minutes.13
Our aim was to evaluate whether the automatic calculation of intracranial CSF volume or BPF could be used as an objective method to monitor volume changes in the lateral ventricles.
Materials and Methods
Patients
Twenty-six patients (15 men, 11 women) under evaluation for iNPH were consecutively included in the study. The median age was 73.5 years (range, 65–81 years). On the basis of the international iNPH guidelines,14 17 patients were classified as having probable iNPH; 6, possible iNPH; and 3, unlikely iNPH. The inclusion process and demographics have been described in detail elsewhere.11
One patient classified as having unlikely iNPH did not fit into the MR imaging head coil and was excluded. Because of technical problems, quantitative MR imaging was not acquired in 2 patients, who were excluded. The remaining 23 patients were included in the statistical analysis. In 2 of the included patients, quantitative MR imaging data were missing for 1 investigation time point. The study was approved by the local ethics committee in Uppsala, and the site of the study was Uppsala University Hospital.
Time Scheme
The first MR imaging scan (MR imaging 1) was performed between 8 and 10 am. A second MR imaging (MR imaging 2) was performed 60 minutes after the first examination to assess the repeatability of the method. Between MR imaging 1 and MR imaging 2, the patients rested in the supine position in a quiet, isolated room next to the scanner. Immediately after MR imaging 2, a lumbar puncture was performed by using a 20-gauge needle, with patients in the lateral recumbent position, and a mean of 40 ± 2 mL of CSF was removed. MR imaging 3 was performed 30 minutes after the lumbar puncture was completed; MR imaging 4 and MR imaging 5 were performed 4 and 24 hours after the CSF removal, respectively.
Imaging Sequence
MR imaging was performed in a 3T Achieva scanner (Philips Healthcare, Best, the Netherlands).
The QRAPMASTER sequence was acquired with an FOV of 220 mm with an in-plane resolution of 1 mm and 30 sections of 4 mm. The sequence acquired signal intensities at 4 different saturation delay times (140, 540, 1870, and 3870 ms at a TR of 4000 ms) and 5 different TEs (17.5, 35.0, 52.5, 70.0, and 87.5 ms), resulting in a matrix of 5 × 4 = 20 images with different T1 and T2 relaxation effects. The scan time for QRAPMASTER is less than 6 minutes.
Image Postprocessing
The image data were processed to calculate the T1 and T2 relaxation times and proton density by using SyMRI 7.0 (SyntheticMR). On the basis of these maps, the same software automatically provided the ICV and estimated the partial volume content of WM, GM, and CSF according to tissue definitions in combination with a partial volume model.15
Statistics
Baseline values were calculated by averaging the results of MR imaging 1 and MR imaging 2. The difference values for time points 1–5 were calculated by subtracting all values from the baseline values. A multilevel linear mixed model was used to estimate the association between the difference in manually segmented ventricular volume and the difference in automatically estimated total CSF volume as well as the difference in automatically estimated BPF. The method was adjusted for repeated measurements in the same individuals by using a compound symmetry covariance structure. The slope and intercept with 95% confidence intervals were calculated. Linear regression was used to calculate the goodness of fit. Comparisons of differences in the volume of the lateral ventricles, total CSF volume, and BPF among subgroups were tested with the Mann-Whitney U test and the Kruskal Wallis test.
Results
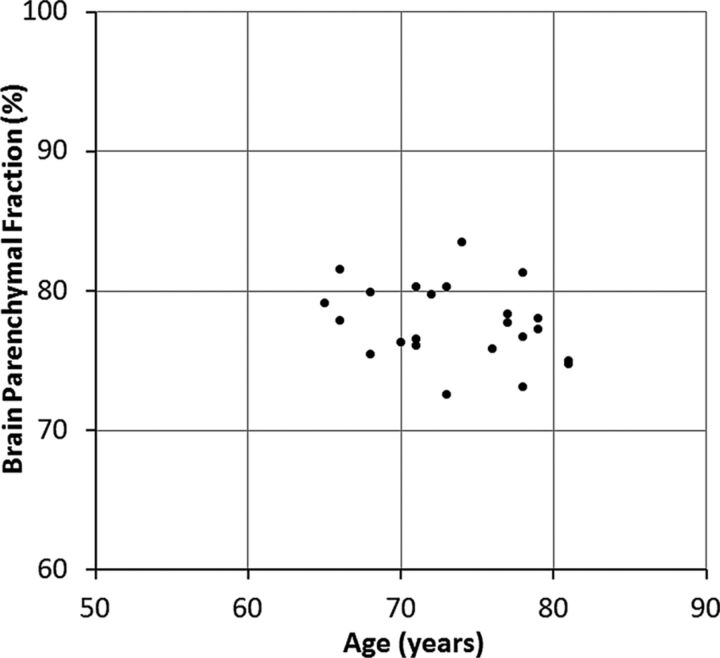
At baseline, the manually segmented lateral ventricular volume of the patients was 129 ± 22 mL. The automatically calculated mean ICV was 1428 ± 100 mL, the mean automatic total CSF volume was 319 ± 49 mL, and the mean BPF was 77.7% ± 2.7%. The mean difference between MR imaging 1 and MR imaging 2 was 0.2 ± 2.1 mL for manual ventricular volume, 1.1 ± 7.8 mL for automatic CSF volume, and 0.1% ± 0.4% for BPF, corresponding to 0.14% ± 1.63%, 0.34% ± 2.44%, and 0.14% ± 0.50% of their mean values, respectively. The distribution of baseline BPF as a function of age is shown in Fig 2.
Fig 2.
Baseline brain parenchymal fraction for all subjects as a function of age.
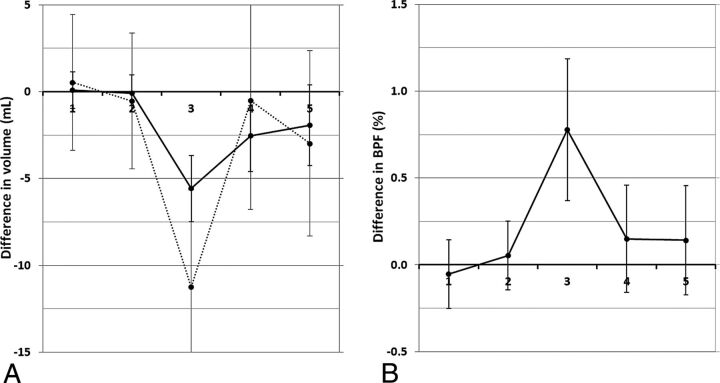
At 30 minutes after the lumbar puncture, the manually segmented lateral ventricular volume decreased by an average of 5.6 ± 1.9 mL (P < .0001; coefficient of variation [CoV] = 0.34). Simultaneously, a decrease in the automatically calculated total CSF volume of 11.3 ± 5.6 mL was observed (P < .001; CoV = 0.50). At 4 hours after the lumbar puncture, the manual ventricular volume difference was 2.5 ± 2.1 mL (P < .001) and the automatic CSF volume difference was 0.5 ± 6.3 mL (P = .7). At 24 hours after the CSF tap test, the difference was 1.9 ± 2.3 mL (P < .001) and 3.0 ± 5.3 mL (P = .02), respectively (Fig 3A).
Fig 3.
A, The mean difference in manually segmented lateral ventricular volume with respect to the baseline value (solid line) and the mean difference in automatically calculated total CSF volume with respect to the baseline value (dotted line) plotted at the 5 different time points. B, The mean difference of brain parenchymal fraction with respect to the baseline value at the same time points. Time point 1 and 2 are baseline investigations and the lumbar puncture with CSF removal was performed right after time point 2. The error bars indicate 1 SD.
The corresponding difference in BPF after the lumbar puncture is illustrated in Fig 3B. At 30 minutes after the CSF tap test, the BPF increased by 0.78% ± 0.41% with respect to baseline (P < .001; CoV = 0.53). At 4 hours after the lumbar puncture, the difference had decreased to 0.15% ± 0.31% (P = .03), and at 24 hours after the lumbar puncture, the difference was 0.14% ± 0.32% (P = .05).
There was no difference in changes of volume of the lateral ventricles, total CSF volume, or BPF among the diagnostic groups possible, probable, or unlikely iNPH, and there was no difference between patients with or without clinical improvement after the CSF removal.
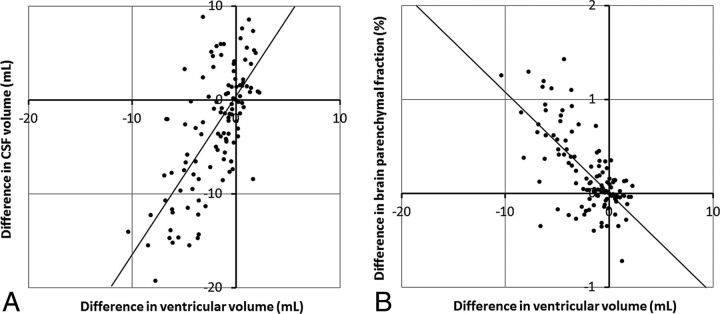
The correlation between manual ventricular volume and automatic CSF volume is shown in Fig 4A. A linear mixed model showed a slope of 1.67 (intercept 0.37) (95% confidence interval, 1.35–2.00; P < .0001). The correlation between manual ventricular volume and BPF is plotted in Fig 4B. A linear mixed model showed a slope of −0.104 (intercept 0.008) (95% confidence interval, −0.125 to −0.082; P < .0001). The goodness of fit was identical in both cases (R2 = 0.45).
Fig 4.
A, Correlation plot between the difference in ventricular volume and the difference in total CSF volume for all subjects at all time points. The line indicates a slope of 1.67 and intercept of 0.37. B, Correlation plot between the difference in ventricular volume and the difference in brain parenchymal fraction for all subjects at all time points. The line indicates a slope of −0.104 and an intercept of 0.008.
Discussion
In this study, quantitative MR imaging was used to calculate and monitor changes in intracranial CSF after a lumbar puncture in patients with iNPH. Fully automatic volumetric functions and manual segmentation of the lateral ventricle volume were evaluated and compared. As methods for measuring changes in intracranial CSF, there was a significant association between the fully automatic calculation of intracranial CSF volume and BPF with manual segmentation of the lateral ventricular volume.
Both the manual and the automatic methods showed a significant change after the lumbar puncture. Manual segmentation was less variable than the fully automatic method, with lower CoV and P values, but it was more time-consuming and therefore not as advantageous in clinical practice.
The total intracranial CSF volume can be automatically calculated by using SyMRI. However, the volume differences after the lumbar puncture by using automatic CSF volume were not significantly changed at all time points. On the other hand, BPF increased significantly at all time points after the CSF removal and the repeatability was better for BPF than total intracranial CSF volume. In addition, the repeatability was better for BPF.
The BPF difference between MR imaging 1 and MR imaging 2 had an SD of 0.4%. With an ICV of 1428 mL, this corresponded to 5.6 mL, which was smaller than the difference for automatic CSF volume (7.8 mL).
There is no widely accepted reference method for calculation of BPF. Manual segmentation of the lateral ventricles performed in a previous study was used as a control method in the present study. In that study, segmentation was performed on every section that included the lateral ventricles.11
A risk associated with the use of total automatic CSF volume is incomplete brain coverage due to suboptimal planning or time limitations for special sequences. In other cases, a region of the brain may not be visualized, for example, due to shunt-related metal artifacts with signal loss. This potential error should be reduced by the use of BPF. An additional advantage of using BPF is that it largely removes differences in head size among subjects, potentially allowing the setting of a range for normal and pathologic values. This could be useful for the evaluation of brain atrophy versus normal aging. Accuracy and repeatability of the automatic BPF measurement have been reported to be high.13,16
Another risk of using the total volume of CSF is that the acquisition volume can vary slightly between different investigations. An acquisition volume is normally placed by technical personnel and therefore is user-dependent. If part of the total CSF was not even acquired, for example, with a patient with a large head, it will be absent for the analysis, mimicking a loss of total CSF. The BPF, on the other hand, is a ratio, which is presumably rather similar for every acquisition section. Therefore, a suboptimal placement of the acquisition volume is not expected to alter the BPF values. This may explain the higher CoV and variability at baseline of total CSF volume compared with BPF.
As a tool to monitor brain atrophy, BPF has been used mainly in studies of multiple sclerosis17 and dementia.18 However, it is a robust measure of parenchymal volume and can be applied to several diagnoses. The method could be useful for longitudinal evaluation of ventricular volume in all patients with hydrocephalus. It may, however, be difficult to apply in patients with brain tumors because the tumor volume changes with time, depending on disease progress or treatment effects, thereby affecting the BPF.
Other techniques, both manual and automatic, can be used to calculate BPF. Methods that provide good differentiation between brain parenchyma and CSF and reliable ICV measurement can be used, such as FreeSurfer (http://surfer.nmr.mgh.harvard.edu/). FreeSurfer and other quantitative MR imaging techniques have been tested in iNPH, mainly in research studies, but time-consuming postprocessing and the need for technical expertise limit the clinical usefulness of these methods. The advantage of SyMRI compared with FreeSurfer is that it provides BPF fully automatically within <2 minutes and the reliability is high.13 SyMRI can also be implemented in any PACS, which improves its clinical usefulness.
In patients with iNPH, the standard treatment is implantation of a ventriculoperitoneal shunt. Having a reliable noninvasive measure of changes in intracranial CSF volume after shunting would be a great aid to the clinician to assess the patency of a shunt. In MR imaging, large artifacts surround the shunt valve. Whether BPF is a reliable measure of CSF volume change after shunt surgery in patients with iNPH has not yet been investigated, to our knowledge, but is subject to future work. Some patients with congenital hydrocephalus are not treated with shunts when there are no clinical symptoms and no active progress in ventricular dilation. A sensitive quantitative method such as the one described in the present work could add important clinical value if an increase in CSF spaces is detected in time. Then the patient may be offered treatment before developing symptoms and irreversible injury to the brain has occurred. In a similar fashion, BPF could be used to follow the progress and eventual regress of ventriculomegaly after subarachnoid hemorrhage.
Limitations
SyMRI only provides 5-mm sections, and the in-plane resolution is slightly lower than that of standard 3T MR imaging. Slightly thicker sections will lead to partial volume effects, which may have an impact on BPF values. It has been reported, however, that the effect of image resolution on the brain segmentation results of SyMRI is very small.15 The sample studied was small, from a selected population with large ventricles. Therefore, it is not known whether the results could also be directly applied in a population with normal-sized ventricles. The automated method proposed in our study is also of more interest for use in patients with large ventricles (eg, for follow-up of progression or decrease of dilation of the ventricles of different etiologies).
Conclusions
SyMRI was used to compare fully automatic calculations of intracranial CSF volume and BPF with manual segmentation of lateral ventricular volume as methods to monitor intracranial CSF changes after lumbar puncture. Both automatic CSF volume and BPF correlated equally well with manual segmentation, but BPF was less variable. Because BPF is rapid, it could be an expedient alternative for use in detecting and monitoring changes in intracranial CSF volume in patients with hydrocephalus.
ABBREVIATIONS:
- BPF
brain parenchymal fraction
- CoV
coefficient of variation
- ICV
intracranial volume
- iNPH
idiopathic normal pressure hydrocephalus
- QRAPMASTER
quantification of relaxation times and proton attenuation by multiecho acquisition of a saturation-recovery using turbo spin-echo readout
- SyMRI
Synthetic MR
Footnotes
Disclosures: Johan Virhammar—UNRELATED: Grants/Grants Pending: Independent Swedish Foundation Selanders Stiftelse grant 2013, approximately US $11,700.* Marcel Warntjes—UNRELATED: Employment: SyntheticMR, Comments: I am employed part-time at SyntheticMR; Stock/Stock Options: I have stock in SyntheticMR. *Money paid to the institution.
References
- 1. Ma D, Gulani V, Seiberlich N, et al. Magnetic resonance fingerprinting. Nature 2013;495:187–92 10.1038/nature11971 [DOI] [PMC free article] [PubMed] [Google Scholar]
- 2. Adams RD, Fisher CM, Hakim S, et al. Symptomatic occult hydrocephalus with “normal” cerebrospinal-fluid pressure; a treatable syndrome. N Engl J Med 1965;273:117–26 10.1056/NEJM196507152730301 [DOI] [PubMed] [Google Scholar]
- 3. Hakim S, Adams RD. The special clinical problem of symptomatic hydrocephalus with normal cerebrospinal fluid pressure: observations on cerebrospinal fluid hydrodynamics. J Neurol Sci 1965;2:307–27 10.1016/0022-510X(65)90016-X [DOI] [PubMed] [Google Scholar]
- 4. Hashimoto M, Ishikawa M, Mori E, et al. ; Study of INPH on Neurological Improvement (SINPHONI). Diagnosis of idiopathic normal pressure hydrocephalus is supported by MRI-based scheme: a prospective cohort study. Cerebrospinal Fluid Res 2010;7:18 10.1186/1743-8454-7-18 [DOI] [PMC free article] [PubMed] [Google Scholar]
- 5. Virhammar J, Laurell K, Cesarini KG, et al. Preoperative prognostic value of MRI findings in 108 patients with idiopathic normal pressure hydrocephalus. AJNR Am J Neuroradiol 2014;35:2311–18 10.3174/ajnr.A4046 [DOI] [PMC free article] [PubMed] [Google Scholar]
- 6. Virhammar J, Laurell K, Cesarini KG, et al. The callosal angle measured on MRI as a predictor of outcome in idiopathic normal-pressure hydrocephalus. J Neurosurg 2014;120:178–84 10.3171/2013.8.JNS13575 [DOI] [PubMed] [Google Scholar]
- 7. Wikkelso C, Andersson H, Blomstrand C, et al. The clinical effect of lumbar puncture in normal pressure hydrocephalus. J Neurol Neurosurg Psychiatry 1982;45:64–69 10.1136/jnnp.45.1.64 [DOI] [PMC free article] [PubMed] [Google Scholar]
- 8. Evans WA Jr. An encephalographic ratio for estimating ventricular enlargement and cerebral atrophy. Arch NeurPsych 1942;47:931–37 10.1001/archneurpsyc.1942.02290060069004 [DOI] [Google Scholar]
- 9. Meier U, Paris S, Gräwe, et al. Is there a correlation between operative results and change in ventricular volume after shunt placement? A study of 60 cases of idiopathic normal-pressure hydrocephalus. Neuroradiology 2003;45:377–80 10.1007/s00234-003-0989-x [DOI] [PubMed] [Google Scholar]
- 10. Warntjes JB, Leinhard OD, West J, et al. Rapid magnetic resonance quantification on the brain: optimization for clinical usage. Magn Reson Med 2008;60:320–29 10.1002/mrm.21635 [DOI] [PubMed] [Google Scholar]
- 11. Virhammar J, Laurell K, Ahlgren A, et al. Idiopathic normal pressure hydrocephalus: cerebral perfusion measured with pCASL before and repeatedly after CSF removal. J Cereb Blood Flow Metab 2014;34:1771–78 10.1038/jcbfm.2014.138 [DOI] [PMC free article] [PubMed] [Google Scholar]
- 12. Rudick RA, Fisher E, Lee JC, et al. Use of the brain parenchymal fraction to measure whole brain atrophy in relapsing-remitting MS: Multiple Sclerosis Collaborative Research Group. Neurology 1999;53:1698–704 10.1212/WNL.53.8.1698 [DOI] [PubMed] [Google Scholar]
- 13. Vågberg M, Lindqvist T, Ambarki K, et al. Automated determination of brain parenchymal fraction in multiple sclerosis. AJNR Am J Neuroradiol 2013;34:498–504 10.3174/ajnr.A3262 [DOI] [PMC free article] [PubMed] [Google Scholar]
- 14. Relkin N, Marmarou A, Klinge P, et al. Diagnosing idiopathic normal-pressure hydrocephalus. Neurosurgery 2005;57:S4–16; discussion ii–v [DOI] [PubMed] [Google Scholar]
- 15. West J, Warntjes JB, Lundberg P. Novel whole brain segmentation and volume estimation using quantitative MRI. Eur Radiol 2012;22:998–1007 10.1007/s00330-011-2336-7 [DOI] [PubMed] [Google Scholar]
- 16. Ambarki K, Lindqvist T, Wåhlin A, et al. Evaluation of automatic measurement of the intracranial volume based on quantitative MR imaging. AJNR Am J Neuroradiol 2012;33:1951–56 10.3174/ajnr.A3067 [DOI] [PMC free article] [PubMed] [Google Scholar]
- 17. Bermel RA, Bakshi R. The measurement and clinical relevance of brain atrophy in multiple sclerosis. Lancet Neurol 2006;5:158–70 10.1016/S1474-4422(06)70349-0 [DOI] [PubMed] [Google Scholar]
- 18. Smith EE, Egorova S, Blacker D, et al. Magnetic resonance imaging white matter hyperintensities and brain volume in the prediction of mild cognitive impairment and dementia. Arch Neurol 2008;65:94–100 [DOI] [PubMed] [Google Scholar]


