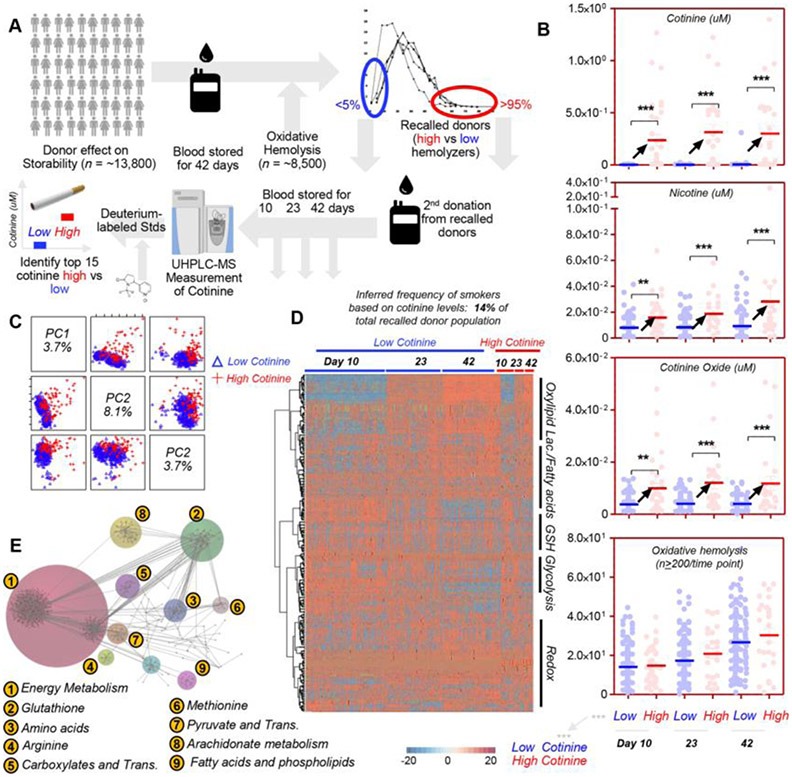
Fig. 1.
Metabolomics analysis of recalled REDS III donors ranked by cotinine levels, as measured by UHPLC–MS. The 5th and 95th percentile lowest and highest hemolyzers from the REDS III original cohort (n = 13,800) were asked to donate a second unit of blood, which was sampled at Storage Days 10, 23, and 42 for metabolomics analyses (A). Measurements of nicotine and its metabolites cotinine and cotinine oxide were obtained against deuterium-labeled internal standards (B). Cotinine levels were used to discriminate between smokers (or other nicotine exposures resulting in cotinine levels higher than 10 ng/mL – group indicated as “high” and represented as red dots in panel B) and nonsmokers (“low,” blue dots). In the same panel, cotinine, nicotine, cotinine oxide, and oxidative hemolysis measurements are shown for the subjects with low/blue versus high/red cotinine (B). Unsupervised principal component analysis (C), hierarchical clustering analysis (D), and pathway analyses (E) were performed on subjects characterized by low (blue) vs high (red) cotinine levels at Storage Days 10, 23, and 42, highlighting differences in energy and redox metabolism between the two groups at the freshest available storage time point (here Day 10) and at the end of storage. In E, since the color code may be too difficult to appreciate, numbers have been added to highlight the pathways that are most significantly affected between subjects with high and low levels of cotinine.

