

Abstract
Purpose
Re-cellularization of the trabecular meshwork (TM) using stem cells is a potential novel treatment for ocular hypertension associated with glaucoma. To assess the therapeutic efficacy of this approach, improved in vivo and ex vivo models of TM pathophysiology are needed. Here, we investigate whether oxidative stress, induced by hydrogen peroxide (H2O2), can model glaucomatous ocular hypertension in the readily available porcine anterior segment organ culture model.
Methods
The impact of H2O2 on TM cell viability and function was first evaluated in vitro using primary porcine TM cells. Oxidative stress was then induced by H2O2 infusion into perfused porcine anterior segments. Trabecular meshwork function was assessed by tracking matrix metalloproteinase (MMP) activity and the ability of the preparation to maintain intraocular pressure (IOP) homeostasis after a flow challenge (doubled fluid infusion rate). Finally, the TM was evaluated histologically.
Results
H2O2 treatment resulted in a titratable reduction in cellularity across multiple primary TM cell donor strains. In organ culture preparations, H2O2-treated eyes showed impaired IOP homeostasis (i.e., IOPs stabilized at higher levels after a flow challenge vs. control eyes). This result was consistent with reduced MMP activity and TM cellularity; however, damage to the TM microstructure was not histologically evident in anterior segments receiving H2O2.
Conclusions
Titrated H2O2 infusion resulted in TM cellular dysfunction without destruction of TM structure. Thus, this porcine organ culture model offers a useful platform for assessing trabecular meshwork therapies to treat ocular hypertension associated with glaucoma.
Keywords: trabecular meshwork, anterior segment organ culture, glaucoma, regenerative model, animal model
Primary open angle glaucoma (POAG), responsible for an estimated 74% of glaucoma cases worldwide, is a leading cause of irreversible blindness.1 The best established risk factor for POAG is elevated intraocular pressure (IOP), which is determined by the aqueous humor production rate and resistance to outflow of aqueous humor.2 The primary aqueous humor drainage route, known as the conventional pathway, consists of the trabecular meshwork (TM), Schlemm's canal, and the distal vessels.3,4
The cellularity of the TM is reduced in POAG patients.5–8 The TM, along with the inner wall of Schlemm's canal, is the major site of aqueous outflow resistance. TM cells phagocytose debris from aqueous humor to prevent outflow blockage, are contractile to alter outflow resistance, and are active remodelers of their extracellular matrix to alter TM extracellular matrix characteristics.9–13 Thus, reduced TM cellularity presumably leads to tissue dysfunction and may contribute to subsequent increased outflow resistance and elevated IOP. Therapies that focus on restoring TM cellularity and function could offer therapeutic benefits to POAG patients.
To test such therapies, a model that mimics TM dysfunction, including ocular hypertension (OHT) and reduced cellularity, is needed. However, most current models of glaucoma are focused on studying optic neuropathy secondary to OHT and thus alter the outflow pathway in ways that do not replicate the situation in human glaucoma.14–18 There are several exceptions in which reduced TM cellularity has been achieved without severe TM damage. In one study, Zhang et al.19 ablated TM cells in rat eyes using a cytotoxic vector; interestingly, they observed a reduced IOP after this procedure. Senatorov et al.20 expressed mutant myocilin in mice, which led to reduced TM cellularity and elevated IOP.21 Unfortunately, mutations in myocilin are only associated with 3% to 4% of POAG cases and may not translate to other POAG subtypes.22 Abu-Hassan et al.23 used saponin, a plant-derived detergent, to reduce TM cellularity in organ-cultured human and porcine anterior segments. They reported that IOP homeostasis was altered in human anterior segments after saponin treatment. Unfortunately, the saponin model does not appear to work in porcine eyes, either in our hands or in the lab of the original publication (M. Kelley, personal communication).
Anterior segment organ culture is a well-established method for studying TM function, in which TM cell viability and function can be maintained for several weeks. Ideally, all organ culture experiments would use human tissue; however, due to poor availability and high costs, this option is not feasible for many labs. Thus, anterior segment organ culture experiments have used monkey, porcine, bovine, or human eyes.24–29
Our goal was to create a model of graduated TM cell loss and dysfunction using readily available porcine anterior segments in organ culture. For this purpose, we chose to utilize oxidative stress-induced damage to the TM. Here, we show that hydrogen peroxide (H2O2) can be used to reduce TM cellularity, leading to tissue dysfunction in the form of reduced IOP homeostasis. This organ-culture TM dysfunction model offers an attractive platform for testing therapies for recellularizing and/or refunctionalizing the TM.
Materials and Methods
To determine the effects of H2O2 exposure on cell viability, we first used isolated, cultured porcine TM (pTM) cells. Cells were treated with different H2O2 concentrations, and viability was assessed until cellularity was reduced by ∼50%. pTM cells were further assessed for phenotypic function after H2O2 treatment. We next implemented H2O2 treatment in porcine anterior segments maintained in organ culture, assessing TM function, viability, and histology in this model.
Cell Culture Experiments
Porcine Anterior Segment Preparation. Fresh porcine eyes were obtained from a slaughterhouse (Holifield Farms, Covington, GA, USA) within 6 to 8 hours of enucleation. Eyes were dissected to isolate the anterior chamber in a manner similar to previously reported methods.24,25,30 Briefly, orbital connective tissue was removed, and eyes were soaked in Betadine solution (Purdue Pharma, New York, NY, USA) for 5 minutes. Eyes were then washed three times with sterile PBS containing penicillin, streptomycin, and amphotericin and transferred to a sterile laminar flow hood for further dissection. Eyes were hemisected to isolate the anterior segment, and the vitreous humor and lens were removed. Next, the iris was cut radially back to the iris root and pectinate ligaments until the TM was revealed, and the ciliary processes were carefully removed with Vannas microscissors (World Precision Instruments, Sarasota, FL, USA) while preserving the TM.
Porcine Trabecular Meshwork Cell Isolation. The TM was removed from the corneoscleral shell with curved, fine forceps and placed in 10 mg/mL Gibco Collagenase Type IV (Thermo Fisher Scientific, Waltham, MA, USA) digestion solution for 30 minutes at 37°C as previously described.31 Collagenase Type IV was neutralized by the addition of 10% fetal bovine serum (FBS)-containing Dulbecco's modified Eagle's media (DMEM) supplemented with penicillin, streptomycin, and 2-mM l-glutamine (TM cell media), and the tissue digest was centrifuged at 1000 rpm for 10 minutes. The pellet was resuspended in 3 mL TM cell media and placed on a 0.1% (w/v) gelatin-coated six-well plate for 48 hours to allow cells to attach. Media was exchanged every 3 days until cells reached ∼90% confluency, at which point pTM cells were detached with 0.05% Trypsin-EDTA (w/v, Cellgro; Corning Inc., Corning, NY, USA) and plated in new culture flasks at 5000 cells/cm2 (∼3:1 split ratio). Cells were expanded and used between passages 4 and 6 for all experiments.
Porcine Trabecular Meshwork Cell Characterization. To confirm cultured cells had TM-like properties, cells were plated at 10,000 cells/cm2 in six-well plates and were assessed for myocilin expression following dexamethasone (DEX) treatment. Then, 100-nM DEX was added in TM cell media to cultured cells for 7 days, and the media was replaced every 3 days. After 1 week of treatment, RNA was isolated and RT-PCR was performed as previously described.32 We chose to look at myocilin message rather than protein, as preliminary studies showed poor detection of porcine myocilin with available antibodies. Briefly, Invitrogen TRIzol Reagent (Thermo Fisher Scientific) was utilized for initial RNA isolation, followed by additional purification using the Aurum Total RNA Mini Kit (Bio-Rad, Hercules, CA, USA). The RNA amount and purity were quantified by a NanoDrop 2000C spectrophotometer (Thermo Fisher Scientific). Then, 1 µg of RNA was reverse transcribed to clonal DNA (cDNA; Bio-Rad). cDNA samples were analyzed for porcine myocilin and previously established TM reference genes (GAPDH, GUSB, and TBP) (Supplementary Table S1).66 cDNA amplification was quantified in real time throughout the PCR cycle (StepOnePlus Real-Time PCR System; Thermo Fisher Scientific) with SYBR Green reagent (Bio-Rad). The resulting cyclic threshold values were normalized to the geometric mean of reference genes and further normalized against untreated pTM samples using the 2−ΔΔCT methodology.33 We observed significant increases in myocilin message levels after DEX treatment in all pTM cell lines tested, confirming the TM phenotype (Supplementary Fig. S1).
Exposure of Cells to Hydrogen Peroxide In Vitro
Porcine TM cells were plated at 10,000 cells/cm2 in TM cell media and allowed to deposit extracellular matrix and proliferate for at least 48 hours. To assess viability, pTM cells were plated in 24-well plates, and six-well plates were used for functional experiments. Cell media was aspirated, and cells were washed once with PBS. Commercially available hydrogen peroxide (H2O2) obtained fresh from a local pharmacy (3% w/v) was 0.22-µm sterile filtered and prepared at specified concentrations in serum-free DMEM supplemented with 2-mM l-glutamine and 1× penicillin, streptomycin, and amphotericin (organ culture media). Cells were incubated at 37°C in organ culture media for 1 hour. H2O2-containing media was then removed, and cells were washed once with PBS. pTM cells were assessed immediately when indicated, or fresh organ culture media was added for further cell culture.
Cellular Viability Assessment. In vitro cellular viability was assessed as previously described.30 Briefly, cells were incubated for 5 minutes in propidium iodide (Thermo Fisher Scientific) to stain dead, adherent cells. Cells were then detached with 0.05% Trypsin-EDTA (w/v), and TM cell media was added after 5 minutes to neutralize trypsin activity. Cell suspensions were collected and loaded onto non-adherent 96-well plates (Corning). Cell samples were analyzed using flow cytometry (Attune NxT; Thermo Fisher Scientific). Living cell counts were compared to control, untreated cell counts to determine viability after H2O2 treatment. Viability was assessed immediately and 24 hours and 48 hours following H2O2 treatment as indicated.
Metabolic Activity Assessment. pTM cells were seeded 24 hours after H2O2 treatment at 10,000 cells/cm2 in 96-well plates in Hanks’ balanced salt solution (HBSS) supplemented with 5% FBS and 2-mM l-glutamine. To determine the effect of H2O2 on metabolic activity, alamarBlue (resazurin; Bio-Rad) in fresh media (10% v/v) was added to each cell sample.34 The increase in alamarBlue fluorescence was detected by using a plate reader (Cytation 3, Bio-Tek Instruments, Winooski, VT, USA) incubated at 37°C in a 5% CO2 atmosphere, with readings (excitation, 545-nm wavelength; emission, 590-nm wavelength) taken every 10 minutes for at least 2 hours. Fluorescence was plotted versus time for each cell sample, and the slope of the linear region was found. Slopes were compared between treated and untreated cell samples to determine the effects of H2O2 on metabolic activity.
Phagocytic Activity Assessment. TM cells are known to be actively phagocytic,10,11 and their activity has been quantified previously using Invitrogen pHrodo Red E. coli BioParticles (Thermo Fisher Scientific).32,35 Twenty-four hours after H2O2 treatment, cells were seeded at 50,000 cells/cm2 onto 96-well plates in HBSS supplemented with 5% FBS and 2-mM l-glutamine. Cells were allowed to attach overnight before assessing phagocytosis. pHrodo particles (2 million cells/vial) were reconstituted in HBSS media, sonicated for 5 minutes, and added to pTM cells. Control, non-phagocytically challenged samples remained in HBSS media throughout. pTM cells were exposed to pHrodo particles for 4 hours, after which cells were detached with 0.05% (w/v) Trypsin-EDTA for 5 minutes. Cells in solution were transferred to 96-well plates and passed through an Attune NxT flow cytometer at an uptake flow rate of 100 µL/min. Non-phagocytically challenged control median fluorescent intensity (MFI) values were subtracted from MFI values measured in phagocytically challenged samples. Ratios of MFI values in H2O2-treated cells to MFI values in control, untreated cells were calculated to determine the effect of H2O2 on phagocytic activity.
Gel Contractility Assessment. Cell contractility was determined using a previously developed collagen gel contraction assay, as trabecular meshwork cells are contractile.32,36 Briefly, 24 hours after H2O2 treatment, cells were resuspended in serum-free DMEM at 9 × 10⁵ cells/mL. Collagen type I (3 mg/mL, 1% [v/v] acetic acid, calf skin; MP Biomedical, Santa Ana, CA, USA) was added to cells at a 1:2 volume ratio (collagen:cells), and a pre-titrated volume of 0.1-M sodium hydroxide was immediately added to neutralize the acidity. Collagen gels (1 mg/mL, 6 × 10⁵ cells/mL final concentration) were cast in 48-well plates at 240 µL gel solution per well. Collagen gels were allowed to solidify for 20 minutes, then 240 µL of serum-free media was added to each well. Collagen gels were allowed to stabilize for 24 hours, at which point gels were released from the walls of the 48-well plates using a pipette tip. Gels were incubated for a further 24 hours to allow time for the gels to reach a steady-state gel area. Images of each gel were taken immediately following release from the walls and at 24 hours (ChemiDoc MP; Bio-Rad). Using ImageJ (National Institutes of Health, Bethesda, MD, USA), gel area was quantified immediately after release and 24 hours later to determine the extent of gel contraction. Percent gel contraction was compared between H2O2-treated and control (untreated) cell samples to determine the effects of H2O2 on gel contractility.
Porcine Anterior Segment Organ Culture
Dissected anterior segments, prepared as described above, were mounted in custom-built organ culture dishes (Supplementary Fig. S2). Organ cultured anterior segments were maintained in a sterile 37°C humidified incubator and perfused at 2.5 µL/min with organ culture media; pressure was measured every 60 seconds with a pressure transducer (142pc01g; Honeywell, Morris Plains, NJ, USA) and recorded in LabVIEW 2014 SP1 (National Instruments, Austin, TX, USA). Before H2O2 or other agents were added, the eyes were allowed to stabilize for at least 48 hours after initial setup. Eyes that did not demonstrate a stable outflow facility (a ratio between perfusion flow rate and IOP) between 0.45 and 0.125 µL/min/mm Hg (pressures of ∼6–20 mm Hg IOP) were considered damaged and were not used for subsequent experiments.
Hydrogen Peroxide Treatment in Organ Culture
After IOP stabilization, 4.5-mM H2O2 in organ culture media was perfused into eyes for 1 hour. To rapidly expose the anterior segments to H2O2, an exchange was conducted as follows. Anterior segments were open to hydrostatic reservoirs to maintain constant pressure (6–12 mm Hg) and provide a fluid outlet, and the perfusion flow rate was increased to 2.5 mL/min until approximately 7 to 10 mL of 4.5-mM H2O2 had been infused. This exchange protocol had the advantage of filling the entire anterior segment and thus offering the most uniform possible exposure of the entire TM to H2O2, although we expect that high-flow regions of the TM still received more H2O2 than low-flow regions. After the exchange had been completed, anterior segments were returned to the normal perfusion flow rate of 2.5 µL/min for 1 hour, and the valve connecting the culture dish to the hydrostatic reservoirs was closed, during which time the perfusate consisted of media with added 4.5-mM H2O2 . At the conclusion of this 1-hour period, anterior segments were again exchanged with an additional 7 to 10 mL of organ culture media at 2.5 mL/min to flush H2O2-containing media from the anterior segment. Finally, anterior segments were perfused for an additional 24 hours at 2.5 µL/min to allow IOP stabilization following treatment with H2O2. For control anterior segments, the same protocol was followed except that no H2O2 was added to the organ culture media.
Organ Culture Characterization
IOP Homeostasis Challenge. After a 24-hour IOP stabilization period following H2O2 treatment, the organ-culture perfusion flow rate was increased to 5µL/min to create a 2× flow challenge. The 2× flow was continued until IOP had stabilized for 24 hours, after which eyes were removed from culture. This stabilization occurred at different times during the 2× flow challenge (between 24 hours and 72 hours after starting the challenge), so that eyes were removed from culture at different time points. A similar 2× pressure challenge has been shown to result in higher facilities in normal human anterior segments, presumably due to the TM adapting so as to restore a homeostatic pressure level. This adaptive response was absent or blunted in glaucomatous anterior segments,23 and thus the pressure challenge response has been interpreted as a measure of TM function. Our 2× flow challenge follows a similar approach and is easier to implement in a pump-based system, such as was used in this work. When organ-cultured anterior segments are challenged in this way, we expect that pressure will spike and eventually reduce to baseline values in control anterior segments with functional TMs. On the other hand, we expect that H2O2-treated anterior segments will not adapt, so that IOP will remain elevated (diagrammed in Fig. 1).
Figure 1.

Schematic of 2× flow challenge paradigm. After IOP stabilized following H2O2 or media treatment for treated and control eyes, respectively (“Baseline IOP”), the inlet flow rate doubled (2× flow challenge). In control eyes, we expect the TM to adapt, so that IOP recovers to baseline IOP levels. In treated eyes, we expect TM function to be impaired so IOP does not return to baseline values.
Gelatin Zymography. During organ culture experiments, 1 mL of media that had passed through the outflow tract was collected by aspiration from the organ culture dish daily (conditioned outflow media). The remaining media in the organ culture dish was discarded daily. Media was collected before H2O2 treatment and throughout the 2× flow challenge and was stored at –80°C prior to use. Media was assessed for gelatinase activity (matrix metalloproteinase 2 [MMP2] and MMP9) by gelatin zymography as previously described.37,38 Briefly, 4× non-reducing sample dye (250-mM Tris-HCl, pH 6.8; 40% [v/v] glycerol; 8% [w/v] SDS; and 0.01% [w/v] bromophenol blue) was added to media samples, and 5 µL of each sample were loaded onto 10% SDS-polyacrylamide gels with 0.2% (w/v) gelatin. SDS-PAGE was run at 125 V for approximately 90 minutes at room temperature in running buffer (25-mM Tris, 192-mM glycine, 0.1% [w/v] SDS, pH 8.3; BioRad). Next, gels were placed in 2.5% (v/v) Triton X-100 to renature enzymes for 30 minutes, then incubated overnight in 50-mM Tris-HCl, 150-mM NaCl, and 10-mM CaCl2, pH 7.8 (37°C) to allow sufficient time for gelatinolytic activity to occur. Finally, gels were incubated with Coomassie stain (0.05% [w/v] Coomassie Brilliant Blue G-250, 25% [v/v] methanol, 10% [v/v] acetic acid) for 1 hour and subsequent destaining solution (4% [v/v] methanol, 8% [v/v] acetic acid) until gelatinolytic activity bands were visible. Gels were imaged (ChemiDoc MP), and total gelatinase activity was quantified using ImageQuant TL 8.1 (GE Healthcare Life Sciences, Chicago, IL, USA). We note that this methodology quantified gelatinolytic activity of the entire anterior segment (not just the TM), as other anterior tissues, such as the cornea, could contribute to gelatinases found in the outflow media.
Live / Dead Assessment in Organ Culture. After a 24-hour IOP stabilization period following H2O2 treatment, anterior segments were live/dead stained to determine cellular viability. Anterior segments were removed from organ culture, washed once with PBS, and incubated with 2-µM calcein-AM and 4-µM ethidium homodimer-1 for 30 minutes. Live/dead stained tissue was imaged en face by confocal microscopy (LSM 700; Carl Zeiss Microscopy, White Plains, NY, USA). Micrographs were captured as tile scans of z-stacks (to account for TM depth and height differences in the tissue) at 50× magnification. Maximum intensity projections were created from z-stacks for subsequent image quantification. Eyes were then fixed overnight using 10% buffered-formalin at 4°C.
Brightfield overlays were also captured to identify the corneal margin, from which we determined the approximate location of the TM. Specifically, a 1-mm-wide band around the corneal margin was taken to include the TM. Next, a polar coordinate system (r, θ) with origin at the corneal center was superimposed on the images using MATLAB (MathWorks, Natick, MA, USA), for additional analysis of segmental changes to the TM. Total fluorescent intensity for calcein-AM (live) was calculated at 1° increments around the entire TM circumference (0°–360°). Unfortunately, we did not record the absolute (anatomical) orientation of the eye, so that the θ = 0 reference was relative to the image taken rather than to anatomical orientation. To determine overall viability, we determined the magnitude of the fluorescent signal due to autofluorescence by examining all images and then set a threshold based on this magnitude. Any TM regions exceeding this threshold were considered to be viable, and we quantified the circumferential extent of such regions. We also tested the sensitivity of our results to the threshold value and found that it could be adjusted up or down by up to 50% with little difference. Finally, coefficients of variation for live cell signal intensity around the TM were computed as a measure of segmental effects/variability within the TM.
Histological Processing. Porcine tissue was processed for histology as previously described.30 Briefly, anterior segment quadrants of fixed porcine eyes were cut into 3-mm-wide meridional wedges and dissected to isolate the outflow region. The tissue was dehydrated in an ethanol series, infiltrated, and embedded in Histocryl resin (Electron Microscopy Sciences, Hatfield, PA, USA). Sagittal sections 2 µm thick were cut on a Leica UC7 Ultramicrotome (Leica Microsystems, Buffalo Grove NY, USA) and examined with a Leica DM6 epifluorescent microscope. The sections were then stained with a polychromatic stain39 composed of basic fuchsin and azure B (Electron Microscopy Sciences), mounted in Prolong Gold (Thermo Fisher Scientific) and examined to evaluate cell morphology and tissue structure.
Analysis of H2O2-treated and untreated (control) tissue sections was performed in a masked manner. TM was evaluated across multiple quadrants for at least four control and untreated eyes to account for the segmental variability of porcine TM anatomy and potential segmental variability of H2O2 effects. Images were taken at both low (10×) and high (63×) magnifications for each sample and evaluated by two examiners familiar with TM histology (CRE, ATR). Each section was scored as control or H2O2-treated, focusing on the following features: variability and amount of pigment in the TM, number of nuclei and their distribution, appearance of nuclei (swollen vs. normal), and overall integrity of TM microstructure. After assessment of all sections, the examiners were unmasked, and agreement between examiner scores and the actual treatment status was computed.
Statistics
For in vitro experiments, at least three technical replicates for each of two pTM cell lines were assessed for each experiment setup. For ex vivo organ culture experiments, at least six eyes were assessed for every experimental condition. All statistical analyses were performed using Prism 8.1.1 (GraphPad, La Jolla, CA, USA). To assess differences between the two groups (control vs. H2O2-treated), paired or unpaired Student's t-tests were used when parametric statistical testing was applicable (i.e., uniform distribution and equal variance between groups). Normal distribution was assessed using the Shapiro–Wilk test, which tested the null hypothesis that a sample came from a normally distributed population; the null hypothesis was rejected if P < 0.05. The Brown–Forsythe test was used for assessing equal variances, with P < 0.05 indicating variances that were significantly different. When parametric statistical analysis was not suitable, the Mann–Whitney test was used, as indicated. For multiple comparisons, P values were corrected using the Holm–Šídák test. The significance threshold was taken as P = 0.05 for all analyses.
Results
Effect of H2O2 on pTM Cell Viability In Vitro
Isolated pTM cells were treated with different concentrations of H2O2 for 1 hour, and cell viability was measured by flow cytometry. Viability and H2O2 concentration were linearly correlated over a wide range (Fig. 2A). Interestingly, cell viability continued to decrease beyond the initial 1-hour treatment with H2O2 until stabilizing approximately 24 hours after H2O2 exposure (Fig. 2B). Further, cellular viability was generally similar in three pTM cell lines following 1-hour treatment with 2-mM H2O2 and 24-hour incubation in organ culture media to account for extended H2O2-induced death (Fig. 2C). However, quantitative differences in H2O2 response were significant between the pTM A and pTM B cell lines and between the pTM A and pTM C lines, highlighting the biological variability anticipated in subsequent organ culture experiments. We conclude that H2O2 treatment of pTM cells is capable of producing titrated cell loss in culture.
Figure 2.

Effects of H2O2 treatment on pTM cells in vitro. (A) Effect of H2O2 concentration on pTM cell viability immediately after 1-hour exposure for two pTM cell lines (n = 4 technical replicates for each pTM cell line). P values are the area associated with the null hypothesis that the slope of the regressed line was zero (i.e., that cell viability did not depend on H2O2 concentration). (B) Extended effects of 2-mM H2O2 treatment for 1 hour on pTM cell viability for two pTM cell lines (n = 4 technical replicates for each pTM cell line). (C) Summary of effects of 1-hour, 2-mM H2O2 treatment on three pTM cell lines (n = 16 for pTM A and pTM C and n = 8 for pTM B technical replicates). Significant differences between each cell line were determined by ANOVA with post hoc Tukey's test; *P < 0.05, **P < 0.01. Error bars denote standard deviations throughout. All viability values were normalized to control conditions (no H2O2).
Functional Assessment of H2O2-Treated pTM Cells
To assess the effects of H2O2 treatment on pTM cell function, cells were treated with 2-mM H2O2 for 1 hour and allowed to equilibrate for 24 hours. alamarBlue staining indicated a significant decrease in metabolic activity following treatment (Fig. 3A). Phagocytic activity after incubation with pHrodo particles was reduced in two of the three pTM cell lines tested following H2O2 treatment and was unaltered in the third pTM cell line (Fig. 3B). When all samples were pooled, the effect of H2O2 on phagocytosis was not significant when compared to untreated cells. H2O2-treated cells showed slight increases in contractility, as assayed by a gel contraction assay, but overall these differences were not statistically significant. (Fig. 3C). We conclude that, although metabolic activity was significantly reduced, the phagocytic and contractile properties of the surviving pTM cells were only slightly altered following H2O2 treatment.
Figure 3.

Effect of H2O2 on pTM cell function. pTM cells were treated with 2-mM H2O2 for 1 hour. After 24 hours, pTM cells were tested for (A) metabolic activity (n = 6 technical replicates for each pTM cell line), (B) phagocytic activity (n = 3 technical replicates for each pTM cell line), and (C) collagen gel contractility (n = 5 technical replicates for each pTM cell line). Black dashed lines denote untreated control results, and error bars denote standard deviations. Significant differences (denoted by asterisks, P < 0.05) between H2O2-treated cells and untreated controls were determined by Mann–Whitney test (3A) or paired Student's t-test (3B,C).
IOP Homeostasis After H2O2 Treatment
After characterizing H2O2 treatment effects in vitro, experiments were translated to porcine organ-cultured anterior segments. Different H2O2 concentrations were perfused into porcine anterior segments for 1 hour, followed by a stabilization period in which IOP returned to pre-treatment levels for both H2O2-treated and untreated experiments. Differences between baseline IOP values for control and H2O2-treated eyes were not significant (Supplementary Table S2). The perfusion flow rate was then doubled to evaluate the ability of the TM to respond to this 2× flow challenge, as described in the Methods section. We observed that 2- to 4-mM H2O2 did not lead to significant TM dysfunction; that is, elevated IOP eventually returned close to baseline levels following the 2× flow challenge (data not shown). However, 4.5-mM H2O2 resulted in sustained IOP elevation for at least 3 days following the 2× flow challenge, indicating a loss of TM homeostatic response (Fig. 4). This was further verified by gelatin zymography of effluent collected before and during the 2× flow challenge. Gelatinase activity for control eyes (no H2O2 exposure) was not significantly different after H2O2 treatment and before 2× flow. However, gelatinase activities in control eyes exhibited significantly more gelatinase activity compared to H2O2-treated eyes (Fig. 5) during the 2× flow challenge, indicating reduced extracellular matrix remodeling capacity in H2O2-treated eyes. Interesting, although total gelatinolytic activity was quantified and compared, activity was predominantly due to MMP2 (∼72 kDa) and not MMP9 (∼92 kDa) (Fig. 5A). We conclude that 4.5-mM H2O2 is capable of disrupting IOP homeostasis in the porcine TM.
Figure 4.

The 2× perfusion flow challenge after H2O2 treatment. (A) Average IOP traces for H2O2-treated and control eyes. IOP traces are shown throughout the 2× perfusion flow challenge until IOP steady-state was reached. IOP was normalized to an eye-specific baseline IOP measured after treatment with 4.5-mM H2O2 (experimental eyes) or media (control eyes); shaded region denotes standard error. The n values indicate the number of eyes that were averaged, accounting for different termination times for the experiments. (B) Normalized steady-state (∼48 hours after H2O2 treatment) IOP after 2× flow challenge in H2O2-treated and control eyes (n = 9 eyes for each). Statistical significance between H2O2-treated and untreated eyes was determined by unpaired Student's t-test.
Figure 5.
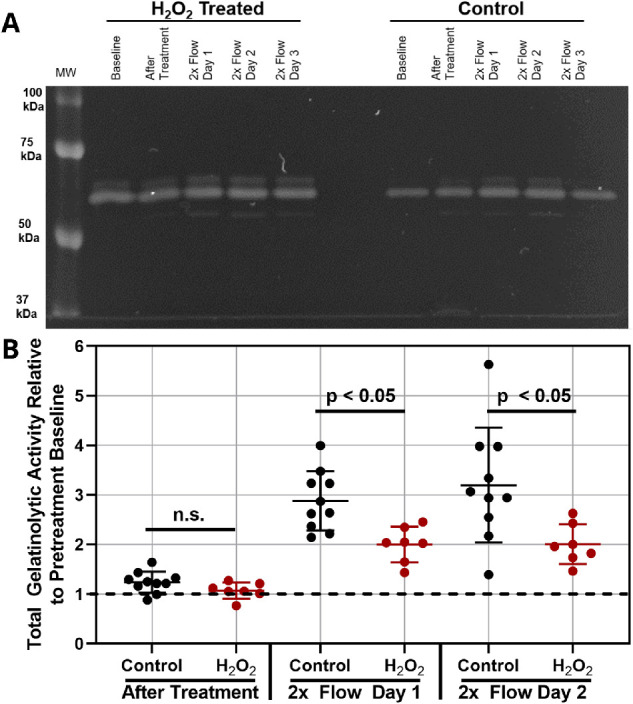
Gelatinase levels in effluent collected from perfused anterior segments. (A) Representative zymogram for effluent from control and H2O2-treated anterior segments. Bands are concentrated in the 50- to 75-kDa molecular weights, indicative of MMP2 (and not MMP9) activity. (B) Total gelatinolytic activity is shown relative to pretreatment activity (n > 7 biological replicates for each). For each time point, 5 µL of sample was run; after quantifying band intensity, 2× flow results were doubled to account for the increased flow rate. Individual data points are shown, and horizontal bars denote means. Statistical significance between H2O2-treated and untreated eyes (P < 0.05) was determined by unpaired Student's t-test.
Live/Dead Assessment of Porcine TM After H2O2 Treatment
Cellular viability was assessed in the porcine TM 24 hours after H2O2 treatment by using calcein-AM and ethidium homodimer-1 staining. Reduced live cell signal and increased dead cell signal were observed in the TM region of H2O2-treated eyes compared to control, untreated eyes (Figs. 6A, 6B). A polar coordinate system was superimposed on images and average live cell signal intensity was quantified versus angular position (θ) in 1° increments for each anterior segment. There was a statistically significant reduction of 63% ± 25% (mean ± SD) in circumferentially averaged live cell signal intensity due to H2O2 treatment versus controls (P < 0.03; n = 9) (Fig. 7C). It can be seen that cell viability in the porcine organ culture system was segmentally variable even in control eyes (Fig. 6A), an effect that appeared to be enhanced by H2O2 treatment (Fig. 6B), with some regions showing essentially no live cells and others showing minimal dead cell staining. This is likely related to the known segmental nature of outflow through the TM.40,41 We quantified this effect by determining the percentage of the TM circumference showing live cell signal above a threshold value. The percentage of such regions (viable TM) was 28% ± 23% lower in H2O2-treated anterior segments compared to 59% ± 27% for control, untreated eyes (P < 0.04; n = 9) (Fig. 6D). To further quantify the segmental changes in the TM after H2O2 exposure, we calculated a coefficient of variation for live cell signal around the TM circumference for each anterior segment, with higher values indicating more pronounced segmental variation. There was a significantly greater coefficient of variation in H2O2-treated eyes (1.75 ± 0.87) versus untreated tissue (1.0 ± 0.36; P < 0.02; n = 9) (Fig. 6E). We conclude that H2O2 treatment reduces TM cell viability and increases segmental variability.
Figure 6.

Live/dead staining in the TM REGION of H2O2-treated porcine anterior segments. Representative en face images for the entire TM region of (A) control and (B) H2O2-treated porcine anterior segments are shown. Calcein-AM (green) and ethidium homodimer (purple) label live and dead cells, respectively. Scale bars: 2 mm. Only signal from the selected TM region (1-mm band around the corneal margin, shown as dashed region) was included in the analysis. (C) Circumferentially averaged live cell fluorescent signal intensity in the TM, normalized by the mean signal in untreated controls. We used a polar coordinate system centered on the central cornea and quantified signal intensity versus circumferential position, followed by circumferential averaging and normalization to obtain the plotted quantity (n = 9 anterior segments for each of control and H2O2-treated eyes). (D) There were fewer circumferential regions with viable TM in the H2O2-treated eyes versus controls. The plotted quantity is the percentage of the TM circumference showing cell viability, defined as having live staining intensity higher than a threshold, as described in the text. (E) The circumferential variation in cell viability was greater in H2O2-treated eyes. The plotted quantity is the coefficient of variation for live cell signal around the TM circumference (measurements at 1° increments), normalized to the mean coefficient of variation in control eyes. In C, D, and E, error bars denote standard deviations; significant differences (P < 0.05) between H2O2-treated and untreated eyes were determined by unpaired Student's t-test.
Figure 7.
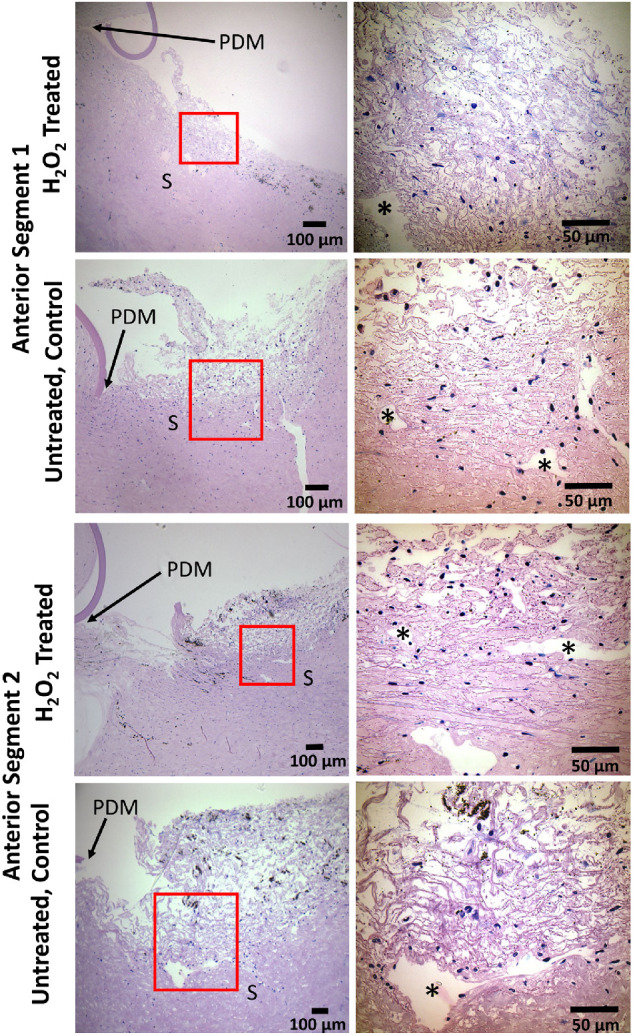
Histological assessment of TM after H2O2 treatment. Representative polychromatic stained sagittal sections of the TM region for (rows 1 and 3) H2O2-treated organ-culture porcine anterior segments and (rows 2 and 4) untreated control anterior segments. The upper two rows are sections that were correctly identified as either control or H2O2-treated in masked scoring, and the lower two rows show incorrectly identified images. Lower magnification brightfield micrographs are labeled with relevant anatomical features for orientation (posterior margin of Descemet's membrane). Approximate zoomed regions are shown as red boxes in lower magnification micrographs, corresponding to the higher magnification images. *Angular aqueous plexus, an analog of Schlemm's canal in porcine eyes; PDM, posterior margin of Descemet's membrane; S, sclera.
Structural and Histological Assessment of H2O2-Treated Eyes
Following H2O2 treatment, corneal swelling was qualitatively monitored in organ culture as evidenced by reduced corneal transparency. Corneal swelling indicates damage to the corneal endothelium and results in cytokine and MMP secretion that may confound stem cell therapy results.42–45 One day after H2O2 treatment, reduced transparency was not observed. For the 2× flow experiments where H2O2 eyes were maintained for 3 to 4 days after treatment, corneal swelling was infrequent, similar to that seen in untreated eyes.
We also assessed sagittal sections from fixed porcine eyes after live/dead imaging to determine whether H2O2 treatment altered TM morphology. Tissue was stained with polychromatic stain to identify cell nuclei and better visualize TM extracellular matrix. Overall, TM microarchitecture was not found to be disrupted by H2O2 when compared to untreated eyes (Fig. 7). The numbers of cell nuclei in the TM were generally similar between H2O2-treated and untreated eyes, with some sections from H2O2-treated tissue showing low cell counts and other sections not (Fig. 7). In masked scoring, we could not consistently identify which images were taken from H2O2-treated eyes (44% identified correctly) versus from control eyes (69% identified correctly). These results were surprising but are likely due to the highly segmental effects observed in H2O2-treated eyes as noted above (Fig. 6) and the infrequent sampling inherent in sagittal histologic sections.
Discussion
This work demonstrates that it is possible to create a pathophysiologically accurate model of TM dysfunction in commonly available porcine anterior segments. Such a model is expected to be useful for several reasons. First, reduced TM cellularity in glaucoma is believed to cause tissue dysfunction, including increased outflow resistance leading to OHT.46,47 As a result, this model offers a platform to test therapies to restore the cellularity and/or functionality of the TM. In this context, use of porcine anterior segments is attractive because they offer a more manageable TM size compared to rodents, and findings in this model are likely to be highly translatable to human eyes when eye-size-dependent physical factors are considered (e.g., efficiency of stem cell delivery).
We used H2O2 treatment, an acute model of oxidative stress, to induce TM dysfunction in porcine anterior segment organ culture. Oxidative stress is believed to contribute to the pathogenesis of POAG and lead to DNA, mitochondrial, and extracellular matrix damage in the TM.48–53 Interestingly, the TM has been found to be more susceptible to oxidative damage than other anterior ocular tissues, such as the cornea.54
Key features of this model include reduced TM cellularity, increased heterogeneity of TM cellularity, and a loss of IOP homeostasis after a flow challenge. Consistent with this loss of homeostasis, we observed reduced gelatinase (predominately MMP2) activity in H2O2-treated anterior segments. TM cells have been previously shown to upregulate secretion of MMP2, MMP3, and MMP14 after IOP elevation, all of which are involved in extracellular matrix remodeling.13 Reduction of MMP2 activity, as observed by gelatin zymography in media effluent, suggests reduced tissue remodeling after elevated IOP in H2O2 eyes. The reduction in gelatinase activity was not in response to H2O2 treatment, as media effluent collected before and after H2O2 treatments showed similar gelatinase activity. However, it is worth reiterating that media effluent activity reflects the anterior segment as a whole and not exclusively the TM. MMP release from the cornea, for example, is a confounding factor in these results that cannot be excluded.
Organ-cultured porcine anterior segments had a significant reduction in cellularity after 4.5-mM H2O2 treatment, as determined by live/dead staining, with cell viability reduced to 63% ± 25% of that seen in controls. This seems to be somewhat more severe than the situation in human glaucomatous tissue, where approximately 30% fewer cells are found in the TM of POAG donors compared to similarly aged healthy eyes.5,8 However, the porcine anterior segments are presumably from young adult pigs, and TM cells are lost continuously with age. Considering a reduction in TM cellularity associated with aging from 0 to 80 years of approximately 60%,55 we estimate that there are approximately 70% to 80% fewer TM cells in aged glaucomatous human eyes compared to young, healthy human tissue, a greater reduction than the result from this study. Interestingly, loss of IOP homeostasis was utilized as our endpoint to determine the optimal H2O2 concentration, which perhaps not coincidentally resulted in a TM cellularity reduction similar to that seen in human glaucoma in aged eyes.
Interestingly, reduced TM cell viability was seen to be highly heterogeneous (segmental) around the TM circumference, as quantified by the fraction of viable regions around the TM (28% after H2O2 exposure vs. 59% in control, untreated eyes) and the coefficient of variation of viable cell staining around the TM circumference. It is important to note that even control eyes showed appreciable segmental variation, an effect that was amplified by H2O2. We speculate that damage is more severe in regions of high flow during the 1-hour H2O2 exposure in organ culture. These findings were consistent with observations from histological analysis, in which both control and H2O2-treated TMs were found to have regions of reduced cellularity. In fact, masked histological scoring could not detect a consistent difference in cellularity between H2O2-treated and control tissue, likely due to the significant undersampling associated with studying sagittal sections at discrete circumferential locations. Further experiments are needed to understand this aspect of the response to H2O2. For example, studies incorporating a fluorescent tracker to track high outflow regions along with H2O2 treatment could determine whether there is a correlation between high flow and reduced viability.41 Second, a more rigorous serial sectioning process of the entire TM would be necessary to fully track reduced cellularity following H2O2 treatment. Third, immunohistochemical analysis could be used to track key proteins associated with the TM to better identify and track changes occurring in the tissue as a result of the H2O2 treatment. These findings also highlight a general limitation of the organ culture approach—namely, the segmental loss of cells in control eyes.56 Even though eyes were obtained fresh and were dissected by an experienced investigator, such segmental variation appears unavoidable and future studies should consider this effect.
Importantly, our acute oxidative stress model resulted in minimal unwanted side effects on tissue morphology and the function of the remaining TM cells. For example, histology revealed normal-appearing TM after H2O2 treatment at both gross and microscopic levels, suggesting tissue integrity was maintained, essential for assessing stem cell therapies. Further, phagocytic and contractile functions of the remaining TM cells were only slightly altered after H2O2 treatment; however, phagocytosis was inconsistent across the three cell lines tested in vitro, with one cell line showing a significant reduction in phagocytic function. Phagocytosis has been shown to be minimally impacted in POAG eyes maintained in anterior segment culture,57 whereas other studies using dexamethasone to create ocular hypertension have found a significant reduction in phagocytic function.58 Conversely, we did find metabolic activity to be significantly reduced in cultured TM cells after H2O2 treatment. Oxidative stress is known to decrease metabolic activity in other cell types, so this result was expected.59–62 Further, reduced metabolic activity has been observed in different cell types derived from old donors as compared to cells from young donors.63,64 Because POAG is associated with aging,65 this effect on metabolic activity may mimic the reduced activity likely present in glaucomatous TM cells.
There are several limitations to this model. H2O2-induced damage of the TM was non-specific and, as a result, other anterior chamber tissues exhibited reduced cellularity. This might lead to confounding factors when testing cell therapies. The non-specificity of H2O2 effects also means this approach is likely not suitable for in vivo applications. Finally, the effects of H2O2 were observed to be segmental, likely due to known flow heterogeneity through the TM,40,41 which may or may not mimic the cell loss situation in glaucoma. Nonetheless, this model shows utility as a pre-clinical platform for testing TM-based therapies in cultured porcine anterior segments.
Supplementary Material
Acknowledgments
Supported by the National Science Foundation (DGE-114890, EJS) and Georgia Research Alliance (CRE).
Disclosure: E.J. Snider, None; B.A. Hardie, None; Y. Li, None; K. Gao, None; F. Splaine, None; R.K. Kim, None; R.T. Vannatta, None; A.T. Read, None; C.R. Ethier, None
References
- 1. Quigley HA, Broman AT. The number of people with glaucoma worldwide in 2010 and 2020. Br J Ophthalmol. 2006; 90(3): 262–267. [DOI] [PMC free article] [PubMed] [Google Scholar]
- 2. Weinreb RN, Khaw PT. Primary open-angle glaucoma. Lancet. 2004; 363(9422): 1711–1720. [DOI] [PubMed] [Google Scholar]
- 3. Goel M, Picciani RG, Lee RK, Bhattacharya SK. Aqueous humor dynamics: a review. Open Ophthalmol J. 2010; 4: 52–59. [DOI] [PMC free article] [PubMed] [Google Scholar]
- 4. Fautsch MP, Johnson DH. Aqueous humor outflow: what do we know? Where will it lead us? Invest Ophthalmol Vis Sci. 2006; 47(10): 4181–4187. [DOI] [PMC free article] [PubMed] [Google Scholar]
- 5. Alvarado J, Murphy C, Juster R. Trabecular meshwork cellularity in primary open-angle glaucoma and nonglaucomatous normals. Ophthalmology. 1984; 91(6): 564–579. [DOI] [PubMed] [Google Scholar]
- 6. Baleriola J, Garcia-Feijoo J, Martinez-de-la-Casa JM, Fernandez-Cruz A, de la Rosa EJ, Fernandez-Durango R. Apoptosis in the trabecular meshwork of glaucomatous patients. Mol Vis. 2008; 14: 1513–1516. [PMC free article] [PubMed] [Google Scholar]
- 7. Gonzalez P, Epstein DL, Luna C, Liton PB. Characterization of free-floating spheres from human trabecular meshwork (HTM) cell culture in vitro. Exp Eye Res. 2006; 82(6): 959–967. [DOI] [PMC free article] [PubMed] [Google Scholar]
- 8. Liton PB, Liu X, Stamer WD, Challa P, Epstein DL, Gonzalez P. Specific targeting of gene expression to a subset of human trabecular meshwork cells using the chitinase 3-like 1 promoter. Invest Ophthalmol Vis Sci. 2005; 46(1): 183–190. [DOI] [PMC free article] [PubMed] [Google Scholar]
- 9. Llobet A, Gasull X, Gual A. Understanding trabecular meshwork physiology: a key to the control of intraocular pressure?. News Physiol Sci. 2003; 18: 205–209. [DOI] [PubMed] [Google Scholar]
- 10. Buller C, Johnson DH, Tschumper RC. Human trabecular meshwork phagocytosis. Observations in an organ culture system. Invest Ophthalmol Vis Sci. 1990; 31(10): 2156–2163. [PubMed] [Google Scholar]
- 11. Sherwood ME, Richardson TM. Phagocytosis by trabecular meshwork cells: sequence of events in cats and monkeys. Exp Eye Res. 1988; 46(6): 881–895. [DOI] [PubMed] [Google Scholar]
- 12. Bradley JM, Kelley MJ, Rose A, Acott TS. Signaling pathways used in trabecular matrix metalloproteinase response to mechanical stretch. Invest Ophthalmol Vis Sci. 2003; 44(12): 5174–5181. [DOI] [PubMed] [Google Scholar]
- 13. De Groef L, Van Hove I, Dekeyster E, Stalmans I, Moons L. MMPs in the trabecular meshwork: promising targets for future glaucoma therapies?. Invest Ophthalmol Vis Sci. 2013; 54(12): 7756–7763. [DOI] [PubMed] [Google Scholar]
- 14. Ishikawa M, Yoshitomi T, Zorumski CF, Izumi Y. Experimentally induced mammalian models of glaucoma. Biomed Res Int. 2015; 2015: 281214. [DOI] [PMC free article] [PubMed] [Google Scholar]
- 15. Shareef SR, Garcia-Valenzuela E, Salierno A, Walsh J, Sharma SC. Chronic ocular hypertension following episcleral venous occlusion in rats. Exp Eye Res. 1995; 61(3): 379–382. [DOI] [PubMed] [Google Scholar]
- 16. Morrison JC, Moore CG, Deppmeier LM, Gold BG, Meshul CK, Johnson EC. A rat model of chronic pressure-induced optic nerve damage. Exp Eye Res. 1997; 64(1): 85–96. [DOI] [PubMed] [Google Scholar]
- 17. Weber AJ, Zelenak D. Experimental glaucoma in the primate induced by latex microspheres. J Neurosci Methods. 2001; 111(1): 39–48. [DOI] [PubMed] [Google Scholar]
- 18. Gaasterland D, Kupfer C. Experimental glaucoma in the rhesus monkey. Invest Ophthalmol. 1974; 13(6): 455–457. [PubMed] [Google Scholar]
- 19. Zhang Z, Dhaliwal AS, Tseng H, et al.. Outflow tract ablation using a conditionally cytotoxic feline immunodeficiency viral vector. Invest Ophthalmol Vis Sci. 2014; 55(2): 935–940. [DOI] [PMC free article] [PubMed] [Google Scholar]
- 20. Senatorov V, Malyukova I, Fariss R, et al.. Expression of mutated mouse myocilin induces open-angle glaucoma in transgenic mice. J Neurosci. 2006; 26(46): 11903–11914. [DOI] [PMC free article] [PubMed] [Google Scholar]
- 21. Zode GS, Kuehn MH, Nishimura DY, et al.. Reduction of ER stress via a chemical chaperone prevents disease phenotypes in a mouse model of primary open angle glaucoma. J Clin Invest. 2011; 121(9): 3542–3553. [DOI] [PMC free article] [PubMed] [Google Scholar]
- 22. Tamm ER. Myocilin and glaucoma: facts and ideas. Prog Retin Eye Res. 2002; 21(4): 395–428. [DOI] [PubMed] [Google Scholar]
- 23. Abu-Hassan DW, Li X, Ryan EI, Acott TS, Kelley MJ. Induced pluripotent stem cells restore function in a human cell loss model of open-angle glaucoma. Stem Cells. 2015; 33(3): 751–761. [DOI] [PMC free article] [PubMed] [Google Scholar]
- 24. Bhattacharya SK, Gabelt BT, Ruiz J, Picciani R, Kaufman PL. Cochlin expression in anterior segment organ culture models after TGFbeta2 treatment. Invest Ophthalmol Vis Sci. 2009; 50(2): 551–559. [DOI] [PMC free article] [PubMed] [Google Scholar]
- 25. Bachmann B, Birke M, Kook D, Eichhorn M, Lutjen-Drecoll E. Ultrastructural and biochemical evaluation of the porcine anterior chamber perfusion model. Invest Ophthalmol Vis Sci. 2006; 47(5): 2011–2020. [DOI] [PubMed] [Google Scholar]
- 26. Erickson-Lamy K, Rohen JW, Grant WM. Outflow facility studies in the perfused human ocular anterior segment. Exp Eye Res. 1991; 52(6): 723–731. [DOI] [PubMed] [Google Scholar]
- 27. Johnson DH, Tschumper RC. The effect of organ culture on human trabecular meshwork. Exp Eye Res. 1989; 49(1): 113–127. [DOI] [PubMed] [Google Scholar]
- 28. Johnson DH, Tschumper RC. Human trabecular meshwork organ culture. A new method. Invest Ophthalmol Vis Sci. 1987; 28(6): 945–953. [PubMed] [Google Scholar]
- 29. Mao WM, Tovar-Vidales T, Yorio T, Wordinger RJ, Clark AF. Perfusion-cultured bovine anterior segments as an ex vivo model for studying glucocorticoid-induced ocular hypertension and glaucoma. Invest Ophthalmol Vis Sci. 2011; 52(11): 8068–8075. [DOI] [PMC free article] [PubMed] [Google Scholar]
- 30. Snider EJ, Kubelick KP, Tweed K, et al.. Improving stem cell delivery to the trabecular meshwork using magnetic nanoparticles. Sci Rep. 2018; 8(1): 12251. [DOI] [PMC free article] [PubMed] [Google Scholar]
- 31. Stamer WD, Seftor RE, Williams SK, Samaha HA, Snyder RW. Isolation and culture of human trabecular meshwork cells by extracellular matrix digestion. Curr Eye Res. 1995; 14(7): 611–617. [DOI] [PubMed] [Google Scholar]
- 32. Snider EJ, Vannatta RT, Schildmeyer L, Stamer WD, Ethier CR. Characterizing differences between MSCs and TM cells: towards autologous stem cell therapies for the glaucomatous trabecular meshwork. J Tissue Eng Regen Med. 2018; 12(3): 695–704. [DOI] [PubMed] [Google Scholar]
- 33. Livak KJ, Schmittgen TD. Analysis of relative gene expression data using real-time quantitative PCR and the 2(-Delta Delta C(T)) method. Methods. 2001; 25(4): 402–408. [DOI] [PubMed] [Google Scholar]
- 34. O'Brien J, Wilson I, Orton T, Pognan F. Investigation of the Alamar Blue (resazurin) fluorescent dye for the assessment of mammalian cell cytotoxicity. Eur J Biochem. 2000; 267(17): 5421–5426. [DOI] [PubMed] [Google Scholar]
- 35. Gagen D, Filla MS, Clark R, Liton P, Peters DM. Activated alphavbeta3 integrin regulates alphavbeta5 integrin-mediated phagocytosis in trabecular meshwork cells. Invest Ophthalmol Vis Sci. 2013; 54(7): 5000–5011. [DOI] [PMC free article] [PubMed] [Google Scholar]
- 36. Dismuke WM, Liang J, Overby DR, Stamer WD. Concentration-related. effects of nitric oxide and endothelin-1 on human trabecular meshwork cell contractility. Exp Eye Res. 2014; 120: 28–35. [DOI] [PMC free article] [PubMed] [Google Scholar]
- 37. Chen B, Platt MO. Multiplex zymography captures stage-specific activity profiles of cathepsins K, L, and S in human breast, lung, and cervical cancer. J Transl Med. 2011; 9: 109. [DOI] [PMC free article] [PubMed] [Google Scholar]
- 38. Raykin J, Snider E, Bheri S, Mulvihill J, Ethier CR. A modified gelatin zymography technique incorporating total protein normalization. Anal Biochem. 2017; 521: 8–10. [DOI] [PubMed] [Google Scholar]
- 39. Morikawa S, Sato A, Ezaki T. A simple, one-step polychromatic staining method for epoxy-embedded semithin tissue sections. Microscopy (Oxf). 2018; 67(6): 331–344. [DOI] [PMC free article] [PubMed] [Google Scholar]
- 40. Swaminathan SS, Oh DJ, Kang MH, Rhee DJ. Aqueous outflow: segmental and distal flow. J Cataract Refract Surg. 2014; 40(8): 1263–1272. [DOI] [PMC free article] [PubMed] [Google Scholar]
- 41. Chang JY, Folz SJ, Laryea SN, Overby DR. Multi-scale analysis of segmental outflow patterns in human trabecular meshwork with changing intraocular pressure. J Ocul Pharmacol Ther. 2014; 30(2-3): 213–223. [DOI] [PubMed] [Google Scholar]
- 42. Macdonald JM, Geroski DH, Edelhauser HF. Effect of inflammation on the corneal endothelial pump and barrier. Curr Eye Res. 1987; 6(9): 1125–1132. [DOI] [PubMed] [Google Scholar]
- 43. Philipp W, Speicher L, Humpel C. Expression of vascular endothelial growth factor and its receptors in inflamed and vascularized human corneas. Invest Ophthalmol Vis Sci. 2000; 41(9): 2514–2522. [PubMed] [Google Scholar]
- 44. Joyce NC, Harris DL, Zhu CC. Age-related gene response of human corneal endothelium to oxidative stress and DNA damage. Invest Ophthalmol Vis Sci. 2011; 52(3): 1641–1649. [DOI] [PMC free article] [PubMed] [Google Scholar]
- 45. Li DQ, Pflugfelder SC. Matrix metalloproteinases in corneal inflammation. Ocul Surf. 2005; 3(4 suppl): S198–S202. [DOI] [PubMed] [Google Scholar]
- 46. Zhu W, Gramlich OW, Laboissonniere L, et al.. Transplantation of iPSC-derived TM cells rescues glaucoma phenotypes in vivo. Proc Natl Acad Sci USA. 2016; 113(25): E3492–E3500. [DOI] [PMC free article] [PubMed] [Google Scholar]
- 47. Zhu W, Jain A, Gramlich OW, Tucker BA, Sheffield VC, Kuehn MH. Restoration of aqueous humor outflow following transplantation of iPSC-derived trabecular meshwork cells in a transgenic mouse model of glaucoma. Invest Ophthalmol Vis Sci. 2017; 58(4): 2054–2062. [DOI] [PMC free article] [PubMed] [Google Scholar]
- 48. Clopton DA, Saltman P. Low-level oxidative stress causes cell-cycle specific arrest in cultured cells. Biochem Biophys Res Commun. 1995; 210(1): 189–196. [DOI] [PubMed] [Google Scholar]
- 49. Sacca SC, Pascotto A, Camicione P, Capris P, Izzotti A. Oxidative DNA damage in the human trabecular meshwork: clinical correlation in patients with primary open-angle glaucoma. Arch Ophthalmol. 2005; 123(4): 458–463. [DOI] [PubMed] [Google Scholar]
- 50. Yu AL, Fuchshofer R, Kampik A, Welge-Lussen U. Effects of oxidative stress in trabecular meshwork cells are reduced by prostaglandin analogues. Invest Ophthalmol Vis Sci. 2008; 49(11): 4872–4880. [DOI] [PubMed] [Google Scholar]
- 51. Zhao J, Wang S, Zhong W, Yang B, Sun L, Zheng Y. Oxidative stress in the trabecular meshwork (Review). Int J Mol Med. 2016; 38(4): 995–1002. [DOI] [PubMed] [Google Scholar]
- 52. Tanito M, Kaidzu S, Takai Y, Ohira A. Association between systemic oxidative stress and visual field damage in open-angle glaucoma. Sci Rep. 2016; 6: 25792. [DOI] [PMC free article] [PubMed] [Google Scholar]
- 53. Knepper PA, Goossens W, Palmberg PF. Glycosaminoglycan stratification of the juxtacanalicular tissue in normal and primary open-angle glaucoma. Invest Ophthalmol Vis Sci. 1996; 37(12): 2414–2425. [PubMed] [Google Scholar]
- 54. Izzotti A, Sacca SC, Longobardi M, Cartiglia C. Sensitivity of ocular anterior chamber tissues to oxidative damage and its relevance to the pathogenesis of glaucoma. Invest Ophthalmol Vis Sci. 2009; 50(11): 5251–5258. [DOI] [PubMed] [Google Scholar]
- 55. Alvarado J, Murphy C, Polansky J, Juster R. Age-related changes in trabecular meshwork cellularity. Invest Ophthalmol Vis Sci. 1981; 21(5): 714–727. [PubMed] [Google Scholar]
- 56. Vranka JA, Bradley JM, Yang YF, Keller KE, Acott TS. Mapping molecular differences and extracellular matrix gene expression in segmental outflow pathways of the human ocular trabecular meshwork. PLoS One. 2015; 10(3): e0122483. [DOI] [PMC free article] [PubMed] [Google Scholar]
- 57. Matsumoto Y, Johnson DH. Trabecular meshwork phagocytosis in glaucomatous eyes. Ophthalmologica. 1997; 211(3): 147–152. [DOI] [PubMed] [Google Scholar]
- 58. Zhang X, Ognibene CM, Clark AF, Yorio T. Dexamethasone inhibition of trabecular meshwork cell phagocytosis and its modulation by glucocorticoid receptor beta. Exp Eye Res. 2007; 84(2): 275–284. [DOI] [PMC free article] [PubMed] [Google Scholar]
- 59. Abe K, Saito H. Both oxidative stress-dependent and independent effects of amyloid beta protein are detected by 3-(4,5-dimethylthiazol-2-yl)-2,5-diphenyltetrazolium bromide (MTT) reduction assay. Brain Res. 1999; 830(1): 146–154. [DOI] [PubMed] [Google Scholar]
- 60. Lombardo E, Sabellico C, Hájek J, et al.. Protection of cells against oxidative stress by nanomolar levels of hydroxyflavones indicates a new type of intracellular antioxidant mechanism. PLoS One . 2013; 8(4): e60796. [DOI] [PMC free article] [PubMed] [Google Scholar]
- 61. Mhlanga P, Perumal PO, Somboro AM, Amoako DG, Khumalo HM, Khan RB. Mechanistic insights into oxidative stress and apoptosis mediated by tannic acid in human liver hepatocellular carcinoma cells. Int J Mol Sci. 2019; 20(24): 6145. [DOI] [PMC free article] [PubMed] [Google Scholar]
- 62. Yedjou CG, Tchounwou PB. In vitro assessment of oxidative stress and apoptotic mechanisms of garlic extract in the treatment of acute promyelocytic leukemia. J Cancer Sci Ther. 2012; 2012(suppl 3): 6. [DOI] [PMC free article] [PubMed] [Google Scholar]
- 63. Chang HN, Pang J-HS, Chen CPC, et al.. The effect of aging on migration, proliferation, and collagen expression of tenocytes in response to ciprofloxacin. J Orthop Res. 2012; 30(5): 764–768. [DOI] [PubMed] [Google Scholar]
- 64. Jiang SY, Shu R, Xie YF, Zhang SY. Age-related changes in biological characteristics of human alveolar osteoblasts. Cell Prolif. 2010; 43(5): 464–470. [DOI] [PMC free article] [PubMed] [Google Scholar]
- 65. Tuck MW, Crick RP. The age distribution of primary open angle glaucoma. Ophthalmic Epidemiol. 1998; 5(4): 173–183. [DOI] [PubMed] [Google Scholar]
- 66. Ye J, Coulouris G, Zaretskaya I, Cutcutache I, Rozen S, Madden TL. Primer-BLAST: a tool to design target-specific primers for polymerase chain reaction. BMC Bioinformatics. 2012; 13: 134. [DOI] [PMC free article] [PubMed] [Google Scholar]
Associated Data
This section collects any data citations, data availability statements, or supplementary materials included in this article.