

Abstract
Background
The etiology and pathophysiology of hypertensive disorders of pregnancy remains enigmatic, and till date, no test can accurately predict it. Early screening may allow vigilant antenatal surveillance, timely delivery and thus substantially reduce maternal and perinatal morbidity and mortality. Our study aims to evaluate the predictive value of uterine artery mean pulsatility index (PI) at 11–14 weeks and find a reference value for hypertensive disorders of pregnancy.
Methods
A prospective study of 240 antenatal women using non-probability simple random sampling was carried out in a tertiary care center. Mean uterine artery PI was obtained at 11–14 weeks of gestation. Pregnancies were followed till delivery and 7 days postpartum. The major end point was development of hypertensive disorders of pregnancy. Maternal and neonatal outcomes were also assessed.
Results
The predictability of uterine artery mean pulsatility index (PI) at 11–14 weeks for hypertensive disorders of pregnancy was significantly high with an odds ratio of 174.45 (95% CI 65.31–549.13; p < 0.0001), sensitivity (89.3%), specificity (95.8%), positive predictive value(90.5%) and negative predictive value (95.1%).
Conclusion
Uterine artery mean PI at 11–14 weeks of gestation is a cost-effective predictive test for hypertensive disorders of pregnancy, and the recommended reference value for Indian population of is 2.28.
Keywords: Uterine artery pulsatility Index, Hypertensive disorders of pregnancy, Predictor, Prospective study
Introduction
Hypertensive disorders of pregnancy are one of the most prevalent obstetric complications associated with high rates of maternal and perinatal morbidity and mortality [1]. Hypertension (14%) ranks second in causing maternal mortality, preceded only by hemorrhage (27%) [2]. The etiology of it is still largely unknown. The pathology is probably present from first trimester, but the symptoms generally surface in late second to third trimester.
Pregnancy-related hypertensive disorders are thought to be a consequence of impaired trophoblastic invasion of the maternal spiral arteries, resulting in maintenance vessels of high resistance, inadequate placental perfusion, tissue injury and increased production of vasoconstrictive substances. The result is abnormal uteroplacental blood flow which led to the idea of uterine artery Doppler as screening method [3]. Uterine artery Doppler is a noninvasive method used to assess earliest changes in the uteroplacental circulation [4]. The principle is that impedance to uterine artery flow velocimetry increases as pregnancy progresses probably due to abnormal placentation. It is a reliable, safe, rapid, easily reproducible tool and also can be performed along with nuchal translucency scan.
Reduction of maternal and perinatal mortality and morbidity due to hypertensive disorders of pregnancy by early prediction should be a priority. Despite extensive research, the etiology and pathophysiology remain enigmatic. Studies till date have been done on low-risk women, and there is a paucity of Indian studies reflecting predictive and reference value of uterine artery mean pulsatility index (PI) for hypertensive disorders of pregnancy.
So, our study aims to evaluate uterine artery PI as a predictor of hypertensive disorders of pregnancy at 11–14 weeks of gestation and find an Indian reference value.
Materials and Methods
This prospective observational study of 240 antenatal women between 11 and 14 weeks of gestation was carried out in a tertiary care center over 2 years (November 2017–October 2019) using non-probability simple random sampling technique after obtaining permission from Institutional ethics committee and informed consent from subjects. Women had regular antenatal visits (first within 12 weeks, second 20 weeks, third 26 weeks, fourth around 30 weeks, fifth around 34 weeks, sixth at 36 weeks, seventh and eighth weekly or if the patient is symptomatic or has raised blood pressure).
Antenatal women (primigravidae/multigravidae) with singleton/multifetal pregnancy, diabetes mellitus, chronic hypertension, renal disease, antiphospholipid antibody syndrome, thrombophilia were included (both high risk and low risk). Women who were not willing for regular antenatal follow up and to get delivered at our institution were excluded from the study.
Referring to data by Saloni et al. [5], the resulting effect size was 0.789. However, we consider a more stringent effect size of 0.4. Accordingly, the minimum number of hypertensive women needed in the study will be 75, which can provide the desired effect with 95% confidence and 80% power. Accordingly, the number of non-preeclampsia cases in the study will be 150. The formula used for estimating the sample size is:
where z1−α/2: standard normal value for 5% level, z1−β: standard normal value for 20% error, and ε: effect size, i.e., difference between mean PI of two groups with respect to standard deviation. Subsequently, during the study, 15 more normotensive cases were considered resulting in a sample size of 240.
Women were critically evaluated for gestational age depending upon last menstrual period, menstrual cycle regularity or early ultrasound scan. Detailed history and physical examination were performed.
Blood pressure was recorded in every antenatal visit by mercury manometer in sitting position with arm at the level of the heart and repeated after 10 min of rest. Systolic pressure and diastolic pressure were recorded where sounds were first heard (Korotkoff I) and disappeared (Korotkoff V), respectively, and mean arterial pressure was calculated. (Women were instructed to maintain home blood pressure records and to follow-up if raised BP was noted which was confirmed at the institute.)
Uterine Artery Doppler (mean PI between 11 and 14 weeks) evaluation: Data were collected by (E-saote MyLab 40-6058) machine with convex probe 2–5 MHZ. The external iliac artery was visualized at pelvic side wall, and transducer was angled medially towards the uterine artery. After the identification of each uterine artery, pulsed wave doppler was used with sampling gate of 2 mm. Uterine Artery was examined with the angle of insonation < 30° and the peak systolic velocity > 60 cm/s. When three similar waveforms were obtained consecutively, the mean PI of the left and right arteries was calculated. The reference value of raised mean uterine artery PI for prediction of hypertensive disorders of pregnancy at 11–14 weeks of gestation was considered as 2.3 according to the study by Martin et al. [6]. Hypertensive women were started on aspirin 1–1.5 mg/kg body weight till 34 weeks and managed accordingly.
The data on various demographic and clinical parameters were summarized, and the continuous parameters were expressed in terms of mean and standard deviation, while categorical parameters were expressed using frequency and percentage. The distribution of women according to socio-demographic, clinical parameters and means of continuous parameters in hypertensive and normotensive groups were compared for statistical significance using Pearson’s Chi-square test and t test for independent samples, respectively. The diagnostic evaluation of PI was done in terms of sensitivity, specificity, positive predictive value and negative predictive value. The 95th percentile value of the index was obtained and tested for diagnostic accuracy of hypertension. Also, the receiver operating characteristic (ROC) analysis was performed to determine the optimal cutoff value for hypertensive disorders of pregnancy. The odds ratio, as a measure of risk of outcome, associated with the cutoff value of PI was also obtained along with 95% confidence intervals. All the analyses were performed using SPSS version 20.0 (IBM Corp), and the statistical significance was tested at 5% level.
Observations
In total, 240 antenatal women in the study were followed till delivery and 7 days postpartum to assess predictability of raised uterine artery mean pulsatility index (PI > 2.3) at 11–14 weeks for hypertensive disorders of pregnancy. The major end point was development of hypertensive disorders of pregnancy.
Of 240 women, 75 (31.25%) developed hypertension [10.41%: non-severe preeclampsia, 9.16%: severe preeclampsia, 2.91%: eclampsia]. Mean age of women with hypertensive disorders of pregnancy was 26.65 ± 4.06 years and in normotensive group was 25.78 ± 3.70 years. In total, 152 (92.12%) normotensive and 5 (6.65%) hypertensive women during pregnancy did not have pedal edema as compared to 70 (93.34%) women with hypertensive disorders of pregnancy who had pedal edema. Only 13 of 165 normotensive women had pedal edema as compared to 70 of the 75 hypertensive women. Normal deep tendon (DTR) and absence of premonitory signs and symptoms were significantly higher in normotensive women (99.39%) as compared to hypertensive women (76%). Two (2.67) cases belonging to hypertensive disorders of pregnancy had brisk DTR and presence of premonitory signs and symptoms.
The high-risk factor leading to hypertensive disorder of pregnancy was obesity 42 cases (56%) as compared to only 32 cases (19.39%) women in normotensive group. The other risk factor was obesity with hypothyroidism 8 cases (10.67%) as compared to 9(5.45%) cases in normotensive group. Other associated high-risk factors like hypothyroidism, gestational diabetes mellitus and multiple gestation were less than 5% (P < 0.0001 using Chi-square test).
The mean uterine artery PI at 11–14 weeks of gestation in women developing hypertension was 1.64 as compared mean PI-1.08 in normotensive women (P < 0.0001). Out of the 76 women with raised mean uterine artery PI, 69 developed hypertension (Table 1).
Table 1.
Distribution according to uterine artery mean PI at 11–14 weeks of gestation
| Parameter | Women with hypertension (n = 75) | Normotensive women (n = 165) | P value | ||
|---|---|---|---|---|---|
| Mean | SD | Mean | SD | ||
| PI | 1.64 | 0.32 | 1.08 | 0.87 | < 0.0001 |
| Distribution according to mean uterine artery PI | Raised PI (> 2.3) | Normal PI (< 2.3) | Raised PI (> 2.3) | Normal PI (< 2.3) | |
| 69 | 6 | 7 | 158 | ||
As per the receiver operating characteristic, the cutoff value for mean PI at 11–14 weeks of gestation in hypertensive pregnant women was 2.28 and area under the curve was 92.6% (Fig. 1).
Fig. 1.
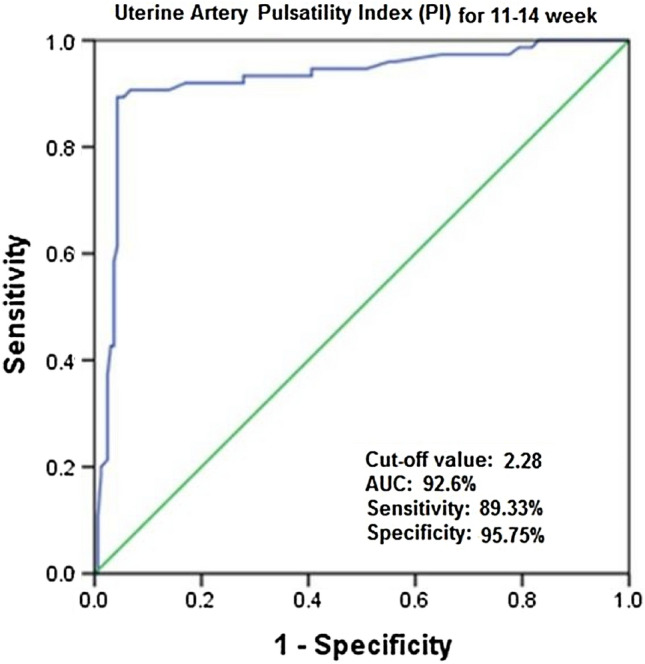
ROC plot for uterine artery mean PI at 11–14 week in diagnosing hypertensive disorders of pregnancy
The proportion of cases with cesarean section in the hypertensive group (72%) was significantly higher than normotensive group (44.85%) (P < 0.0001 using the Chi-square test). In total, 50 (45.457%) women underwent cesarean section for fetal distress and 30 (24.01%) women with previous cesarean section who were not willing for VBAC. The remaining indications such as breech presentation in primigravida eclampsia, women with previous 2 cesarean section in labor, contracted pelvis, non-progress of labor were < 10%.
Maternal outcomes in hypertensive and normotensive groups were statistically significant. The proportion of maternal complications like preterm labor (29.34%), partial HELLP* syndrome (hemolysis, elevated liver enzymes, low platelet) (2.67%), abruptio placentae (1.34%) and DIC (4%) were significantly higher in hypertensive than normotensive women. The NICU admission (for respiratory distress, hyperbilirubinemia, low birth weight) and intrauterine death were significantly higher (P value < 0.0001 using Chi-square test) in the hypertensive group as compared to the normotensive group (Table 2).
Table 2.
Distribution according to maternal and fetal outcomes
| Maternal outcomes | Women with hypertension (n = 75) | Normotensive women (n = 165) | P value | ||
|---|---|---|---|---|---|
| No. | % | No. | % | ||
| Preterm labor | 22 | 29.34 | 13 | 7.87 | 0.0001 (S) |
| Preterm labor + postpartum hemorrhage (PPH) | 0 | 0 | 1 | 0.60 | |
| Partial HELLP* syndrome | 2 | 2.67 | 0 | 0 | |
| Preterm labor + abruptio placentae + PPH | 1 | 1.34 | 0 | 0 | |
| Preterm labor + abruptio placentae | 1 | 1.34 | 0 | 0 | |
| Preterm + disseminated intravascular coagulopathy (DIC) | 3 | 4 | 0 | 0 | |
| NAD | 46 | 61.34 | 151 | 91.51 | |
| Fetal outcomes | |||||
| Normal | 39 | 52.00 | 144 | 87.27 | < 0.0001 (S) |
| NICU admission | 27 | 36.00 | 19 | 11.52 | |
| Intrauterine death | 8 | 10.67 | 0 | 0.00 | |
| Neonatal death | 1 | 1.33 | 2 | 1.21 | |
At 1 min and 5 min, the distribution of women was significantly different in two groups with a P value < 0.0001 using the Chi-square test. The proportion of cases with APGAR score < 7 in the hypertension group was significantly higher than that of the normal group (Table 3).
Table 3.
Distribution according to APGAR (appearance, pulse, grimace, activity and respiration)
| APGAR | Score | Women with hypertension (n = 75) | Normotensive women (n = 165) | P value | ||
|---|---|---|---|---|---|---|
| No. | % | No. | % | |||
| At 1 min | < 7 | 13 | 17.33 | 1 | 0.61 | < 0.001 (S) |
| ≥ 7 | 62 | 82.67 | 164 | 99.39 | ||
| At 5 min | < 7 | 11 | 14.67 | 0 | 0.00 | < 0.001 (S) |
| ≥ 7 | 64 | 85.33 | 165 | 100.00 | ||
The risk of hypertension was significantly higher with an OR of 174.45 (P < 0.0001, the sensitivity of cutoff was 89.3%, specificity was higher, i.e., 95.8 (Table 4).
Table 4.
Odds ratio and diagnostic evaluation of various outcomes based on PI at 11–14 weeks of gestation
| Outcome | Normal (n = 166) | Abnormal (n = 74) | Odds ratio | 95% CI | P value | Sensitivity (%) | Specificity (%) | PPV (%) | NPV (%) |
|---|---|---|---|---|---|---|---|---|---|
| Hypertension | 67 | 174.45 | 65.31–549.13 | < 0.0001 | 89.3 | 95.8 | 90.5 | 95.1 |
Discussion
In our study, the frequency of hypertensive disorders of pregnancy was 31.25% similar to studies by Yousuf et al. [7] (25.37%) and Varma et al. [8] (30.76%). Rosiane Maciel Scandiuzzi et al. [9] (9.2%) reported a low frequency. High frequency in our study is due to inclusion of high-risk pregnancies. Non-severe preeclampsia comprised of 10.41% cases, severe preeclampsia cases were 9.16%, gestational hypertension cases were 8.75%, and eclampsia cases were 2.91%, similar to study by Saloni et al. [5] (preeclampsia 16.5%, gestational hypertension 6%).
Between 21 and 30 years of age, 63 cases (84%) were hypertensive and 139 cases were (84.24%) normotensive. In the present study, mean age of women with hypertensive disorder of pregnancy was 26.65 ± 4.06 years and 25.78 ± 3.70 in normotensive women. In foreign studies like Scandiuzzi et al. [9] (20–34 years) and Indian studies like Kore et al. [10] [21–25 years (7.5%)], Yousuf et al. [7] [19–30 years (25.4%)], the mean age of women with hypertensive disorder of pregnancy is higher probably due to late marriages. In total, 40 (53.33%) multigravidae as compared to 80 (48.48%) primigravida developed hypertension. Kore et al. [10] (20.68%) and Scandiuzzi et al. [9] (56.3%) mentioned that primigravidae developed hypertensive disorder of pregnancy. Our study included high-risk pregnancies leading to hypertension majorly among multigravidae. The body mass index (BMI) in hypertensives by Plasencia et al. [11] (27.9 kg/m2) was comparable to our study (29.02 kg/m2).
In our study, the sensitivity of mean uterine artery doppler at 11–14 weeks gestation was 89.3%, specificity was 95.8%, PPV was 90.5%, NPV was 95.1% and p value <0.001 (statistically significant). Unlike our results, study by Scandiuzzi et al. [9] had very low values [sensitivity (13.33%), specificity (94.55%), PPV (20%), NPV (91.44%) and P < 0.01(S)]. The value of mean uterine artery PI in our study at 11–14 weeks gestation was 2.44 ± 0.43 in women who developed hypertension during pregnancy. The P value (< 0.0001) was similar to study by Saloni et al. [5] [10–22 + 6 weeks (0.84 ± 0.28)].
According to our study, AUC of mean uterine PI for hypertensive disorders of pregnancy at 11–14 weeks of gestation was 92.6% indicating excellent ability to diagnose hypertension. The cutoff value of 2.28 could provide an excellent discrimination of hypertensive and non-hypertensive cases. It was comparable to study by Saloni et al. [5] (AUC-94.5%) to diagnose early preeclampsia.
The proportion of cesarean section in our study among hypertensives (72%) was significantly higher than normotensive group (44.85%) [P < 0.0001]. Similar study by Scandiuzzi et al. [9] had higher cesarean section in hypertensive group (53.3%) than normotensive group (38.77%) for dystocia [27(16.67%)], maternal indication [20(12.34%)] and fetal indications [18(11.11%)].
Proportion of cases with APGAR score < 7 in the hypertension group was statistically significant than normotensive group. Scandiuzzi et al. [9] showed similar results with higher proportion of cases with APGAR < 7 in hypertensive group of 28.2% and 3.3% at 1 min and 5 min, respectively.
In our study, neonatal intensive care unit admission (NICU) (36%) and intrauterine death (10.67%) were significantly higher in hypertensive than normotensive group (11.52% and 0, respectively). Mean birth weight was 2.45 ± 0.65 kg in hypertensive and 2.6 ± 0.53 kg in normotensive group, in line with study by Saloni et al. [5] (mean birth weight in hypertensive was 2406 ± 393 gm and in normotensive − 2685 ± 376 gm). Study by Scandiuzzi et al. [9] had lesser NICU admission (6.1%) due to exclusion of high-risk pregnancies. Study by Varma et al. [8] concluded that uterine artery PI was higher in pregnancies with fetal growth restriction (n = 21, i.e., 31.2%) and low birth weight (n = 39).
Conclusions
Hypertensive disorders of pregnancy are still less understood. Our study concludes that frequency of hypertensive disorders of pregnancy at a tertiary care hospital was 31.25%. The predictive value of uterine artery mean PI at 11–14 weeks of gestation has better specificity and negative predictive value than sensitivity and positive predictive value. The reference value of mean uterine artery PI at 11–14 weeks of gestation recommended for Indian population to predict hypertensive disorders of pregnancy is 2.28. Over the last decade, there has been increased awareness of screening methods of hypertensive disorders of pregnancy. The art of good obstetric care involves balance between early diagnosis and timely intervention to prevent maternal and neonatal complications. So, mean uterine artery PI at 11–14 weeks gestation is the best noninvasive investigation to assess changes in uteroplacental hemodynamic for early prediction of development of hypertensive disorders in pregnancy. To provide new insight into screening and management of hypertensive disorders of pregnancy, we need to construct, validate and implement a screening protocol. There is enough evidence to suggest that high-risk preterm hypertensive disorders can be effectively predicted early and preventative measures can be taken to reduce the prevalence of this condition and its associated morbidity [12, 13].
Dr Trupti Shinde
is presently a third year resident of obstetrics and gynecology enrolled in and in good standing with an accredited medical college. She is a good clinician with an excellent academic front.
Compliance with Ethical standards
Conflict of interest
The authors declare that they have no conflict of interest.
Ethical approval
All procedures performed in studies involving human participants were in accordance with the ethical standards of the institution.
Footnotes
Dr Trupti Shinde, a third year resident of obstetrics and gynecology at NKP Salve Institute of Medical Sciences, Nagpur, India; Dr Anuja Bhalerao is a Professor MS OBGY at NKP Salve Institute of Medical Sciences, Nagpur, India.
Publisher's Note
Springer Nature remains neutral with regard to jurisdictional claims in published maps and institutional affiliations.
References
- 1.Redman CW, Sargent IL. Latest advances in understanding preeclampsia. Science. 2005;308(5728):1592–1594. doi: 10.1126/science.1111726. [DOI] [PubMed] [Google Scholar]
- 2.Say L, Chou D, Gemmill A, et al. Global causes of maternal death: a WHO systematic analysis. Lancet Glob Health. 2014;2(6):e323–e333. doi: 10.1016/S2214-109X(14)70227-X. [DOI] [PubMed] [Google Scholar]
- 3.Nagar T, Sharma D, Choudhary M, et al. The role of uterine and umbilical arterial doppler in high-risk pregnancy: a prospective observational study from India. Clin Med Insights Reprod Health; 2015, CMRH-S24048. [DOI] [PMC free article] [PubMed]
- 4.Jurkovic DA, Jauniaux ER, Kurjak AS, et al. Transvaginal color Doppler assessment of the uteroplacental circulation in early pregnancy. Obstet Gynecol. 1991;77(3):365–369. [PubMed] [Google Scholar]
- 5.Prajapati S, Maitra N. Prediction of pre-eclampsia by a combination of maternal history, uterine artery doppler, and mean arterial pressure (a prospective study of 200 cases) J Obstet Gynecol India. 2012;63(1):32–36. doi: 10.1007/s13224-012-0239-4. [DOI] [PMC free article] [PubMed] [Google Scholar]
- 6.Martin AM, Bindra R, Curcio P, et al. Screening for pre-eclampsia and fetal growth restriction by uterine artery Doppler at 11–14 weeks of gestation. Ultras Obstet Gynecol Off J Int Soc Ultras Obstet Gynecol. 2001;18(6):583–586. doi: 10.1046/j.0960-7692.2001.00594.x. [DOI] [PubMed] [Google Scholar]
- 7.Yousuf S, Ahmad A, Qadir S, et al. Utility of placental laterality and uterine artery Doppler abnormalities for prediction of preeclampsia. J Obstet Gynecol India. 2016;66(1):212–216. doi: 10.1007/s13224-015-0837-z. [DOI] [PMC free article] [PubMed] [Google Scholar]
- 8.Verma D, Gupta S. Prediction of adverse pregnancy outcomes using uterine artery Doppler imaging at 22-24 weeks of pregnancy: a North Indian experience. J Turk Soc Obst Gynecol. 2016;13(2):80–84. doi: 10.4274/tjod.55632. [DOI] [PMC free article] [PubMed] [Google Scholar]
- 9.Scandiuzzi RM, Prado CA, Araujo Júnior E, et al. Maternal uterine artery Doppler in the first and second trimesters as screening method for hypertensive disorders and adverse perinatal outcomes in low-risk pregnancies. Obstet Gynecol Sci. 2016;59(5):347–356. doi: 10.5468/ogs.2016.59.5.347. [DOI] [PMC free article] [PubMed] [Google Scholar]
- 10.Kore S, Khot R, Supe P, et al. Prediction of pre-eclampsia: role of placental laterality by ultrasonography. Int J Reprod Contracept Obstet Gynecol. 2016;2016:1433–1437. doi: 10.18203/2320-1770.ijrcog20161300. [DOI] [Google Scholar]
- 11.Plasencia W, Maiz N, Poon L, et al. Uterine artery Doppler at 11 + 0 to 13 + 6 weeks and 21 + 0 to 24 + 6 weeks in the prediction of pre-eclampsia. Ultras Obstet Gynecol Off J Int Soc Ultras Obstet Gynecol. 2008;32(2):138–146. doi: 10.1002/uog.5402. [DOI] [PubMed] [Google Scholar]
- 12.Mogra Ritu. Screening and prevention of pre-term pre-eclampsia: a prime time to act. Aust J Ultras Med. 2018;21:187–190. doi: 10.1002/ajum.12101. [DOI] [PMC free article] [PubMed] [Google Scholar]
- 13.Binder J, et al. De-novo abnormal uteroplacental circulation in third trimester: pregnancy outcome and pathological implications. Ultras Obstet Gynecol. 2018;52(1):60–65. doi: 10.1002/uog.17564. [DOI] [PubMed] [Google Scholar]