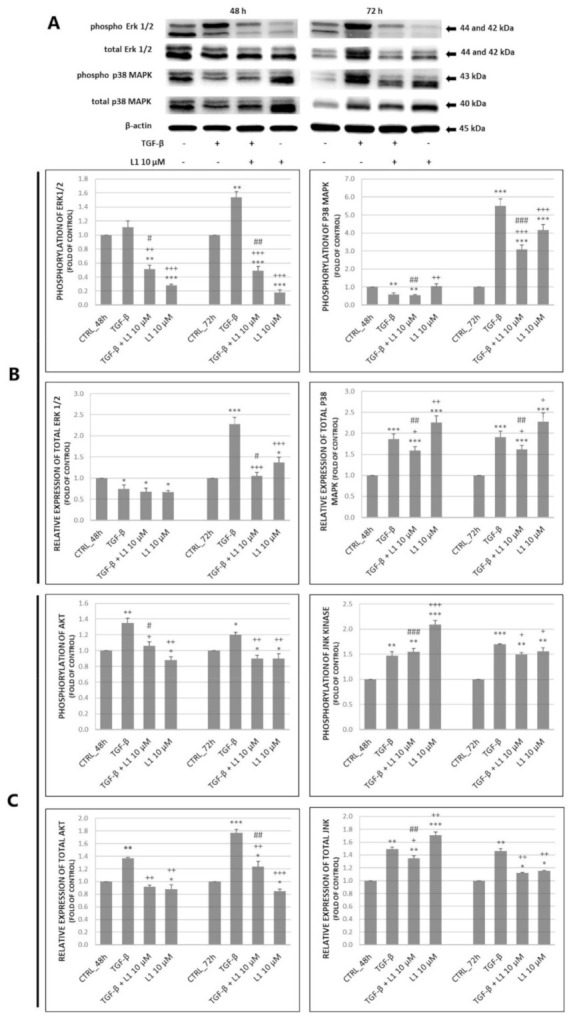
Figure 6.

Changes in expression of MAPK related proteins (A) along with corresponding densitometry analyses (B) of western blot results. Relative level of Akt phosphorylation obtained by flow cytometry (C). All after 48 h and 72 h of treatment. Representative data of three independent experiments are presented. Significantly different * p < 0.05, ** p < 0.01, *** p < 0.001 vs. untreated cells (control); + p < 0.05, ++ p < 0.01, +++ p < 0.001 vs. TGF-β; # p < 0.05, ## p < 0.01, ### p < 0.001 vs. L1.
