

Abstract
Mitochondrial dysfunction and tau aggregation occur in Alzheimer’s disease (AD) and exposing cells or rodents to mitochondrial toxins alters their tau. To further explore how mitochondria influence tau, we measured tau oligomer levels in human neuronal SH-SY5Y cells with different mitochondrial DNA (mtDNA) manipulations. Specifically, we analyzed cells undergoing ethidium bromide-induced acute mtDNA depletion, ρ0 cells with chronic mtDNA depletion, and cytoplasmic hybrid (cybrid) cell lines containing mtDNA from AD subjects. We found cytochrome oxidase activity was particularly sensitive to acute mtDNA depletion, evidence of metabolic re-programming in the ρ0 cells, and a relatively reduced mtDNA content in cybrids generated through AD subject mitochondrial transfer. In each case tau oligomer levels increased, and acutely depleted and AD cybrid cells also showed a monomer to oligomer shift. We conclude a cell’s mtDNA affects tau oligomerization. Overlapping tau changes across three mtDNA-manipulated models establishes the reproducibility of the phenomenon, and its presence in AD cybrids supports its AD-relevance.
Keywords: Alzheimer’s disease, mitochondria, mitochondrial DNA, oligomers, tau
Introduction
Alzheimer’s disease (AD) brains contain tau-derived neurofibrillary tangles (NFTs) and perturbed mitochondria [1, 2], and tau-mitochondria relationships exist. Hyperphosphorylated, caspase cleaved, or N-terminal fragment tau associate with mitochondria and impair their physiology [3–6]. Reciprocally, mitochondrial uncoupling or respiratory chain inhibition increases tau phosphorylation, alters tau mRNA splicing, and promotes tau aggregation [7–13].
While current data do not implicate a role for exogenous mitochondrial toxins in AD, data from cytoplasmic hybrid (cybrid) studies indicate mitochondrial DNA (mtDNA) does contribute to altered AD mitochondrial function [2, 14]. This raises the question of whether mtDNA-dependent mitochondrial parameters affect tau biology, as mtDNA-determined mitochondrial function is arguably more relevant to AD than exogenous toxin-driven mitochondrial dysfunction.
To address this question, we assessed the status of tau oligomers in human neuronal SH-SY5Y cells that modeled different mtDNA manipulations. Specifically, we analyzed cells undergoing ethidium bromide (EtBr)-induced acute mtDNA depletion, ρ0 cells with chronic mtDNA depletion, and cybrid cell lines containing mtDNA from AD subjects. Our focus was on tau oligomerization instead of phosphorylation because SH-SY5Y tau is extensively phosphorylated at baseline, tau oligomerization is an intermediate step in the tangle deposition pathway, and tau oligomers may themselves interact with mitochondria [15, 16]. To provide insight into functional overlap and differences across the models we further characterized select mitochondria-relevant endpoints.
Materials and Methods
ρ0 Cell Line, Cybrid Cell Lines, and Human Autopsy Brains
These studies used the mtDNA-depleted, human neuronal SH-SY5Y ρ0 cell line originally created by Miller et al. and further modified as described in Swerdlow et al. [17, 18]. The cybrid cell lines used in these studies were generated by transferring platelet mitochondria to SH-SY5Y ρ0 cells as previously described [18]. The platelet donors included human subjects diagnosed with AD or designated as cognitively normal (CN). All subjects were members of the University of Kansas Alzheimer’s Disease Research Center (KU ADRC) clinical cohort and AD or CN status was verified through longitudinal clinical and neuropsychological evaluations. The AD subjects met current McKhann et al. criteria [19]. The cybrid lines used in this study were generated by the KU ADRC Mitochondrial Genomics and Metabolism Core and include 11 cybrid lines created through AD subject platelet mitochondria transfer (“AD cybrids”), and 11 cybrid lines created through CN subject platelet mitochondria transfer (“CN cybrids”). The mean age of the AD mtDNA donors was 74±2.0, and for the CN mtDNA donors it was 71±2.2. Seven AD and 5 CN mtDNA donors were male.
The KU ADRC Neuropathology Core provided frozen frontal cortex obtained from rapid autopsies of 8 AD and 7 CN KU ADRC clinical cohort decedents. The mean age of the AD brain donors was 79±3.3, and for the CN brain donors it was 79±3.5. Five AD and 5 CN brain donors were male.
All human subjects who donated mtDNA to create cybrid lines provided informed consent. KU ADRC clinical cohort participants with AD are required to have a study partner and informed consent was further obtained from each subject’s study partner. For subjects who donated brains, a separate informed consent was obtained from the donor prior to death and from the donor’s study partner. All human participation protocols and consents were approved by the University of Kansas Institutional Review Board.
Cell Culture
Native human neuronal SH-SY5Y (ρ+) cells, EtBr-treated SH-SY5Y cells, and ρ0 SH-SY5Y cells were grown in 25mM glucose Dulbecco’s modified Eagle medium (DMEM) supplemented with 10% fetal bovine serum (FBS), 1% penicillin/streptomycin, 100 μg/mL sodium pyruvate, and 50 μg/mL uridine. For acute mtDNA depletion, EtBr (Millipore) was added to the cell culture medium at a concentration of 3 μg/mL. The EtBr-containing medium was made fresh just prior to treatment and changed daily. Cells were cultured in the presence of EtBr for 1, 3, or 7 days. Cybrid cell lines were cultured in 5 mM glucose DMEM supplemented with 10% FBS and 1% penicillin/streptomycin, and the medium was changed daily.
Cell Differentiation
We used a staurosporine protocol to differentiate SH-SY5Y cells [20]. Briefly, cells were cultured in media containing 6 nM staurosporine for 7 days. EtBr treatment occurred during differentiation, with the 3-day EtBr treatment beginning at differentiation day 4 and the 1-day EtBr treatment beginning at differentiation day 6.
Western Blot Immunochemistry
For whole cell lysate collection cells were seeded at similar confluency in 6-well dishes (Corning Costar #3516). The following day media was aspirated, cells were washed with phosphate buffered saline (PBS), and 150 μL radioimmunoprecipitation assay (RIPA) lysis buffer was added to each well. The RIPA lysis buffer contained 10 mM tris-Cl (pH 8.0), 1 mM EDTA, 0.5 mM EGTA, 1% Triton X-100, 0.1% sodium deoxycholate, 0.1% SDS, and 140 mM NaCl. Thermo Halt Protease and Phosphatase inhibitor cocktail (Thermo #1861284) was added just prior to use. Cells were lysed on ice via scraping and lysates were incubated on ice for 20 minutes. Lysates were then centrifuged at 8,000×g for 10 minutes. Protein levels were quantified using a BCA assay (Pierce #23225). Samples were boiled at 95°C for 10 minutes in Laemmli buffer. Protein lysates were separated via sodium dodecyl sulfate-polyacrylamide gel electrophoresis (SDS-PAGE) at a constant voltage in tris/glycine/SDS running buffer (BioRad #1610772). For most targets, pre-cast 4–15% Criterion gels were used. 25 μg protein was loaded per sample.
Protein was transferred to 0.45 μM polyvinylidene difluoride (PVDF) membranes (GE Amersham Hybond #10600023) in tris/glycine transfer buffer (BioRad #1610771) containing 20% methanol, at a constant current of 400 amps for 1 hour. Membranes were blocked for 1 hour at room temperature in 5% dry milk in tris buffered saline with Tween-20 (TBST) or 5% bovine serum albumin (BSA) (Boston BioProducts P-753) in TBST. Membranes were incubated overnight at 4°C in primary antibody diluted with 5% dry milk in TBST or 5% BSA in TBST. Membranes were incubated in secondary antibody for 1 hour at room temperature. Western blots were visualized using Supersignal West Femto Maximum Sensitivity Substrate (Thermo #34096) on a BioRad Chemidoc XRS+ imager. Table 1 lists the antibodies used in these studies.
Table 1.
Antibodies.
| Antibody | Dilution | Source |
|---|---|---|
| Tau Oligomeric Complex I (TOC1) | 1:10,000 | Dr. Nicholas Kanaan |
| Tau12 | 1:10,000 | Dr. T. Chris Gamblin |
| MtCO2 | 1:2,000 | Abcam (ab79393) |
| COX4I1 | 1:5,000 | Cell Signaling (CST4850) |
| NDUFB8 | 1:1,000 | Abcam (ab110242) |
| β-Actin | 1:4,000 | Cell Signaling (CST3700) |
| GSK3β | 1:1,000 | Cell Signaling (CST9315) |
| GSK3βser9 | 1:1,000 | Cell Signaling (CST5558) |
| Tau serine 199 phosphorylation | 1:10,000 | Abcam (ab81268) |
| Tyrosine Hydroxylase | 1:500 | Abcam (ab137869) |
| HRP Conjugated Goat anti-Mouse IgG | 1:4,000 | Invitrogen #A28177 |
| HRP Conjugated Goat anti-Rabbit IgG | 1:4,000 | Invitrogen #A27036 |
| HRP Conjugated Goat anti-Mouse IgM | 1:4,000 | Invitrogen #PA84383 |
Dot Blot Immunochemistry
Cells were grown to 95% confluency in 6-well dishes. Media was aspirated and cells were washed in PBS. Cells were lysed in NP40 buffer: 1% IGEPAL (NP40), 50 mM tris-HCl pH 8.0, 150 mM NaCl, and Halt protease and phosphatase inhibitor cocktail. The protein extracts were incubated on ice for 20 minutes, then centrifuged at 8,000×g for 10 minutes. Protein concentration was quantified via BCA assay. Lysates were diluted with water to a concentration of 0.5 μg/μL.
Brain tissue from the KU ADRC brain bank was lysed in a buffer containing 120 mM NaCl, 50 mM tris pH 8.0, and Halt protease and phosphatase inhibitor cocktail. 1 mL of ice-cold buffer was used per ~250 mg brain tissue. Samples were lysed by 10 strokes in a glass Dounce homogenizer. The samples were then centrifuged at 17,000×g for 20 minutes at 4°C and the resulting supernatant containing soluble protein was collected and used for dot blots. Prior to loading on a dot blot, protein was quantified via BCA assay and samples were diluted with water to a concentration of 0.5 μg/μL.
Our dot blot analysis used the TOC1 antibody (Table 1), which binds a unique tau conformation associated with soluble tau dimers and slightly larger oligomers [21, 22]; this study collectively refers to these soluble dimers and larger oligomers as tau oligomers. TOC1’s recognition of a specific conformational epitope necessitates the use of non-denaturing assays such as dot blots. Samples were loaded on 0.45 μm nitrocellulose membranes (GE #10600002), with 2 μg of protein lysate loaded per sample. Lysates were dotted onto the membrane 0.5 μL at a time, allowing samples to dry completely between applications. The blot was blocked in 5% milk in TBST for 1 hour at room temperature. Blots were incubated with primary antibody overnight at 4°C. Blots were incubated in secondary antibody for 1 hour at room temperature. The dot blots were visualized using SuperSignal West Pico Plus Chemiluminescent Subtrate (Thermo #34580) on a BioRad Chemidoc XRS+ imager. TOC1 density values were normalized to total protein measured by Amido Black, or to a density reading obtained with the Tau12 antibody. The Tau12 antibody recognizes a linear epitope in the amino terminus of tau (amino acids 9–18) and detects both monomer and oligomer tau [23].
DNA Analyses
Cells were plated in 6 well dishes. Prior to harvest the medium was aspirated and cells were washed with PBS. Genomic DNA preparation was performed as described previously [24]. The DNA was then quantified and diluted to a concentration of 5 ng/μL.
To quantify mtDNA:nuclear DNA ratios via quantitative PCR (qPCR), 2 μL of 5 ng/μL DNA was used per qPCR reaction for a total of 10 ng of DNA per reaction. mtDNA levels were measured using primers directed against MT-ND1 (forward primer: 5`-CCA CCT CTA GCC TAG CCG TTT-3`; reverse primer: 5`-TGT TTG GGC TAC TGC TCG C-3`). Nuclear DNA levels were measured using primers directed against β2M (forward primer: 5`-TGC TGT CTC CAT GTT TGA TGT ATC-3`; reverse primer: 5`-TCT CTG CTC CCC ACC TCT AAG T-3`). Cycling parameters were chosen based on the manufacturer’s recommendations provided with the Powerup SYBR Green Master Mix (Applied Biosystems #A25742). qPCR reactions were run on an Applied Biosystems Quantstudio 7 Flex using a 384 well plate (Applied Biosystems #4309849) or an Applied Biosystems StepOne Plus Real Time PCR system using a 96 well plate (Applied Biosystems #4346906). Relative fold change was calculated using the ΔΔCt method with β2M serving as the reference gene. We also performed a previously described assay that determines D-loop cycle thresholds [25].
RNA Analyses
Cells were seeded in 6-well dishes and grown to 95% confluency. Prior to RNA extraction the medium was aspirated, and cells were washed with sterile PBS. Cells were solubilized in 500 μL Trizol reagent (Ambion #15596018) and processed as described previously [26]. 1 μg of RNA was loaded for reverse transcription reactions, and cDNA generation was performed according to the manufacturer’s instructions using 5x iScript reverse transcription supermix (BioRad #1708840).
For Taqman-based qPCR, 2 μL of cDNA was used per reaction. We used Taqman primers to MAPT (Hs00902194_m1), COX4I1 (Hs00971639_m1), NDUFB8 (Hs00428204_m1), and 18s (Hs03003631_g1). Negative control reactions lacking complementary DNA (cDNA) were included on each plate. qPCR was run on an Applied Biosystems Quantstudio 7 Flex or Applied Biosystems StepOne Plus Real Time PCR system. Cycling parameters were chosen based on the manufacturer’s recommendations provided with the Taqman Universal Master Mix II with UNG (Applied Biosystems #4440038). Relative fold change was calculated using the ΔΔCt method with 18S serving as the reference gene.
Vmax Assays
To determine cytochrome c oxidase (COX) Vmax activities cells were grown to 95% confluency in T75 flasks. After removing the medium and washing with calcium and magnesium free Hank’s buffered salt solution (HBSS) (Gibco #14025–092), cells were gently scraped in 8 mL of HBSS and the cell suspension was counted. The cells were pelleted and resuspended in HBSS at a concentration of 30 million cells per mL. 950 μL 100 mM PBS, pH 7.4 and 20 μL of 10 mg/mL β-maltoside (Sigma #D4641) were added to cuvettes and warmed to 30°C before taking a blank reading. 30 μL of cell suspension was added to the cuvette, mixed well, and incubated at 30°C for 2 minutes. Reduced cytochrome c (Sigma #C7752) was then added to the cuvette using a Hamilton syringe and mixed well. The absorbance was read at 550 nm at 6 second intervals for 2 minutes. Potassium ferricyanide crystals (Sigma #702587) were added and the absorbance at 550 nm was recorded. To measure each sample’s total protein, 5 μL of cell suspension was measured via BCA assay. The COX activity in sec−1 was calculated by subtracting the blank from the absorbance readings, then calculating the log of the absorbance readings and creating a scatter plot with “Time” as the X axis and “Log (Abs)” as the Y axis. The absolute value of the slope represented the COX Vmax activity, which was normalized to total protein.
Citrate synthase activity was measured using the same samples. 936 μL of 100 mM tris pH 8.0, 4 μL of 10% Triton X-100 (Sigma #1002841029), and 10 μL of 10 mM 5,5’-dithiobis-(2-nitrobenzoic acid) (DTNB) (Sigma #D8130) were mixed in a cuvette and warmed to 30°C. A blank reading of this mixture was taken. 30 μL of cell suspension was added to the cuvette and incubated at 30°C for 2 minutes. 10 μL of 50 mM oxaloacetate (Sigma #07753), made fresh in 10 mM tris-HCl pH 8.0, and 10 μL of 5 mM acetyl-CoA (Sigma #A2181) were added to the cuvette and the reaction was mixed well. The absorbance was read at 412 nm at 6 second intervals for 2 minutes. To calculate CS activity, we plotted “Time” as the X-axis and “Absorbance minus blank” on the Y-axis. The slope of this line was multiplied by 60 to get the rate/minute, and then divided by 0.0136 (a constant that considers the extinction coefficient of the DTNB colorimetric reagent at 412 nm and the optical path length of the cuvette). The resulting value represented the CS Vmax activity of the sample in nmol/minute. We normalized CS Vmax activity to total protein.
To determine the complex I Vmax activity, cells were grown to 95% confluency in T180 flasks. After removing the medium and washing with PBS, cells were gently scraped in 8 mL of PBS. Enriched mitochondrial extracts were then prepared and assayed for complex I activity as described previously [27]. On the day of the assay mitochondrial pellets were thawed on ice and protein was quantified via BCA assay. 75 μg of the enriched mitochondrial fraction was loaded per reaction.
Respiration and Glycolysis Flux Analyses
We used a Seahorse XF96 Analyzer to determine cell respiration (oxygen consumption rate, OCR) and glycolysis (extracellular acidification rate, ECAR) fluxes. The day before the assay 40,000 cells were seeded per well in a Seahorse XF96 cell culture plate in 100 μL complete medium. The next day, assay medium containing 25 mM glucose, 2 mM glutamine, and 1 mM pyruvate was prepared. The cells were washed twice in assay medium and brought to a final volume of 180 μL. Plates were degassed at 37°C in a non-CO2 incubator for 45 minutes. Mitochondrial inhibitors were diluted in 3 mL of assay medium to the following concentrations (10x): oligomycin (Sigma #75351) 10 μM, FCCP (Sigma #C2920) 0.25 μM, and rotenone (Sigma #R8875) and antimycin A (Sigma #A8674) each to 5 μM. The experiment was run on the Seahorse XF96 analyzer using an extracellular flux assay kit and following the mitochondrial stress test protocol. Results were normalized to protein concentration determined via DC protein assay (BioRad).
Cell Cycling, Morphology, and Viability
Cell growth was measured using fluorescent activated cell sorting. Two million cells per sample were pelleted and resuspended in 1 mL of 0.9% NaCl in water. Cells were then fixed in cold 90% ethanol for 30 minutes. To prepare a working propidium iodide (Sigma #P4864) solution, a 500 μg/mL stock was diluted 1:10 in PBS. Cells were resuspended in 1 mL of the propidium iodide working solution. 100 μL of 1 mg/mL RNase A (DNase-free) (Thermo #EN0531) was added and samples were incubated at 37°C for 30 minutes. Samples were then analyzed using flow cytometry. To assess cellular morphology, cells were seeded in 96 well plates, fixed with 1% paraformaldehyde for 15 minutes, and grayscale images were taken using a Cytation imaging reader (BioTek) with a 20x objective. Cell viability was determined by monitoring the conversion of 3-(4,5-dimethylthiazol-2-yl)-2,5-diphenyltetrazolium bromide (MTT) to formazan as previously described [28].
Statistical Analyses
Statistical analyses were conducted using GraphPad Prism. Individual cybrid cell line and brain tissue values each represent the average of three independent measurements. For experiments using SH-SY5Y ρ+ and SH-SY5Y ρ0 cells, twelve independent measurements were performed for each assay except for the respiration and glycolysis flux assays, where sixteen independent measurements were performed. For experiments in the staurosporine-differentiated SH-SY5Y cells, six independent measurements were performed. Data were summarized by means and standard errors (standard error of the mean; SEM). Brown-Forsythe and Welch one-way ANOVA tests were used to compare groups of three or more (comparing mtDNA content among ρ+, EtBr-treated, and ρ0 cells; comparing oxygen consumption data). Welch’s t-test was used for two-group comparisons. P values less than 0.05 were considered statistically significant.
Results
We used the TOC1 antibody [21] to measure tau oligomer levels in human neuronal SH-SY5Y cells treated with EtBr. EtBr, a cationic DNA intercalator, can inhibit mtDNA replication at concentrations that do not prevent nuclear DNA replication [29]. We found 1, 3, and 7-day exposures to 3 μg/mL EtBr respectively removed approximately 50%, 75%, and 95% of the SH-SY5Y ρ+ cell mtDNA. By comparison SH-SY5Y ρ0 cells originally generated through a much longer EtBr exposure, which model stable mtDNA depletion following the removal of EtBr, contained no or essentially no mtDNA (>99.9% reduction) (Figure 1a). Western blots revealed a concomitant progressive reduction of mtDNA-encoded mtCO2 protein that was almost complete by EtBr day 7, as well as profound reductions of the nuclear-encoded NDUFB8 respiratory chain protein that exceeded those of the nuclear-encoded COX4I1 protein. ρ0 cells showed a pattern that reflected the 7-day EtBr-treated cells, as they contained no detectable mtCO2 or NDUFB8 protein, but only slightly less COX4I1 protein than the parent ρ+ line (Figure 1b). COX4I1 mRNA levels were comparable in ρ+, EtBr-treated, and ρ0 cells. NDUFB8 mRNA levels did not change with the acute EtBr exposures but were slightly lower in the ρ0 cells (Figure 1C). By MTT assay the acutely mtDNA-depleted cells appeared viable throughout and grossly showed at most subtle morphologic changes (Figure 1d and Figure 1e). The ρ0 cells continued to grow and divide, although their cell cycle rate was slightly reduced as compared to the parent SH-SY5Y line (Figure 1f).
Figure 1. Extent of acute and chronic mtDNA depletion and its effects on respiratory chain protein and mRNA levels.
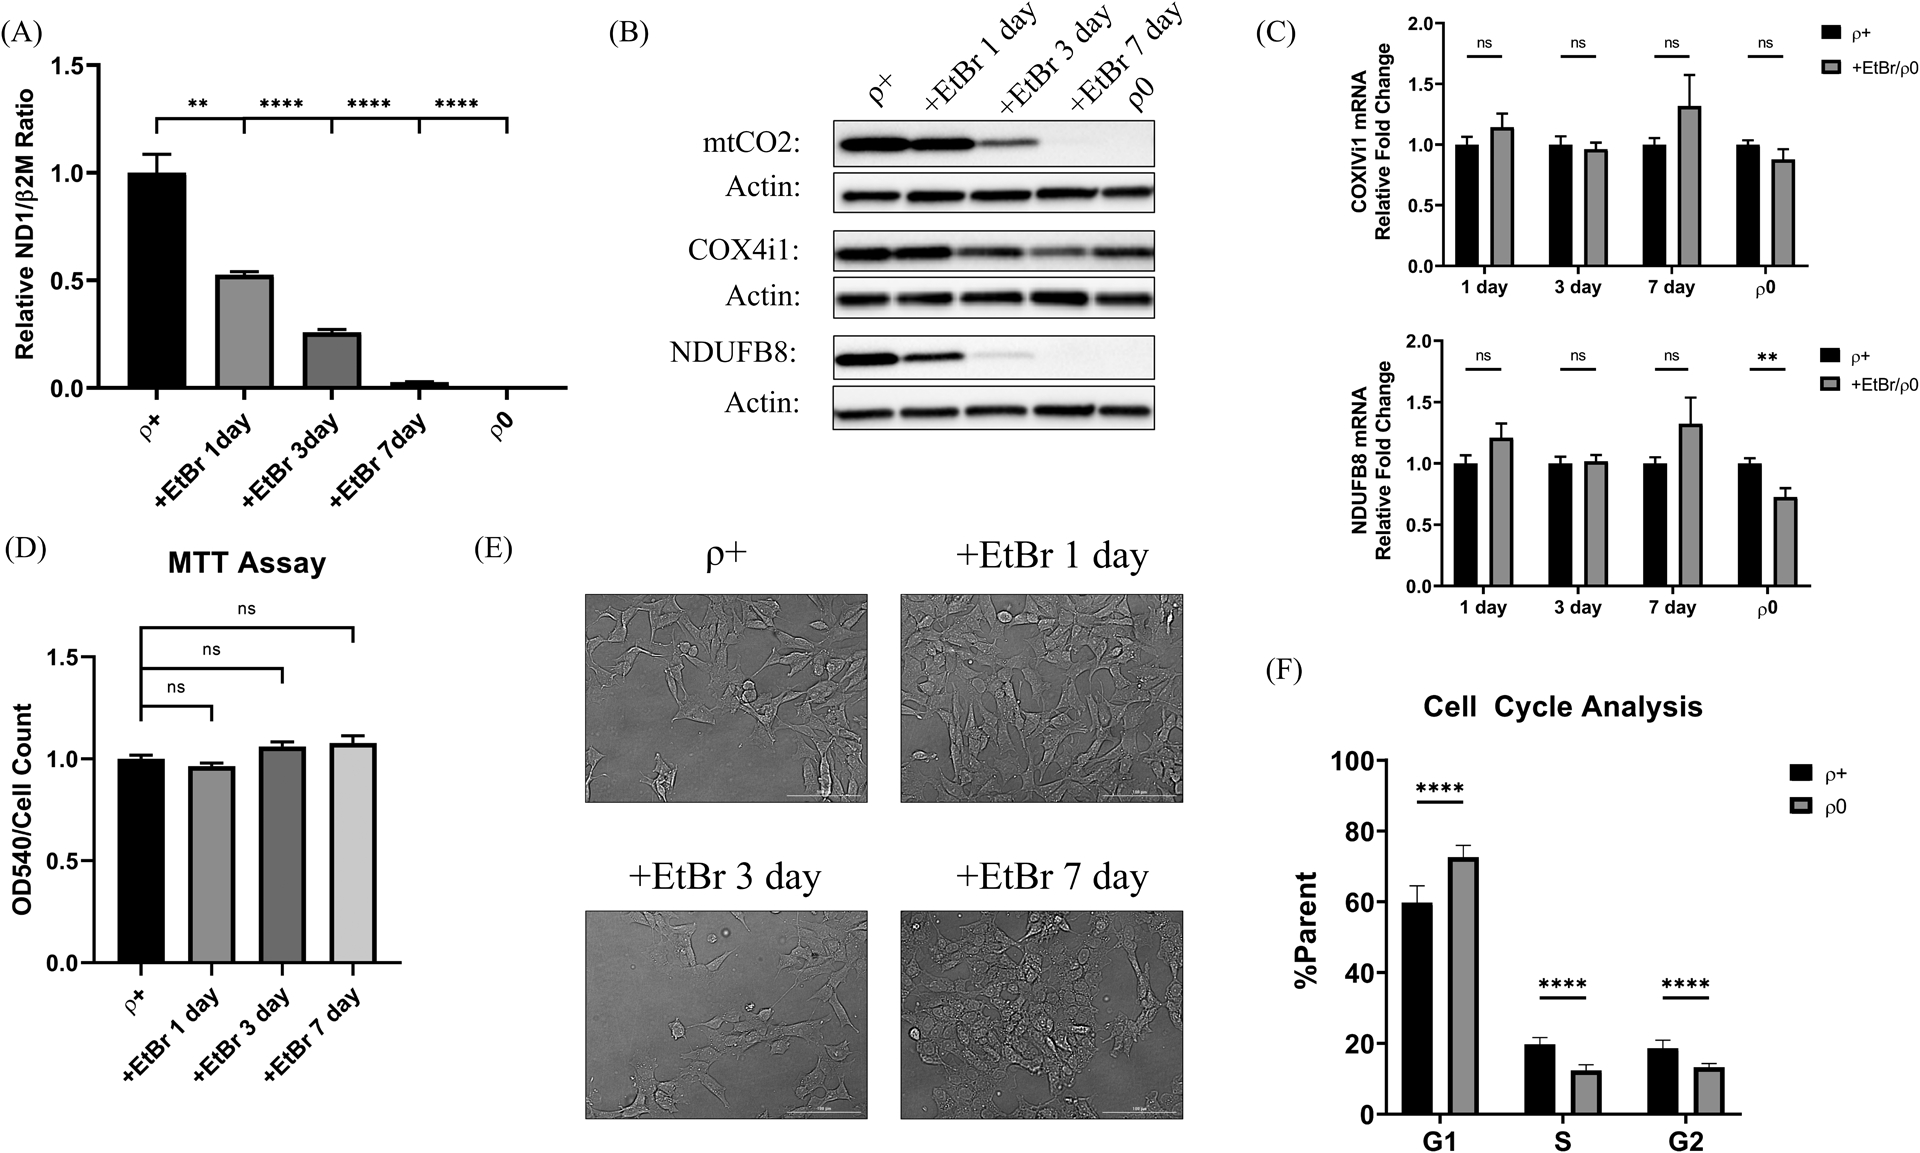
(A) 1, 3, and 7-day EtBr treatment reduced SH-SY5Y mtDNA levels by approximately 50%, 75%, and 95%. ρ0 cells displayed >99.9% relative mtDNA depletion. (B) Representative western blots labeled with antibodies recognizing the mtDNA-encoded mtCO2, nuclear-encoded COX4I1, and nuclear-encoded NDUFB8 proteins. Actin is included as a loading control. (C) COX4I1 and NDUFB8 mRNA levels were unaffected by the acute EtBr treatment, although the NDUFB8 mRNA level was slightly reduced in ρ0 cells. (D) By MTT assay the acutely mtDNA-depleted cells appeared viable throughout. (E) The acutely mtDNA-depleted cells grossly showed at most subtle morphologic changes. (F) The ρ0 cell cycle rate was slightly reduced as compared to the parent SH-SY5Y line. **p<0.01, ***p<0.001, and ****p<0.0001. Error bars represent SEM.
From a functional perspective the 1, 3, and 7-day EtBr exposures progressively decreased COX Vmax activities by 50%, 76%, and 100% and the complex I Vmax activities by 36%, 62%, and 91%. The CS Vmax did not change during this time. After 3 days of EtBr the relative decline in COX activity exceeded the relative decline in complex I activity (p=0.004), and we again saw this relationship after 7 days of EtBr (p=<0.0001) (Figure 2a). Oxygen consumption also progressively declined over the course of the EtBr treatment. Although after 7 days of EtBr the acutely manipulated cells and ρ0 cells both showed virtually no mitochondrial oxygen consumption, the ECAR was lower in the ρ0 cells than it was in the 7-day EtBr treated cells (p=0.0002) (Figure 2b). Figure 2c graphically summarizes metabolic flux patterns in the acute and chronic mtDNA-depleted groups and indicates energy needs or metabolism fundamentally differ between the chronic and acute models.
Figure 2. Effect of mtDNA depletion on mitochondrial enzyme Vmax activities and energy metabolism fluxes.
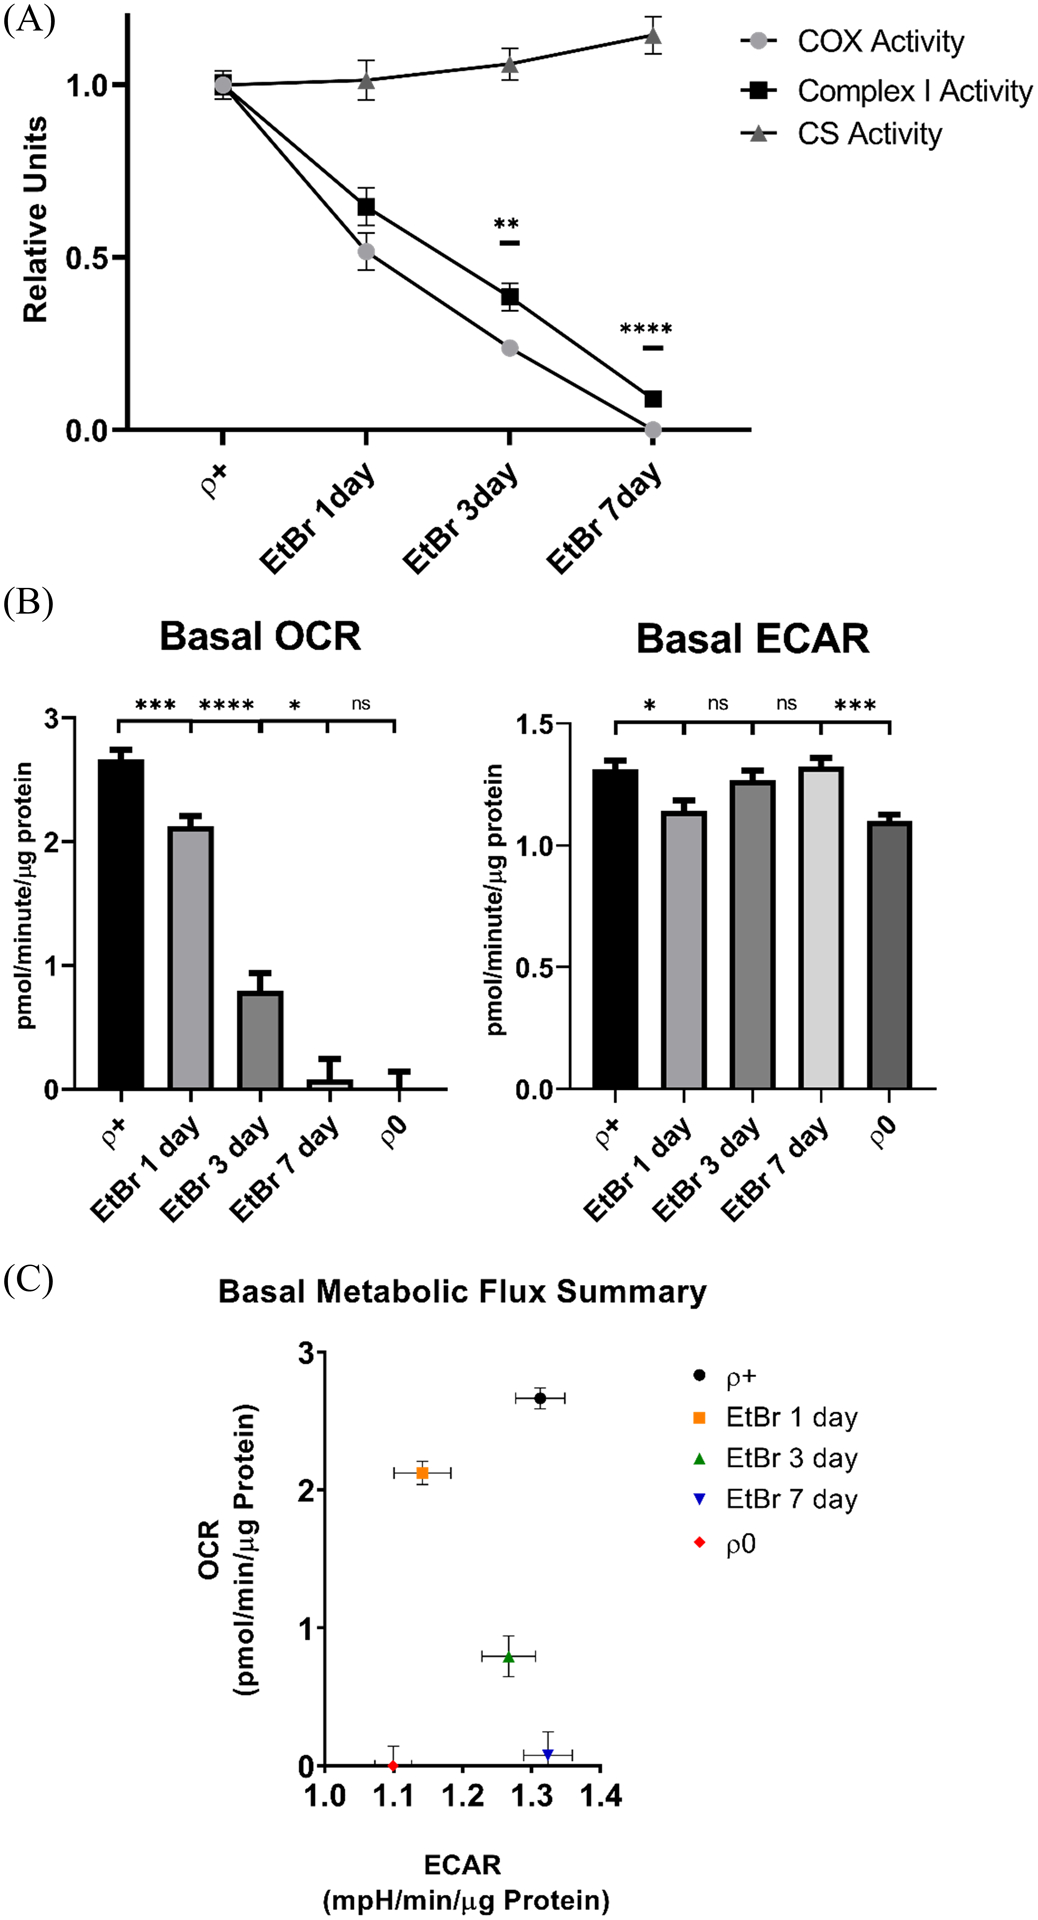
(A) A progressive decline in complex I and COX activities accompanied the progressive EtBr-induced mtDNA depletion, although after 3 and 7 days of EtBr COX activity fell to a greater extent than complex I activity. CS activity did not decline during this period. (B) SH-SY5Y oxygen consumption rates also tracked mtDNA depletion, and as was the case with the ρ0 cells the mitochondrial OCR was essentially undetectable by EtBr exposure day 7. The EtBr-treated cell ECAR fell initially but recovered, and the EtBr exposure day 7 ECAR exceeded the ρ0 cell ECAR. n=16 per group. (C) Metabolic flux rates for the different groups; the EtBr day 7 cells and ρ0 cells both showed no or essentially no mitochondrial oxygen consumption, but the ρ0 cells uniquely lowered their glycolysis flux. *p<0.05, **p<0.01, ***p<0.001, and ****p<0.0001. Error bars represent SEM.
Tau mRNA levels were comparable across the ρ+, EtBr-treatment, and ρ0 groups (data not shown). Tau oligomers were unchanged after 1 day of EtBr but rose after 3 and 7 days of the treatment. TOC1 immunoreactivity increased regardless of whether the values were normalized to total protein or total tau (Figure 3a). Increased oligomer to total tau ratios indicates that in addition to containing more tau oligomers, cells undergoing acute mtDNA depletion shift their monomer to oligomer balance in ways that favor the oligomer forms. Relative to ρ+ cell lysates, ρ0 cell lysates showed increased tau oligomers when normalized to total protein, but not when normalized to total tau. This suggests with chronic, total mtDNA depletion the monomer to oligomer equilibrium reverts to that of the ρ+ state (Figure 3b).
Figure 3. Acute and chronic mtDNA depletion alters TOC1 staining.
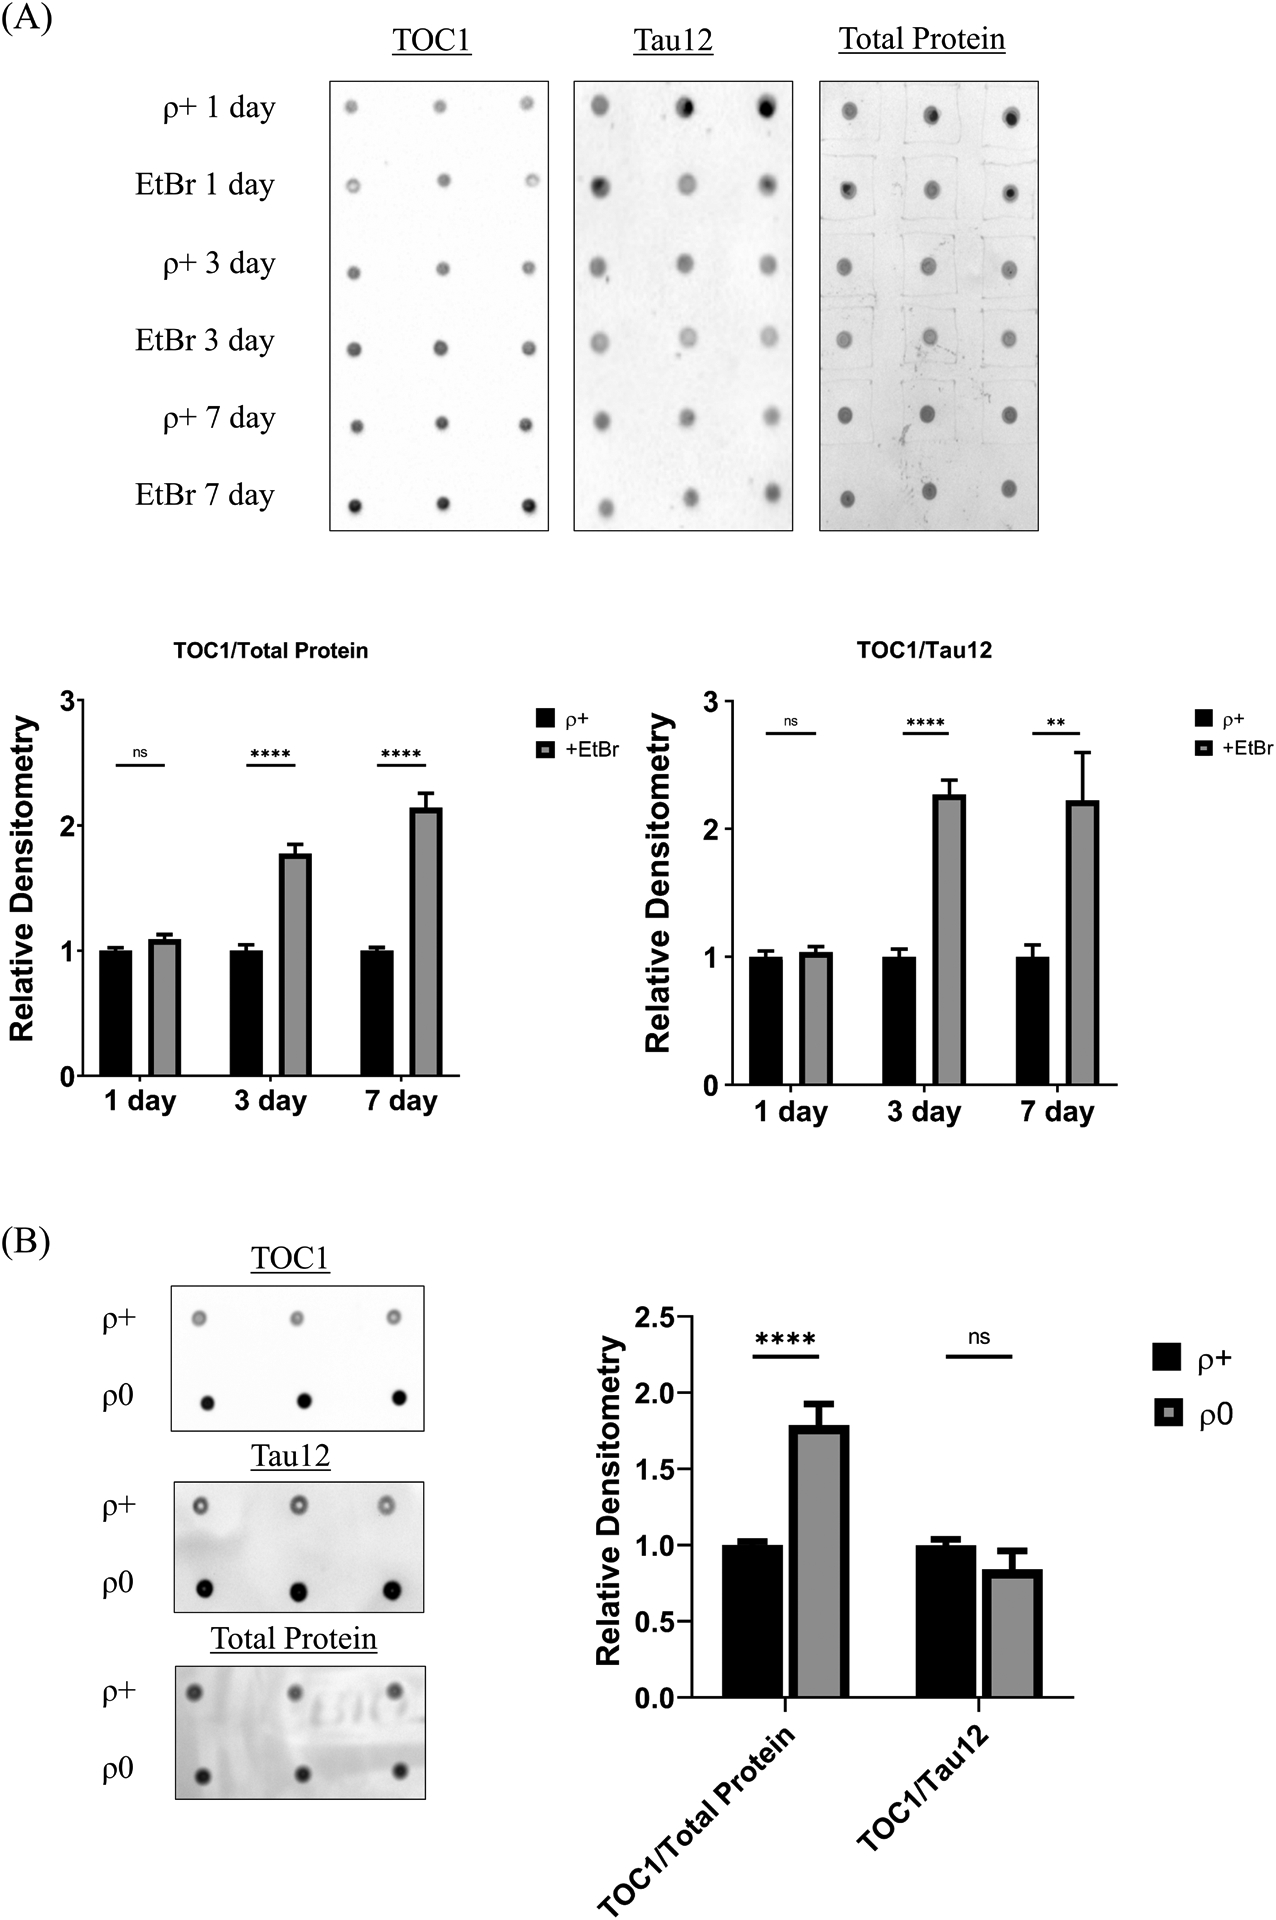
(A) Representative dot blots of EtBr-treated SH-SY5Y lysates labeled with the TOC1 antibody, the Tau12 antibody, or Amido Black. Each day’s EtBR-treated samples were compared to control samples simultaneously prepared on that specific day. Densitometry analysis reveals no change in TOC1 staining after the 1-day EtBr treatment but following 3 and 7 days TOC1 staining increases whether normalized to total protein or total tau. (B) Representative dot blots of SH-SY5Y ρ+ and ρ0 lysates labeled with the TOC1 antibody, the Tau12 antibody, or Amido Black. Densitometry analysis reveals a significant increase in TOC1 staining in ρ0 cells relative to ρ+ cells when normalized to total protein, but not to total tau. **p<0.01, and ****p<0.0001. Error bars represent SEM.
A range of kinases and phosphatases regulate tau phosphorylation. For cells undergoing acute mtDNA depletion one of these, the GSK3β kinase, exhibited increased levels of serine 9 phosphorylation (Figure 4a). Absolute levels of tau serine 199 varied during acute mtDNA depletion and increased in ρ0 cells (Figure 4b), but total tau levels also changed, and the ratio of serine 199-phosphorylated to total tau remained constant (Figure 4c).
Figure 4. Tau phosphorylation in acutely and chronically mtDNA-depleted cells.
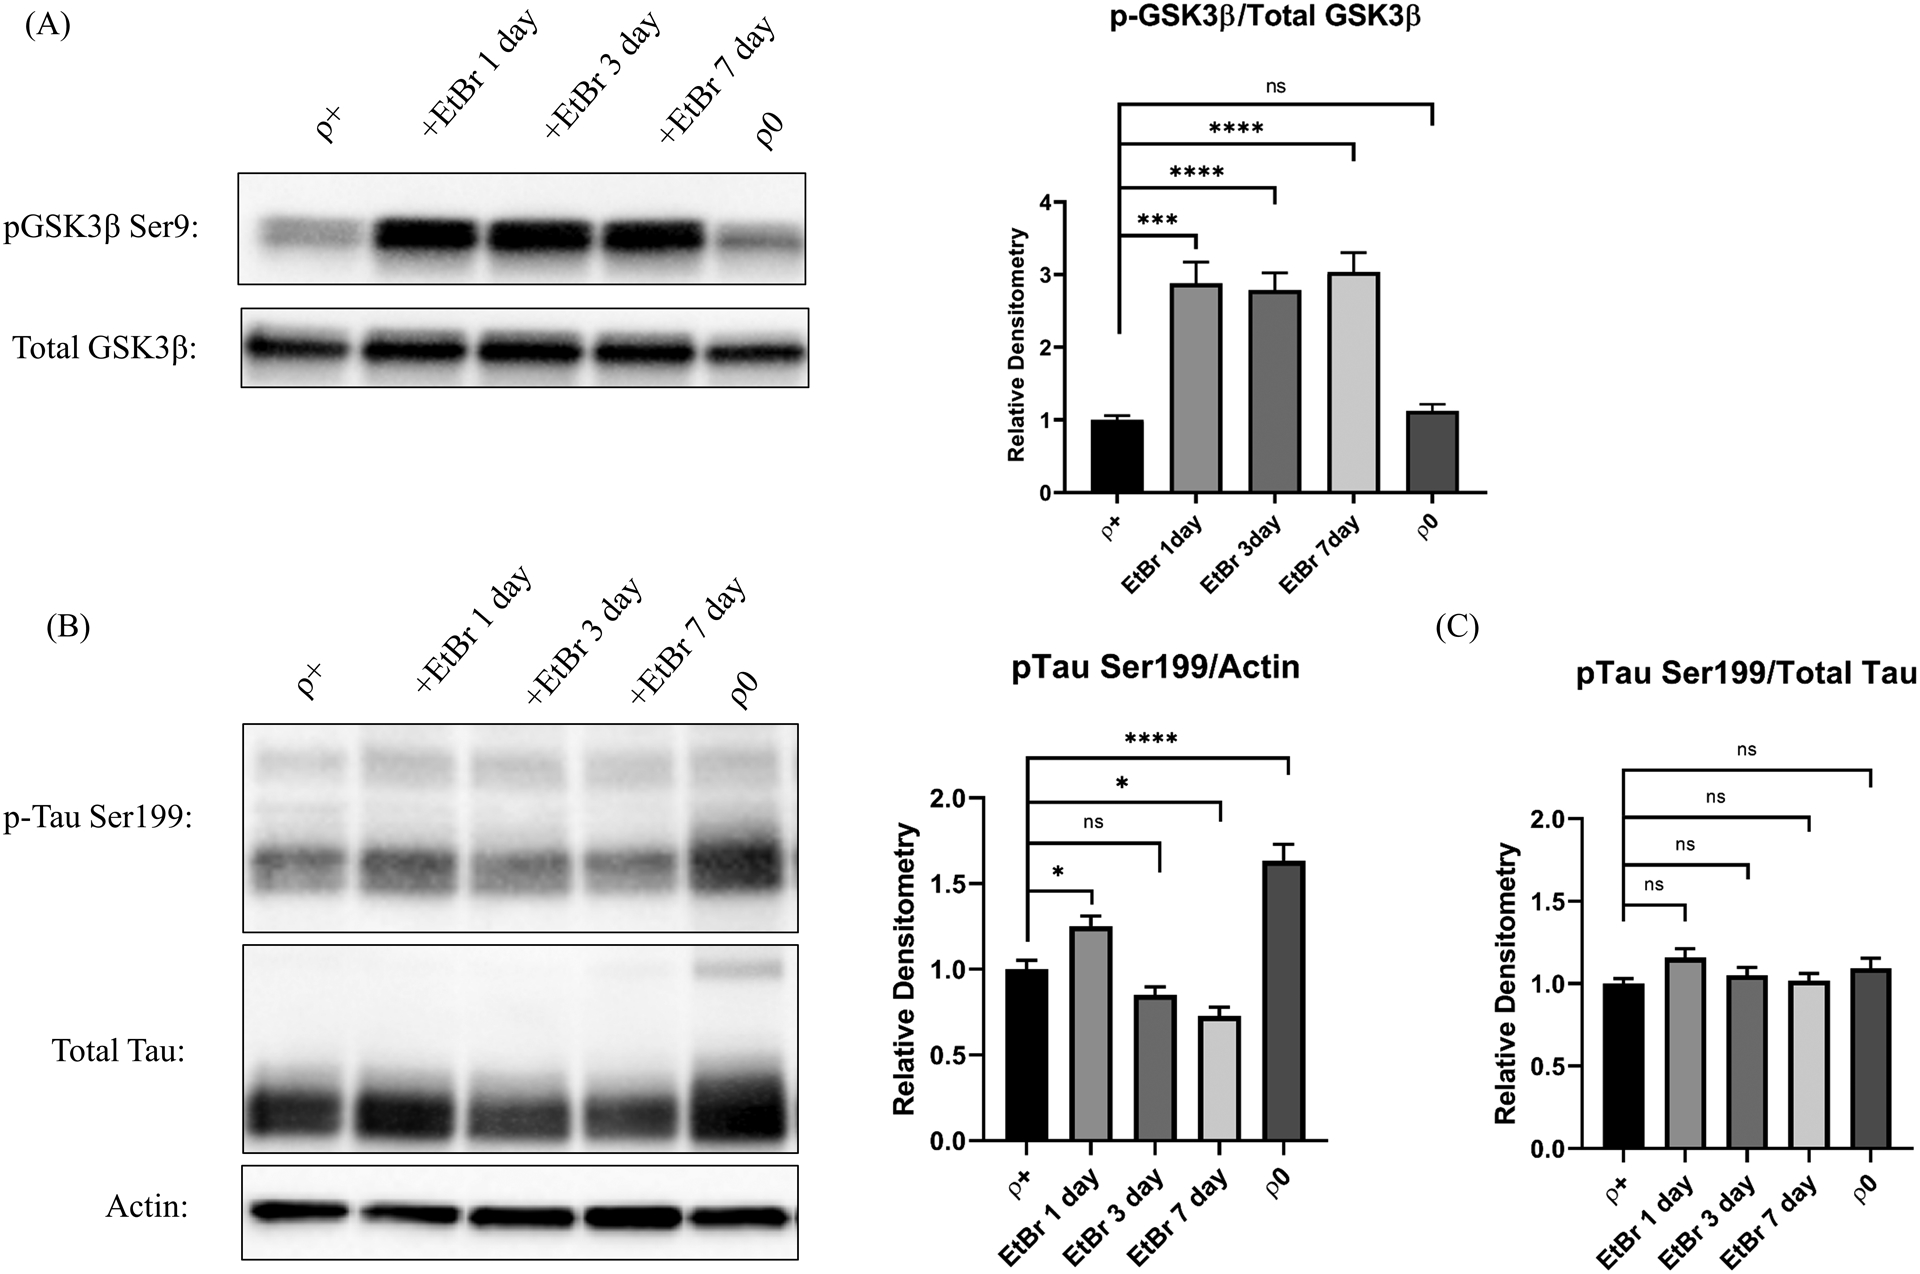
(A) The GSK3β kinase serine 9 phosphorylation level and the serine 9 phosphorylated to unphosphorylated ratio increased in cells undergoing acute but not chronic mtDNA depletion. (B) Tau serine 199 phosphorylation levels varied during acute mtDNA depletion and increased in ρ0 cells. (C) Serine 199 phosphorylated to total tau ratios remained constant. *p<0.05, ***p<0.001, and ****p<0.0001. Error bars represent SEM.
To independently assess whether mtDNA can impact tau biology, we used the TOC1 antibody to measure tau oligomer levels in cybrid cell lines generated from AD and age-matched CN subjects. Normalizing each line’s TOC1 dot blot density to its dot blot total protein density revealed a 3.6-fold increase in the AD cybrid line mean (p=0.02), and normalizing each line’s TOC1 dot blot density to its Tau12 total tau density showed a 5.7-fold mean increase (p=0.04) (Figure 5a). This pattern reflects that of acutely mtDNA-depleted cells and indicates in addition to containing more tau oligomers, AD cybrid cells shift their monomer to oligomer balance to favor the oligomer forms. Protein lysates derived from AD and control autopsy brains showed similar relationships, but with a more robust 14.2-fold increase in the AD brain tau oligomer to total protein ratio, and a more robust 9.3-fold increase in the tau oligomer to total tau ratio (Figure 5b).
Figure 5. TOC1 staining in AD cybrids and AD brains.
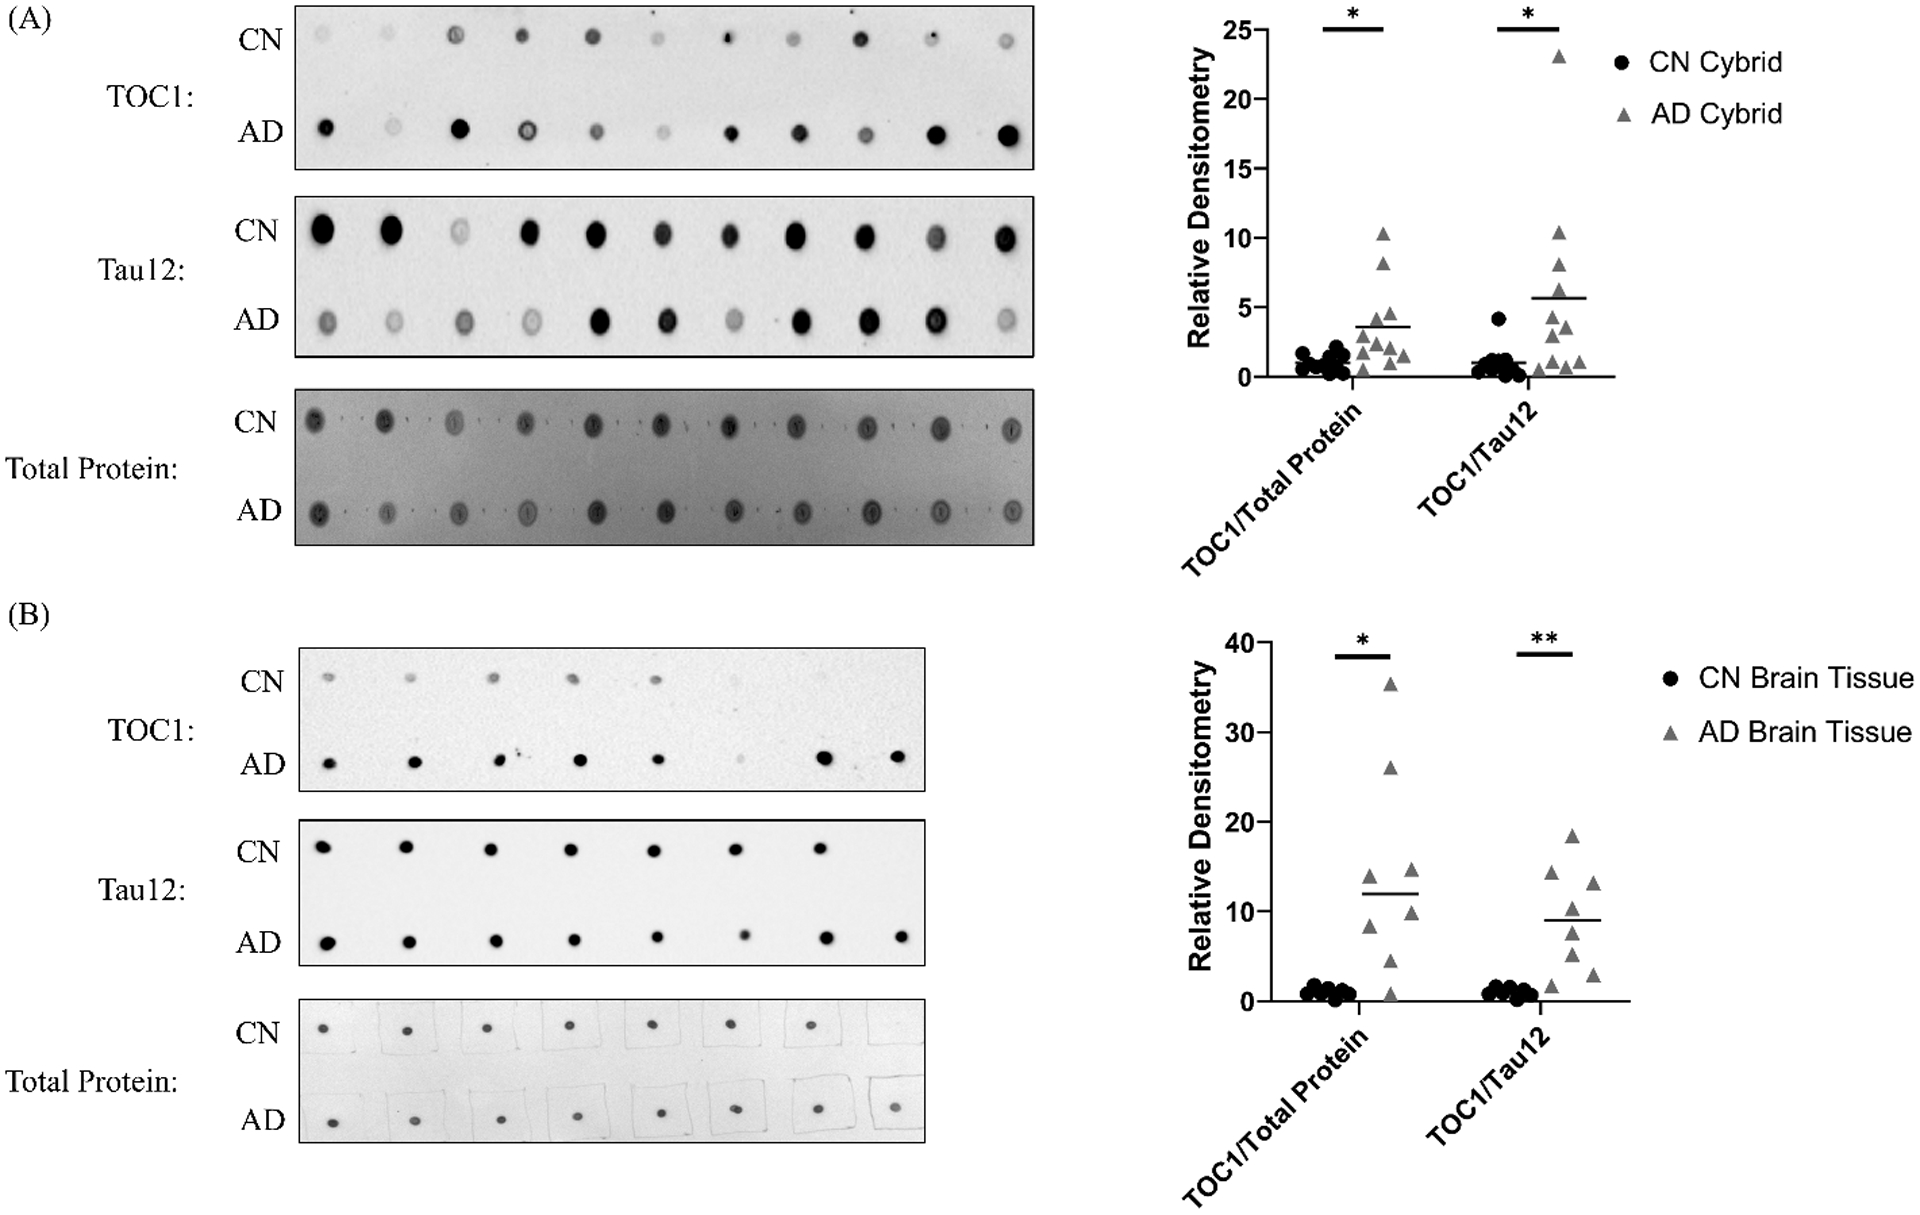
(A) Normalized to total protein or total tau protein AD cybrids show more TOC1 staining than age-matched CN cybrids. The dot blots shown are actual representative data from a single experiment. Each datapoint in the graph represents the mean value from three independent measurements. n=11 per group. (B) Normalized to total protein or total tau protein AD brains show more TOC1 staining than age-matched brains from CN subjects. The dot blots shown are actual representative data from a single experiment. Each datapoint in the graph represents the mean value from three independent measurements. n=8 AD and 7 CN brains. *p<0.05, **p<0.01.
Because our EtBr treatment and ρ0 models emphasize mtDNA depletion, we quantified cybrid line mtDNA levels using primers complementary to mtDNA ND1 and nuclear DNA β2M sequences. Relative to the CN group, cybrid lines containing mtDNA from AD subjects displayed a modest but significant 9% reduction in their mean mtDNA content (Figure 6). We also determined mtDNA D-loop cycle thresholds, which estimates mtDNA synthesis rates [25], but on this measure group levels were comparable (data not shown).
Figure 6. Cybrid cell line relative mtDNA content.
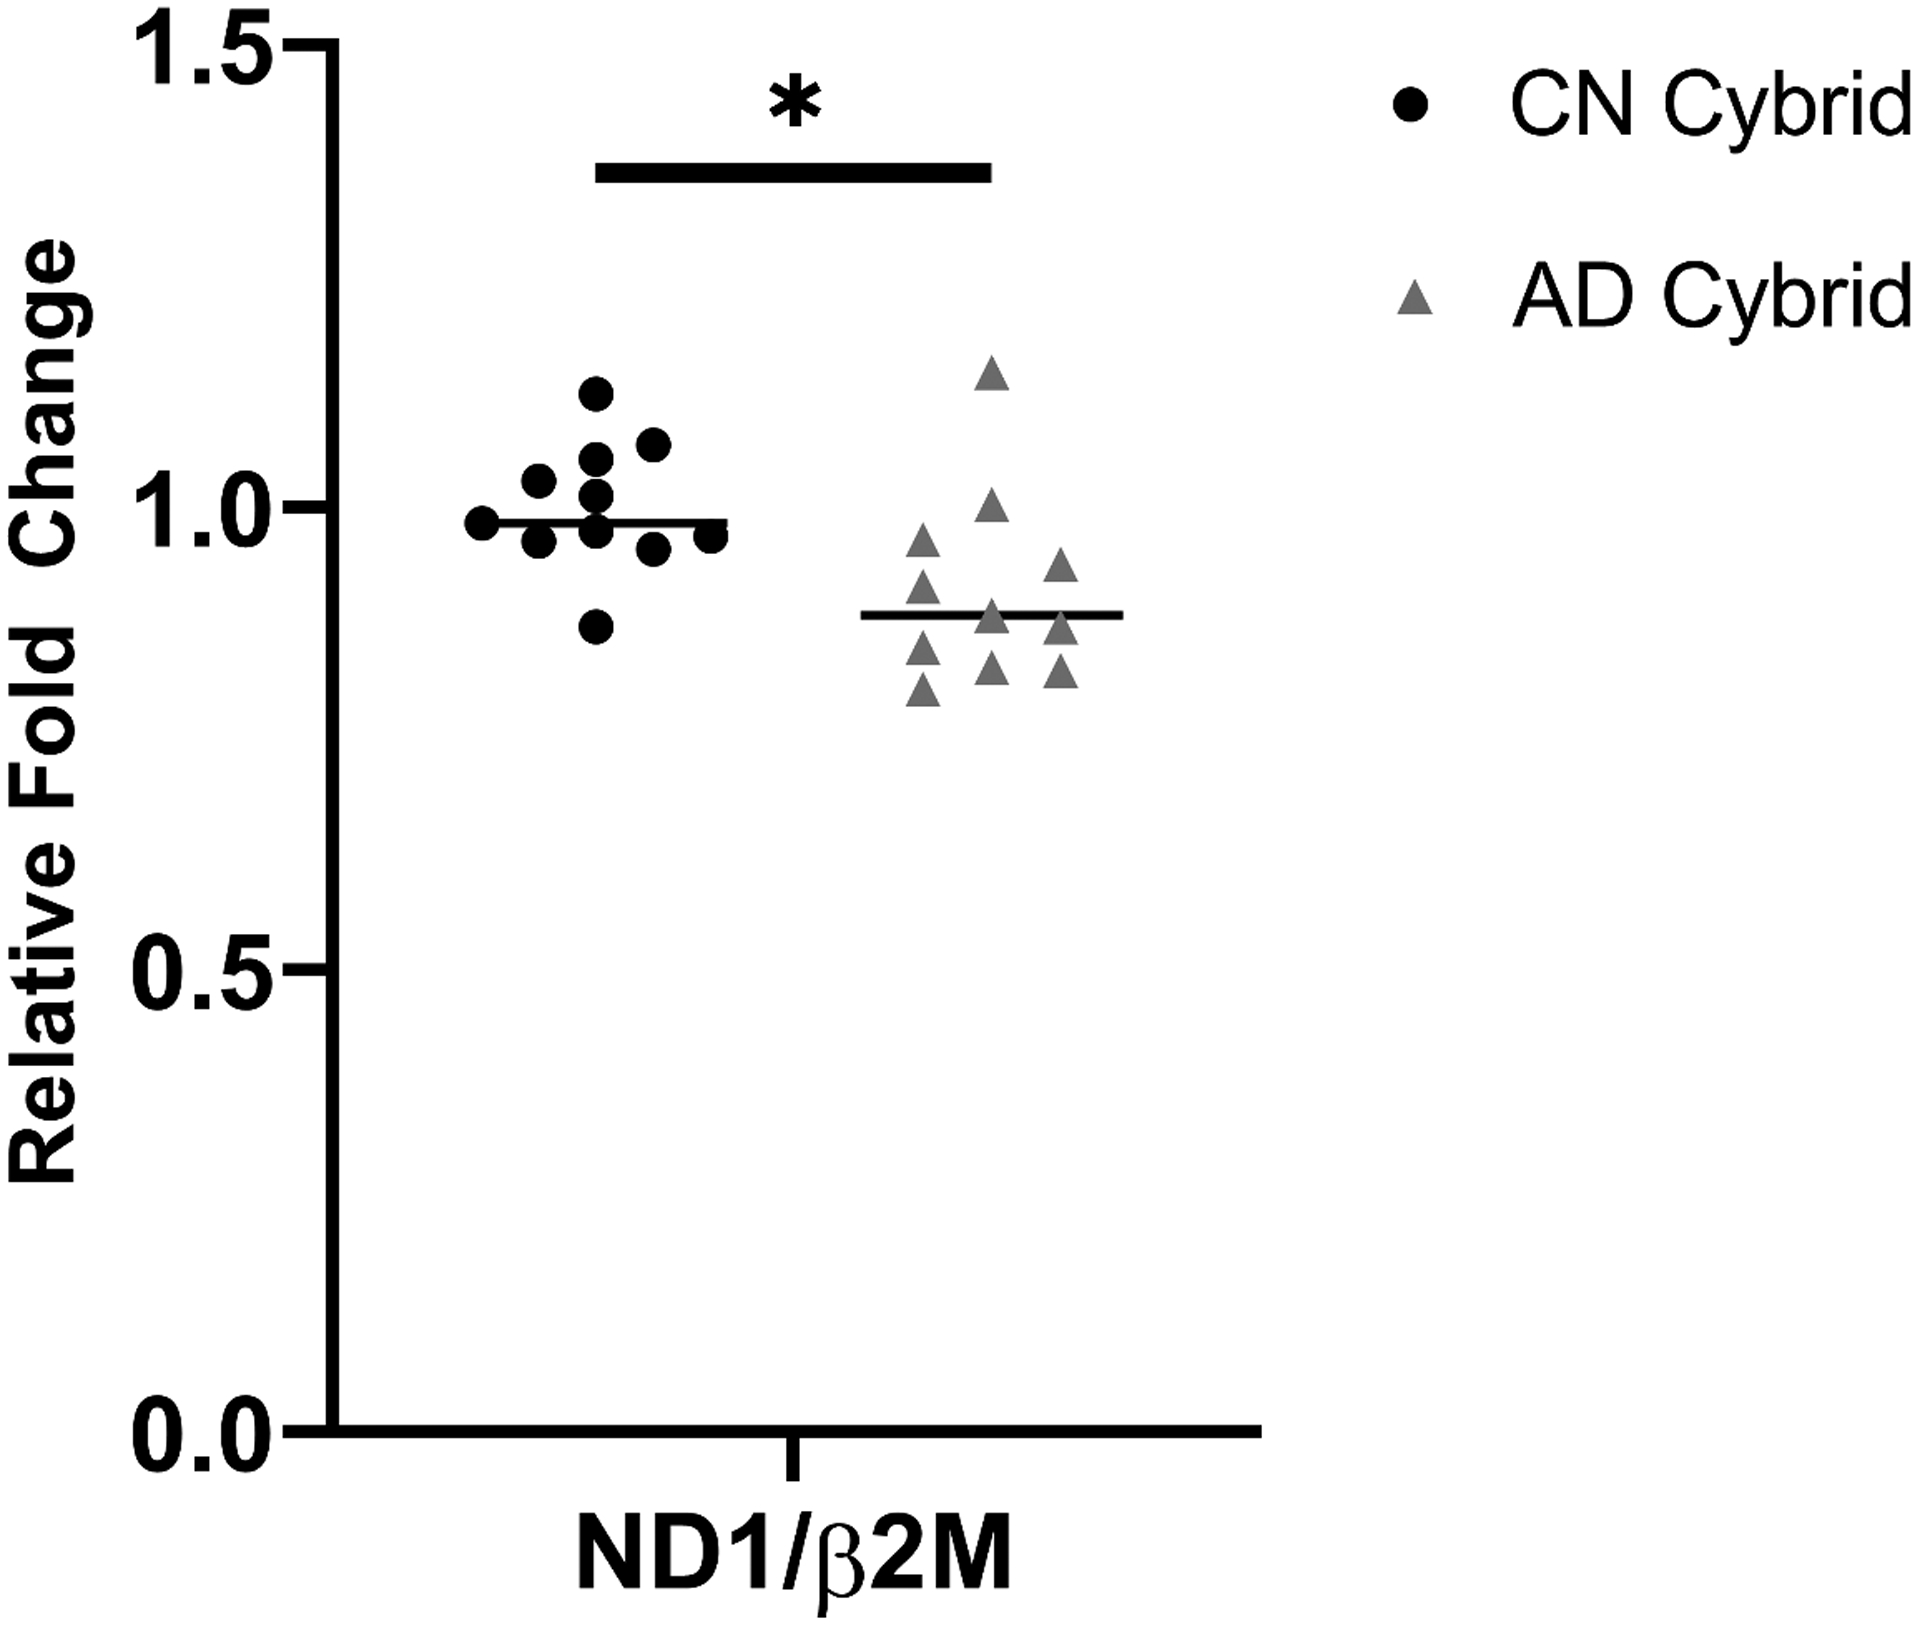
AD cybrids maintain less mtDNA than CN cybrids; the AD cybrid mtDNA mean was 9% lower than the CN cybrid mean. Each datapoint in the graph represents the mean value from three independent measurements. n=11 per group. *p<0.05.
We measured tau oligomer levels in differentiated SH-SY5Y cells undergoing acute mtDNA depletion. Tyrosine hydroxylase protein, a marker of differentiation, increased in staurosporine-treated SH-SY5Y cells (Figure 7a). EtBr reduced the differentiated cell mtDNA content, by 40% after 1 day of treatment and by 70% after 3 days (Figure 7b). Reminiscent of the undifferentiated cells, tau oligomers increased in the mtDNA-depleted cells and we observed a monomer to oligomer shift (Figure 7b–d).
Figure 7. Acute mtDNA depletion alters TOC1 staining in differentiated SH-SY5Y cells.
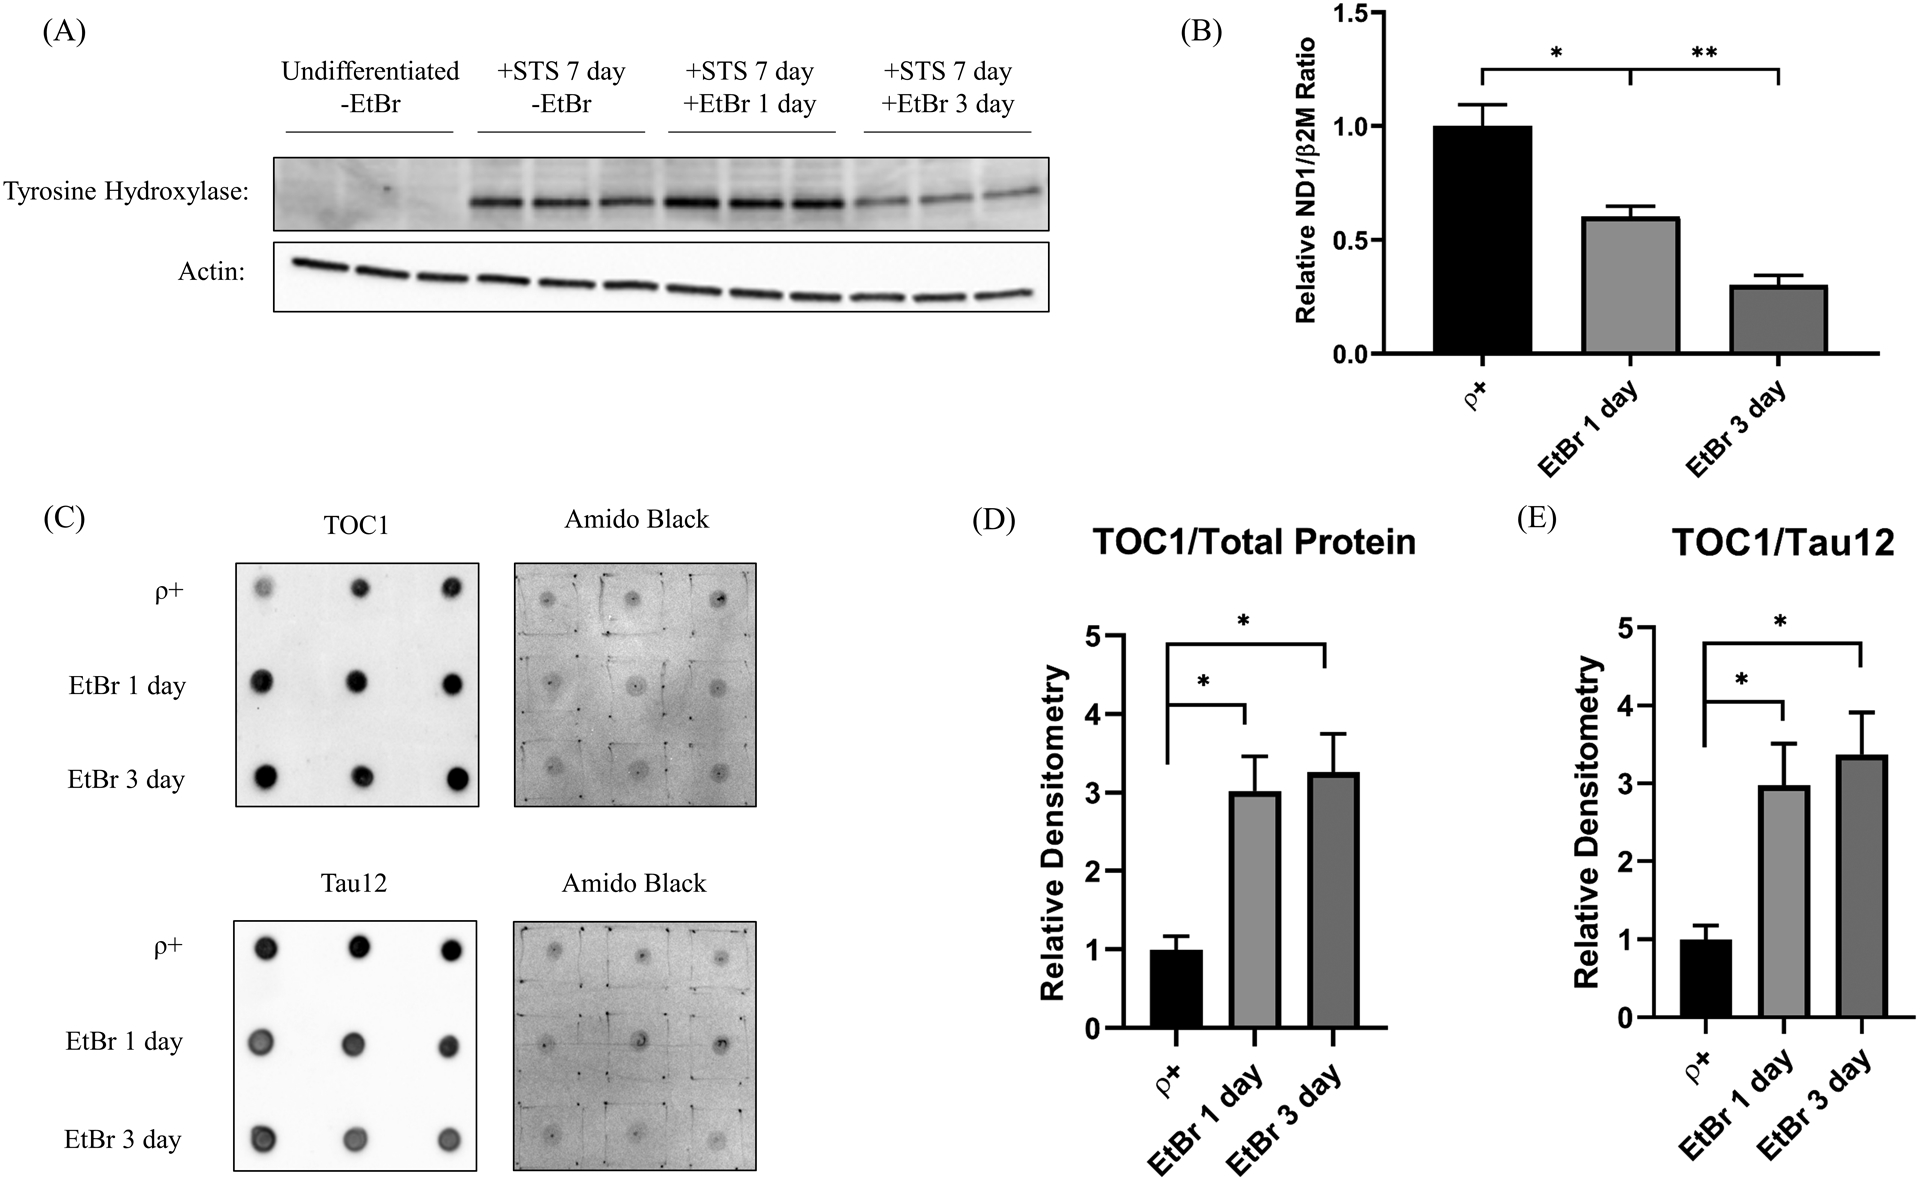
(A) Tyrosine hydroxylase protein, a marker of differentiation, increased in staurosporine-treated SH-SY5Y cells. (B) The amount of mtDNA progressively declined in EtBr-treated differentiated cells. (C) Dot blots of differentiated SH-SY5Y cell lysates labeled with the TOC1 antibody, the Tau12 antibody, or Amido Black. Each day’s EtBR-treated samples were compared to control samples simultaneously prepared on that specific day. (D) Densitometry analysis reveals after 1 and 3 days of EtBr, TOC1 staining increases when normalized to total protein. (E) Densitometry analysis reveals after 1 and 3 days of EtBr, TOC1 staining increases when normalized to total tau protein, indicative of a monomer to oligomer shift. n=6 per group. *p<0.05, **p<0.01. Error bars represent SEM.
Discussion
Mitochondria influence tau biology [7–13]. Here we build on previous reports by experimentally showing mtDNA-induced mitochondrial dysfunction can both increase tau oligomer levels and shift the oligomer-monomer equilibrium towards the oligomer state. We also saw elevated tau oligomers and a pro-oligomer shift in cybrid lines containing AD subject mtDNA, which supports the observation’s potential AD-relevance.
We specifically considered how acute and chronic mtDNA depletion affects tau biology. Few mtDNA editing options exist [30], and what to edit for a study of this nature is unclear. On the other hand, cationic DNA intercalators such as EtBr accomplish rapid mtDNA depletion while ρ0 cells model chronic depletion. A study from Nagy et al., which reported tangle-containing neurons lack mtCO2 protein, also informed our decision to evaluate the impact of mtDNA depletion [31].
The observed direct correlation between mtDNA content and cell respiration rates seems straightforward, as does the observed direct correlation between mtDNA content and mtDNA-encoded mtCO2 protein levels. How mtDNA depletion impacts nuclear encoded respiratory chain subunits is more complex. Our data certainly suggest mtDNA depletion affects nuclear-encoded subunit translation or protein degradation more than transcription or mRNA degradation. A loss of mtDNA-encoded proteins could perturb respiratory chain stoichiometry and induce an unfolded protein response that degrades nuclear-encoded subunits [32], or it could trigger an adaptive integrated stress response (ISR) [33]. Regardless, it is unclear why NDUFB8 protein was more sensitive than COX4I1 protein to acute and chronic mtDNA depletion.
Based on this and the fact that complex I contains more mtDNA-encoded respiratory chain subunits than COX, it seems counterintuitive that COX activity in our study was more sensitive to mtDNA depletion than complex I activity. Our Vmax data therefore suggest mtDNA-encoded proteins are more critical to COX function than complex I function. Consistent with this, other studies report COX activity is particularly linked to mtDNA copy number [34, 35].
Because mtDNA only encodes respiratory chain proteins we suspect mtDNA copy number-related factors perturbed the respiratory chain, which initiated an indeterminately long string of events that eventually affected tau. It is likely one or more of these events were mitochondria non-autonomous, as the oligomer to total tau ratio increased in the acute but not the chronic mtDNA depletion model. Important differences exist between these models; at EtBr day 7 acutely depleted cells show reduced oxygen but preserved glycolysis fluxes, while both fluxes are reduced in ρ0 cells. This indicates mtDNA depletion eventually leads to an adaptative metabolic reprogramming.
Our cybrid analysis independently establishes a role for mtDNA in tau biology and does so within a clearly AD-relatable context. Cybrid lines generated via transfer of AD subject mtDNA to ρ0 cells stably model at least some characteristics of AD mitochondria [2, 14, 36]. While the mtDNA in AD cybrids presumably facilitates their ex vivo modelling of AD mitochondria, the responsible mtDNA characteristics are unclear. Because the mtDNA in our AD cybrids derives from platelets we suspect inherited variants are critical.
Multiple studies report AD brains contain less mtDNA than CN brains, or at least less PCR-amplifiable mtDNA [37–43]. Blood cells from AD subjects may also contain reduced mtDNA copy numbers [41]. Our novel finding that AD cybrids collectively contain less mtDNA than age-matched CN cybrids suggests reduced AD mtDNA levels are determined at least partly by mtDNA itself, and are not entirely attributable to nuclear factors, classic AD histopathology phenomena, or neurodegeneration artifact. If correct, the responsible mtDNA signatures presumably reside within the mtDNA control region that initiates mtDNA replication. The mtDNA control region shows high inter-individual variability, varies among mtDNA haplogroups with different AD odds ratios, and in AD brains accumulates somatic mutations whose burden inversely relates to mtDNA copy number [44–51].
We cannot establish whether reduced AD cybrid mtDNA drives AD cybrid tau changes, or simply serves as a marker of other responsible mtDNA features. Certainly the 9% reduction in the mean AD cybrid mtDNA copy level is much smaller than our EtBr-induced acute reduction, or its complete absence from ρ0 cells. Also, the pattern of tau changes in the acutely mtDNA-depleted cells more closely reflected the cybrid pattern of tau changes, even though the cybrids arguably model chronic mtDNA effects more closely than acute mtDNA effects.
SH-SY5Y neuronal cells express human tau at easily detectable levels but their tau biology differs from human brain tau biology. Most SH-SY5Y tau exists as the 03NR fetal isoform, while the adult human brain expresses six isoforms at relatively equal concentrations [15]. SH-SY5Y tau is also phosphorylated at many of the same sites as tau from AD brains [15]. We therefore narrowly conclude mtDNA-determined mitochondrial function can alter tau homeostasis, and this phenomenon applies in an ex vivo model of AD mitochondrial dysfunction.
We saw changes in the state of at least one kinase that phosphorylates tau during acute mtDNA depletion conditions, and tau phosphorylation at serine 199 changed under acute and chronic mtDNA depletion conditions. Total tau levels also changed, however, and proportionally tracked the phosphorylation changes so that the tau serine 199 phosphorylated to unphosphorylated ratio remained constant. We cannot say whether changes in tau phosphorylation affected tau oligomerization in our models. Multiple limitations apply to our models, for example SH-SY5Y cells are tumor cells whose tau protein is heavily phosphorylated at baseline. SH-SY5Y ρ0 cells do not differentiate well and we did not extend our analysis to differentiated cybrid lines, but reminiscent of undifferentiated SH-SY5Y cells undergoing mtDNA depletion, differentiated cells also exhibited a clear increase in tau oligomers and a monomer to oligomer shift.
Prior studies from our group and others found evidence of increased cytosolic and mitochondrial oxidative stress in AD cybrid cell lines [36, 52, 53]. We also previously reported AD cybrid cell lines decrease their NAD+/NADH ratio [54]. We did not determine whether oxidative stress or redox shifts contributed to the observed mtDNA-dependent tau oligomer increase; the exact biophysical drivers in this case remain unclear.
Parker et al. first identified reduced AD subject COX activity in 1990 and other reports followed [2, 55–62]. Investigators subsequently applied a cybrid approach to address the origin of this deficit [36]. Multiple studies concluded mtDNA does contribute, but the responsible mtDNA signature remains unclear [2, 14, 63, 64]. Data we now present potentially inform this question. Mitochondrial DNA copy numbers are reduced in AD cybrids, and COX activity appears particularly sensitive to mtDNA copy number. This suggests mtDNA control region variants that affect mtDNA replication could account, at least in part, for low AD COX activity. Overall, we conclude mtDNA influences mitochondrial function, which in turn can influence tau biology in ways that cause tau tangles to accumulate in the aging brain and to a greater extent in AD.
Acknowledgments
This study was supported by the University of Kansas Alzheimer’s Disease Center (P30 AG035982) and the Mabel A. Woodyard Foundation. The TOC1 antibody was a gift from Dr. Nicholas Kanaan at Michigan State University (originally created by Lester Binder at Northwestern University). The KU Flow Cytometry Core we used is sponsored in part by P30 GM103326 and P30 CA168524.
Footnotes
Conflict of Interest/Disclosure Statement
The authors have no conflict of interest to report.
References
- [1].Swerdlow RH (2007) Is aging part of Alzheimer’s disease, or is Alzheimer’s disease part of aging? Neurobiol Aging 28, 1465–1480. [DOI] [PubMed] [Google Scholar]
- [2].Swerdlow RH (2012) Mitochondria and cell bioenergetics: increasingly recognized components and a possible etiologic cause of Alzheimer’s disease. Antioxid Redox Signal 16, 1434–1455. [DOI] [PMC free article] [PubMed] [Google Scholar]
- [3].Manczak M, Reddy PH (2012) Abnormal interaction between the mitochondrial fission protein Drp1 and hyperphosphorylated tau in Alzheimer’s disease neurons: implications for mitochondrial dysfunction and neuronal damage. Hum Mol Genet 21, 2538–2547. [DOI] [PMC free article] [PubMed] [Google Scholar]
- [4].Quintanilla RA, Matthews-Roberson TA, Dolan PJ, Johnson GV (2009) Caspase-cleaved tau expression induces mitochondrial dysfunction in immortalized cortical neurons: implications for the pathogenesis of Alzheimer disease. J Biol Chem 284, 18754–18766. [DOI] [PMC free article] [PubMed] [Google Scholar]
- [5].Atlante A, Amadoro G, Bobba A, de Bari L, Corsetti V, et al. (2008) A peptide containing residues 26–44 of tau protein impairs mitochondrial oxidative phosphorylation acting at the level of the adenine nucleotide translocator. Biochim Biophys Acta 1777, 1289–1300. [DOI] [PubMed] [Google Scholar]
- [6].Cieri D, Vicario M, Vallese F, D’Orsi B, Berto P, et al. (2018) Tau localises within mitochondrial sub-compartments and its caspase cleavage affects ER-mitochondria interactions and cellular Ca(2+) handling. Biochim Biophys Acta Mol Basis Dis 1864, 3247–3256. [DOI] [PubMed] [Google Scholar]
- [7].Blass JP, Baker AC, Ko L, Black RS (1990) Induction of Alzheimer antigens by an uncoupler of oxidative phosphorylation. Arch Neurol 47, 864–869. [DOI] [PubMed] [Google Scholar]
- [8].Bruch J, Xu H, De Andrade A, Hoglinger G (2014) Mitochondrial complex 1 inhibition increases 4-repeat isoform tau by SRSF2 upregulation. PLoS One 9, e113070. [DOI] [PMC free article] [PubMed] [Google Scholar]
- [9].Hoglinger GU, Lannuzel A, Khondiker ME, Michel PP, Duyckaerts C, et al. (2005) The mitochondrial complex I inhibitor rotenone triggers a cerebral tauopathy. J Neurochem 95, 930–939. [DOI] [PubMed] [Google Scholar]
- [10].Rottscholl R, Haegele M, Jainsch B, Xu H, Respondek G, et al. (2016) Chronic consumption of Annona muricata juice triggers and aggravates cerebral tau phosphorylation in wild-type and MAPT transgenic mice. J Neurochem. [DOI] [PubMed] [Google Scholar]
- [11].Hollerhage M, Deck R, De Andrade A, Respondek G, Xu H, et al. (2014) Piericidin A aggravates Tau pathology in P301S transgenic mice. PLoS One 9, e113557. [DOI] [PMC free article] [PubMed] [Google Scholar]
- [12].Yamada ES, Respondek G, Mussner S, de Andrade A, Hollerhage M, et al. (2014) Annonacin, a natural lipophilic mitochondrial complex I inhibitor, increases phosphorylation of tau in the brain of FTDP-17 transgenic mice. Exp Neurol 253, 113–125. [DOI] [PubMed] [Google Scholar]
- [13].Escobar-Khondiker M, Hollerhage M, Muriel MP, Champy P, Bach A, et al. (2007) Annonacin, a natural mitochondrial complex I inhibitor, causes tau pathology in cultured neurons. J Neurosci 27, 7827–7837. [DOI] [PMC free article] [PubMed] [Google Scholar]
- [14].Swerdlow RH, Koppel S, Weidling I, Hayley C, Ji Y, et al. (2017) Mitochondria, Cybrids, Aging, and Alzheimer’s Disease. Prog Mol Biol Transl Sci 146, 259–302. [DOI] [PMC free article] [PubMed] [Google Scholar]
- [15].Zhong J, Iqbal K, Grundke-Iqbal I (1999) Hyperphosphorylated tau in SY5Y cells: similarities and dissimilarities to abnormally hyperphosphorylated tau from Alzheimer disease brain. FEBS Letters 453, 224–228. [DOI] [PubMed] [Google Scholar]
- [16].Shafiei SS, Guerrero-Munoz MJ, Castillo-Carranza DL (2017) Tau Oligomers: Cytotoxicity, Propagation, and Mitochondrial Damage. Front Aging Neurosci 9, 83. [DOI] [PMC free article] [PubMed] [Google Scholar]
- [17].Miller SW, Trimmer PA, Parker WD Jr., Davis RE (1996) Creation and characterization of mitochondrial DNA-depleted cell lines with “neuronal-like” properties. J Neurochem 67, 1897–1907. [DOI] [PubMed] [Google Scholar]
- [18].Swerdlow RH, Parks JK, Miller SW, Tuttle JB, Trimmer PA, et al. (1996) Origin and functional consequences of the complex I defect in Parkinson’s disease. Ann Neurol 40, 663–671. [DOI] [PubMed] [Google Scholar]
- [19].McKhann GM, Knopman DS, Chertkow H, Hyman BT, Jack CR Jr., et al. (2011) The diagnosis of dementia due to Alzheimer’s disease: Recommendations from the National Institute on Aging-Alzheimer’s Association workgroups on diagnostic guidelines for Alzheimer’s disease. Alzheimers Dement 7, 263–269. [DOI] [PMC free article] [PubMed] [Google Scholar]
- [20].Swerdlow RH, L E, Aires D, Lu J (2013) Glycolysis-respiration relationships in a neuroblastoma cell line. Biochimica et biophysica acta 1830, 2891–2898. [DOI] [PMC free article] [PubMed] [Google Scholar]
- [21].Ward SM, Himmelstein DS, Lancia JK, Fu Y, Patterson KR, et al. (2013) TOC1: characterization of a selective oligomeric tau antibody. J Alzheimers Dis 37, 593–602. [DOI] [PMC free article] [PubMed] [Google Scholar]
- [22].Patterson KR, Remmers C, Fu Y, Brooker S, Kanaan NM, et al. (2011) Characterization of prefibrillar Tau oligomers in vitro and in Alzheimer disease. The Journal of biological chemistry 286, 23063–23076. [DOI] [PMC free article] [PubMed] [Google Scholar]
- [23].Ghoshal N, Garcia-Sierra F, Wuu J, Leurgans S, Bennett DA, et al. (2002) Tau conformational changes correspond to impairments of episodic memory in mild cognitive impairment and Alzheimer’s disease. Exp Neurol 177, 475–493. [DOI] [PubMed] [Google Scholar]
- [24].Guo W, Jiang L, Bhasin S, Khan SM, Swerdlow RH (2009) DNA extraction procedures meaningfully influence qPCR-based mtDNA copy number determination. Mitochondrion 9, 261–265. [DOI] [PMC free article] [PubMed] [Google Scholar]
- [25].Rygiel KA, Grady JP, Taylor RW, Tuppen HA, Turnbull DM (2015) Triplex real-time PCR--an improved method to detect a wide spectrum of mitochondrial DNA deletions in single cells. Sci Rep 5, 9906. [DOI] [PMC free article] [PubMed] [Google Scholar]
- [26].Rio DC, Ares M Jr., Hannon GJ, Nilsen TW (2010) Purification of RNA using TRIzol (TRI reagent). Cold Spring Harb Protoc 2010, pdb.prot5439. [DOI] [PubMed] [Google Scholar]
- [27].Janssen AJ, Trijbels FJ, Sengers RC, Smeitink JA, van den Heuvel LP, et al. (2007) Spectrophotometric assay for complex I of the respiratory chain in tissue samples and cultured fibroblasts. Clin Chem 53, 729–734. [DOI] [PubMed] [Google Scholar]
- [28].Fotakis G, Timbrell JA (2006) In vitro cytotoxicity assays: Comparison of LDH, neutral red, MTT and protein assay in hepatoma cell lines following exposure to cadmium chloride. Toxicology Letters 160, 171–177. [DOI] [PubMed] [Google Scholar]
- [29].Hashiguchi K, Zhang-Akiyama QM (2009) Establishment of human cell lines lacking mitochondrial DNA. Methods Mol Biol 554, 383–391. [DOI] [PubMed] [Google Scholar]
- [30].Reddy P, Ocampo A, Suzuki K, Luo J, Bacman SR, et al. (2015) Selective elimination of mitochondrial mutations in the germline by genome editing. Cell 161, 459–469. [DOI] [PMC free article] [PubMed] [Google Scholar]
- [31].Nagy Z, Esiri MM, LeGris M, Matthews PM (1999) Mitochondrial enzyme expression in the hippocampus in relation to Alzheimer-type pathology. Acta Neuropathol 97, 346–354. [DOI] [PubMed] [Google Scholar]
- [32].Fiorese CJ, Schulz AM, Lin YF, Rosin N, Pellegrino MW, et al. (2016) The Transcription Factor ATF5 Mediates a Mammalian Mitochondrial UPR. Curr Biol 26, 2037–2043. [DOI] [PMC free article] [PubMed] [Google Scholar]
- [33].Weidling I, Swerdlow RH (2019) Mitochondrial Dysfunction and Stress Responses in Alzheimer’s Disease. Biology (Basel) 8. [DOI] [PMC free article] [PubMed] [Google Scholar]
- [34].Rocher C, Taanman JW, Pierron D, Faustin B, Benard G, et al. (2008) Influence of mitochondrial DNA level on cellular energy metabolism: implications for mitochondrial diseases. J Bioenerg Biomembr 40, 59–67. [DOI] [PubMed] [Google Scholar]
- [35].Fernandez-Vizarra E, Enriquez JA, Perez-Martos A, Montoya J, Fernandez-Silva P (2011) Tissue-specific differences in mitochondrial activity and biogenesis. Mitochondrion 11, 207–213. [DOI] [PubMed] [Google Scholar]
- [36].Swerdlow RH, Parks JK, Cassarino DS, Maguire DJ, Maguire RS, et al. (1997) Cybrids in Alzheimer’s disease: a cellular model of the disease? Neurology 49, 918–925. [DOI] [PubMed] [Google Scholar]
- [37].Rice AC, Keeney PM, Algarzae NK, Ladd AC, Thomas RR, et al. (2014) Mitochondrial DNA copy numbers in pyramidal neurons are decreased and mitochondrial biogenesis transcriptome signaling is disrupted in Alzheimer’s disease hippocampi. J Alzheimers Dis 40, 319–330. [DOI] [PubMed] [Google Scholar]
- [38].Wei W, Keogh MJ, Wilson I, Coxhead J, Ryan S, et al. (2017) Mitochondrial DNA point mutations and relative copy number in 1363 disease and control human brains. Acta Neuropathologica Communications 5, 13. [DOI] [PMC free article] [PubMed] [Google Scholar]
- [39].Zhang R, Wang Y, Ye K, Picard M, Gu Z (2017) Independent impacts of aging on mitochondrial DNA quantity and quality in humans. BMC genomics 18, 890–890. [DOI] [PMC free article] [PubMed] [Google Scholar]
- [40].Brown AM, Sheu RK, Mohs R, Haroutunian V, Blass JP (2001) Correlation of the clinical severity of Alzheimer’s disease with an aberration in mitochondrial DNA (mtDNA). J Mol Neurosci 16, 41–48. [DOI] [PubMed] [Google Scholar]
- [41].Davis RE, Miller S, Herrnstadt C, Ghosh SS, Fahy E, et al. (1997) Mutations in mitochondrial cytochrome c oxidase genes segregate with late-onset Alzheimer disease. Proc Natl Acad Sci U S A 94, 4526–4531. [DOI] [PMC free article] [PubMed] [Google Scholar] [Retracted]
- [42].Hirai K, Aliev G, Nunomura A, Fujioka H, Russell RL, et al. (2001) Mitochondrial abnormalities in Alzheimer’s disease. J Neurosci 21, 3017–3023. [DOI] [PMC free article] [PubMed] [Google Scholar]
- [43].de la Monte SM, Luong T, Neely TR, Robinson D, Wands JR (2000) Mitochondrial DNA damage as a mechanism of cell loss in Alzheimer’s disease. Lab Invest 80, 1323–1335. [DOI] [PubMed] [Google Scholar]
- [44].Attardi G, Schatz G (1988) Biogenesis of Mitochondria. Annual Review of Cell Biology 4, 289–331. [DOI] [PubMed] [Google Scholar]
- [45].Falkenberg M (2018) Mitochondrial DNA replication in mammalian cells: overview of the pathway. Essays in biochemistry 62, 287–296. [DOI] [PMC free article] [PubMed] [Google Scholar]
- [46].Stoneking M (2000) Hypervariable Sites in the mtDNA Control Region Are Mutational Hotspots. The American Journal of Human Genetics 67, 1029–1032. [DOI] [PMC free article] [PubMed] [Google Scholar]
- [47].Lee H-C, Li S-H, Lin J-C, Wu C-C, Yeh D-C, et al. (2004) Somatic mutations in the D-loop and decrease in the copy number of mitochondrial DNA in human hepatocellular carcinoma. Mutation Research/Fundamental and Molecular Mechanisms of Mutagenesis 547, 71–78. [DOI] [PubMed] [Google Scholar]
- [48].Macaulay V, Richards M, Hickey E, Vega E, Cruciani F, et al. (1999) The Emerging Tree of West Eurasian mtDNAs: A Synthesis of Control-Region Sequences and RFLPs. The American Journal of Human Genetics 64, 232–249. [DOI] [PMC free article] [PubMed] [Google Scholar]
- [49].Michikawa Y, Mazzucchelli F, Bresolin N, Scarlato G, Attardi G (1999) Aging-Dependent Large Accumulation of Point Mutations in the Human mtDNA Control Region for Replication. Science 286, 774. [DOI] [PubMed] [Google Scholar]
- [50].Coskun PE, Beal MF, Wallace DC (2004) Alzheimer’s brains harbor somatic mtDNA control-region mutations that suppress mitochondrial transcription and replication. Proc Natl Acad Sci U S A 101, 10726–10731. [DOI] [PMC free article] [PubMed] [Google Scholar]
- [51].Ridge PG, Kauwe JSK (2018) Mitochondria and Alzheimer’s Disease: the Role of Mitochondrial Genetic Variation. Curr Genet Med Rep 6, 1–10. [DOI] [PMC free article] [PubMed] [Google Scholar]
- [52].Cardoso SM, Santana I, Swerdlow RH, Oliveira CR (2004) Mitochondria dysfunction of Alzheimer’s disease cybrids enhances Abeta toxicity. J Neurochem 89, 1417–1426. [DOI] [PubMed] [Google Scholar]
- [53].Zhang H, Liu Y, Lao M, Ma Z, Yi X (2011) Puerarin protects Alzheimer’s disease neuronal cybrids from oxidant-stress induced apoptosis by inhibiting pro-death signaling pathways. Exp Gerontol 46, 30–37. [DOI] [PubMed] [Google Scholar]
- [54].Silva DF, Selfridge JE, Lu J, E L, Roy N, et al. (2013) Bioenergetic flux, mitochondrial mass and mitochondrial morphology dynamics in AD and MCI cybrid cell lines. Hum Mol Genet 22, 3931–3946. [DOI] [PMC free article] [PubMed] [Google Scholar]
- [55].Parker WD Jr., Filley CM, Parks JK (1990) Cytochrome oxidase deficiency in Alzheimer’s disease. Neurology 40, 1302–1303. [DOI] [PubMed] [Google Scholar]
- [56].Kish SJ, Bergeron C, Rajput A, Dozic S, Mastrogiacomo F, et al. (1992) Brain cytochrome oxidase in Alzheimer’s disease. J Neurochem 59, 776–779. [DOI] [PubMed] [Google Scholar]
- [57].Mutisya EM, Bowling AC, Beal MF (1994) Cortical cytochrome oxidase activity is reduced in Alzheimer’s disease. J Neurochem 63, 2179–2184. [DOI] [PubMed] [Google Scholar]
- [58].Parker WD Jr., Mahr NJ, Filley CM, Parks JK, Hughes D, et al. (1994) Reduced platelet cytochrome c oxidase activity in Alzheimer’s disease. Neurology 44, 1086–1090. [DOI] [PubMed] [Google Scholar]
- [59].Parker WD Jr., Parks J, Filley CM, Kleinschmidt-DeMasters BK (1994) Electron transport chain defects in Alzheimer’s disease brain. Neurology 44, 1090–1096. [DOI] [PubMed] [Google Scholar]
- [60].Cardoso SM, Proenca MT, Santos S, Santana I, Oliveira CR (2004) Cytochrome c oxidase is decreased in Alzheimer’s disease platelets. Neurobiol Aging 25, 105–110. [DOI] [PubMed] [Google Scholar]
- [61].Bosetti F, Brizzi F, Barogi S, Mancuso M, Siciliano G, et al. (2002) Cytochrome c oxidase and mitochondrial F1F0-ATPase (ATP synthase) activities in platelets and brain from patients with Alzheimer’s disease. Neurobiol Aging 23, 371–376. [DOI] [PubMed] [Google Scholar]
- [62].Fisar Z, Hroudova J, Hansikova H, Spacilova J, Lelkova P, et al. (2016) Mitochondrial Respiration in the Platelets of Patients with Alzheimer’s Disease. Curr Alzheimer Res 13, 930–941. [DOI] [PubMed] [Google Scholar]
- [63].Swerdlow RH (2018) Mitochondria and Mitochondrial Cascades in Alzheimer’s Disease. J Alzheimers Dis 62, 1403–1416. [DOI] [PMC free article] [PubMed] [Google Scholar]
- [64].Swerdlow RH, Burns JM, Khan SM (2014) The Alzheimer’s disease mitochondrial cascade hypothesis: progress and perspectives. Biochim Biophys Acta 1842, 1219–1231. [DOI] [PMC free article] [PubMed] [Google Scholar]