Abstract
Purpose:
To evaluate both velocity and spatial responses of velocity-selective arterial spin labeling (VS-ASL), using velocity-insensitive and velocity-compensated waveforms for control modules, as well as a novel dynamic phase-cycling approach, at different B0/B1+ field inhomogeneities.
Methods:
In the presence of imperfect refocusing, the mechanism of phase-cycling the refocusing pulses through four dynamics was first theoretically analyzed with the conventional velocity-selective saturation (VSS) pulse train. Numerical simulations were then deployed to compare the performance of the Fourier-transform based velocity-selective inversion (FT-VSI) with these three different schemes in terms of both velocity and spatial responses under various B0/B1+ conditions. Phantom and human brain scans were performed to evaluate the three methods at B1+ scales of 0.8, 1.0, and 1.2.
Results:
The simulations of FT-VSI showed that, under nonuniform B0/B1+ conditions, the scheme with velocity-insensitive control was susceptible to DC bias of the static spins as systematic error, while the scheme with velocity-compensated control had deteriorated velocity-selective labeling profiles and thus reduced labeling efficiency. Through numerical simulation, phantom scans, and brain perfusion measurements, the dynamic phase-cycling method demonstrated considerable improvements over these issues.
Conclusion:
The proposed dynamic phase-cycling approach was demonstrated for the velocity-selective label and control modules with both velocity and spatial responses robust to a wide range of B0 and B1+ field inhomogeneities.
Keywords: cerebral blood flow, arterial spin labeling, velocity-selective inversion, B0 field inhomogeneity, B1+ field inhomogeneity
Introduction
Different from arterial spin labeling (ASL) methods that apply spatially selective labeling pulses at feeding arteries distant from imaging volume, velocity-selective (VS) ASL techniques label the upstream blood flowing above a certain cutoff velocity in order to alleviate the sensitivity to arterial transit delay (1–5). Conventional velocity-selective saturation (VSS) based labeling employs a simple T2 preparation pulse train with velocity-encoding gradients surrounding a pair of refocusing pulses. Improvements were made to ensure VS profiles by employing BIR-8 adiabatic pulses to reduce their susceptibility to B0/B1+ field inhomogeneities and eddy currents (6,7).
Recently, Fourier-transform based velocity-selective inversion (FT-VSI) prepared ASL studies have demonstrated improved SNR for brain perfusion mapping with 2D (8) and 3D (9) acquisitions, respectively. FT-VSI applied paired and phase-cycled refocusing pulses to boost immunity to B0/B1+ field inhomogeneities and eddy current (8–10). Nonetheless, imperfect refocusing at poor B0/B1+ conditions was found to cause spatial stripe artifacts in VS-MRA (11,12). This issue was not previously noticed in VS-ASL based perfusion imaging, as the periodic stripes with high spatial frequency could be averaged out in voxels of the lower resolution.
In addition to the stripe artifacts, a non-zero DC component (DC bias) was newly identified in the current study of VS pulse trains (see simulation result). This would cause subtraction mismatch of the background static tissue between label and control scans in VS-ASL and lead to inaccurate perfusion quantification, especially when applying a control module with gradients turned off (velocity-insensitive, specified as scheme 1 in this study). Note that velocity-insensitive control has been the choice of the control method for all conventional VSS prepared VS-ASL studies (1–4). Alternatively, a control module with gradients kept as unipolar (velocity-compensated, specified as scheme 2) has been employed. With this approach, lower artifactual perfusion quantification errors were demonstrated on phantoms in the original FT-VSI work (8). However, comparing to velocity-insensitive controls through simulations, velocity-compensated waveforms were known to be more sensitive to B0/B1+ offsets and eddy currents, with the first degrading the VS profiles and undermining the labeling efficiency and the latter inducing artifacts (8,9). Representative phenomenon of these issues for schemes 1 and 2 are illustrated in Figures 1 (a–d) and explained with more details in the Results Section.
Figure 1:
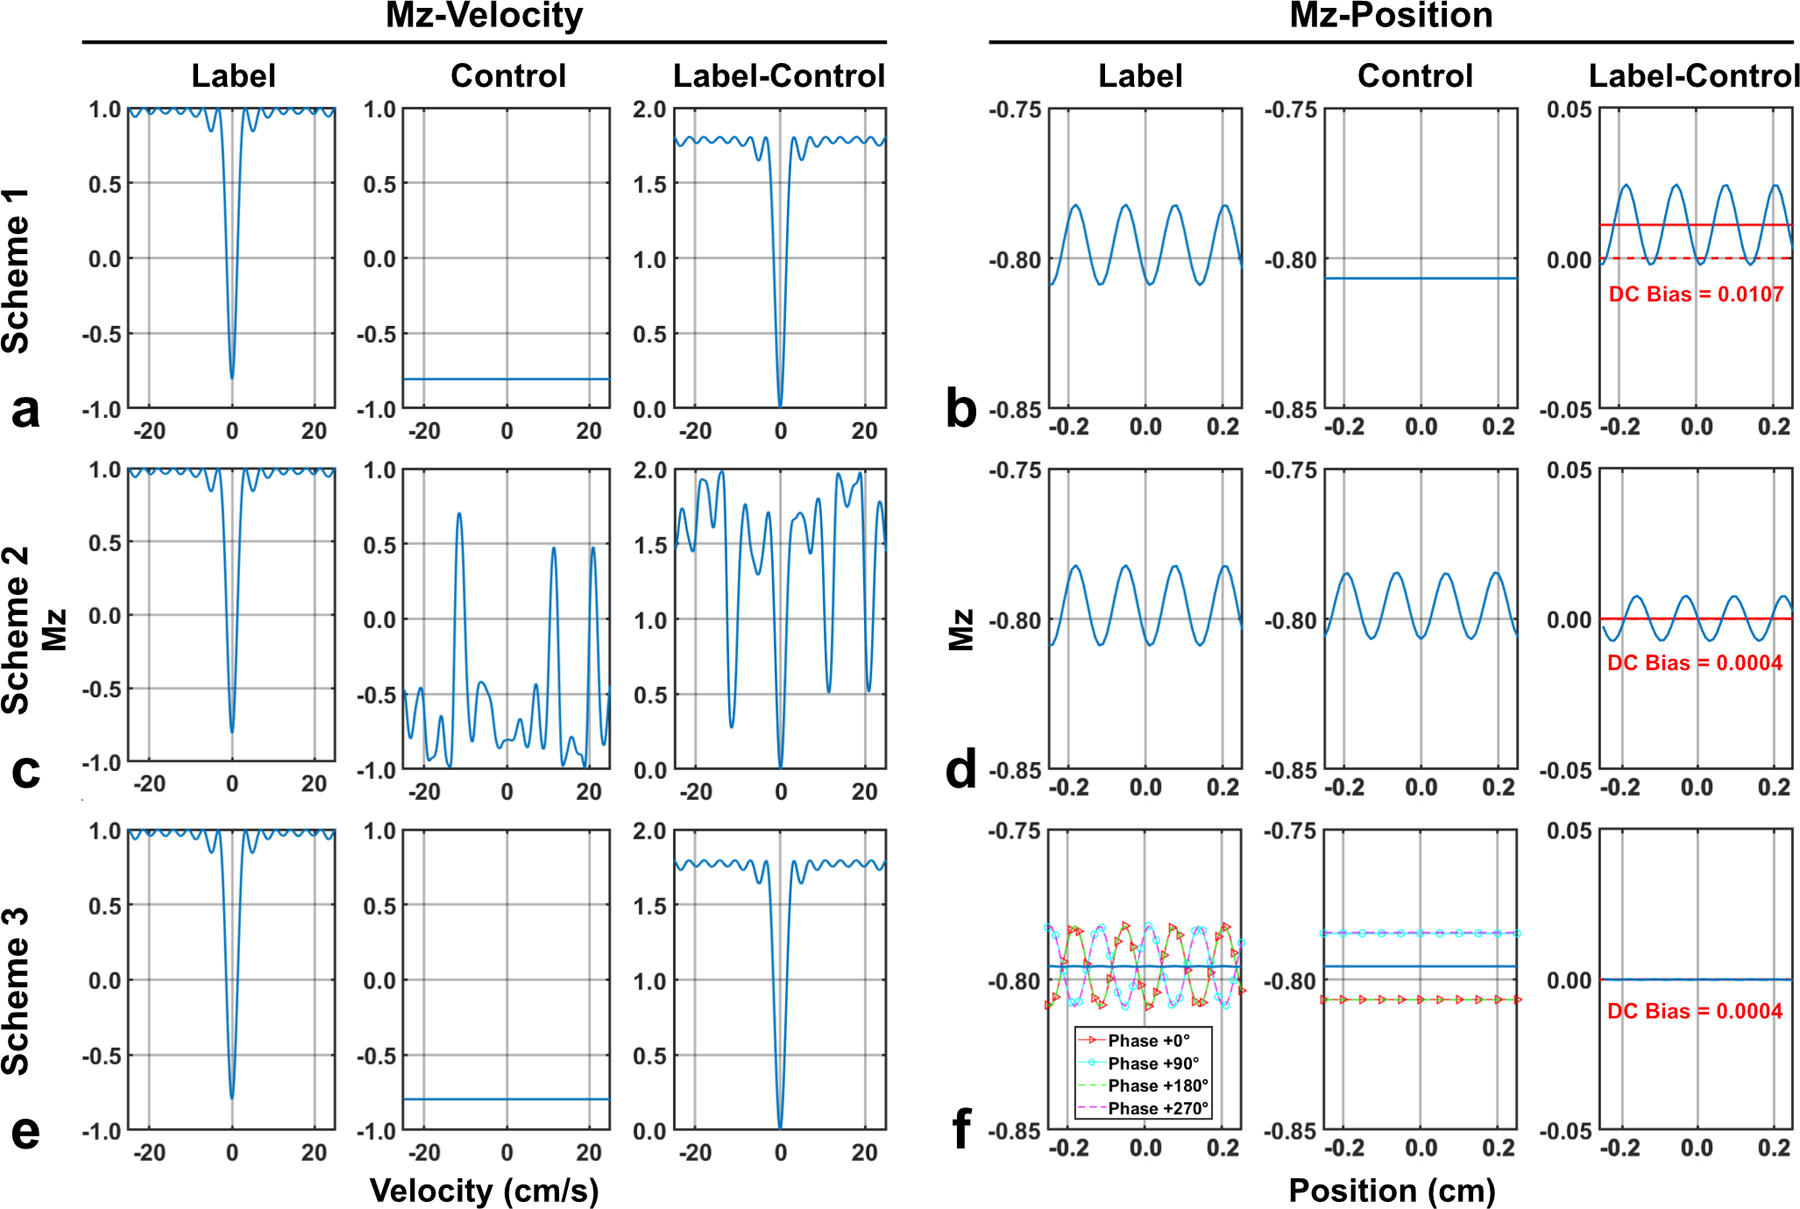
Simulated Mz-velocity profiles (position = 0 cm) and Mz-position profiles (velocity = 0 cm/s) of FT-VSI label and control pulse trains at the B1+ scale of 0.8 and their subtractions with (a,b) scheme 1 using velocity-insensitive control; (c,d) scheme 2 using velocity-compensated control; and (e,f) scheme 3 using dynamic phase-cycling. For both label and control in scheme 3 (f), Mz-position profiles from all four phases were shown by four colored dashed lines. In Mz-position profiles (b,d,f), solid red lines indicate the DC bias averaged from signals at all positions. In contrast to spatial response of scheme 1 (b) and velocity response of scheme 2 (c), scheme 3 showed well-preserved velocity-selective profile (e) as well as minimal spatial stripe artifact and DC bias (f).
In this work, a novel dynamic phase-cycling approach based on velocity-insensitive control (specified as scheme 3) was proposed to mitigate the systematic quantification errors from DC bias as well as stripe artifacts for both conventional VSS and FT based VS-ASL sequences. This would ensure the robustness to B0/B1+ field inhomogeneities for both their velocity and spatial responses. Theoretical analysis was first performed using the conventional VSS pulse train. Numerical simulation, phantom evaluation, and brain perfusion scans were then conducted to demonstrate improved FT-VSI prepared ASL at 3T.
Methods
Dynamic Phase-Cycling
For the velocity response of the FT-VS pulse trains, the MLEV phase-cycling of the refocusing pulses within each FT-VS pulse train was to improve the immunity to B0/B1+ inhomogeneities (10) and gradient imperfections such as eddy currents (8). To alleviate the errors incurred in the spatial response, a novel phase-cycling method was proposed to apply additional 90° phases only to the refocusing pulses through every four dynamics, and keep the phases of the excitation pulses, i.e.: the first dynamic +0°; the second dynamic +90°; the third dynamic +180° and the fourth dynamic +270°, as illustrated in Supporting Information Figure S1. Based on our theoretical deduction for the conventional VSS pulse trains (see Appendix for the theory), after averaging the four dynamics, both the stripe artifacts and DC bias would mostly be canceled, yielding a much cleaner subtraction.
Numerical Simulation
Using Matlab (MathWorks, Inc., Natick, MA, USA), numerical simulations were conducted based on Bloch equations. In order to evaluate the effect of B0/B1+ field inhomogeneities on labeling efficiency and subtraction errors of various FT-VSI label/control modules, the longitudinal magnetization (Mz) responses over flowing velocity and static position under different B0 off-resonance and B1+ scales were compared for three schemes: 1) velocity-insensitive control; 2) velocity-compensated control; 3) velocity-insensitive control as in scheme 1, but with dynamic phase-cycling applied to both label and control.
A 64 ms FT-VSI pulse train, as specified in (9), was composed of nine excitation pulses (20° hard pulses, 0.06 ms) interleaved with eight velocity-encoding steps (8 ms). Each step contained paired composite refocusing pulses (90°x180°y90°x, 1 ms) and four velocity-encoding triangular gradient lobes (30 mT/m, 0.6 ms duration composed of 0.3 ms ramp up and down, 2 cm/s cutoff velocity). The sixteen refocusing pulses through each pulse train were phase-cycled with a MLEV-16 scheme.
With above-described label/control modules with three schemes, Mz-velocity response (from ±25 cm/s with an interval of 0.1 cm/s) and Mz-position response (from ±0.25 cm with an interval of 0.01 cm) of FT-VSI were simulated at a wide range of B0/B1+ offset: B0 = ±300 Hz and B1+ scale = ±0.4. Mz-position response reveals the pattern of the stripes within a range of 0.5 cm, which is about the typical slice thickness in ASL. DC-bias was calculated by averaging the Mz over the position range. T1 and T2 effects were not accounted for in these simulations.
Experiments
All experiments were performed on a 3T scanner (Prisma, Siemens Healthineers, Erlangen, Germany) with a 20-channel head/neck receiver coil.
Evaluations of DC-bias of FT-VSI ASL sequence were performed on a spherical oil phantom and five healthy volunteers (two females, 32 ± 5 years old). All volunteers participated in this study after providing informed consent in accordance with the local Institutional Review Board guidelines.
Pulse Sequences
The 3D VSI-ASL sequence was recently described in detail (9), including five blocks for each dynamic: slab-selective saturation module for background suppression, label/control module using FT-VSI pulse trains (as specified above), non-selective inversion pulses for background suppression, flow-dephasing module for suppressing large-vessel signal, and 3D readout.
A six-segmented 3D gradient- and spin-echo (GRASE) readout was used as acquisition, with an imaging volume of 220×220×96 mm3 and acquisition resolution of 3.4×3.4×4.0 mm3, which was reconstructed to 1.7×1.7×4.0 mm3 on the scanner. The EPI factor was 23, and bandwidth was 2894 Hz. With a fast spin-echo (FSE) factor of 10 and an echo spacing of 16.5 ms, the echo train duration was 165 ms for lowering T2-decay induced blurring and increasing SNR efficiency (13).
Since scheme 1 was included in scheme 3 (1 out of every 4 dynamics), only schemes 2 and 3 were evaluated in both the phantom and human brain experiments. B1+ settings 0.8, 1.0, and 1.2 were manually adjusted by scaling the B1+ of all RF pulses in label/control modules. Additional B0 offset was not added in these experiments to avoid further image distortion during the GRASE acquisition. A 2.0 s delay was placed between slab-selective saturation and label/control module on the assumption that blood labeled in the previous dynamic can be replenished by inflowed fresh arterial blood. PLD was 0.1 s for the phantom and 1.5 s for human brains. TR was chosen as short as possible so that four dynamics were acquired in around 2.4 min for the phantom and 3.2 min for the brain scans respectively.
Proton density-weighted image of signal intensity as an estimate of the equilibrium magnetization of tissue (M0) was acquired with a similar readout (TR = 10.0 s). A double inversion recovery (DIR) sequence with two inversion pulses (TR = 10.0 s; TI1 = 3.58 s; TI2 = 0.48 s) applied before readout to suppress both CSF and white matter was also acquired to visualize gray matter only. Both images were collected with the same 3D GRASE acquisition scheme as used in the ASL protocols.
Data Analysis
Experimental data were processed using Matlab and ImageJ (Rasband W., National Institutes of Health, USA, ver. 1.51s). Normalized perfusion-weighted signal was calculated as:
| [1] |
where is label signal, is control signal, and is the M0 signal of tissue.
CBF was quantified as:
| [2] |
where the unit of CBF is mL/100g/min and λ (= 0.9 mL/g) is the blood/tissue water partition coefficient; is the labeling efficiency estimated to be 0.57 (8); is the correction factor for background suppression assuming a 0.95 efficiency for each inversion pulse; (= 20 ms) is TE of the flow dephasing module; is T2 of gray matter assumed to be 80 ms; (= 1.65 s) is the estimate of effective T1 by taking average of gray matter T1 (1.4 s) and blood T1 (1.9 s) (14,15).
Whole-brain ROI was manually drawn on all slices of M0. A gray matter ROI was generated by applying a manually chosen threshold on the DIR image. Student’s t-tests were performed to test the signal differences between methods.
Results
Numerical Simulation
Figure 1 shows the Mz-velocity and Mz-position responses of FT-VSI for three different schemes at the B1+ scale of 0.8 as an example. FT-VSI labeling pulse train led to well-maintained velocity-selective inversion profile, in which flowing spins remained at M0 and static spins got partially inverted as the result of scaled B1+ amplitude (close to cos(180°×0.8) = −0.81). Thus, velocity-insensitive control (scheme 1) produced universal inversion to the same degree, and their corresponding subtractions reflected a reduced labeling efficiency, (label-control)/M0 ≈ 0.90 (Figure 1a). For static tissue, stripe artifact with a period of ~0.16 cm was manifested only in the spatial response of the labeling pulse and was remained in the subtracted result. The stripes were also characterized with an average as DC-bias of 1.07% of M0 (Figure 1b). On the contrary, velocity-compensated control (scheme 2) generated uneven inversion across the velocity range for control and consequently poor labeling efficiency with incorrect B1+ (Figure 1c), but matched spatial stripe artifact between label and control and thus rather small errors with both stripe and DC-bias (0.04% of M0) after subtraction (Figure 1d). In comparison, dynamic phase-cycling after averaging (scheme 3) achieved the same velocity-selective profile as scheme 1 (Figure 1e), almost invisible spatial stripe artifact, and same DC-bias (0.04% of M0) as scheme 2 (Figure 1f). Phase-cycling of the refocusing pulses in each dynamic generated various shift of the spatial stripes for label pulses as well as marginally different inversion degrees for control pulses (Figure 1(f), the dashed lines). Note that the averaged Mz following the control of scheme 3 is −0,79, slightly lower than −0.81 as in scheme 1 (Figure 1b). As scheme 3 used the same velocity-insensitive control without applying gradients as in scheme 1, the Mz-position responses of their control pulses for the four dynamics are also spatially uniform (Figure 1f).
Similar patterns were observed in B1+ scales varying from 0.8 to 1.2, as shown in Figure 2. Larger B1+ offset gave rise to more severe spatial stripe artifacts for FT-VSI labeled signal. As velocity-insensitive control did not have such artifacts, scheme 1 yielded a stripe artifact and DC-bias in subtraction with severity dependent on B1+ (red arrowhead in Figure 2b). The velocity-compensated control produced spatial stripe artifacts close to those of the label signal, regardless of B1+ level. This resulted in mitigated subtraction errors in scheme 2 (Figure 2d). However, with further B1+ deviations, a velocity-compensated control had more corrupted Mz-velocity profile, which lowered the labeling efficiency for scheme 2 (blue arrowhead in Figure 2c). Dynamic phase-cycling (Scheme 3) only suffered B1+ dependent labeling efficiency with intact velocity-selective profiles as scheme 1 (Figure 2e) and did not exhibit any sensitivity to B1+ in spatial responses after subtractions (Figure 2f).
Figure 2:
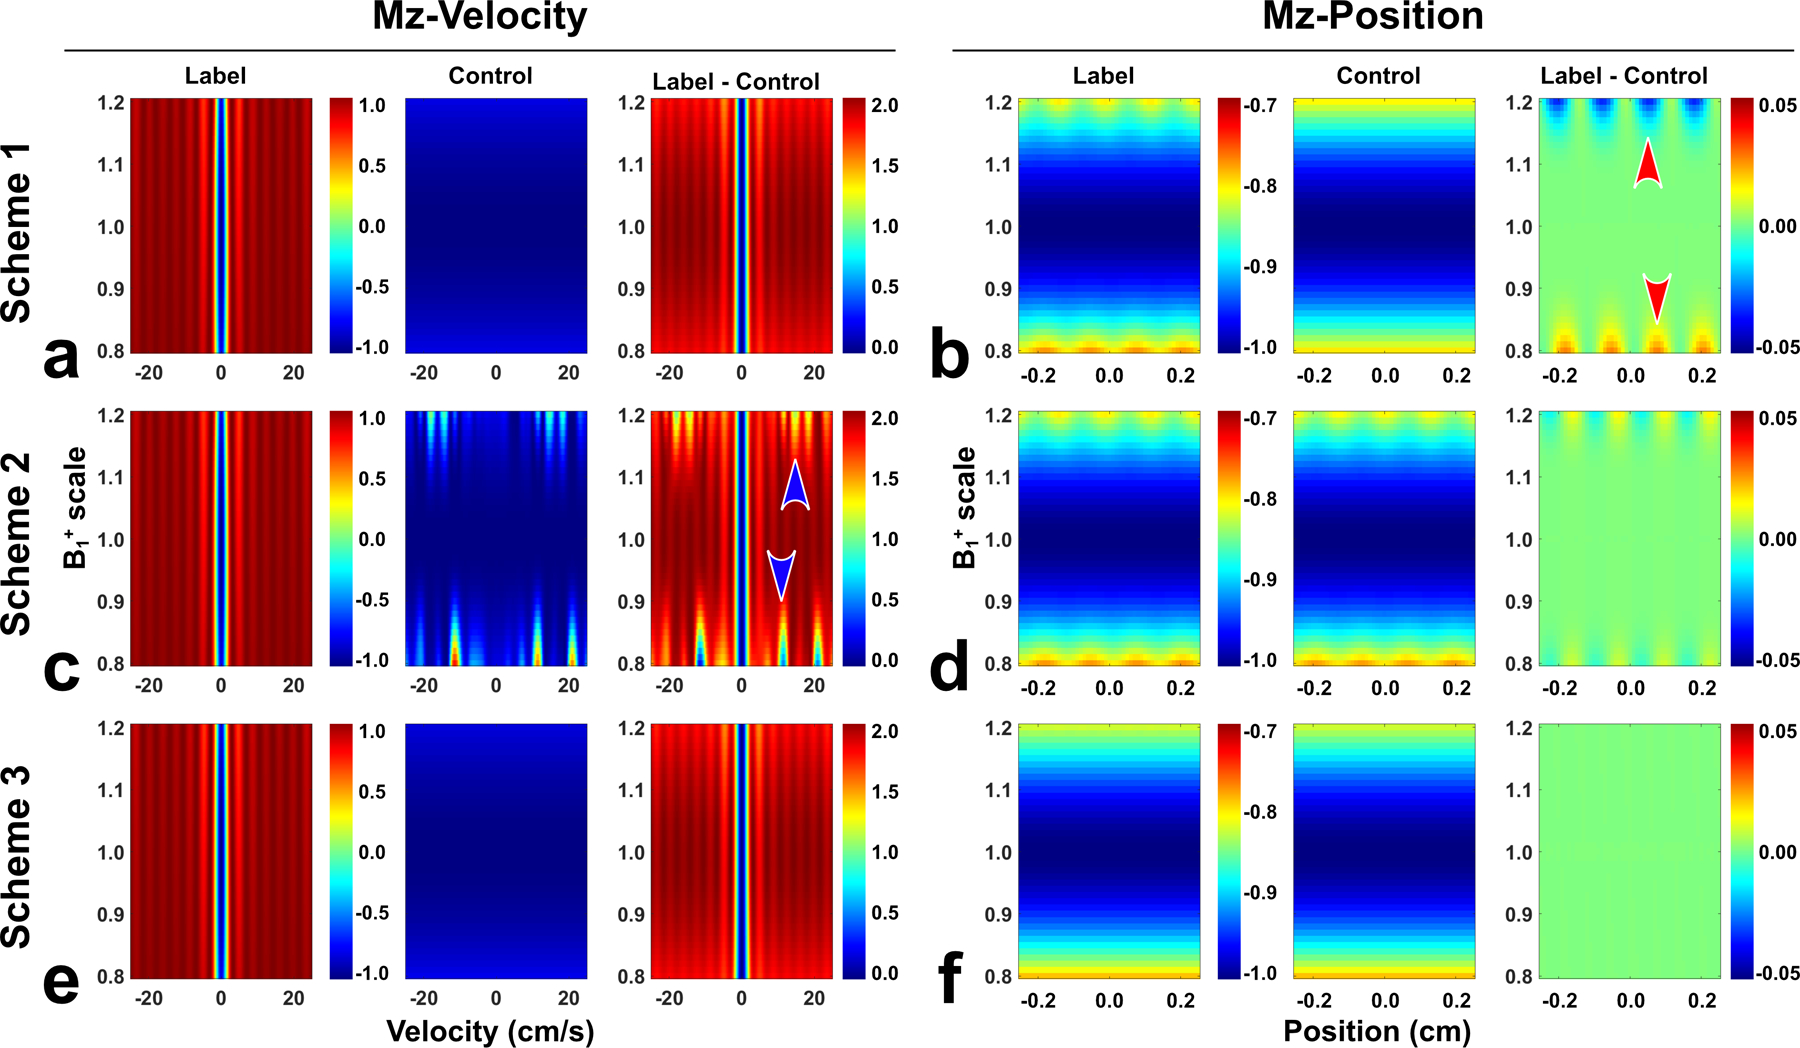
Simulated Mz-velocity profiles and Mz-position profiles of FT-VSI label and control pulse trains at a B1+ scale range of 0.8 – 1.2 and their subtractions with (a,b) scheme 1 using velocity-insensitive control; (c,d) scheme 2 using velocity-compensated control; and (e,f) scheme 3 using dynamic phase-cycling. Compared to schemes 1 and 2, scheme 3 yielded both velocity and spatial responses with much less susceptibility to B1+ variations.
Comparable results of the velocity and spatial responses of the three schemes with regard to B0 off-resonance of ±200 Hz are displayed in Supporting Information Figure S3, showing both the spatial stripe artifact and DC bias mostly using scheme 1 (Figure S3b) and distorted velocity-selective profile using scheme 2 (Figure S3a). When DC bias is plotted as functions of combined B0/B1+, similar performance of spatial responses of different schemes are revealed in Figure 3. Within typical field conditions of human brain at 3T (B0 = ±200 Hz and B1+ scale = ±0.3), the DC bias as false perfusion signal could be over ±10% of M0 at the worst field offset combinations using scheme 1 (the individual dynamic phase of (Figure 3b)). This was considerably mitigated to less than 1% with scheme 2 (Figure 3a) or two dynamics of phase-cycling (Figure 3b). With four dynamics of phase-cycling (scheme 3), more complete cancelation was achieved (Figure 3b). Note that relative to the perfect condition at B1+ = 1.0, the DC bias at higher and lower B1+ offsets do not show symmetry, with or without B0 off-resonance (Figures 2 and 3).
Figure 3:
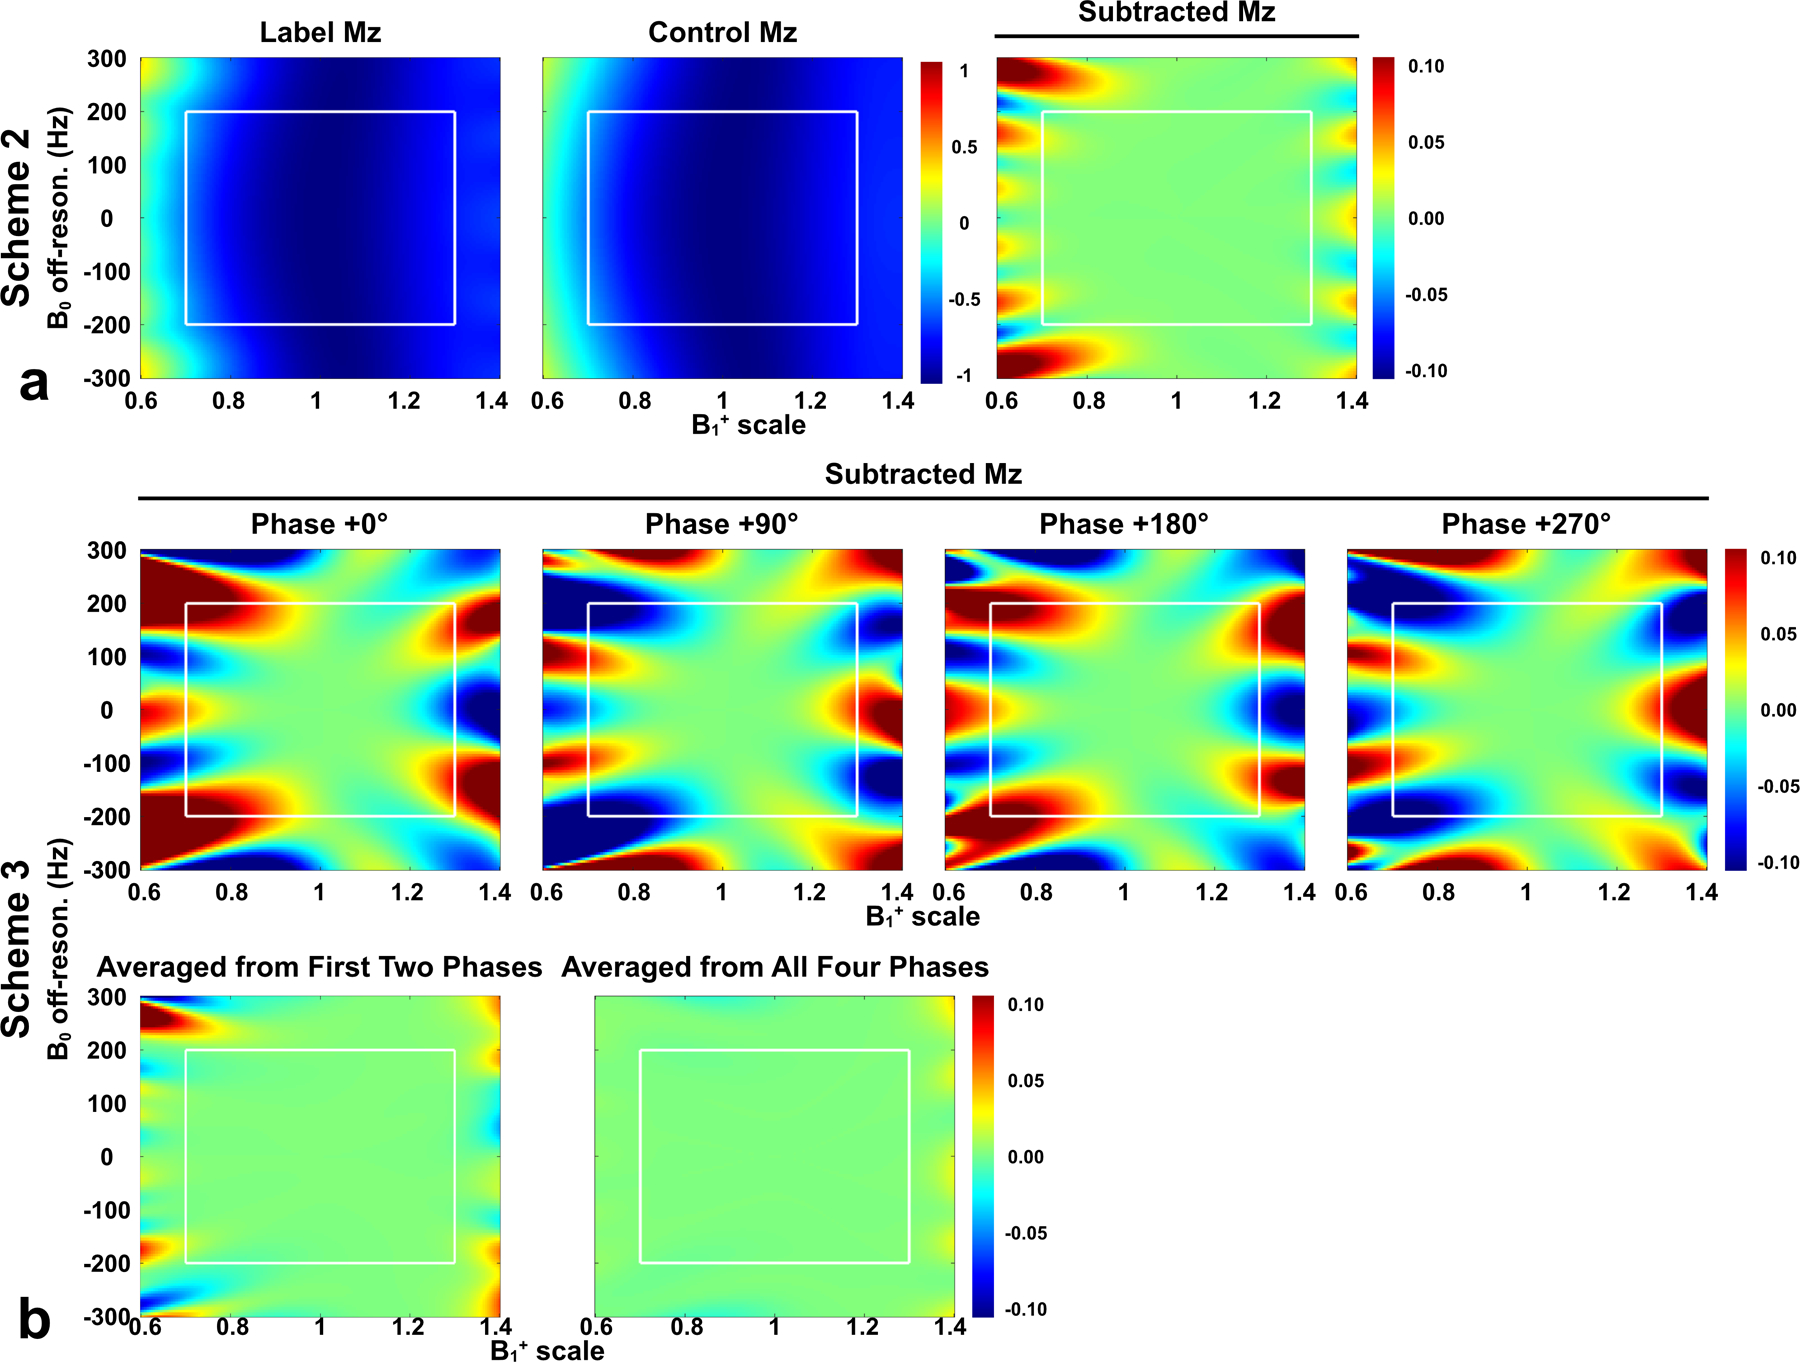
DC bias of Mz-position profiles following simulation of FT-VSI pulse trains with a range of B0 (±300 Hz) and B1+ (±0.4). Label, control, and subtracted Mz were shown for (a) scheme 2 using velocity-compensated control, while only subtracted Mz was shown for (b) scheme 3 using dynamic phase-cycling. In scheme 3, four individual dynamic phases (second row) and averages of first two phases and all four phases (third row) were shown. Note that scheme 3 with the phase of 0° was just scheme 1. White rectangles indicated the typical B0/B1+ range of human brain at 3T (B0: ±200 Hz; B1+ scale: ±0.3). Compared to the other two schemes, scheme 3 considerably mitigated the DC bias as false perfusion signal.
Phantom Experiments
The normalized subtraction results of phantom scans at three B1+ scales are shown with four dynamics separately and their averages in Figure 4. For scheme 2 (Figure 4a), a false positive signal (~0.50% of M0) was present at B1+ scale of 0.8, which was consistent across dynamics. Some false negative signal could also be seen at the edge of the phantom with B1+ scale of 1.2, probably due to combined B0 and B1+ imperfections. Each of the four dynamics of scheme 3, as scheme 1 by oneself, generated an overall stronger false signal than scheme 2 (Figure 4b). However, they were positive or negative due to the dynamic phase-cycling and were mostly canceled after averaging (B1+ scale of 0.8: from 1.91%, −1.39%, 0.15%, −0.80% to 0.04% of M0).
Figure 4:
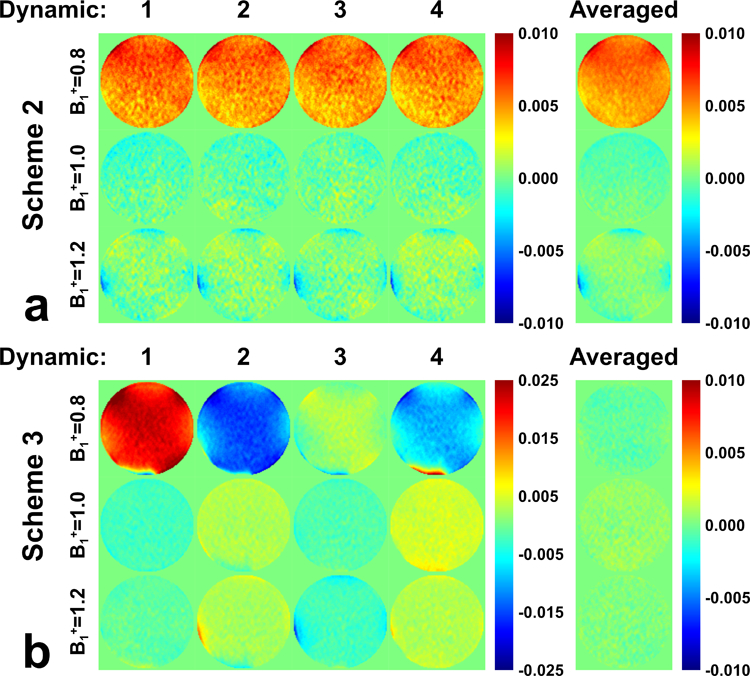
Evaluations of DC bias on the phantom with FT-VSI prepared ASL (post labeling delay = 0 ms) at B1+ scale of 0.8, 1.0, and 1.2 with (a) scheme 2 using velocity-compensated control and (b) scheme 3 using dynamic phase-cycling. Normalized subtracted signal from each dynamic label/control pairs are shown along with their averages. For scheme 3, although each dynamic generated strong false signal, they were mostly canceled after averaging.
In vivo Experiments
Brain perfusion maps from both schemes 2 and 3 at three B1+ scales are displayed in Figure 5 of one axial slice with four dynamics. Their orthogonal views are shown in Figure 6. Similar to the phantom results, the results of each individual dynamic were steady for scheme 2 but altered markedly using the scheme 3 with dynamic phase-cycling in some brain regions with poor B0 or B1 shimming, such as the positive and negative signal fluctuation in the frontal cortex (Figure 5). For scheme 2, the B1+ scale of 0.8 showed a higher “CBF” signal than B1+ of 1.2, although with almost similar theoretical labeling efficiency (see Figure 2c). This asymmetry was likely caused by asymmetric DC bias of scheme 2, as indicated by phantom results in Figure 4a. In scheme 3, in contrast, although for each dynamic the calculated images at B1+ scales of 0.8 and 1.2 were very different, they showed consistent signal after averaging, indicating the benefit of dynamic phase-cycling. In addition, poor signal at the bottom of the brain was observed for the B1+ scale of 1.2 with scheme 2 (Figure 6, red arrowhead), likely caused by poor labeling efficiency due to B1+ imperfection as indicated in simulation (Figure 2c, blue arrowhead). Such pseudo perfusion deficit was nearly removed in scheme 3. Note that, in principle, the B1+ scale of 0.8 should have a similar problem but might be disguised by positive DC bias, which was also observed on phantom (Figure 4a). As shown in the simulation results (Figure 3), the polarity and magnitude of the DC bias are determined by the local B0 and B1+ field distributions.
Figure 5:
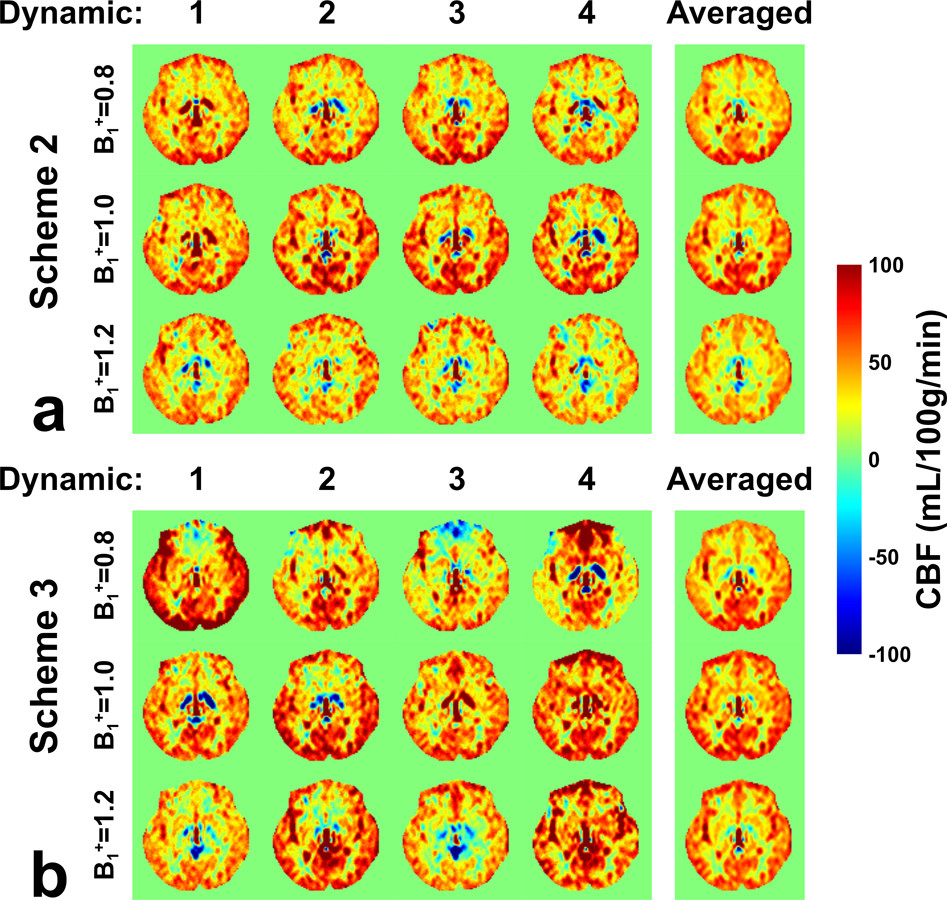
Evaluations of DC bias using FT-VSI prepared brain ASL (post labeling delay = 1500 ms, one axial slice) at the B1+ scale of 0.8, 1.0, and 1.2 with (a) scheme 2 using velocity-compensated control and (b) scheme 3 using dynamic phase-cycling. Calculated CBF maps from each dynamic label/control pairs are shown along with their averages. Compared to scheme 2, scheme 3 generated some variable signal through dynamics in some brain regions, such as in frontal cortex, but after averaging, delivered CBF maps with more consistency across different B1+ scales.
Figure 6:
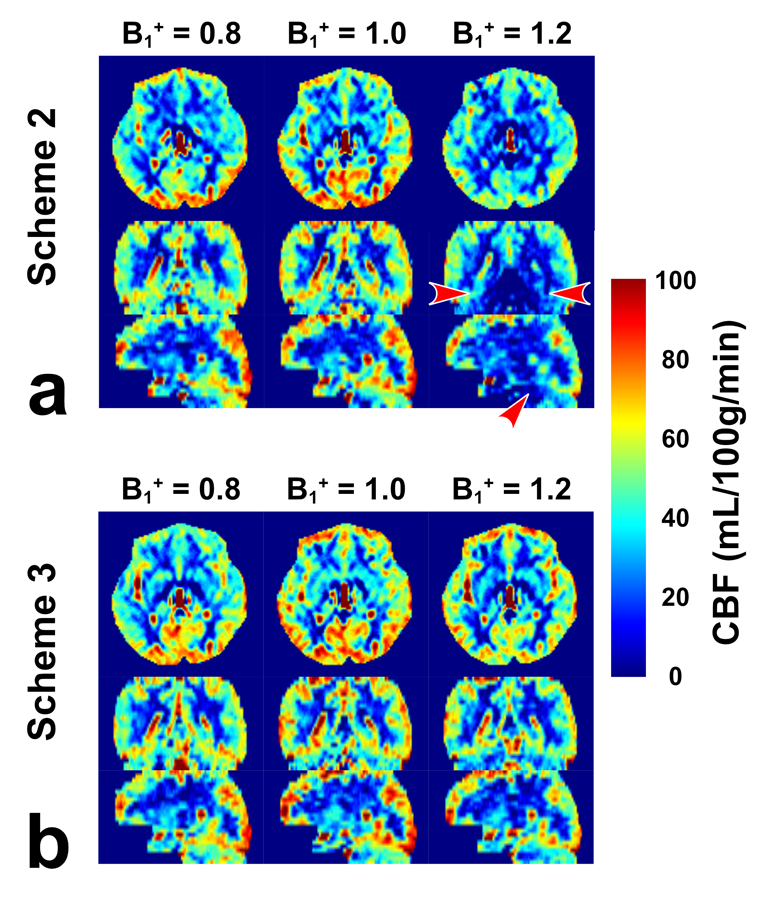
CBF maps acquired from the FT-VSI prepared brain ASL along axial, sagittal and coronal views at the B1+ scale of 0.8, 1.0, and 1.2 with (a) scheme 2 using velocity-compensated control and (b) scheme 3 using dynamic phase-cycling. Scheme 3 markedly reduced the pseudo perfusion deficit at the base of the brain produced by scheme 2 with the B1+ scale of 1.2 (a, red arrowhead).
At B1+ scales of 0.8, 1.0, 1.2, averaged CBF within gray matter of all five subjects are 49.3, 52.1, 33.4 mL/100g/min from scheme 2 and 45.9, 52.7, 43.1 mL/100g/min from scheme 3, respectively (Figure 7). The CBF values at B1+ scale of 1.0 did not vary much between the two schemes. Compared to B1+ = 1.0 for the 180⁰ VSI, B1+ scale of 0.8 and 1.2 should both yield 90% of the labeling efficiency (shown in Figure 2a and calculated in the section of simulation results for Figure 1a). However, the CBF obtained from the two B1+ offset was 94.6% and 64.1% of the ones from B1+ = 1.0 respectively in scheme 2, which were significantly different (p-value < 0.01). In scheme 3, the two results were 87.1% vs. 81.8% (p-value = 0.43), much closer to 90% as theoretically predicted perfusion signal due to reduction of labeling efficiency. This indicated that the dynamic phase-cycling scheme reduced DC bias and improved labeling efficiency at poor B0/B1+ conditions.
Figure 7:
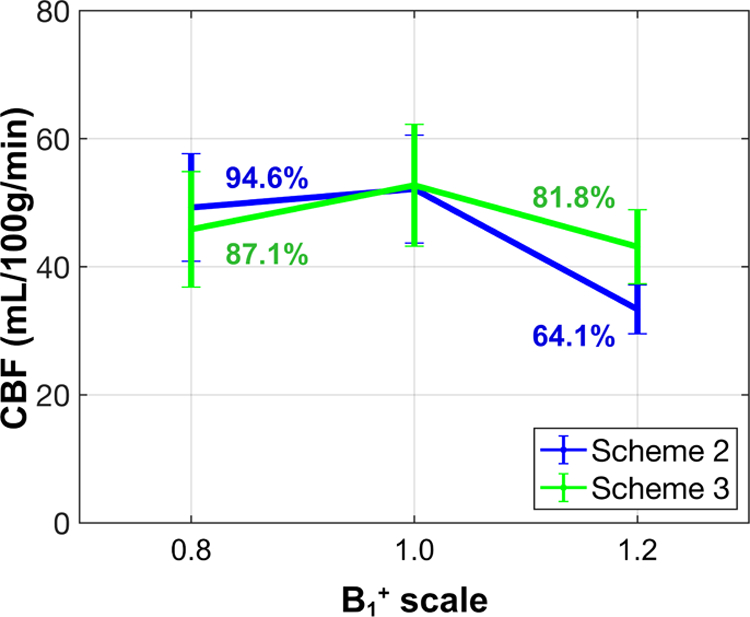
Averaged gray matter CBF of all five subjects, quantified from the FT-VSI prepared brain ASL at B1+ scale of 0.8, 1.0, and 1.2, with scheme 2 using velocity-compensated control and scheme 3 using dynamic phase-cycling. The respective signal levels at B1+ scales of 0.8 and 1.2 relative to the ones from B1+ = 1.0 are labeled in %.
Discussion
In this work, a comprehensive analysis of both the velocity and spatial responses of FT-VSI pulse trains was conducted for different label and control modules in the presence of B0/B1+ field inhomogeneities. Employing velocity-insensitive control would give rise to subtraction errors from static spins (DC bias), while using velocity-compensated control could lead to hampered velocity-selective profiles and labeling efficiency. The proposed dynamic phase-cycling approach was demonstrated to circumvent both problems for FT-VSI prepared ASL. Furthermore, due to the utilization of velocity-insensitive control, this scheme is also less sensitive to eddy current than using velocity-compensated control (8).
Neither the periodic stripes and DC bias has been recognized in VSASL previously. Both affected by B0/B1+ conditions, the spatial stripes oscillate with high spatial frequency and are averaged out within large voxels, and the DC bias is a spatially slow-varying artefact which is challenging to be identified in vivo. Although it should be easier to be observed on a phantom, DC bias could be overlooked because phantoms have better B0/B1+ conditions than in vivo and it is confounded with other artifacts such as from eddy current. Furthermore, previous VSASL studies (including both conventional VSS and FT-VSI) often used simulations to evaluated B0/B1+ effect on the velocity-selective profiles at iso-center, where DC bias is not noticeable. To study DC bias, it is necessary to simulate the response of the employed VS pulse trains on static signals with a range of positions, or testing the VSASL protocols on phantoms, both with adjusted B0 offset or B1+ scales.
There was some inconsistency between our simulation and phantom results. Scheme 2 showed a stronger positive DC bias with the B1+ scale of 0.8 than with scale of 1.2 in phantom scans (Figure 4a), which was not found in simulation (Figure 2d). This may be related to the B0/B1+ offset combination outside the simulation range. Our examination also indicated that this DC-bias can change with the gaps between the velocity-encoding gradients and adjacent refocusing pulses (data not shown), which most likely related to effects of eddy current. In fact, any factor that causes imperfect refocusing can give rise to the stripes and the DC-bias. This phenomenon was not observed under scheme 3, probably due to its much-reduced susceptibility to all these factors.
Correcting DC bias artifact was mainly presented for FT-VSI prepared ASL here. However, in principle, this artifact also exists in conventional VSS prepared ASL employing double-refocused composite (DRCP), double-refocused hyperbolic tangent (DRHT) pulses, or BIR-8, when the refocusing is inadequate in the presence of B0/B1+ offsets. Dynamic phase-cycling should work best at double-refocused methods like DRCP and DRHT, as the removal of DC bias in these methods is perfect, regardless of any B0/B1+ conditions. Similar simulations as done for Figure 3 were performed on DRCP, DRHT, and BIR-8 with various refocusing pulses. It is illustrative to show how DC-bias is related to refocusing pulses, and how dynamic phase-cycling works perfectly on DRCP and DRHT, and improves BIR-8 too (Supporting Information Figure S4). For conventional VSS pulse trains, better-performance adiabatic refocusing pulses could be utilized in scheme 1 to minimize DC bias, at the cost of longer pulse duration or specific absorption rate (SAR). For both conventional VSS and FT-VSI pulse trains, when refocusing pulses are limited by time, SAR, or when B0/B1+ field inhomogeneities are more severe (for example, body scans or ultrahigh field), dynamic phase-cycling still has the potential to improve its robustness.
A different 4-cycling scheme has previously been demonstrated to be able to effectively remove the stripe artifact for VS-MRA (12). This method added time-variant phase waveforms to the FT-VSS pulse trains of each of the four dynamics in order to generate excitation profiles spatially shifted by a quarter of the primary period of the stripes. Note that this technique could not remove the DC component or spatial stripes with more than two periods. In contrast, the dynamic phase-cycling method proposed in this study is simpler to implement by cycling only the refocusing pulses of each dynamic with a constant phase, and more importantly, it would nearly eliminate both stripes and DC bias all together. Thus, this cycling scheme would benefit both VS-ASL and VS-MRA implementations in body parts with challenging B0 and B1+ conditions, such as cardiac (16) and abdomen (17,18).
This approach is not without limitations. One limitation is that the number of dynamics need to be multiples of four, which is less applicable to experiments requiring high temporal resolution such as perfusion-based functional MRI (19). Another shortfall is the imballance in diffusion weighting between label and control modules. Velocity-compensated control (scheme 2) offers more more matched diffusion attenuation than velocity-insensitive control employed by schemes 1 and 3. However, with the 2 cm/s cutoff velocity used here, the b-values for label and control were 0.5 and 0.0 s/mm2 with scheme 1 and 3, versus 0.5 and 0.2 s/mm2 with scheme 2. While this effect was negligible in this VSASL study, it remains an issue in the measurement of blood volume using velocity-selective pulse trains (20,21), by which much lower cutoff velocity is pursued. It is also worth emphasizing that, although the dynamic phase-cycling removes subtraction errors of static spins and preserves the velocity-selective profiles, the labeling efficiency is still scaled by incorrect B1+ setting (Figure 1a) because the inversion degree is determined by the flip angles of the hard pulses used at the beginning of each velocity-encoding step (8). This last issue is common to all three schemes.
Conclusion
When B0 and B1+ conditions are challenging, the performance of refocusing pulses for VS pulse trains is crucial for achieving desired VS profiles as well as spatial homogeneity for both label and control modules. Applying velocity-insensitive controls would not cancel a previously unnoticed DC bias from static spins generated from VS labeling modules, and thus could potentially introduce large systematic quantification errors. In contrast, velocity-compensated control would reduce this artifact, but with hampered VS profiles and labeling efficiency. A dynamic phase-cycling approach with velocity-insensitive controls was shown to ensure robustness of both velocity and spatial responses with nonuniform B0/B1+ field distributions. This method was demonstrated in brain perfusion mapping at 3T, but could be utilized for VS-ASL applications in other organs or at higher fields in future studies.
Supplementary Material
Supporting Information Figure S1: Sequence diagrams of (a) scheme 1 using velocity-insensitive control; (b), scheme 2 using velocity-compensated control; (c) scheme 3 using dynamic phase-cycling. The phase cycling schedules of all refocusing pulses for each scheme are provided. Only the first two velocity-encoding steps are shown.
Supporting Information Figure S2: Diagram of a conventional VSS pulse train or the first step of FT-VSI, including eight blocks: first excitation pulse (E1), first gradient (G1), first refocusing pulse (R1), second gradient (G2), third gradient (G3), second refocusing pulse (R2), fourth gradient (G4), and second excitation pulse (E2). R1, G2, G3 and R2 can be combined as a spatially independent block for label and velocity-insensitive control.
Supporting Information Figure S3: Simulated Mz-velocity profiles and Mz-position profiles of FT-VSI label and control pulse trains at a B0 range of ±200 Hz and their subtractions with (a,b) scheme 1 using velocity-insensitive control; (c,d) scheme 2 using velocity-compensated control; and (e,f) scheme 3 using dynamic phase-cycling. Compared to schemes 1 and 2, scheme 3 yielded both velocity and spatial responses with much less susceptibility to B0 variations.
Supporting Information Figure S4: Simulated DC bias with five conventional velocity-selective pulse trains: 1) double refocused composite (DRCP) pulses, (90ºx180ºy90ºx, 1 ms), the same as used in the FT-VSI pulse trains of this study; 2) and 3) double refocused hyperbolic tangent (DRHT) pulses, (3 ms, tanh/tan, a frequency sweep of 35 and 25 KHz) using maximum amplitude of 20 μT and 30 μT respectively; and 4) and 5) BIR-8 with the same HT pulses as in 2) and 3). All sequences were implemented with a total duration of 24 ms and a cut-off velocity of 2 cm/s. For DRCP and DRHT, a 0–180° inner-module phase cycling was used. Only subtracted Mz was shown for (a) scheme 1 using velocity-insensitive control and (b) scheme 3 using dynamic phase-cycling. For BIR-8, dynamic phase-cycling was implemented by adding phases to the second and the fourth adiabatic pulses. White rectangles indicated the typical B0/B1+ range of human brain at 3T (B0: ±200 Hz; B1+ scale: ±0.3). For scheme 1, inadequate refocusing pulses, such as DRCP and even DRHT or BIR-8 with the first HT (20 μT) refocusing pulses, can lead to DC bias in extreme B0/B1+ conditions as explained in Appendix theory. This can be mitigated by employing either more adiabatic refocusing pulses in scheme 1 or the dynamic phase-cycling scheme.
Acknowledgments
Grant support from NIH R01 HL138182 (QQ), NIH R01 HL144751 (QQ), NIH R01 HL135500 (TS), Scholar Award of American Society of Hematology (QQ), NIH K25 HL145129 (WL).
Appendix. Theory for Dynamic Phase-Cycling Approach
Consider a velocity-selective pulse train shown in Supporting Information Figure S2 which contains eight blocks: first excitation pulse (E1), first gradient (G1), first refocusing pulse (R1), second gradient (G2), third gradient (G3), second refocusing pulse (R2), fourth gradient (G4), and second excitation pulse (E2). It can be understood as either a conventional VSS pulse train (E1 = 90⁰ and E2 = −90⁰) or a segment of FT-VSI (E1 = E2 = 20⁰).
Since stripes and DC-bias are mainly from static tissue, here we only consider spins without any motion. The Bloch equation during each of the blocks for spins at any specific position can be represented by a complexed rotation matrix form, which was employed in deriving extended phase graphs (22,23). T1/T2 relaxations are ignored here. Regardless of any B0/B1+ setting, the bipolar gradients of G2 and G3 cancel each other. Therefore R1, G2, G3, R2 can be combined as a spatially independent block . Note that this applies to both label and velocity-insensitive control modules, but does not hold for velocity-compensated control module where G2 and G3 are unipolar.
In an ideal condition where both B0 and B1+ field are perfect, will just be an identity matrix . As G1 and G4 cancel each other, the final rotation matrix M is only the combination of E1 and E2:
| [3] |
This means that all the gradients and refocusing pulses would not affect the sample magnetization, just as expected for static tissue with a velocity-selective pulse train.
However, when either B0 or B1+ is imperfect, is no longer an identity matrix. Here we set it as:
| [4] |
While G1 and G4 can be expressed as:
| [5] |
Here is the phase caused by the gradients in G1 and G4, and is proportional to gradient strength and spatial distance to iso-center. is the additional phase caused by B0 off-resonance during G1 and G4. is spatially dependent caused by gradients, but is not.
Therefore,
| [6] |
Terms with cause a spatially dependent variation of the signal, which lead to the stripe artifact and DC bias. Note that these terms only appear at off-diagonals of the matrix. Such an observation indicates that if we can make a diagonal matrix, there will be no terms with left in the matrix.
With the dynamic phase-cycling approach, we add four phases ( = 0°, 90°, 180°, and 270°) to the refocusing pulses in through four dynamics respectively. Here we use to represent the with added phase:
| [7] |
Where:
| [8] |
Therefore,
| [9] |
By taking the average of these four dynamics:
| [10] |
Whatever is, this method leaves only diagonal entries in the matrix.
Similarly, for the whole velocity-selective pulse train:
| [11] |
Since is only non-zero at diagonal, terms with related to gradients disappear. Although labeling efficiency is still influenced by those diagonal terms in and those not fully canceled terms with are related to B0, there is no spatially dependent terms anymore. Therefore, the signal is expected to be uniform spatially. That means at any position should be similar as at iso-center, where no gradient is experienced. Thus after averaging every four dynamics, the label and control are fully canceled.
The above principle requires that no gradients are considered in RW and that the pulse train contains only one encoding step. This is true for conventional VSS pulse trains using double refocused composite (DRCP) and double refocused hyperbolic tangent (DRHT) pulses, but not exactly so for BIR-8 or FT-VSI. Because in BIR-8, the two gradients in the middle (corresponding to G2 and G3) do not entirely cancel each other as they are interleaved by an additional refocusing pulse, while in FT-VSI, more than one velocity-encoding step is used and thus the derivation in Eq.[11] is less straightforward. However, for a small range of B0/B1+ offsets, the process of BIR-8 and FT-VSI may be approximated by the condition described above, and improvement can still be expected through dynamic phase-cycling. The exact B0/B1+ range in which this method is applicable is related to the response profile of the refocusing pulse and can be estimated by Bloch simulation.
Reference
- 1.Wong EC, Cronin M, Wu WC, Inglis B, Frank LR, Liu TT. Velocity-selective arterial spin labeling. Magn. Reson. Med 2006;55:1334–1341. [DOI] [PubMed] [Google Scholar]
- 2.Duhamel G, de Bazelaire C, Alsop DC. Evaluation of systematic quantification errors in velocity-selective arterial spin labeling of the brain. Magn. Reson. Med 2003;50:145–153. [DOI] [PubMed] [Google Scholar]
- 3.Wu WC, Wong EC. Intravascular effect in velocity-selective arterial spin labeling: The choice of inflow time and cutoff velocity. Neuroimage 2006;32:122–128. [DOI] [PubMed] [Google Scholar]
- 4.Qiu D, Straka M, Zun Z, Bammer R, Moseley ME, Zaharchuk G. CBF measurements using multidelay pseudocontinuous and velocity-selective arterial spin labeling in patients with long arterial transit delays: Comparison with xenon CT CBF. J. Magn. Reson. Imaging 2012;36:110–119. [DOI] [PMC free article] [PubMed] [Google Scholar]
- 5.Bolar DS, Gagoski B, Orbach DB, et al. Comparison of CBF measured with combined velocity-selective arterial spin-labeling and pulsed arterial spin-labeling to blood flow patterns assessed by conventional angiography in pediatric Moyamoya. Am. J. Neuroradiol 2019;40:1842–1849. [DOI] [PMC free article] [PubMed] [Google Scholar]
- 6.Meakin JA, Jezzard P. An optimized velocity selective arterial spin labeling module with reduced eddy current sensitivity for improved perfusion quantification. Magn. Reson. Med 2013;69:832–838. [DOI] [PubMed] [Google Scholar]
- 7.Guo J, Meakin JA, Jezzard P, Wong EC. An optimized design to reduce eddy current sensitivity in velocity-selective arterial spin labeling using symmetric BIR-8 pulses. Magn. Reson. Med 2015;73:1085–1094. [DOI] [PubMed] [Google Scholar]
- 8.Qin Q, van Zijl PCM. Velocity-selective-inversion prepared arterial spin labeling. Magn. Reson. Med 2016;76:1136–1148. [DOI] [PMC free article] [PubMed] [Google Scholar]
- 9.Liu D, Xu F, Li W, van Zijl PC, Lin DD, Qin Q. Improved velocity-selective-inversion arterial spin labeling for cerebral blood flow mapping with 3D acquisition. Magn. Reson. Med 2020;84:2512–2522. [DOI] [PMC free article] [PubMed] [Google Scholar]
- 10.Qin Q, Shin T, Schär M, Guo H, Chen H, Qiao Y. Velocity-selective magnetization-prepared non-contrast-enhanced cerebral MR angiography at 3 Tesla: Improved immunity to B0/B1 inhomogeneity. Magn. Reson. Med 2016;75:1232–1241. [DOI] [PMC free article] [PubMed] [Google Scholar]
- 11.Shin T, Qin Q, Park JY, Crawford RS, Rajagopalan S. Identification and reduction of image artifacts in non–contrast-enhanced velocity-selective peripheral angiography at 3T. Magn. Reson. Med 2016;76:466–477. [DOI] [PMC free article] [PubMed] [Google Scholar]
- 12.Shin T, Qin Q. Characterization and suppression of stripe artifact in velocity-selective magnetization-prepared unenhanced MR angiography. Magn. Reson. Med 2018;80:1997–2005. [DOI] [PMC free article] [PubMed] [Google Scholar]
- 13.Qin Q Point spread functions of the T2 decay in k-space trajectories with long echo train. Magn. Reson. Imaging 2012;30:1134–1142. [DOI] [PMC free article] [PubMed] [Google Scholar]
- 14.Qin Q, Strouse JJ, van Zijl PCM. Fast measurement of blood T1 in the human jugular vein at 3 Tesla. Magn. Reson. Med 2011;65:1297–1304. [DOI] [PMC free article] [PubMed] [Google Scholar]
- 15.Li W, Grgac K, Huang A, Yadav N, Qin Q, van Zijl PCM. Quantitative theory for the longitudinal relaxation time of blood water. Magn. Reson. Med 2016;76:270–281. [DOI] [PMC free article] [PubMed] [Google Scholar]
- 16.Landes V, Javed A, Jao T, Qin Q, Nayak K. Improved velocity-selective labeling pulses for myocardial ASL. Magn. Reson. Med 2020;84:1909–1918. [DOI] [PMC free article] [PubMed] [Google Scholar]
- 17.Zhu D, Li W, Liu D, et al. Non‐contrast‐enhanced abdominal MRA at 3 T using velocity‐selective pulse trains. Magn. Reson. Med 2020:1–11. [DOI] [PMC free article] [PubMed]
- 18.Franklin S, Bones I, Harteveld A, et al. Multi-organ comparison of flow-based Arterial Spin Labeling techniques: spatially non-selective labeling for cerebral and renal perfusion imaging. Magn Reson Med 2020. [DOI] [PMC free article] [PubMed]
- 19.Hernandez-Garcia L, Nielsen JF, Noll DC. Improved sensitivity and temporal resolution in perfusion FMRI using velocity selective inversion ASL. Magn. Reson. Med 2019;81:1004–1015. [DOI] [PMC free article] [PubMed] [Google Scholar]
- 20.Liu D, Xu F, Lin DD, van Zijl PCM, Qin Q. Quantitative measurement of cerebral blood volume using velocity-selective pulse trains. Magn. Reson. Med 2017;77:92–101. [DOI] [PMC free article] [PubMed] [Google Scholar]
- 21.Qin Q, Qu Y, Li W, et al. Cerebral blood volume mapping using Fourier-transform-based velocity-selective saturation pulse trains. Magn. Reson. Med 2019;81:3544–3554. [DOI] [PMC free article] [PubMed] [Google Scholar]
- 22.Hennig J Echoes-How to Generate, Recognize, Use or Avoid Them in MR-Imaging Sequences Part I: Fundamental and Not So Fundamental Properties of Spin Echoes; 1991.
- 23.Weigel M Extended phase graphs: Dephasing, RF pulses, and echoes - pure and simple. J. Magn. Reson. Imaging 2015;41:266–295. [DOI] [PubMed] [Google Scholar]
Associated Data
This section collects any data citations, data availability statements, or supplementary materials included in this article.
Supplementary Materials
Supporting Information Figure S1: Sequence diagrams of (a) scheme 1 using velocity-insensitive control; (b), scheme 2 using velocity-compensated control; (c) scheme 3 using dynamic phase-cycling. The phase cycling schedules of all refocusing pulses for each scheme are provided. Only the first two velocity-encoding steps are shown.
Supporting Information Figure S2: Diagram of a conventional VSS pulse train or the first step of FT-VSI, including eight blocks: first excitation pulse (E1), first gradient (G1), first refocusing pulse (R1), second gradient (G2), third gradient (G3), second refocusing pulse (R2), fourth gradient (G4), and second excitation pulse (E2). R1, G2, G3 and R2 can be combined as a spatially independent block for label and velocity-insensitive control.
Supporting Information Figure S3: Simulated Mz-velocity profiles and Mz-position profiles of FT-VSI label and control pulse trains at a B0 range of ±200 Hz and their subtractions with (a,b) scheme 1 using velocity-insensitive control; (c,d) scheme 2 using velocity-compensated control; and (e,f) scheme 3 using dynamic phase-cycling. Compared to schemes 1 and 2, scheme 3 yielded both velocity and spatial responses with much less susceptibility to B0 variations.
Supporting Information Figure S4: Simulated DC bias with five conventional velocity-selective pulse trains: 1) double refocused composite (DRCP) pulses, (90ºx180ºy90ºx, 1 ms), the same as used in the FT-VSI pulse trains of this study; 2) and 3) double refocused hyperbolic tangent (DRHT) pulses, (3 ms, tanh/tan, a frequency sweep of 35 and 25 KHz) using maximum amplitude of 20 μT and 30 μT respectively; and 4) and 5) BIR-8 with the same HT pulses as in 2) and 3). All sequences were implemented with a total duration of 24 ms and a cut-off velocity of 2 cm/s. For DRCP and DRHT, a 0–180° inner-module phase cycling was used. Only subtracted Mz was shown for (a) scheme 1 using velocity-insensitive control and (b) scheme 3 using dynamic phase-cycling. For BIR-8, dynamic phase-cycling was implemented by adding phases to the second and the fourth adiabatic pulses. White rectangles indicated the typical B0/B1+ range of human brain at 3T (B0: ±200 Hz; B1+ scale: ±0.3). For scheme 1, inadequate refocusing pulses, such as DRCP and even DRHT or BIR-8 with the first HT (20 μT) refocusing pulses, can lead to DC bias in extreme B0/B1+ conditions as explained in Appendix theory. This can be mitigated by employing either more adiabatic refocusing pulses in scheme 1 or the dynamic phase-cycling scheme.


