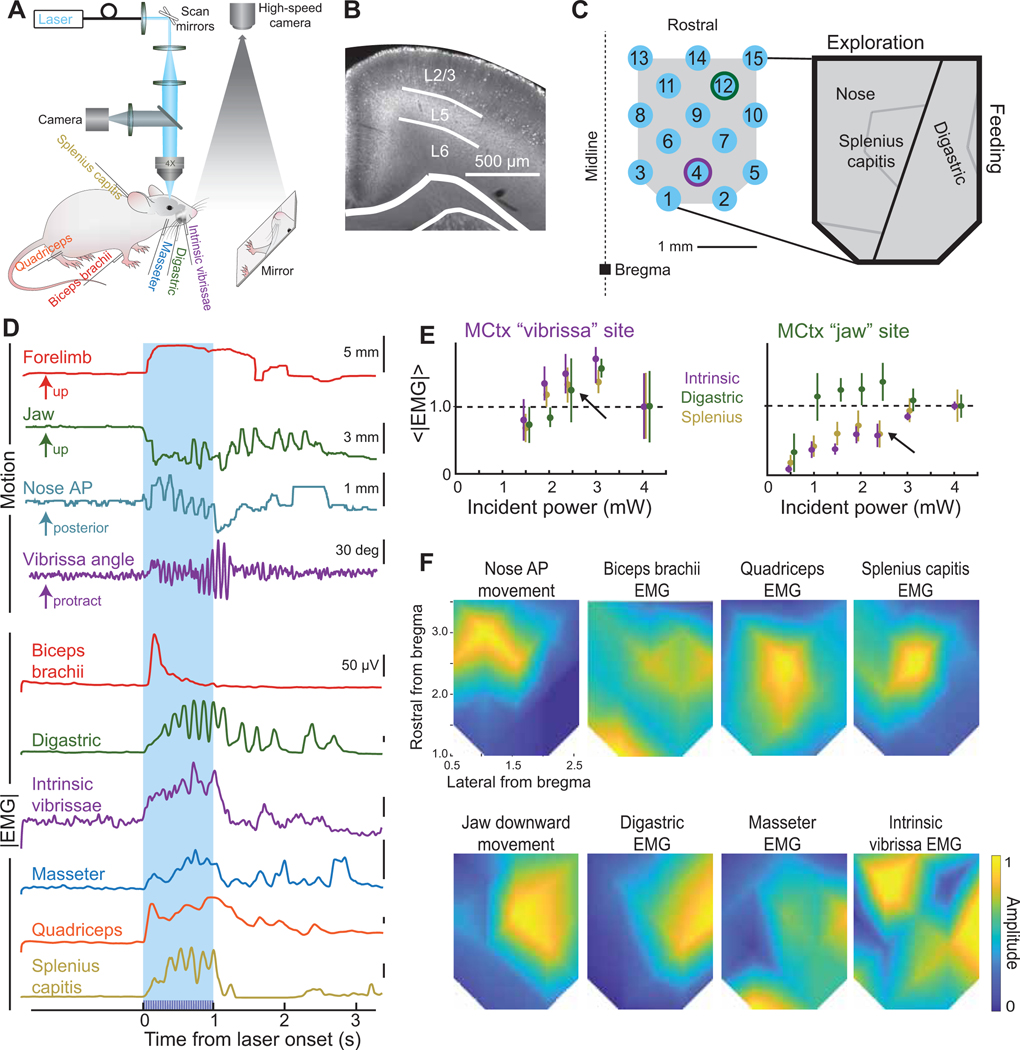
Figure 1. Orofacial motor cortex map of induced muscle activity, as inferred from movement and EMGs.
(A) Schematic of laser activation of Thy1-ChR2-YFP mice with EMG recordings and high-speed videographs from above for the vibrissa and nose movements and using a mirror to reflect the forelimb and jaw movements up to the camera.
(B) Coronal section of Thy1-ChR2 mouse through MCtx with dense YFP labeling in layer 5.
(C) Schematic of positions targeted by a blue laser in motor cortex for trials of one second of blue light. Jaw and vibrissa motor cortex stimulus locations for panel E are identified by a green and purple outline of the laser spot, respectively. The expanded view is a summary of our observation that MCtx nominally partitions into a medial exploratory region and a lateral feeding division.
(D) Single trial examples of forelimb, jaw, nose, and vibrissa movements and biceps brachii, digastric, intrinsic vibrissa, masseter, quadriceps, and splenius capitis EMG envelopes. The blue box indicates the time the light train is ongoing. Examples are from a variety of stimulus locations, as labeled.
(E) Amplitude of the rectified EMG for the digastric, intrinsic vibrissa, and splenius capitis muscles from classic vibrissa motor cortex (AP + 1.5 mm, ML 1.5 mm; purple outline in Fig. 2C) compared with jaw motor cortex (AP + 3 mm, ML 2 mm; green outline in Fig. 2C) at different light intensities.
(F) Composite amplitude maps (five mice across a total of 15 days, interpolated between light points) for the biceps brachii, digastric, intrinsic vibrissa, quadriceps, and splenius capitis EMG envelope recordings and anterior-posterior nose and up-down jaw movements.

