

Abstract
Viruses need to hijack the translational machinery of the host cell for a productive infection to happen. However, given the dynamic landscape of tRNA pools among tissues, it is unclear whether different viruses infecting different tissues have adapted their codon usage toward their tropism. Here, we collect the coding sequences of 502 human-infecting viruses and determine that tropism explains changes in codon usage. Using the tRNA abundances across 23 human tissues from The Cancer Genome Atlas (TCGA), we build an in silico model of translational efficiency that validates the correspondence of the viral codon usage with the translational machinery of their tropism. For instance, we detect that severe acute respiratory syndrome coronavirus 2 (SARS-CoV-2) is specifically adapted to the upper respiratory tract and alveoli. Furthermore, this correspondence is specifically defined in early viral proteins. The observed tissue-specific translational efficiency could be useful for the development of antiviral therapies and vaccines.
Keywords: tropism, tissue, translation, tRNA, codon usage, SARS-CoV-2
Graphical abstract
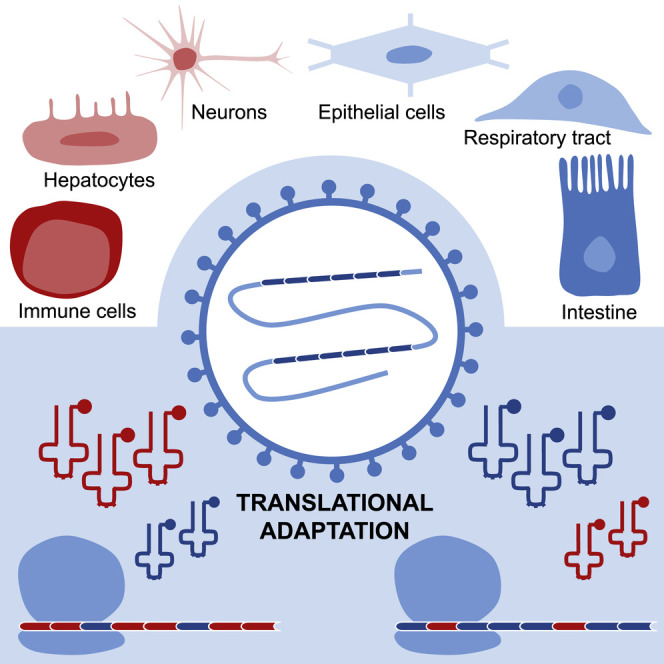
Viruses need to hijack the translational machinery of the host for the expression of their own proteins. Hernandez-Alias et al. show that viruses that infect different tissues use different synonymous codons, which can affect the efficiency in which they are translated across human tissues.
Introduction
Given the degeneracy of the genetic code, multiple 3-letter combinations of nucleotides can code for the same amino acid. Such synonymous codons are nevertheless not uniformly distributed along the genomes and can significantly deviate between organisms (Grantham et al., 1981). Evolutionary forces that explain the existence of the so-called codon bias include (1) a mutation pressure for a certain GC base composition depending on the species and chromosomal location and (2) the translational selection for codons corresponding to highly expressed tRNA isoacceptors (Hernandez-Alias et al., 2020; Plotkin and Kudla, 2011; Sharp et al., 1993).
Viruses strongly depend on the translational machinery of the host for the expression of their own proteins and, ultimately, their replication. For instance, given the small size of most viral genomes, no or very few tRNA genes are generally autonomously encoded (Morgado and Vicente, 2019). In terms of codon usage, it has indeed been shown that bacteriophages are specifically adapted to their microbial hosts (Carbone, 2008; Lucks et al., 2008). This information has been applied in the prediction of viral hosts from metagenomics data (Ahlgren et al., 2017; Ren et al., 2017). The codon usage of human-infecting viruses is similarly adapted to the host (Bahir et al., 2009; Jenkins and Holmes, 2003), and the concept of codon deoptimization has been applied to the design of attenuated vaccines (Lauring et al., 2010).
Although translational selection has long been under debate in humans (Pouyet et al., 2017), recent studies indicate that different tissues and conditions showcase distinct tRNA expression profiles, leading to changes in their respective translational efficiency (Gingold et al., 2014; Hernandez-Alias et al., 2020). In agreement with this observation, the codon usage of papillomavirus capsid proteins is adapted to the tRNAs of differentiated keratinocytes, and their translation becomes specifically efficient (Zhao et al., 2005; Zhou et al., 1999). In addition, upon human immunodeficiency virus 1 (HIV-1) infection, the host tRNA pool is reprogrammed to favor translation of late viral genes (van Weringh et al., 2011), a phenomenon that is indeed exploited by host antiviral mechanisms (Li et al., 2012). Furthermore, some viruses with a specific tissue tropism resemble the codon bias of highly expressed proteins of their respective infecting tissues (Miller et al., 2017). Nevertheless, despite the few aforementioned studies, a high-throughput analysis of the translational selection of viral genomes to their tissue tropism has been heretofore hindered by the absence of tissue-wide tRNA expression data.
Here, we systematically analyze the relative codon usage landscape of 502 human-infecting viruses together with the recently published tRNA expression profiles of human tissues (Hernandez-Alias et al., 2020). Among other viral annotated features, including phylogeny and Baltimore classification, their tissue tropism explains more variance in codon usage than the other tested features. In consequence, tropism corresponds with codon optimization patterns that can be associated with tissue-specific profiles of tRNA-based translation efficiencies. Furthermore, by studying the tissue adaptation among the viral proteome, we also determine that early replication-related proteins are more translationally adapted than the late structural counterparts. Overall, we observe a tropism-specific adaptation of the viral proteome to the tRNA profiles of their target tissues, which opens the door for the development of tissue-specific codon-deoptimized vaccines and targeted antiviral therapies.
Results
Tropism corresponds with differences in RCU of human-infecting viruses
Publicly available genomic data comprised a total of 502 human-infecting viruses, distributed among 35 families and covering all 7 Baltimore categories (Table S1). Across this diversity, 6 main viral tropisms were defined for 228 viruses based on the ViralZone curated database (Hulo et al., 2011), namely, neurons, immune cells, respiratory tract, hepatocytes, intestine, and epithelial cells (Figure 1 A), and the rest of viruses remained unassigned. Their corresponding coding sequences constituted a total of 6,087 viral proteins (Table S1), for which we determined the relative codon usage (RCU; i.e., the contribution of each synonymous codon to the amino acid it encodes; see STAR Methods).
Figure 1.

Tropism corresponds with differences in RCU of human-infecting viruses
(A) A total of 502 viruses was distributed among 35 families and covered all 7 Baltimore groups. Of those viruses, 228 were classified in 6 general tropisms based on ViralZone annotations (Hulo et al., 2011).
(B) Three internal clustering indexes were computed to assess the validity of each viral classification in terms of their relative codon usage (RCU). Good cluster performances lead to low WB indexes but lead to high Silhouette and Dunn values (as shown in the color code).
(C) Linear discriminant analysis of the RCU of the 228 tropism-defined viruses. In parentheses is the percentage of variance explained by each of the components. See also Figure S1.
In order to understand the main factors driving differences between viral RCUs, we used 3 internal clustering indexes that assess how similar each virus is to a certain group compared to other groups. Taking the average RCU over each of the 502 viral proteomes, we applied this framework to assess the grouping performance of the following 5 different viral features: tropism, type of genetic material (i.e., Baltimore category), family, genus, and a sequence-based classification by Aiewsakun and Simmonds (2018). In such an analysis, the tropism leads the best classification of viral RCUs, followed by the viral genetic type (Figure 1B). On the other hand, classical and sequence-based phylogenetic classifications show poor clustering performances.
Given the impact of viral tropism on the RCU, we sought to determine the main codon differences between the 6 defined target tissues. By using a linear discriminant analysis (LDA; see STAR Methods), we classified the 228 tropism-defined viruses in 6 clear clusters, regardless of other factors such as the phylogenetic lineage (Figure 1C). For further validation, by randomizing the set of tropisms, the LDA loses all its discriminating power (Figure S1A). Supporting the robustness of the clustering, we obtained the same performance by using another reduced list of human viruses from ViralZone (Hulo et al., 2011; Figure S1B; Table S1).
With the previous results indicating a clear codon usage pattern among tropisms, we then wondered to what extent other factors could in parallel shape the nucleotide composition of viruses (Bergman and Tuller, 2020). As shown in Figure S1, we observed that RNA folding, as determined by the minimum free energy, was also non-randomly distributed among tropisms. Other factors such as ribosomal frameshift were not significantly different.
Overall, we observed that specific codon usage profiles were associated with the tissue tropism of human-infecting viruses, together with other determinants such as RNA stability.
Viruses are adapted to the tRNA-based translational efficiencies of their target tissues
Based on the RCU differences between viruses with distinct tropisms, we hypothesized that distinct tissues impose selection toward a certain set of translationally efficient codons. However, a validation for this hypothesis required the accurate quantification of tissue-specific tRNA profiles, which has been hitherto missing. With the advent of such high-throughput expression data (Gogakos et al., 2017; Zhang et al., 2018), here, we retrieved the previously published supply-to-demand adaptation (SDA) estimate for translational efficiency (Hernandez-Alias et al., 2020; Pechmann and Frydman, 2013), which computes the balance between the supply (i.e., the anticodon tRNA abundances) and demand (i.e., the codons expressed in mRNAs) of each codon (see STAR Methods).
Using a total of 620 healthy samples from The Cancer Genome Atlas (TCGA) dataset (Hernandez-Alias et al., 2020; Synapse: syn20640275), we first computed the SDA of all viral-protein-coding sequences based on the SDA weights of their constituent codons. Therefore, taking the average of all healthy samples across each of the 23 TCGA cancer types, we determined the estimated translational efficiencies of viral proteins in different human tissues (Table S2).
Next, from the perspective of the translational selection hypothesis, we would expect that viral proteins are translationally adapted to their target tissues. In consequence, we tried to test our hypothesis by using a completely blind and unbiased random forest classifier, which applies machine learning in order to predict the tropism of each viral protein based on the SDA to different tissues (see STAR Methods). The resulting performance of the models, based on the area under the curve (AUC) of their receiver operating characteristic (ROC) curves, ranges 0.79–0.92 (Figure 2 A), which is clearly higher than the no-skill model of 0.5 (p < 0.01, permutation test in Table S2). Similar results were also obtained from complementary prediction performance metrics such as precision-recall curves (Figure 2A). This analysis was replicated with the other list of viruses from ViralZone, leading to comparable predictive outcomes (Figure S2; p < 0.01, permutation test in Table S2). These results indicate that our machine learning model is able to predict the tropism of a viral protein based on its SDA to tissues with high accuracy. In concordance, a LDA of the average SDA of each virus across tissues can similarly separate different clusters of viral tropism based on their translational efficiencies (Figure S2).
Figure 2.

Viruses are adapted to the tRNA-based translational efficiencies of their target tissues
(A) Receiver operating characteristic (ROC) and precision-recall (PR) curves of a random forest classifier, in which the average supply-to-demand adaptation (SDA) of viral proteins to each of the 23 TCGA tissues is used to predict their corresponding viral tropism of NCBI viruses (see STAR Methods). The area under the curves (AUCs) ± SD summarize the performance of the model.
(B) Relative feature weights of each of the 23 TCGA tissues for each of the 6 tropisms, which measure the contribution of each tissue in the decision trees. The dendrograms show a hierarchical clustering among tissues (left) and among tropisms (top). The cyan lines show the trace of weights along each tropism. Refer to Table S2 for full TCGA cancer type names. See also Figures S2–S5.
In an attempt to understand which tissues are the most predictive for identifying the viral tropism of proteins, we analyzed the relative feature importance within each random forest classifier, which measures the contribution of each tissue SDA in the decision trees (Figure 2B). The main observation was that no single tissue alone is able to discriminate against the specific tropism because all feature importances lie below 0.09. However, it was also clear that translational adaptation to stomach (STAD; for healthy samples of stomach adenocarcinoma) is a recurrent discriminant feature, while other tissues are specifically important for just one or few tropisms, such as liver (LIHC; for healthy samples of liver hepatocellular carcinoma) in predicting hepatocyte viruses. In any case, the directionality of these features could not be established.
All of these analyses using the TCGA dataset were based on tRNA quantifications derived from generic small RNA sequencing, which we have previously reported to provide consistent measurements compared to other tRNA sequencing techniques such as hydro-tRNA-seq (Hernandez-Alias et al., 2020). However, to exclude any possible technical bias related to the low tRNA coverage of the technique, we reproduced the same random forest model of viral tropism by using an alternative dataset of hydro-tRNA sequencing (hydro-tRNA-seq) across 7 tissue-wide cell lines (HEK293, HCT116, HeLa, MDA-MB-231, BJ/hTERT, HACAT, and HepG2; see STAR Methods). The results showed similar predictive performances compared to TCGA (Figure S3).
In addition, as our systematic analysis suggested that the codon usage of viruses tends to be adapted to the tRNAs of the tissue they infect, we specifically interrogated the translational efficiency of severe acute respiratory syndrome coronavirus 2 (SARS-CoV-2), which is causing the most deadly pandemic in recent decades (World Health Organization, 2020). As a result, we observed that the SARS-CoV-2 proteome is especially adapted to the upper respiratory airways and alveoli but also to other tissues such as the gastrointestinal tract and brain (Figures S4 and S5; Table S3; see STAR Methods).
Overall, because the tropism of viruses can be predicted from their translational adaptation to tissues, these results indicate that viral proteomes are specifically adapted to certain tRNA-based translational efficiencies. In consequence and complementary to the observations of mutational pressure driving viral codon bias (Belalov and Lukashev, 2013; Jenkins and Holmes, 2003; Shackelton et al., 2006), we described the basis for a potential tissue-specific translational selection of viral codon usage.
Early viral proteins are better adapted than late counterparts
Given the tropism-specific adaptation of viral RCU toward the translational machinery of tissues, we wondered whether certain genomic subsets were specifically adapted to the tissue of infection. In particular, we speculated that early replication-related proteins would have a greater benefit from such an adaptation than late structural proteins because once the virus takes control of the cell, it could change its tRNA expression program (Goz et al., 2017; van Weringh et al., 2011).
To estimate the adaptation of each protein to the tRNA-based codon efficiencies of each tissue, we computed their SDA (Hernandez-Alias et al., 2020; Table S4). For that purpose, we matched each virus to the tRNAs of their tissues of infection (Table S4). In concordance with our hypothesis, based on current viral annotations (VOGdb, https://vogdb.org), we observed a small but highly significant shift in SDA between structural and replication proteins across most viral tropisms, with the exception of hepatocyte and intestine viruses (Figure 3 A; paired 2-tailed Wilcoxon rank-sum test). Similarly, we performed a gene set enrichment analysis to identify which virus orthologous groups (VOGs) were enriched in high-SDA or low-SDA proteins (Figure 3B). As determined by current annotations (Knipe and Howley, 2013), top VOGs mostly contained replication-related early proteins, whereas bottom VOGs had structural late functions, with few exceptions to the general trend.
Figure 3.

Early viral proteins are better adapted than late counterparts
(A) Average SDA of replication (Xr) and structural (Xs) proteins of a total of 104 annotated tropism-specific viruses matched to 461 samples of their tissues of infection (Table S4). Boxes expand from the first to the third quartile, with the center values indicating the median. The whiskers define a confidence interval of median ± 1.58∗interquartile range (IQR)/sqrt(n). Statistical significance was determined by paired (structural against replication proteins of each virus) and 2-tailed Wilcoxon rank-sum test.
(B) Top 10 positive and negative virus orthologous groups upon gene set enrichment analysis of the SDA of all proteins of tropism-specific viruses (Table S4). Based on their annotations, proteins groups are colored based on their early/replication or late/structural function (Knipe and Howley, 2013).
Previous studies on the translational adaptation of HIV-1 suggested that the host tRNA pool is reprogramed upon viral infection in order to favor the expression of late genes (van Weringh et al., 2011). In this direction, we wanted to test whether this tRNA reprogramming is a general adaptive mechanism among viral species. Using 3 previously published small RNA-seq datasets of human cell lines upon viral infection (Chang et al., 2013; Shi et al., 2018; Stark et al., 2012; GEO: GSE33584, GSE102470, GSE57763), we quantified the tRNA abundances at different time points (Table S5). Therefore, in terms of time course differences, we detected a general decrease in translational efficiency (measured as RtAI, see STAR Methods) upon viral infection, which is relatively more pronounced for late proteins rather than early (Figure 4 A). At the same time, to compare the absolute translational efficiency of late and early genes, we also compiled previously published proteomic measurements upon infection of these 3 viruses (Golumbeanu et al., 2019; Nobre et al., 2019; Ouwendijk et al., 2020). Although there were no consistent differences of early versus late protein levels across viruses (Figure 4B), we nonetheless observed that most abundant expression classes tended to have higher translation efficiencies (Figure 4).
Figure 4.

Translational adaptation of viral proteins upon infection
(A) Relative tRNA adaptation index (see STAR Methods; Table S5) of viral proteins upon effective viral infections in different cell lines. Proteins are allocated to different time expression classes based on current viral knowledge (Knipe and Howley, 2013; Table S5). Center values within the violin plot represent the median. Only significant differences are shown and are denoted as follows: ∗p ≤ 0.05, ∗∗p ≤ 0.01, ∗∗∗p ≤ 0.001, and ∗∗∗∗p ≤ 0.0001. Statistical differences are based on a false discovery rate (FDR)-corrected 2-tailed Wilcoxon rank-sum test, with paired comparisons between time points (written in color) and unpaired comparisons between expression classes.
(B) Abundances of viral proteins (see STAR Methods; Table S5) upon effective viral infections at different time points in different cell lines. Solid lines represent the median of the expression class, surrounded by an uncertainty interval between the 0.4 and 0.6 percentiles.
Overall, we determined that the tropism-specific adaptation of viruses is specifically pronounced among early proteins. However, the lower adaption of late viral genes and findings on translation changes upon infection suggest that host cells might be reprogrammed to favor the expression of late viral genes.
Discussion
Tropism is determined by an ensemble of different factors, including the mechanism of viral entry to the host, the immune responses to the infection, or the viral hijacking of the cellular machinery in the interest of replication and propagation. In this article, we studied the latter by focusing on the translational adaptation of viral genomes to the host.
There could be controversy regarding to what extent some viruses out of the 502 included in the NCBI database used here are truly adapted to humans or whether some of them are annotated just because of anecdotal infections. Also, for some viruses, multiple genotypes and variants are represented in the NCBI database, although they actually do showcase differences in codon usage (Table S1; Figure 1). To exclude any statistical bias due to the database used, we duplicated our analysis with the reduced highly curated ViralZone database and obtained similar results, which indicated that our observations were robust.
Although previous studies on the base composition and codon usage of both DNA and RNA viruses (Jenkins and Holmes, 2003; Shackelton et al., 2006) have attributed most of the codon usage variability to the mutational pressure of viral genomes, our analysis proposes tropism as another potential driving force. By systematically interrogating all human-infecting viruses, we uncovered that tissue tropism explains changes in their codon usage more than other viral properties such as type or family. Therefore, as mutational pressure would act more similarly within phylogenetically closer species, such tropism-related differences in codon usage suggests that tissue-specific tRNA expression could be driving a translational selection on viral genomes. However, as suggested by Figure S1, many other and overlapping forces, such as mRNA stability, frameshift motifs, transcriptional regulation, or codon-dependent immune responses, are also known to shape the composition of coding sequences (Bergman and Tuller, 2020; Li et al., 2012).
Although high-throughput sequencing of tRNAs has been only recently developed, cases of natural selection of codon usage toward the host have been previously proposed. For instance, codon usage of Parvovirus has been progressively adapted from dogs to cats after the host jump (Franzo et al., 2017). Influenza viruses show a similar adaptation over a time of viral isolation, deviating from the codon usage of avian hosts (Luo et al., 2020; Wong et al., 2010). However, whether these progressive changes in codon usage over time are directly driven by translational selection has remained elusive. With the advent of tissue-wide datasets of tRNAs and their translational efficiencies (Hernandez-Alias et al., 2020), we can now compute the SDA of all viral proteomes in different tissues. From there, we then created a random forest model that predicts with high accuracy the viral tropism of proteins based on their profile of adaptation to human tissues. In consequence, the tRNA-based adaptation profile of a protein is descriptive of their viral tropism, indicating that translational selection could indeed drive tropism differences of codon usage. It is important to remark that viruses could still have a good SDA to non-target tissues with similar tRNA expression patterns that are not infected because they are not exposed to the virus.
In particular, we found that SARS-CoV-2 is highly adapted to the upper respiratory tract and the alveoli (Figure S4C), which is in agreement with recent single-cell transcriptomic studies reporting the expression of ACE2 in the nasal goblet and ciliated cells as well as the type-2 alveolar epithelial cells (Sungnak et al., 2020; Ziegler et al., 2020). Apart from the respiratory tract, the gastrointestinal tract emerges as the most translationally adapted tissue, followed by the other epithelial-like tissues and the brain, which concurs with some frequently observed coronavirus disease 2019 (COVID-19) symptoms (Baig et al., 2020; Li et al., 2020; Mao et al., 2020; Pan et al., 2020; Zhang et al., 2020; Zhou et al., 2020b). In terms of the evolution of the new coronavirus, given the similarity of SARS-CoV-2 SDA with the phylogenetically closest bat coronavirus (Figure S5B), it seems that a translational selection to increase SDA would have acted before the putative zoonosis from bats or other intermediate hosts. Furthermore, in agreement with the highest translational potential of SARS-CoV-2 in their target tissues, a recent model of viral tropism suggested that a tradeoff exists between the efficiency of viral translation and the translational load on the host, indicating that an improved codon usage can make the difference between symptomatic and natural hosts (Chen et al., 2020).
On the other hand, in analyzing differences in codon usage between early and late viral genes, previous studies do not completely agree. Although it would be intuitive to conclude, and in fact some authors claim, that late proteins, which often need to be expressed in higher amounts, are better translationally adapted than early counterparts (Bahir et al., 2009), others state otherwise (Goz et al., 2017; Mioduser et al., 2017). Using the tRNA abundances from the TCGA dataset and based on the SDA, we therefore validated that early replication-related proteins are generally better adapted to the tissue of infection, despite few exceptions (Figure 3B). In agreement with this observation, it is known that host tRNA pools either undergo reprogramming upon HIV-1 infection (van Weringh et al., 2011) or are locally channeled to ribosomes in vaccinia and influenza A viruses (Pavon-Eternod et al., 2013). Upon infection, we propose that translational adaptation could switch in some cases toward the expression of late structural proteins, which has previously been observed in HIV-1 (van Weringh et al., 2011).
Overall, this systematic analysis establishes a link between the codon usage of human viruses and the translational efficiency of their tissue of infection. This correspondence is particularly observed in early viral proteins. We therefore envision the development of ad hoc gene therapies specifically targeting the tissue of interest.
STAR★Methods
Key Resources Table
| REAGENT or RESOURCE | SOURCE | IDENTIFIER |
|---|---|---|
| Chemicals, peptides, and recombinant proteins | ||
| Antarctic phosphatase | New England BioLabs | Cat#M0289 |
| T4 Polynucleotide Kinase | New England BioLabs | Cat#M0201 |
| ProtoScript II Reverse Transcriptase | New England BioLabs | Cat#M0368 |
| Critical commercial assays | ||
| miRNeasy Mini kit | QIAGEN | Cat#217004 |
| 15% TBE–urea gels | NOVEX, Invitrogen | Cat#EC6885BOX |
| RNeasy MinElute Cleanup Kit | QIAGEN | Cat#74204 |
| QIAquick PCR Purification Kit | QIAGEN | Cat#28106 |
| Deposited data | ||
| Supply-to-Demand Adaptation weights (SDAw) from TCGA samples | Hernandez-Alias et al., 2020 | Synapse: syn20640275 |
| SARS-CoV-2 reference genome | Wu et al., 2020 | NCBI RefSeq: NC_045512.2 |
| Bat coronavirus RaTG13 genome | (Zhou et al., 2020a) | GenBank: MN996532.1 |
| Small RNA-seq of HFF infected by HCMV | Stark et al., 2012 | GEO: GSE33584 |
| Small RNA-seq of KMB-17 infected by HSV1 | Shi et al., 2018 | GEO: GSE102470 |
| Small RNA-seq of SUP-T1 infected by HIV1 | Chang et al., 2013 | GEO: GSE57763 |
| Hydro-tRNaseq of HEK293, HCT116, HeLa, MDA-MB-231, and BJ/hTERT | Hernandez-Alias et al., 2020 | GEO: GSE137834 |
| Hydro-tRNaseq of HACAT and HepG2 | This study | ArrayExpress: E-MTAB-9905 |
| Experimental models: cell lines | ||
| HACAT | CRG Collection (Center for Genomic Regulation) | RRID: CVCL_0038 |
| HepG2 | IMIM Collection (Institut Hospital del Mar d’Investigacions Mèdiques) | RRID: CVCL_0027 |
| Software and algorithms | ||
| GSEA [v4.0.3] | Subramanian et al., 2005 | https://www.gsea-msigdb.org/gsea |
| SciKit Learn [v0.20.1] | Pedregosa et al., 2011 | https://scikit-learn.org |
| Codon Usage tool | Stothard, 2000 | https://www.bioinformatics.org/sms2/codon_usage |
| ViennaRNA toolkit [v2.4.14] | van Weringh et al., 2011 | https://www.tbi.univie.ac.at/RNA/ |
| KnotInFrame | Theis et al., 2008 | https://bibiserv.cebitec.uni-bielefeld.de/knotinframe |
| BBMap [v38.22] | Bushnell B. | https://sourceforge.net/projects/bbmap |
| FastQC [v0.11.4] | Andrews S. | https://www.bioinformatics.babraham.ac.uk/projects/fastqc |
| SAMtools [v1.3.1] | Li et al., 2009 | http://samtools.sourceforge.net |
| tRNAscan-SE [v2.0] | Chan and Lowe, 2019 | http://lowelab.ucsc.edu/tRNAscan-SE |
| BEDtools [v2.27.1] | Quinlan and Hall, 2010 | http://bedtools.readthedocs.io/en/latest/ |
| Segemehl [v0.3.1] | Hoffmann et al., 2009 | https://www.bioinf.uni-leipzig.de/Software/segemehl |
| Picard [v2.18.17] | Broad Institute | https://github.com/broadinstitute/picard |
| GATK [v3.8] | McKenna et al., 2010 | https://gatk.broadinstitute.org |
| Other | ||
| Code for tRNA mapping and quantification of Hydro-tRNaseq data | This paper | https://github.com/hexavier/tRNA_mapping |
| Code for all computational analyses of this report | This paper | https://github.com/hexavier/tRNA_viruses |
Resource availability
Lead contact
Further information and requests for resources and reagents should be directed to and will be fulfilled by the Lead Contact, Luis Serrano (luis.serrano@crg.eu).
Materials availability
This study did not generate new unique reagents.
Data and code availability
The code used in this study is available at GitHub: https://github.com/hexavier/tRNA_viruses, https://github.com/hexavier/tRNA_mapping. The accession number for the data reported in this paper is ArrayExpress: E-MTAB-9905.
Experimental model and subject details
Cell lines
The cell lines included in this study are HACAT and HepG2. The sex of each cell line is as follows: HACAT, male; HepG2, male. Cells were maintained at 37°C in a humidified atmosphere at 5% CO2 in DMEM 4.5 g/l Glucose with UltraGlutamine media supplemented with 10% of FBS and 1% penicillin/streptomycin. Cells have been tested negative for mycoplasma.
Method details
Biological Assays
RNA extraction. Cells were grown in 60 mm dishes for 48h in triplicates. Total RNA from HACAT and HepG2 was extracted using the miRNeasy Mini kit. 20 μg of total RNA was treated following the protocol of Hydro-tRNaseq (Gogakos et al., 2017).
Hydro-tRNA sequencing. Total RNA was resolved on 15% Novex TBE–urea gels and size-selected for 60-100 nt fragments. The recovered material was then alkaline hydrolyzed (10 mM sodium carbonate and 10 mM sodium bicarbonate) for 10 min at 60°C. The resulting RNA was de-phosphorylated with Antarctic Phosphatase (New England Biolabs) at 37°C for 1 h. De-phosphorylated RNA was purified with an RNeasy MinElute spin column and re-phosphorylated with polynucleotide kinase (NEB). PNK-treated tRNAs were purified with an RNeasy MinElute spin column, adaptor-ligated, reverse-transcribed, and PCR-amplified for 14 cycles. The resulting cDNA was purified using a QIAQuick PCR Purification Kit and sequenced on Illumina HiSeq 2500 platform in 50 bp paired-end format.
Data Sources
Viruses and annotations. We included in the analysis all human-infecting viruses from the NCBI Viral Genome Browser, downloaded as of June 9, 2020. Additionally, for its interest, we added a posteriori the new SARS-CoV-2 virus. Viral metadata including family, genus, genetic material type and Baltimore category were retrieved either from the ICTV 2018b Master Species List (Walker et al., 2019) or the ICTV Virus Metadata Resource (https://talk.ictvonline.org/taxonomy/vmr/?Redirected=true). The sequence-based phylogenetic information was obtained from Aiewsakun and Simmonds (2018). Tissue and cell type tropism was determined based on the curated database ViralZone (Hulo et al., 2011), and allocated to each of the six main classes based on the main annotation. To exclude any bias due to the source of the list, we also used the list of human-infecting viruses of ViralZone (Hulo et al., 2011). Table S1 contains all human-infecting viruses and their associated metadata.
Coding sequences. The coding sequences of human-infecting viruses from RefSeq were downloaded from the Codon/Codon Pair Usage Tables (CoCoPUTs) project release as of June 9, 2020 (Alexaki et al., 2019; Athey et al., 2017; Table S1). The SARS-CoV-2 and RaTG13 sequences were directly downloaded from GenBank (Table S3; NCBI RefSeq: NC_045512.2; GenBank: MN996532.1).
Virus Orthologous Groups. Virus Orthologous Groups and their functional annotations (virus structure and replication) were downloaded from VOGdb (https://vogdb.org, release number vog94). The protein sets of each VOG were formatted to a Gene Matrix Transposed (GMT) file for custom GSEA analyses.
TCGA translational efficiency. The Supply-to-Demand Adaptation (SDA) is the balance between the supply (i.e., the anticodon tRNA abundances) and demand (i.e., the weighted codon usage based on the mRNA levels) for each of the 60 codons (excluding methionine and Stop codons) (Hernandez-Alias et al., 2020). The SDA weights of all TCGA samples were downloaded from Synapse: syn20640275.
Hydro-tRNaseq of HeLa, HEK293, HCT116, MDA-MB-231, and fibroblast BJ/hTERT. Using the exact same protocol as described above, we have previously generated and published the Hydro-tRNaseq data of five tissue-wide human cell lines: HeLa, HEK293, HCT116, MDA-MB-231, and fibroblast BJ/hTERT (Hernandez-Alias et al., 2020). The raw data are publicly accessible at the Gene Expression Omnibus (GEO: GSE137834).
Small RNA-sequencing datasets upon viral infection. Three small RNA-sequencing datasets were downloaded to analyze the tRNA content of human cell lines upon viral infection. In Stark et al. (2012), samples of Human Foreskin Fibroblasts (HFF) infected with human cytomegalovirus (HCMV) strain Towne at a multiplicity of infection (MOI) of 3, analyzed at 24 and 72 hours post-infection (GEO: GSE33584). In Shi et al. (2018), samples of cellosaurus KMB-17 infected with Human Simplex Virus type 1 (HSV1) strain 17 at a MOI of 1, analyzed at 48 hpi (GEO: GSE102470). In Chang et al. (2013), samples of lymphoblastoid SUP-T1 cells infected with Human immunodeficiency virus 1 (HIV1) strain LAI at a MOI of 5, at 5, 12 and 24 hpi (GEO: GSE57763). The raw FASTQ files were analyzed using the tRNA quantification pipeline below.
Proteomics datasets upon viral infection. Three proteomics datasets were downloaded to analyze the abundances of viral proteins in human cell lines upon infection. In Golumbeanu et al. (2019), iBAQ mass spectrometry quantification was used with lymphoblastoid SUP-T1 cells infected with a HIVeGFP-based viral vector, analyzed at 6, 12, 18 and 24 hpi. In Ouwendijk et al. (2020), TOP3 MS quantification was used in human retinal pigment epithelial ARPE-19 cells infected with HSV-1 F-strain at a MOI of 1, analyzed at 0, 2, 4, 6, 8, 10 and 12 hpi (label-free absolute measurements of peptides were accessed upon request to the authors). For HCMV, we used two datasets of HFF infected with HCMV strain Merlin at a MOI of 10 with TMT mass spectrometry: (a) WCL3 from Weekes et al. (2014), and (b) proteomic series three from Fielding et al. (2017). The iBAQ absolute quantifications of these two datasets have been previously published in Nobre et al. (2019). Therefore, quantifications at 24, 48 and 72 hpi were determined by distributing the absolute iBAQ quantification among the relative TMT abundances. All proteomic data are accessible in Table S5.
Computational Analysis
Relative Codon Usage (RCU). The RCU is defined as the contribution of a certain codon to the amino acid it belongs to. The RCU of all synonymous codons therefore sum up to 1.
where refers to the abundance of the codon , and is the set of all synonymous codons.
tRNA quantification. In both Hydro-tRNaseq and small RNA-seq FASTQ files, sequencing adapters were trimmed using BBDuk from the BBMap toolkit [v38.22] (https://sourceforge.net/projects/bbmap): k-mer = 10 (allowing 8 at the end of the read), Hamming distance = 1, length = 10-75bp, Phred > 25. Using the human reference genome GRCh38, the high confidence set of tRNAs from GtRNAdb (Chan and Lowe, 2016) was annotated with tRNAscan-SE [v2.0] (Chan and Lowe, 2019), which includes a total of 432 nuclear tRNAs and 20 mitochondrial tRNAs.
Trimmed FASTQ files were then mapped using a specific pipeline for tRNAs (Hoffmann et al., 2018). Summarizing, an artificial genome is first generated by masking all annotated tRNA genes and adding pre-tRNAs (i.e., tRNA genes with 3′ and 5′ genomic flanking regions) as extra chromosomes. Upon mapping to this artificial genome with Segemehl [v0.3.1] (Hoffmann et al., 2009), reads that map to the tRNA-masked chromosomes or to the tRNA flanking regions are filtered out in order to remove non-tRNA reads and unmature-tRNA reads respectively.
After this first mapping step, a second library is generated by adding 3′ CCA tails and removing introns from tRNA genes. All 100% identical sequences of this so-called mature tRNAs are clustered to avoid redundancy. Next, the subset of filtered reads from the first mapping is aligned against the clustered mature tRNAs using Segemehl [v0.3.1] (Hoffmann et al., 2009). Mapped reads are then realigned with GATK IndelRealigner [v3.8] (McKenna et al., 2010) to reduce the number of mismatching bases across all reads.
For quantification, isoacceptors were quantified as reads per million (RPM). In order to increase the coverage for anticodon-level quantification, we consider all reads that map unambiguously to a certain isoacceptor, even though they ambiguously map to different isodecoders (i.e., tRNA genes that differ in their sequence but share the same anticodon). Ambiguous reads mapping to genes of different isoacceptors were discarded.
Relative tRNA Adaptation Index (RtAI). As described by dos Reis et al. (2003, 2004), the tAI weights every codon based on the wobble-base codon-anticodon interaction rules. Let be a codon, then the decoding weight is a weighted sum of the square-root-normalized tRNA abundances for all tRNA isoacceptors that bind with affinity given the wobble-base pairing rules . However, while dos Reis et al. (2004) assumes that highly expressed genes are codon-optimized, here we use the non-optimized s-values to avoid a circularity in our reasoning:
For better comparison with the SDA, an amino-acid-normalized tAI measure is defined by dividing each tAI weight by the maximum weight among all codons within each amino acid family.
And therefore the RtAI of a certain protein is the product of weights of each codon at the triplet position throughout the full gene length , and normalized by the length.
Supply-to-Demand Adaptation (SDA). The SDA aims to consider not only tRNA abundances, but also the codon usage demand. In doing so, it constitutes a global measure of translation control, since the efficiency of a certain codon depends both on its complementary anticodon abundance as well as the demand for such anticodon by other transcripts. This global control has been indeed established to play an important role in defining optimal translation programs (Frumkin et al., 2018).
The definition of the SDA is based on similar previously published metrics (Gingold et al., 2012; Hernandez-Alias et al., 2020; Pechmann and Frydman, 2013), which consists of a ratio between the anticodon supply and demand. On the one hand, the anticodon supply is defined as the relative tAI weights (see previous section). On the other, the anticodon demand is estimated from the codon usage at the transcriptome level. It is computed as the frequency of each codon in a transcript weighted by the corresponding transcript expression, and finally summing up over all transcripts. Let be a codon, then the codon usage is a weighted sum of the counts of codon in gene weighted by the mRNA-seq abundance for all genes in the genome :
Similarly to the supply, the anticodon demand is then normalized within each amino acid family:
Finally, the SDA weights (SDAw) are defined as the ratio between the codon supply and demand :
And therefore the SDA of a certain protein is the product of weights of each codon at the triplet position throughout the full gene length , and normalized by the length.
Internal clustering validity. Three indexes were used to determine the clustering performance of the RCUs based on different viral features. These are “internal” metrics, since they evaluate the quality of a certain grouping using measures of the dataset itself (homogeneity of clusters, distances within and between clusters, etc.).
-
•
WB index is a ratio of the sum-of-squares (SS) within clusters and the SS between clusters, normalized by the number of clusters (Zhao and Fränti, 2014). Therefore, low values of the WB index are indicative of good clustering.
-
•
Dunn index considers the inter-cluster distance and diameter of the cluster hypersphere (Dunn, 1974). A higher Dunn index indicates better clustering.
-
•
Silhouette Coefficient ranges from −1 to +1, and measures how similar an object is to its own cluster (intra-cluster distance) compared to other clusters (nearest-cluster distance) (Al- Zoubi and Raw, 2008). A high value indicates a correct clustering.
Linear Discriminant Analysis of viral RCU. We applied a Linear Discriminant Analysis (LDA) to the viral RCUs, taking for each virus the average RCU of its proteins. We assigned each virus to its corresponding tropism (Table S1) in order to find the linear combination of codon features that maximized differences between viral target tissues. Given the collinear nature of RCUs by definition, the estimated coefficients are impossible to interpret, although it does not hamper the classification performance.
Other determinants of codon usage. To analyze the extent of multiple coding determinants on viral sequences, we computed two metrics associated with the folding of RNAs and the presence of ribosomal frameshift motifs. In both cases, we compared these results to a set of randomized sequences, which code for the exact same protein and have the same codon usage, but their codon composition is shuffled.
-
•
Minimum Free Energy (MFE). RNAs are not simple linear sequences, but rather need to be appropriately folded. As such, we applied the ViennaRNA toolkit (Lorenz et al., 2011) to predict the folding of all viral RNA sequences and therefore determine their corresponding Minimum Free Energy (MFE).
-
•
Ribosomal Frameshift prediction. Viruses are known to incorporate ribosomal frameshift events in their genomes in order to induce the expression of downstream coding regions or regulate the expression of protein products (Bekaert et al., 2010). As such, we applied the KnotInFrame tool (Theis et al., 2008) to identify sequences that could induce ribosome frameshift and would therefore be biasing our analysis. The algorithm computes the MFE of the pseudoknot RNA structure, which is known to produce frameshifts, and compares it with the base RNA folding.
Random Forest Classifier. To evaluate the adaptation of the viral proteins to the SDAw of human tissues, we computed their average SDA to each of the 23 TCGA tissues (Table S2). Using the set of 228 tropism-defined viruses, we had a total of 2891 viral proteins. Taking the 23 tissue-specific SDAs as features, we applied a Random Forest (RF) Classifier, populated with 100 decision trees, using the scikit-learn package (Pedregosa et al., 2011). Therefore, for each of the six viral tropisms, we developed a model for predicting the tropism-positive versus tropism-negative proteins based on the translational adaptation across tissues. Given that the size of the tropism-positive and tropism-negative groups were often unbalanced, we iteratively sampled equal-sized groups, for n = 100 iterations. Furthermore, we validated the results with a stratified 5-fold cross-validation.
In order to evaluate the performance of the RF models, we computed the Area Under the Curve (AUC) of Receiver Operating Characteristic (ROC) and Precision-Recall (PR) plots (Figure 2A). We took the average and standard deviation across all iterations. Similarly, we computed the relative feature weights corresponding to each of the 23 TCGA tissues (Figure 2B). In addition, we also validate the predictive potential of the model by performing a permutation test over 100 randomizations of the tropism labels of the dataset (Table S2).
For the dataset of Hydro-tRNaseq of human cells, we computed the average viral RtAI to each of the seven cell lines (Table S2). The RtAI is the supply-only version of SDA (see description above) since no codon demand information is available for this dataset. Using the same set of 2891 viral proteins across these seven RtAI features, we performed an identical RF classifier as above.
Linear Discriminant Analysis of tissue-specific SDAs. Similar to the RF classifier, we also computed the average proteome SDA per virus in each of the 23 tissues. We then applied a Linear Discriminant Analysis (LDA) to these averaged SDAs. We assigned each virus to its corresponding tropism (Table S1) in order to find the linear combination of tissue adaptation features that maximized differences between viral target tissues (Figure S2; Table S2).
Translational adaptation of human coronaviruses. The SARS-CoV-2 coronavirus constitutes the etiologic agent of the biggest pandemic of the 21st century, causing the COVID-19 pneumonia-like disease. As our systematic analysis suggests that the codon usage of viruses tend to be adapted to the tissue they infect, we selected the novel coronavirus SARS-CoV-2 and other related respiratory viruses to further explore their translational adaptation profile over tissues. We initially reconstructed tRNA expression profiles along the respiratory tract making use of the spatial information associated with healthy TCGA samples from head and neck squamous cell carcinoma (HNSC), lung squamous cell carcinoma (LUSC) and lung adenocarcinoma (LUAD) (Table S3). We then computed the SDA of viral proteins from the three pandemic coronaviruses of the last two decades SARS-CoV (Drosten et al., 2003), MERS-CoV (Zaki et al., 2012), and SARS-CoV-2 (Zhou et al., 2020a), as well as the common flu-causing influenza A virus (H1N1) along the respiratory tract (Figure S4A). Apart from the clear viral tropism of SARS-CoV-2 to the respiratory tract, recent studies propose that their tropism can expand to other tissues such as the digestive system or the brain (Baig et al., 2020; Zhang et al., 2020). For this reason, we also extended our translational analysis to all the 23 tissues of the TCGA dataset (Figure S5A).
Moreover, given that the tropisms not only depend on the translational adaptation to the host, but also on the expression of the required entry receptors, we measured the respective receptors of each virus (Figure S4B; Table S3). Influenza A viruses bind to α(2,6)-linked and α(2,3)-linked sialic acids, which are synthesized by the enzymes ST6GAL1 and ST3GAL4, respectively (Broszeit et al., 2019). The MERS-CoV uses the parenchyma-specific receptor DPP4 (Raj et al., 2013). On the other hand, both the SARS-CoV and SARS-CoV-2 strains bind to the ACE2 protein and require the proteolytic priming of the viral spike protein by TMPRSS2 (Hoffmann et al., 2020), although the receptor BSG/CD147 has also been proposed (Wang et al., 2020).
In an attempt to elucidate the translational selection that could have benefitted the evolution of the new coronavirus, we also compared the SDA adaptation of SARS-CoV-2 to those of close phylogenetic strains (Figure S5B): the human-infecting SARS-CoV and the bat coronavirus RatG13, with 79.6% and 96.2% of sequence identity, respectively (Zhou et al., 2020a).
Gene Set Enrichment Analysis (GSEA). We analyzed the enrichment of gene sets of the Virus Orthologous Groups using the GSEA algorithm (Subramanian et al., 2005). The score used to generate the ranked list input is specified in the text. For the analysis, all gene sets with at least 10 members appearing in the ranked list were included.
Quantification and statistical analysis
All details of the statistical analyses can be found in the figure legends. For hypothesis testing, a Wilcoxon rank-sum test was performed. We used a significance value of 0.05.
Acknowledgments
We thank Samuel Miravet-Verde for stimulating and critical discussions. We thank the CRG Genomics Unit for assistance with RNA sequencing services. The results published here are in part based on data generated by the TCGA Research Network (https://www.cancer.gov/tcga). We acknowledge the support of the Spanish Ministry of Science and Innovation (MICINN) (PGC2018-101271-B-I00 Plan Estatal), “Centro de Excelencia Severo Ochoa,” the CERCA Programme/Generalitat de Catalunya, and the Spanish Ministry of Science and Innovation (MICINN) to the EMBL partnership. The work of X.H.-A. has been supported by a PhD fellowship from the Fundación Ramón Areces.
Author contributions
Conceptualization, X.H.-A., M.H.S., and L.S.; methodology, X.H.-A., H.B., M.H.S., and L.S.; software, X.H.-A.; investigation, X.H.-A. and H.B.; validation, X.H.-A., H.B., and M.H.S.; formal analysis, X.H.-A.; writing-original draft, X.H.-A.; writing-review & editing, X.H.-A., H.B., M.H.S., and L.S.; visualization: X.H.-A., H.B., M.H.S., and L.S.; funding acquisition, L.S.; supervision, M.H.S. and L.S.
Declaration of interests
The authors declare no competing interests.
Published: March 16, 2021
Footnotes
Supplemental information can be found online at https://doi.org/10.1016/j.celrep.2021.108872.
Supplemental information
List of all viruses included in this study, together with their related information (genetic material, Baltimore classification, genus, family, tropism). Codon usage and annotation of all proteins of human-infecting viruses. Curated list of human viruses from ViralZone, together with their related information. Ribosomal Frameshift predictions of viral proteins. ViennaRNA (Lorenz et al., 2011) folding prediction of each of the viral sequences, using the Minimum Free Energy (kcal/mol). KnotInFrame (Theis et al., 2008) prediction of each of the viral proteins, based on the stability of a pseudoknot in the sequence.
Number and abbreviations of TCGA samples covering 23 cancer types. NT and TP correspond to “Normal Tissue” and “Tumor Primary” respectively. SDA of all viral proteins across the healthy samples of all TCGA tissues. Area Under the Curve of randomized ROC and Precision-Recall curves of NCBI and ViralZone virus lists. Feature weights describing the components of the Linear Discriminant Analysis (Figure S2). tRNA isoacceptor quantification in Reads Per Million (RPM) of the set of 7 tissue-wide cell lines using Hydro-tRNA-sequencing. Based on this tRNA quantification, the translational efficiency of all viral proteins in each sample is estimated using the Relative tRNA Adaptation Index.
SDA of viral proteins across the healthy samples of all TCGA tissues, including MERS-CoV, SARS-CoV, SARS-CoV-2 and Influenza A virus. RSEM expression of receptors and related proteins for the entry of MERS-CoV, SARS-CoV, SARS-CoV-2 and Influenza A virus.
Defined correspondences between matching tissues to viral tropisms. Supply-to-Demand Adaptation (SDA) of all tropism-defined viral proteins, with regard to their respective tissue of infection. Among the SDA of all proteins, the Gene Set Enrichment Analysis shows the Virus Orthologous Groups that are better or worse adapted.
Proteomic measurements of three time-course viral infection studies. tRNA isoacceptor quantification in Reads Per Million (RPM) of all small RNA-seq samples from cell lines upon viral infection. Using their tRNA quantification, the translational efficiency of viral proteins in each sample is estimated using the relative tAI (RtAI).
References
- Ahlgren N.A., Ren J., Lu Y.Y., Fuhrman J.A., Sun F. Alignment-free d2∗ oligonucleotide frequency dissimilarity measure improves prediction of hosts from metagenomically-derived viral sequences. Nucleic Acids Res. 2017;45:39–53. doi: 10.1093/nar/gkw1002. [DOI] [PMC free article] [PubMed] [Google Scholar]
- Aiewsakun P., Simmonds P. The genomic underpinnings of eukaryotic virus taxonomy: creating a sequence-based framework for family-level virus classification. Microbiome. 2018;6:38. doi: 10.1186/s40168-018-0422-7. [DOI] [PMC free article] [PubMed] [Google Scholar]
- Al- Zoubi M.B., Raw M. An Efficient Approach for Computing Silhouette Coefficients. J. Comput. Sci. 2008;4:252–255. [Google Scholar]
- Alexaki A., Kames J., Holcomb D.D., Athey J., Santana-Quintero L.V., Lam P.V.N., Hamasaki-Katagiri N., Osipova E., Simonyan V., Bar H. Codon and Codon-Pair Usage Tables (CoCoPUTs): Facilitating Genetic Variation Analyses and Recombinant Gene Design. J. Mol. Biol. 2019;431:2434–2441. doi: 10.1016/j.jmb.2019.04.021. [DOI] [PubMed] [Google Scholar]
- Athey J., Alexaki A., Osipova E., Rostovtsev A., Santana-Quintero L.V., Katneni U., Simonyan V., Kimchi-Sarfaty C. A new and updated resource for codon usage tables. BMC Bioinformatics. 2017;18:391. doi: 10.1186/s12859-017-1793-7. [DOI] [PMC free article] [PubMed] [Google Scholar]
- Bahir I., Fromer M., Prat Y., Linial M. Viral adaptation to host: a proteome-based analysis of codon usage and amino acid preferences. Mol. Syst. Biol. 2009;5:311. doi: 10.1038/msb.2009.71. [DOI] [PMC free article] [PubMed] [Google Scholar]
- Baig A.M., Khaleeq A., Ali U., Syeda H. Evidence of the COVID-19 Virus Targeting the CNS: Tissue Distribution, Host-Virus Interaction, and Proposed Neurotropic Mechanisms. ACS Chem. Neurosci. 2020;11:995–998. doi: 10.1021/acschemneuro.0c00122. [DOI] [PubMed] [Google Scholar]
- Bekaert M., Firth A.E., Zhang Y., Gladyshev V.N., Atkins J.F., Baranov P.V. Recode-2: new design, new search tools, and many more genes. Nucleic Acids Res. 2010;38:D69–D74. doi: 10.1093/nar/gkp788. [DOI] [PMC free article] [PubMed] [Google Scholar]
- Belalov I.S., Lukashev A.N. Causes and implications of codon usage bias in RNA viruses. PLoS One. 2013;8:e56642. doi: 10.1371/journal.pone.0056642. [DOI] [PMC free article] [PubMed] [Google Scholar]
- Bergman S., Tuller T. Widespread non-modular overlapping codes in the coding regions. Phys. Biol. 2020;17:031002. doi: 10.1088/1478-3975/ab7083. [DOI] [PubMed] [Google Scholar]
- Broszeit F., Tzarum N., Zhu X., Nemanichvili N., Eggink D., Leenders T., Li Z., Liu L., Wolfert M.A., Papanikolaou A. N-Glycolylneuraminic Acid as a Receptor for Influenza A Viruses. Cell Rep. 2019;27:3284–3294.e6. doi: 10.1016/j.celrep.2019.05.048. [DOI] [PMC free article] [PubMed] [Google Scholar]
- Carbone A. Codon bias is a major factor explaining phage evolution in translationally biased hosts. J. Mol. Evol. 2008;66:210–223. doi: 10.1007/s00239-008-9068-6. [DOI] [PubMed] [Google Scholar]
- Chan P.P., Lowe T.M. GtRNAdb 2.0: an expanded database of transfer RNA genes identified in complete and draft genomes. Nucleic Acids Res. 2016;44:D184–D189. doi: 10.1093/nar/gkv1309. [DOI] [PMC free article] [PubMed] [Google Scholar]
- Chan P.P., Lowe T.M. tRNAscan-SE: Searching for tRNA Genes in Genomic Sequences. Methods Mol. Biol. 2019;1962:1–14. doi: 10.1007/978-1-4939-9173-0_1. [DOI] [PMC free article] [PubMed] [Google Scholar]
- Chang S.T., Thomas M.J., Sova P., Green R.R., Palermo R.E., Katze M.G. Next-generation sequencing of small RNAs from HIV-infected cells identifies phased microrna expression patterns and candidate novel microRNAs differentially expressed upon infection. mBio. 2013;4 doi: 10.1128/mBio.00549-12. e00549-12. [DOI] [PMC free article] [PubMed] [Google Scholar]
- Chen F., Wu P., Deng S., Zhang H., Hou Y., Hu Z., Zhang J., Chen X., Yang J.-R. Dissimilation of synonymous codon usage bias in virus-host coevolution due to translational selection. Nat. Ecol. Evol. 2020;4:589–600. doi: 10.1038/s41559-020-1124-7. [DOI] [PMC free article] [PubMed] [Google Scholar]
- dos Reis M., Wernisch L., Savva R. Unexpected correlations between gene expression and codon usage bias from microarray data for the whole Escherichia coli K-12 genome. Nucleic Acids Res. 2003;31:6976–6985. doi: 10.1093/nar/gkg897. [DOI] [PMC free article] [PubMed] [Google Scholar]
- dos Reis M., Savva R., Wernisch L. Solving the riddle of codon usage preferences: a test for translational selection. Nucleic Acids Res. 2004;32:5036–5044. doi: 10.1093/nar/gkh834. [DOI] [PMC free article] [PubMed] [Google Scholar]
- Drosten C., Günther S., Preiser W., van der Werf S., Brodt H.-R., Becker S., Rabenau H., Panning M., Kolesnikova L., Fouchier R.A.M. Identification of a novel coronavirus in patients with severe acute respiratory syndrome. N. Engl. J. Med. 2003;348:1967–1976. doi: 10.1056/NEJMoa030747. [DOI] [PubMed] [Google Scholar]
- Dunn J.C. Well-Separated Clusters and Optimal Fuzzy Partitions. J. Cybern. 1974;4:95–104. [Google Scholar]
- Fielding C.A., Weekes M.P., Nobre L.V., Ruckova E., Wilkie G.S., Paulo J.A., Chang C., Suárez N.M., Davies J.A., Antrobus R. Control of immune ligands by members of a cytomegalovirus gene expansion suppresses natural killer cell activation. eLife. 2017;6:e22206. [Google Scholar]
- Franzo G., Tucciarone C.M., Cecchinato M., Drigo M. Canine parvovirus type 2 (CPV-2) and Feline panleukopenia virus (FPV) codon bias analysis reveals a progressive adaptation to the new niche after the host jump. Mol. Phylogenet. Evol. 2017;114:82–92. doi: 10.1016/j.ympev.2017.05.019. [DOI] [PubMed] [Google Scholar]
- Frumkin I., Lajoie M.J., Gregg C.J., Hornung G., Church G.M., Pilpel Y. Codon usage of highly expressed genes affects proteome-wide translation efficiency. Proc. Natl. Acad. Sci. USA. 2018;115:E4940–E4949. doi: 10.1073/pnas.1719375115. [DOI] [PMC free article] [PubMed] [Google Scholar]
- Gingold H., Dahan O., Pilpel Y. Dynamic changes in translational efficiency are deduced from codon usage of the transcriptome. Nucleic Acids Res. 2012;40:10053–10063. doi: 10.1093/nar/gks772. [DOI] [PMC free article] [PubMed] [Google Scholar]
- Gingold H., Tehler D., Christoffersen N.R., Nielsen M.M., Asmar F., Kooistra S.M., Christophersen N.S., Christensen L.L., Borre M., Sørensen K.D. A dual program for translation regulation in cellular proliferation and differentiation. Cell. 2014;158:1281–1292. doi: 10.1016/j.cell.2014.08.011. [DOI] [PubMed] [Google Scholar]
- Gogakos T., Brown M., Garzia A., Meyer C., Hafner M., Tuschl T. Characterizing Expression and Processing of Precursor and Mature Human tRNAs by Hydro-tRNAseq and PAR-CLIP. Cell Rep. 2017;20:1463–1475. doi: 10.1016/j.celrep.2017.07.029. [DOI] [PMC free article] [PubMed] [Google Scholar]
- Golumbeanu M., Desfarges S., Hernandez C., Quadroni M., Rato S., Mohammadi P., Telenti A., Beerenwinkel N., Ciuffi A. Proteo-Transcriptomic Dynamics of Cellular Response to HIV-1 Infection. Sci. Rep. 2019;9:213. doi: 10.1038/s41598-018-36135-3. [DOI] [PMC free article] [PubMed] [Google Scholar]
- Goz E., Mioduser O., Diament A., Tuller T. Evidence of translation efficiency adaptation of the coding regions of the bacteriophage lambda. DNA Res. 2017;24:333–342. doi: 10.1093/dnares/dsx005. [DOI] [PMC free article] [PubMed] [Google Scholar]
- Grantham R., Gautier C., Gouy M., Jacobzone M., Mercier R. Codon catalog usage is a genome strategy modulated for gene expressivity. Nucleic Acids Res. 1981;9:r43–r74. doi: 10.1093/nar/9.1.213-b. [DOI] [PMC free article] [PubMed] [Google Scholar]
- Hernandez-Alias X., Benisty H., Schaefer M.H., Serrano L. Translational efficiency across healthy and tumor tissues is proliferation-related. Mol. Syst. Biol. 2020;16:e9275. doi: 10.15252/msb.20199275. [DOI] [PMC free article] [PubMed] [Google Scholar]
- Hoffmann S., Otto C., Kurtz S., Sharma C.M., Khaitovich P., Vogel J., Stadler P.F., Hackermüller J. Fast mapping of short sequences with mismatches, insertions and deletions using index structures. PLoS Comput. Biol. 2009;5:e1000502. doi: 10.1371/journal.pcbi.1000502. [DOI] [PMC free article] [PubMed] [Google Scholar]
- Hoffmann A., Fallmann J., Vilardo E., Mörl M., Stadler P.F., Amman F. Accurate mapping of tRNA reads. Bioinformatics. 2018;34:1116–1124. doi: 10.1093/bioinformatics/btx756. [DOI] [PubMed] [Google Scholar]
- Hoffmann M., Kleine-Weber H., Schroeder S., Krüger N., Herrler T., Erichsen S., Schiergens T.S., Herrler G., Wu N.-H., Nitsche A. SARS-CoV-2 Cell Entry Depends on ACE2 and TMPRSS2 and Is Blocked by a Clinically Proven Protease Inhibitor. Cell. 2020;181:271–280.e8. doi: 10.1016/j.cell.2020.02.052. [DOI] [PMC free article] [PubMed] [Google Scholar]
- Hulo C., de Castro E., Masson P., Bougueleret L., Bairoch A., Xenarios I., Le Mercier P. ViralZone: a knowledge resource to understand virus diversity. Nucleic Acids Res. 2011;39:D576–D582. doi: 10.1093/nar/gkq901. [DOI] [PMC free article] [PubMed] [Google Scholar]
- Jenkins G.M., Holmes E.C. The extent of codon usage bias in human RNA viruses and its evolutionary origin. Virus Res. 2003;92:1–7. doi: 10.1016/s0168-1702(02)00309-x. [DOI] [PubMed] [Google Scholar]
- Knipe D.M., Howley P.M. Lippincott Williams and Wilkins; 2013. Fields Virology. [Google Scholar]
- Lauring A.S., Jones J.O., Andino R. Rationalizing the development of live attenuated virus vaccines. Nat. Biotechnol. 2010;28:573–579. doi: 10.1038/nbt.1635. [DOI] [PMC free article] [PubMed] [Google Scholar]
- Li H., Handsaker B., Wysoker A., Fennell T., Ruan J., Homer N., Marth G., Abecasis G., Durbin R., 1000 Genome Project Data Processing Subgroup The Sequence Alignment/Map format and SAMtools. Bioinformatics. 2009;25:2078–2079. doi: 10.1093/bioinformatics/btp352. [DOI] [PMC free article] [PubMed] [Google Scholar]
- Li M., Kao E., Gao X., Sandig H., Limmer K., Pavon-Eternod M., Jones T.E., Landry S., Pan T., Weitzman M.D., David M. Codon-usage-based inhibition of HIV protein synthesis by human schlafen 11. Nature. 2012;491:125–128. doi: 10.1038/nature11433. [DOI] [PMC free article] [PubMed] [Google Scholar]
- Li Y.-C., Bai W.-Z., Hashikawa T. The neuroinvasive potential of SARS-CoV2 may play a role in the respiratory failure of COVID-19 patients. J. Med. Virol. 2020;92:552–555. doi: 10.1002/jmv.25728. [DOI] [PMC free article] [PubMed] [Google Scholar]
- Lorenz R., Bernhart S.H., Höner Zu Siederdissen C., Tafer H., Flamm C., Stadler P.F., Hofacker I.L. ViennaRNA Package 2.0. Algorithms Mol. Biol. 2011;6:26. doi: 10.1186/1748-7188-6-26. [DOI] [PMC free article] [PubMed] [Google Scholar]
- Lucks J.B., Nelson D.R., Kudla G.R., Plotkin J.B. Genome landscapes and bacteriophage codon usage. PLoS Comput. Biol. 2008;4:e1000001. doi: 10.1371/journal.pcbi.1000001. [DOI] [PMC free article] [PubMed] [Google Scholar]
- Luo W., Tian L., Gan Y., Chen E., Shen X., Pan J., Irwin D.M., Chen R.-A., Shen Y. The fit of codon usage of human-isolated avian influenza A viruses to human. Infect. Genet. Evol. 2020;81:104181. doi: 10.1016/j.meegid.2020.104181. [DOI] [PubMed] [Google Scholar]
- Mao L., Jin H., Wang M., Hu Y., Chen S., He Q., Chang J., Hong C., Zhou Y., Wang D. Neurologic Manifestations of Hospitalized Patients With Coronavirus Disease 2019 in Wuhan, China. JAMA Neurol. 2020;77:683–690. doi: 10.1001/jamaneurol.2020.1127. [DOI] [PMC free article] [PubMed] [Google Scholar]
- McKenna A., Hanna M., Banks E., Sivachenko A., Cibulskis K., Kernytsky A., Garimella K., Altshuler D., Gabriel S., Daly M., DePristo M.A. The Genome Analysis Toolkit: a MapReduce framework for analyzing next-generation DNA sequencing data. Genome Res. 2010;20:1297–1303. doi: 10.1101/gr.107524.110. [DOI] [PMC free article] [PubMed] [Google Scholar]
- Miller B., Hippen A.A., Wright S.M., Morris C., Ridge P.G. Human viruses have codon usage biases that match highly expressed proteins in the tissues they infect. Biomed. Genet. Genomics. 2017;2 [Google Scholar]
- Mioduser O., Goz E., Tuller T. Significant differences in terms of codon usage bias between bacteriophage early and late genes: a comparative genomics analysis. BMC Genomics. 2017;18:866. doi: 10.1186/s12864-017-4248-7. [DOI] [PMC free article] [PubMed] [Google Scholar]
- Morgado S., Vicente A.C. Global In-Silico Scenario of tRNA Genes and Their Organization in Virus Genomes. Viruses. 2019;11:180. doi: 10.3390/v11020180. [DOI] [PMC free article] [PubMed] [Google Scholar]
- Nobre L.V., Nightingale K., Ravenhill B.J., Antrobus R., Soday L., Nichols J., Davies J.A., Seirafian S., Wang E.C., Davison A.J. Human cytomegalovirus interactome analysis identifies degradation hubs, domain associations and viral protein functions. eLife. 2019;8:e49894. doi: 10.7554/eLife.49894. [DOI] [PMC free article] [PubMed] [Google Scholar]
- Ouwendijk W.J.D., Dekker L.J.M., van den Ham H.-J., Lenac Rovis T., Haefner E.S., Jonjic S., Haas J., Luider T.M., Verjans G.M.G.M. Analysis of Virus and Host Proteomes During Productive HSV-1 and VZV Infection in Human Epithelial Cells. Front. Microbiol. 2020;11:1179. doi: 10.3389/fmicb.2020.01179. [DOI] [PMC free article] [PubMed] [Google Scholar]
- Pan L., Mu M., Yang P., Sun Y., Wang R., Yan J., Li P., Hu B., Wang J., Hu C. Clinical Characteristics of COVID-19 Patients With Digestive Symptoms in Hubei, China: A Descriptive, Cross-Sectional, Multicenter Study. Am. J. Gastroenterol. 2020;115:766–773. doi: 10.14309/ajg.0000000000000620. [DOI] [PMC free article] [PubMed] [Google Scholar]
- Pavon-Eternod M., David A., Dittmar K., Berglund P., Pan T., Bennink J.R., Yewdell J.W. Vaccinia and influenza A viruses select rather than adjust tRNAs to optimize translation. Nucleic Acids Res. 2013;41:1914–1921. doi: 10.1093/nar/gks986. [DOI] [PMC free article] [PubMed] [Google Scholar]
- Pechmann S., Frydman J. Evolutionary conservation of codon optimality reveals hidden signatures of cotranslational folding. Nat. Struct. Mol. Biol. 2013;20:237–243. doi: 10.1038/nsmb.2466. [DOI] [PMC free article] [PubMed] [Google Scholar]
- Pedregosa F., Varoquaux G., Gramfort A., Michel V., Thirion B., Grisel O., Blondel M., Prettenhofer P., Weiss R., Dubourg V. Scikit-learn: Machine Learning in Python. J. Mach. Learn. Res. 2011;12:2825–2830. [Google Scholar]
- Plotkin J.B., Kudla G. Synonymous but not the same: the causes and consequences of codon bias. Nat. Rev. Genet. 2011;12:32–42. doi: 10.1038/nrg2899. [DOI] [PMC free article] [PubMed] [Google Scholar]
- Pouyet F., Mouchiroud D., Duret L., Sémon M. Recombination, meiotic expression and human codon usage. eLife. 2017;6:e27344. doi: 10.7554/eLife.27344. [DOI] [PMC free article] [PubMed] [Google Scholar]
- Quinlan A.R., Hall I.M. BEDTools: a flexible suite of utilities for comparing genomic features. Bioinformatics. 2010;26:841–842. doi: 10.1093/bioinformatics/btq033. [DOI] [PMC free article] [PubMed] [Google Scholar]
- Raj V.S., Mou H., Smits S.L., Dekkers D.H.W., Müller M.A., Dijkman R., Muth D., Demmers J.A.A., Zaki A., Fouchier R.A.M. Dipeptidyl peptidase 4 is a functional receptor for the emerging human coronavirus-EMC. Nature. 2013;495:251–254. doi: 10.1038/nature12005. [DOI] [PMC free article] [PubMed] [Google Scholar]
- Ren J., Ahlgren N.A., Lu Y.Y., Fuhrman J.A., Sun F. VirFinder: a novel k-mer based tool for identifying viral sequences from assembled metagenomic data. Microbiome. 2017;5:69. doi: 10.1186/s40168-017-0283-5. [DOI] [PMC free article] [PubMed] [Google Scholar]
- Shackelton L.A., Parrish C.R., Holmes E.C. Evolutionary basis of codon usage and nucleotide composition bias in vertebrate DNA viruses. J. Mol. Evol. 2006;62:551–563. doi: 10.1007/s00239-005-0221-1. [DOI] [PubMed] [Google Scholar]
- Sharp P.M., Stenico M., Peden J.F., Lloyd A.T. Codon usage: mutational bias, translational selection, or both? Biochem. Soc. Trans. 1993;21:835–841. doi: 10.1042/bst0210835. [DOI] [PubMed] [Google Scholar]
- Shi J., Hu N., Mo L., Zeng Z., Sun J., Hu Y. Deep RNA Sequencing Reveals a Repertoire of Human Fibroblast Circular RNAs Associated with Cellular Responses to Herpes Simplex Virus 1 Infection. Cell. Physiol. Biochem. 2018;47:2031–2045. doi: 10.1159/000491471. [DOI] [PubMed] [Google Scholar]
- Stark T.J., Arnold J.D., Spector D.H., Yeo G.W. High-resolution profiling and analysis of viral and host small RNAs during human cytomegalovirus infection. J. Virol. 2012;86:226–235. doi: 10.1128/JVI.05903-11. [DOI] [PMC free article] [PubMed] [Google Scholar]
- Stothard P. The sequence manipulation suite: JavaScript programs for analyzing and formatting protein and DNA sequences. BioTechniques. 2000;28:1102–1104. doi: 10.2144/00286ir01. [DOI] [PubMed] [Google Scholar]
- Subramanian A., Tamayo P., Mootha V.K., Mukherjee S., Ebert B.L., Gillette M.A., Paulovich A., Pomeroy S.L., Golub T.R., Lander E.S., Mesirov J.P. Gene set enrichment analysis: a knowledge-based approach for interpreting genome-wide expression profiles. Proc. Natl. Acad. Sci. USA. 2005;102:15545–15550. doi: 10.1073/pnas.0506580102. [DOI] [PMC free article] [PubMed] [Google Scholar]
- Sungnak W., Huang N., Bécavin C., Berg M., Queen R., Litvinukova M., Talavera-López C., Maatz H., Reichart D., Sampaziotis F. SARS-CoV-2 entry factors are highly expressed in nasal epithelial cells together with innate immune genes. Nat. Med. 2020;26:681–687. doi: 10.1038/s41591-020-0868-6. [DOI] [PMC free article] [PubMed] [Google Scholar]
- Theis C., Reeder J., Giegerich R. KnotInFrame: prediction of -1 ribosomal frameshift events. Nucleic Acids Res. 2008;36:6013–6020. doi: 10.1093/nar/gkn578. [DOI] [PMC free article] [PubMed] [Google Scholar]
- van Weringh A., Ragonnet-Cronin M., Pranckeviciene E., Pavon-Eternod M., Kleiman L., Xia X. HIV-1 modulates the tRNA pool to improve translation efficiency. Mol. Biol. Evol. 2011;28:1827–1834. doi: 10.1093/molbev/msr005. [DOI] [PMC free article] [PubMed] [Google Scholar]
- Walker P.J., Siddell S.G., Lefkowitz E.J., Mushegian A.R., Dempsey D.M., Dutilh B.E., Harrach B., Harrison R.L., Hendrickson R.C., Junglen S. Changes to virus taxonomy and the International Code of Virus Classification and Nomenclature ratified by the International Committee on Taxonomy of Viruses (2019) Arch. Virol. 2019;164:2417–2429. doi: 10.1007/s00705-019-04306-w. [DOI] [PubMed] [Google Scholar]
- Wang K., Chen W., Zhou Y.-S., Lian J.-Q., Zhang Z., Du P., Gong L., Zhang Y., Cui H.-Y., Geng J.-J. SARS-CoV-2 invades host cells via a novel route: CD147-spike protein. bioRxiv. 2020 doi: 10.1101/2020.03.14.988345. [DOI] [PMC free article] [PubMed] [Google Scholar]
- Weekes M.P., Tomasec P., Huttlin E.L., Fielding C.A., Nusinow D., Stanton R.J., Wang E.C.Y., Aicheler R., Murrell I., Wilkinson G.W.G. Quantitative temporal viromics: an approach to investigate host-pathogen interaction. Cell. 2014;157:1460–1472. doi: 10.1016/j.cell.2014.04.028. [DOI] [PMC free article] [PubMed] [Google Scholar]
- Wong E.H.M., Smith D.K., Rabadan R., Peiris M., Poon L.L.M. Codon usage bias and the evolution of influenza A viruses. Codon Usage Biases of Influenza Virus. BMC Evol. Biol. 2010;10:253. doi: 10.1186/1471-2148-10-253. [DOI] [PMC free article] [PubMed] [Google Scholar]
- World Health Organization . 2020. Novel Coronavirus (2019-nCoV) situation reports.https://www.who.int/docs/default-source/coronaviruse/situation-reports/20210302_weekly_epi_update_29.pdf [Google Scholar]
- Wu F., Zhao S., Yu B., Chen Y.-M., Wang W., Song Z.-G., Hu Y., Tao Z.-W., Tian J.-H., Pei Y.-Y. A new coronavirus associated with human respiratory disease in China. Nature. 2020;579:265–269. doi: 10.1038/s41586-020-2008-3. [DOI] [PMC free article] [PubMed] [Google Scholar]
- Zaki A.M., van Boheemen S., Bestebroer T.M., Osterhaus A.D.M.E., Fouchier R.A.M. Isolation of a novel coronavirus from a man with pneumonia in Saudi Arabia. N. Engl. J. Med. 2012;367:1814–1820. doi: 10.1056/NEJMoa1211721. [DOI] [PubMed] [Google Scholar]
- Zhang Z., Ye Y., Gong J., Ruan H., Liu C.-J., Xiang Y., Cai C., Guo A.-Y., Ling J., Diao L. Global analysis of tRNA and translation factor expression reveals a dynamic landscape of translational regulation in human cancers. Commun. Biol. 2018;1:234. doi: 10.1038/s42003-018-0239-8. [DOI] [PMC free article] [PubMed] [Google Scholar]
- Zhang H., Kang Z., Gong H., Xu D., Wang J., Li Z., Li Z., Cui X., Xiao J., Zhan J. Digestive system is a potential route of COVID-19: an analysis of single-cell coexpression pattern of key proteins in viral entry process. Gut. 2020;69:1010–1018. [Google Scholar]
- Zhao Q., Fränti P. WB-index: A sum-of-squares based index for cluster validity. Data Knowl. Eng. 2014;92:77–89. [Google Scholar]
- Zhao K.-N., Gu W., Fang N.X., Saunders N.A., Frazer I.H. Gene codon composition determines differentiation-dependent expression of a viral capsid gene in keratinocytes in vitro and in vivo. Mol. Cell. Biol. 2005;25:8643–8655. doi: 10.1128/MCB.25.19.8643-8655.2005. [DOI] [PMC free article] [PubMed] [Google Scholar]
- Zhou J., Liu W.J., Peng S.W., Sun X.Y., Frazer I. Papillomavirus capsid protein expression level depends on the match between codon usage and tRNA availability. J. Virol. 1999;73:4972–4982. doi: 10.1128/jvi.73.6.4972-4982.1999. [DOI] [PMC free article] [PubMed] [Google Scholar]
- Zhou P., Yang X.-L., Wang X.-G., Hu B., Zhang L., Zhang W., Si H.-R., Zhu Y., Li B., Huang C.-L. A pneumonia outbreak associated with a new coronavirus of probable bat origin. Nature. 2020;579:270–273. doi: 10.1038/s41586-020-2012-7. [DOI] [PMC free article] [PubMed] [Google Scholar]
- Zhou Z., Zhao N., Shu Y., Han S., Chen B., Shu X. Effect of gastrointestinal symptoms on patients infected with COVID-19. Gastroenterology. 2020;158:2294–2297. doi: 10.1053/j.gastro.2020.03.020. [DOI] [PMC free article] [PubMed] [Google Scholar]
- Ziegler C.G.K., Allon S.J., Nyquist S.K., Mbano I.M., Miao V.N., Tzouanas C.N., Cao Y., Yousif A.S., Bals J., Hauser B.M. SARS-CoV-2 Receptor ACE2 Is an Interferon-Stimulated Gene in Human Airway Epithelial Cells and Is Detected in Specific Cell Subsets across Tissues. Cell. 2020;181:1016–1035.e19. doi: 10.1016/j.cell.2020.04.035. [DOI] [PMC free article] [PubMed] [Google Scholar]
Associated Data
This section collects any data citations, data availability statements, or supplementary materials included in this article.
Supplementary Materials
List of all viruses included in this study, together with their related information (genetic material, Baltimore classification, genus, family, tropism). Codon usage and annotation of all proteins of human-infecting viruses. Curated list of human viruses from ViralZone, together with their related information. Ribosomal Frameshift predictions of viral proteins. ViennaRNA (Lorenz et al., 2011) folding prediction of each of the viral sequences, using the Minimum Free Energy (kcal/mol). KnotInFrame (Theis et al., 2008) prediction of each of the viral proteins, based on the stability of a pseudoknot in the sequence.
Number and abbreviations of TCGA samples covering 23 cancer types. NT and TP correspond to “Normal Tissue” and “Tumor Primary” respectively. SDA of all viral proteins across the healthy samples of all TCGA tissues. Area Under the Curve of randomized ROC and Precision-Recall curves of NCBI and ViralZone virus lists. Feature weights describing the components of the Linear Discriminant Analysis (Figure S2). tRNA isoacceptor quantification in Reads Per Million (RPM) of the set of 7 tissue-wide cell lines using Hydro-tRNA-sequencing. Based on this tRNA quantification, the translational efficiency of all viral proteins in each sample is estimated using the Relative tRNA Adaptation Index.
SDA of viral proteins across the healthy samples of all TCGA tissues, including MERS-CoV, SARS-CoV, SARS-CoV-2 and Influenza A virus. RSEM expression of receptors and related proteins for the entry of MERS-CoV, SARS-CoV, SARS-CoV-2 and Influenza A virus.
Defined correspondences between matching tissues to viral tropisms. Supply-to-Demand Adaptation (SDA) of all tropism-defined viral proteins, with regard to their respective tissue of infection. Among the SDA of all proteins, the Gene Set Enrichment Analysis shows the Virus Orthologous Groups that are better or worse adapted.
Proteomic measurements of three time-course viral infection studies. tRNA isoacceptor quantification in Reads Per Million (RPM) of all small RNA-seq samples from cell lines upon viral infection. Using their tRNA quantification, the translational efficiency of viral proteins in each sample is estimated using the relative tAI (RtAI).
Data Availability Statement
The code used in this study is available at GitHub: https://github.com/hexavier/tRNA_viruses, https://github.com/hexavier/tRNA_mapping. The accession number for the data reported in this paper is ArrayExpress: E-MTAB-9905.