Abstract
Breast cancer brain metastasis (BCBM) is a devastating disease. Radiation therapy remains the mainstay for treatment of this disease. Unfortunately, its efficacy is limited by the dose that can be safely applied. One promising approach to overcoming this limitation is to sensitize BCBMs to radiation by inhibiting their ability to repair DNA damage. Here, we report a DNA repair suppressor, leucine-rich repeat-containing protein 31 (LRRC31), that was identified through a genome-wide CRISPR screen. We found that overexpression of LRRC31 suppresses DNA repair and sensitizes BCBMs to radiation. Mechanistically, LRRC31 interacts with Ku70/Ku80 and ATR at the protein level, resulting in inhibition of DNA-PKcs recruitment and activation, and disruption of the MSH2-ATR module. We demonstrated that targeted delivery of LRRC31 gene via nanoparticles significantly improved the survival of tumor-bearing mice after irradiation. Collectively, our study suggests LRRC31 as a major DNA repair suppressor that can be targeted for cancer radiosensitizing therapy.
With the development of effective systemic therapies and the availability of improved imaging techniques, breast cancer brain metastases (BCBMs) have seen an increasing prevalence among breast cancer patients 1–4. The prognosis for patients with BCBMs is dismal, with a median survival of 2.3–7.1 months 5, 6. Current treatments for BCBMs are palliative, with radiation therapy as the mainstay. The therapeutic benefit of radiation therapy is typically correlated with the dose applied 7, 8. One might consider that a potential approach to enhancing the efficacy of radiation therapy would be to increase the radiation dose, which, unfortunately, is associated with high risk of cognitive and functional deficits 7, 8. An alternative to overcome this limitation is to sensitize tumors to radiation; thus, the standard regimens can yield improved outcomes. To achieve this, we need to understand the genetic regulation of BCBM radiosensitivity.
The major mechanism accounting for radiation- induced cell killing is DNA damage, with double-strand breaks (DSBs) being the most lethal form. Therefore, the sensitivity of cancer cells to radiation largely depends on their ability to recognize and respond to DSBs 9, 10. The earliest responders to DSBs include Ataxia telangiectasia mutated (ATM), and Ataxia telangiectasia mutated and RAD3-related (ATR), which activate various protein complexes, induce phosphorylation of γH2AX, and recruit additional molecules essential for DNA repair. DSBs are repaired by two major pathways, nonhomologous end-joining (NHEJ) and homologous recombination (HR), with NHEJ as the predominant one in human cells 9, 10.
In this study, we set to identify radiosensitizing genes to improve BCBM radiation therapy by performing a genome-wide, clustered regularly interspaced short palindromic repeats (CRISPR) screen using MDA-MB-231-Br-HER2 (231BR) cells, a well-characterized BCBM model capable of recapitulating human BCBMs 11, 12. Through the screen, we identified leucine-rich repeat-containing protein 31 (LRRC31) as a major inhibitor of DNA DSB repair. We found that LRRC31 interacts with Ku70/Ku80 and ATR through its leucine-rich repeat (LRR) domains, resulting in inhibition of DNA-PKcs recruitment and activation as well as disruption of the ATR-MSH2 signaling module. We showed that systemic delivery of LRRC31 gene via nanoparticles effectively sensitized BCBMs to radiation therapy.
Results
Genome-wide CRISPR screen identified LRRC31 as a radiosensitizing gene
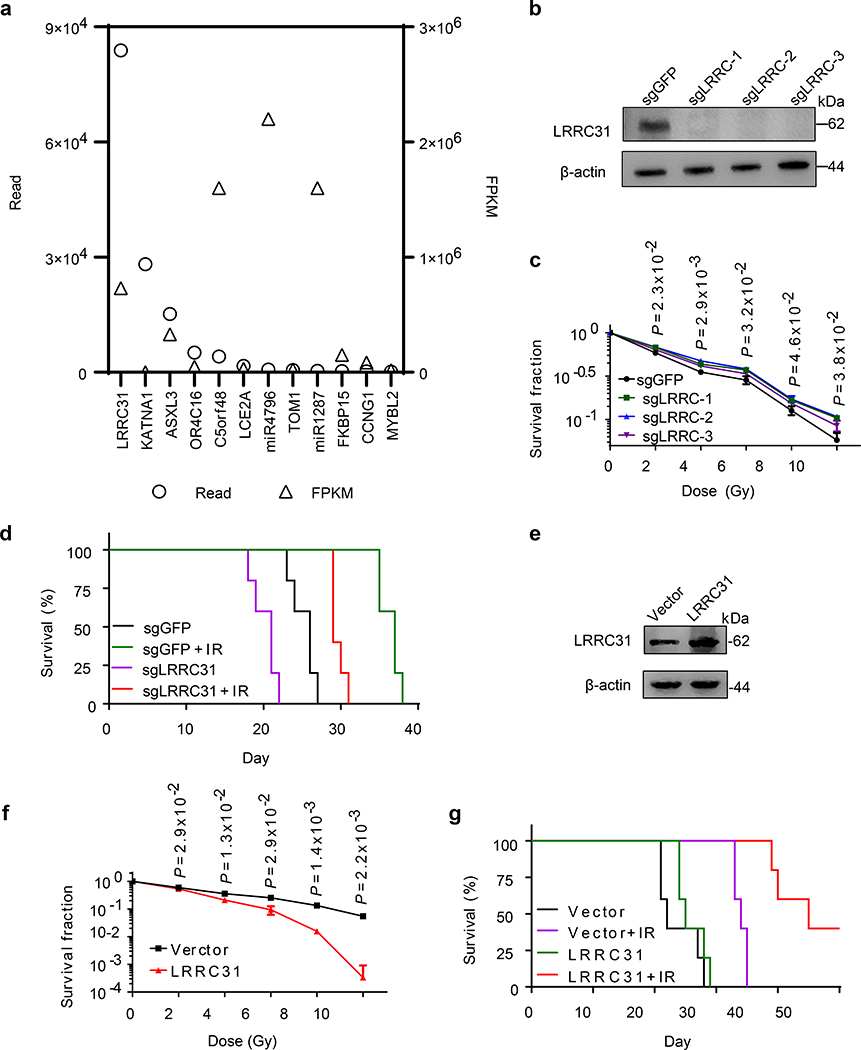
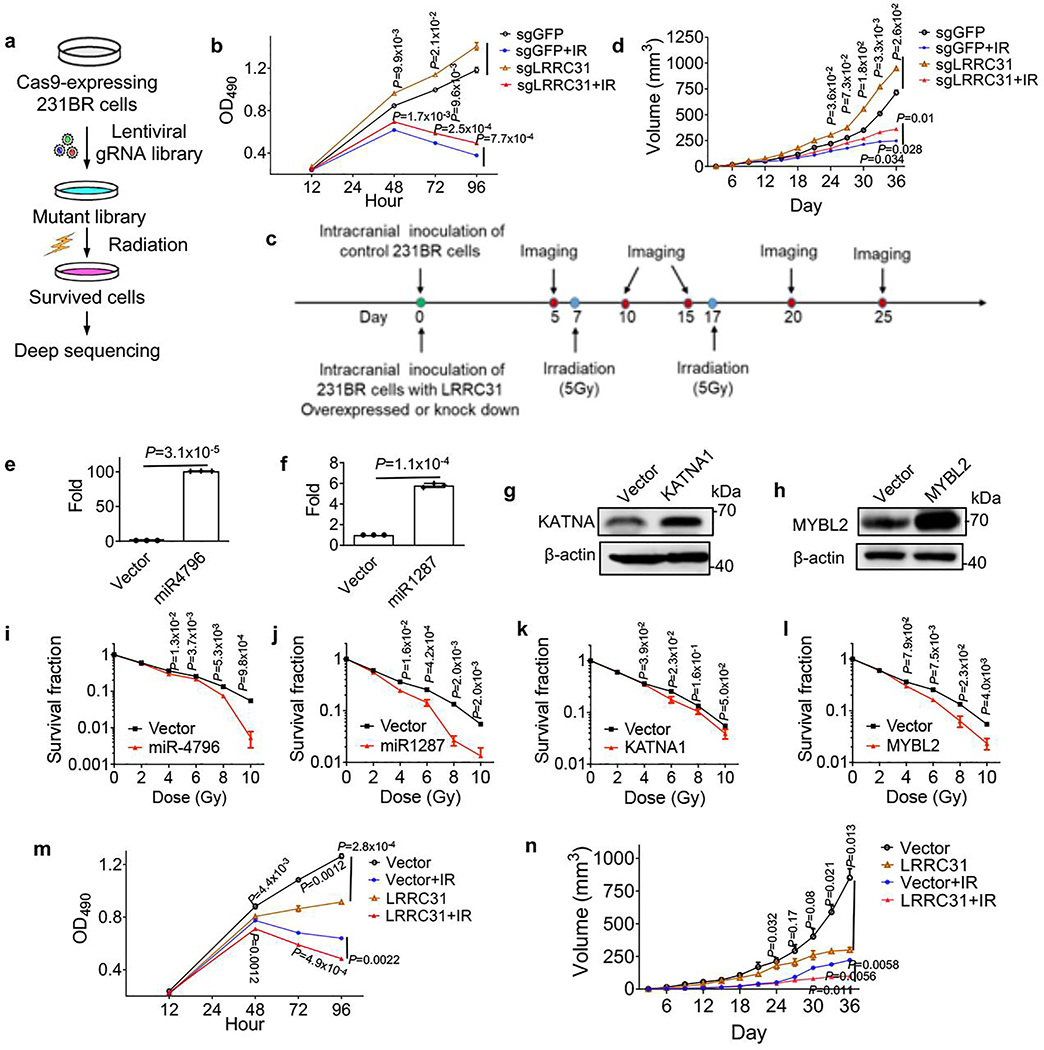
To identify radiosensitizing gene, we generated Cas9/sgRNA-expressing 231BR cells using a genome-wide CRISPR library 13. The cells were then treated with radiation at 10 Gy, a lethal dose that kills all wild type cells. A small fraction of cells transduced with the CRISPR library survived. We collected the surviving cells, extracted their DNA, and subjected it to deep sequencing (Extended Data Fig. 1a). In total, 121 sgRNAs covered by 274,573 reads were identified. The top 12 candidate sgRNAs, which were ranked based on read number and fragments per kilobase of transcript per million mapped reads (FPKM) value generated based on analysis using BEDtools and Cufflinks were shown in Fig. 1a. The full list of identified genes is provided in Supplementary Table 1. Among all candidates, LRRC31 is a significant outlier based on the read number. To validate if down-regulation of LRRC31 expression enhances survival, we generated 231BR cells with stable expression of Cas9 and LRRC31-targeting sgRNAs. Analysis by Western Blot (WB) found that all the three selected sgRNAs significantly decreased the expression of LRRC31 (Fig. 1b). In vitro clonogenic assay and proliferation assay showed that downregulation of LRRC31 induced a relatively small but statistically significant increase in radiation resistance, particularly when sgLRRC-2 was used (Fig. 1c, Extended Data Fig. 1b). We evaluated 231BR cells with stable expression of Cas9 and sgLRRC-2 for their sensitivity to irradiation in the mouse brain (Extended Data Fig. 1c), and found that, consistent with the observation in cell culture, down-regulation of LRRC31 expression rendered significant resistance to radiotherapy (Fig. 1d, p = 0.004 for comparison of the sgGFP+IR group with the sgLRRC31+IR group). A similar trend was also found when the tumors were inoculated in the flank (Extended Data Fig. 1d).
Fig. 1: Genome-wide CRISPR screen identified LRRC31 as a radiosensitizing gene.
a, Top 12 gRNAs ranked based on read number and FPKM value. Cutoff value for FPKM is 10,000 except KATNA2, which has the second highest read number but a small FPKM value. b, WB analysis of the expression of LRRC31 in 231BR cells transduced with Cas9 and the indicated sgRNAs. c, Clonogenic analysis of 231BR cells with down-regulation of LRRC31 7 days after irradiation (n=3 biologically independent samples). d, Kaplan-Meier survival analysis of mice bearing 231BR tumors with down-regulation of LRRC31 in the brain after irradiation (n=5 animals). e, WB analysis of the expression of LRRC31 in 231BR cells transduced with control vector or lentiviral vector for LRRC31 overexpression. f, Clonogenic analysis of 231BR cells with overexpression of LRRC31 7 days after irradiation (n=3 biologically independent samples). g, Kaplan-Meier survival analysis of mice bearing 231BR tumors with overexpression of LRRC31 in the brain after irradiation (n=5 animals). Blots are representatives of two biologically independent experiments with similar results obtained. Unprocessed immunoblots are shown in Source Data Fig. 1. For c and f, data show the mean ± s.d.. Differences between two different groups were compared using the unpaired, two-tailed Student’s t-test. For d and g, experiments were carried out according to the schematic diagram shown in Extended Data Fig 1c. Statistical calculations for Kaplan-Meier survival analysis are included in Source Data 1.
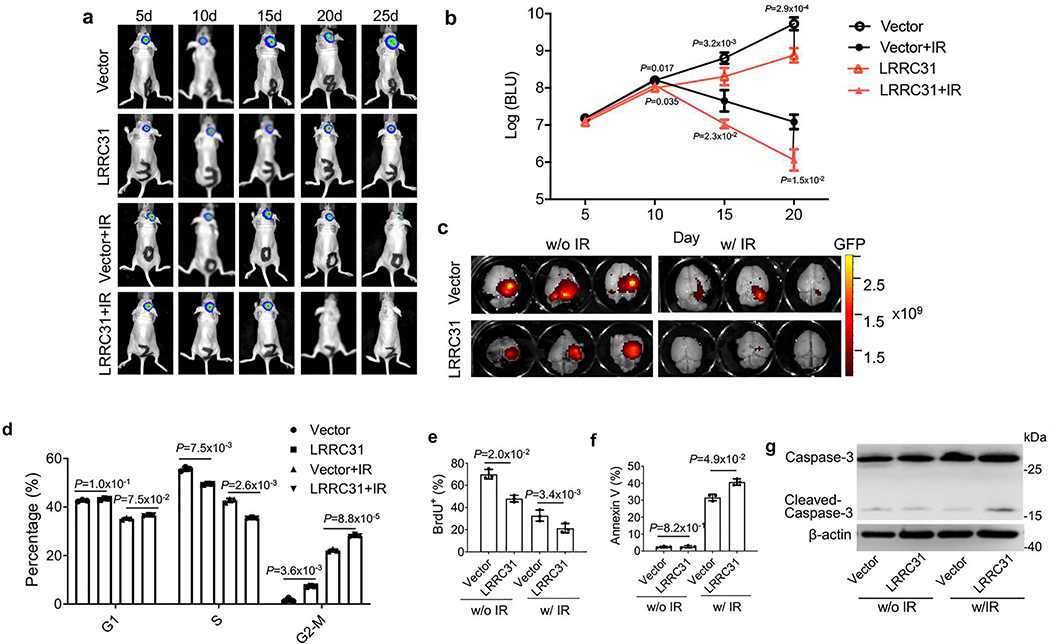
The screen we performed is a negative screen, through which we identified genes that confer radioresistance after downregulation. As we aimed to identify radiosensitizing genes, we tested if the candidate genes increase radiosensitivity when overexpressed. We generated 231BR cells with overexpression of five top candidate genes, including LRRC31, miR4796, miR1287, KATNA1, and MYBL2, through lentiviral transduction. Cells transduced with vectors were used as controls. Overexpression of the candidate genes was verified by quantitative RT-PCR for miR4796 and miR1287 and WB for others (Fig. 1e, Extended Data Fig. 1e–h). We found that overexpression of each candidate gene significantly sensitized 231BR cells to irradiation (Fig. 1f, Extended Data Fig. 1i–l). Among all the five tested genes, LRRC31 demonstrated the greatest radiosensitizing effect with a dose enhancement factor (DEF) of 1.7 at surviving fraction 0.4, suggesting LRRC31 as a promising radiosensitizing gene. This finding is supported by two additional lines of evidence. First, compared to control cells, LRRC31-overexpressed 231BR cells after irradiation exhibited significantly lower ability to proliferate (Extended Data Fig. 1m). Second, characterization in the brain, as described in Extended Data Fig. 1c, found that intracranial tumors derived from LRRC31- overexpressed 231BR cells exhibited a significantly greater sensitivity to irradiation than control tumors (Fig. 1g, p = 0.003 for comparison of the GFP+IR group with the LRRC31+IR group). Consistently, we found that the residual tumors in mice inoculated with LRRC31- overexpressed 231BR cells were significantly smaller than those in mice inoculated with control cells (Extended Data Fig. 2a–c).
In addition to its radiosensitizing effect, LRRC31 also demonstrates a tumor suppressing effect. We found that down-regulation of LRRC31 expression promoted the proliferation of 231BR cells in vitro (Extended Data Fig. 1b) and tumor growth in vivo (Fig. 1d, Extended Data Fig. 1d). Conversely, overexpression of LRRC31 inhibited cell proliferation in vitro (Extended Data Fig. 1m) and tumor development in vivo (Fig. 1g, Extended Data Fig. 1n). Mechanistically, it appears that LRRC31 regulates both cell cycle and apoptosis. Results in Extended Data Fig. 2d–g showed that overexpression of LRRC31 is associated with small but statistically significant increase of cell population in the G2-M phase, and, when irradiation was applied, the overexpression enhanced cellular apoptosis.
LRRC31 impairs DNA DSB repair by inhibiting the NHEJ pathway
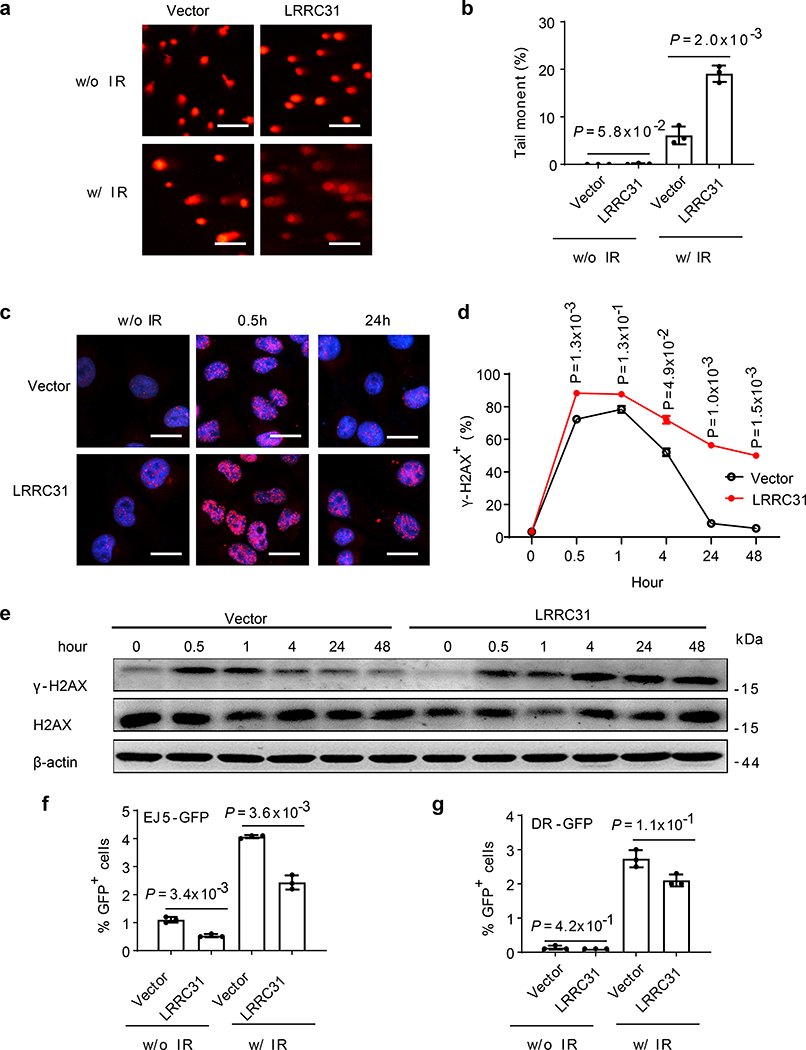
To determine if LRRC31 regulates DNA repair, we characterized irradiation-induced DNA damage in cells with and without LRRC31 overexpression by the DNA neutral comet assay, which detects both single-strand breaks (SSBs), and DSBs at the individual cell level 14. Twenty-four hours after irradiation, the formation of comets under neutral conditions in both LRRC31-overexpressed and control 231BR cells were analyzed. Results in Fig. 2a showed that irradiation induced comet formation in both cells. However, compared to those in control cells, DNA comet tails in LRRC31-overexpressed cells were significantly extended. The average tail moment in LRRC31-overexpressed 231BR cells (19.1±1.7%) was 3.1 times greater than that in control cells (6.1±1.9%) (Fig. 2b), suggesting that overexpression of LRRC31 either enhances radiation-induced DNA damage or inhibits DNA repair.
Fig. 2: LRRC31 impairs DNA DSB repair.
a,b, Representative fluorescence images (a, scale bar: 100 μm) and quantification (b, n=6 biologically independent samples) of tail moments in cells with and without LRRC31 overexpression as determined by a neutral comet assay. c,d, Representative fluorescence images (c, scale bar: 10 μm; Red: γ-H2AX; Blue: DAPI) and quantification (d, n=3 biologically independent samples) of γ-H2AX immunostaining in cells with and without LRRC31 overexpression. e, WB analysis of the expression of γ-H2AX in cells with and without LRRC31 overexpression upon irradiation. Blot is representative of two biologically independent experiments with similar results obtained. Unprocessed immunoblots are shown in Source Data Fig. 2. f,g, Characterization of DSB repair pathways by pEJ5-GFP (f) and DR-GFP (g) (n=3 biologically independent experiments). The percentage of GFP+ cells was analyzed by FACS and fold changes were normalized to cells transfected with control vector. For b, d, f, and g, data show the mean ± s.d.. Statistical analysis was performed using the two-tailed, unpaired Student’s t-test. Statistical calculations source data are included in Source Data 2.
We investigated if LRRC31 specifically regulates DNA DSBs by examining H2AX, which is phosphorylated in response to DNA DSBs to form γ-H2AX foci 15. LRRC31-overexpressed cells, along with control cells, were irradiated. The presence of γ-H2AX was detected by both immunofluorescence imaging and WB. We found that 30 minutes after irradiation, γ-H2AX foci formation was visible in both cells. After that, the level of γ-H2AX gradually decreased and reached the baseline level by 24 hours. In contrast, LRRC31-overexpressed cells contained a significantly greater level of γ-H2AX positive foci and the difference remained significant over 48 hours (Fig. 2c, d), suggesting that the cells were unable to efficiently repair DSBs 16, 17. The enhanced accumulation of γ-H2AX in LRRC31-overexpressed cells was further confirmed by WB (Fig. 2e). These results suggest that LRRC31 inhibits DNA DSB repair.
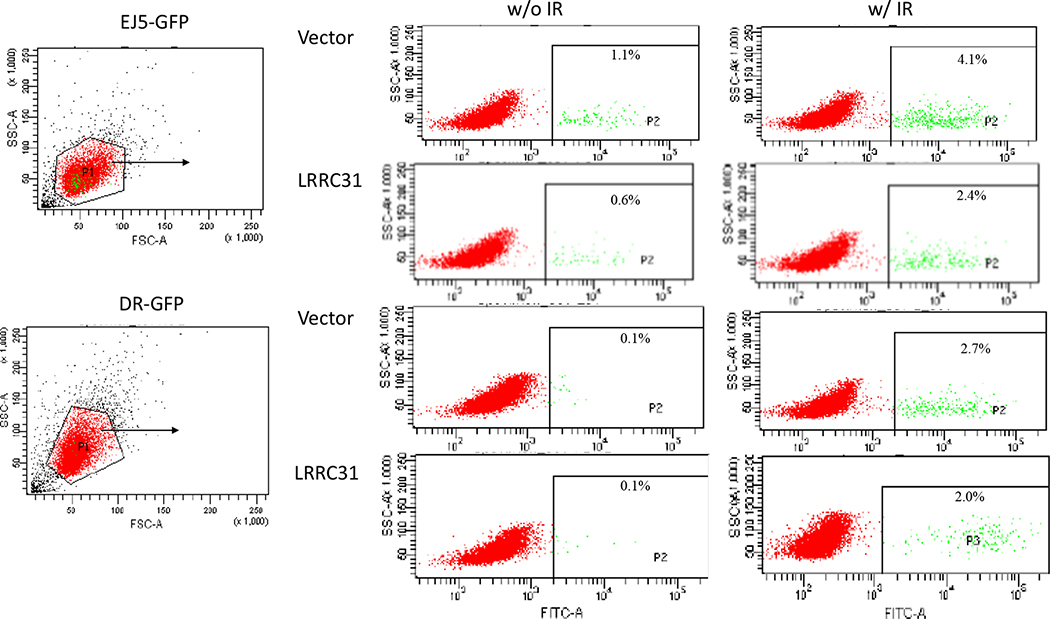
To identify which DNA DSB repair pathway LRRC31 regulates, we employed pEJ5-GFP and DR-GFP, two DSB repair reporters that allow quantifying the activities of NHEJ and HR, respectively 18, 19. Cells with overexpression of pEJ5-GFP or DR-GFP were subjected to irradiation. Flow cytometry analyses found that overexpression of LRRC31 reduced NHEJ- mediated DSB repair by 52% and 40% in conditions without and with irradiation, respectively; by contrast, it has a limited inhibitory effect on the HR pathway (Fig. 2f, g, Extended Data Fig. 3). These results suggest that LRRC31 inhibits DSB repair through inhibition of the NHEJ pathway.
LRRC31 interacts with ATR and Ku70/Ku80 at the protein level and inhibits DNA-PKcs recruitment/activation and disrupts the MSH2-ATR signaling module
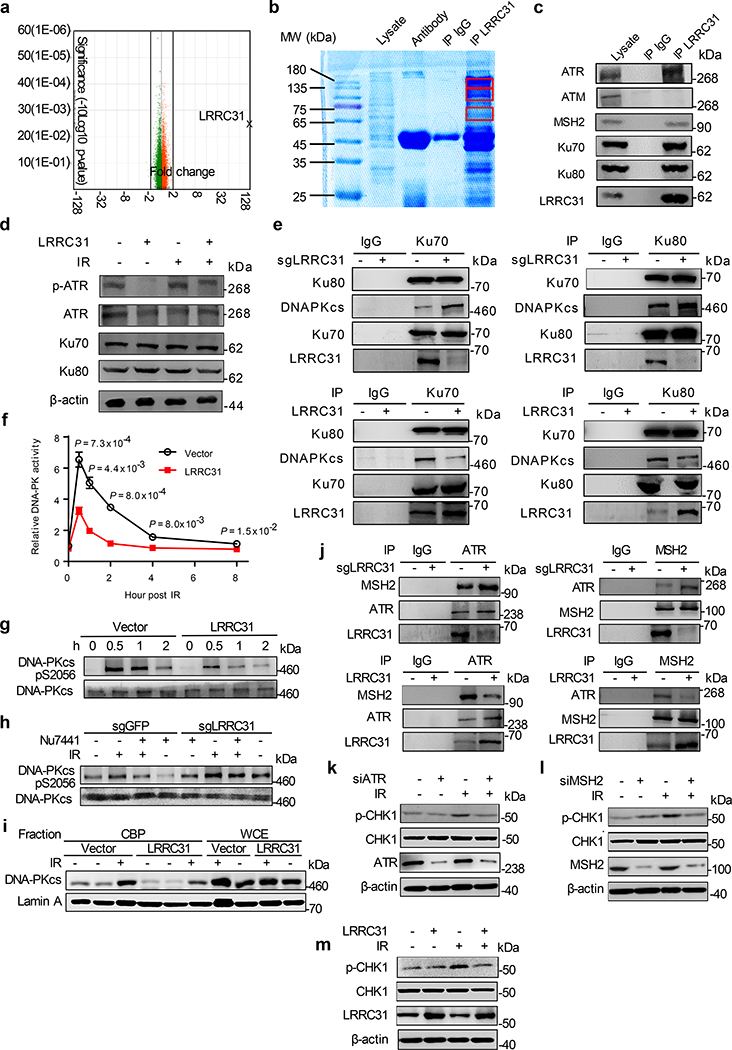
We assessed if LRRC31 regulates cellular responses at the transcriptional level. 231BR cells with and without overexpression of LRRC31 were subjected to whole-transcript expression analysis using Affymetrix HuGene-2.0 arrays. We found that, except LRRC31, whose expression level increased by 215- fold, no other transcripts (48,226 in total) were up- or down- regulated by over 2- fold with statistical significance (Fig. 3a, Supplementary Table 2). This finding suggests that LRRC31 may not function at the transcriptional level. To determine if LRRC31 functions at the protein level, 231BR cells with overexpression of LRRC31 were lysed and immunoprecipitated (IP) with an anti-LRRC31 antibody. Co-IP proteins were separated using SDS-PAGE (Fig. 3b). Three bands with MWs > 40 kDa were recovered and subjected to mass spectroscopy (MS). Bioinformatic and IP-WB analyses of the MS data, which are included in Supplementary Table 3, identified them to be ATR, MSH2, and Ku70/Ku80, respectively. SDS-PAGE electrophoresis did not separate Ku70 and Ku80 in this gel, both of which located within the same band. ATM, which has a MW similar to ATR, does not interact with LRRC31 (Fig. 3c).
Fig. 3: LRRC31 inhibits DNA-PKcs recruitment/activation and disrupts the MSH2-ATR signaling module.
a, Whole-transcript analysis of 231BR cells with and without overexpression of LRRC31. Three biologically independent experiments were performed. Results were expressed as fold changes as a result of LRRC31 overexpression. Raw data are included in Supplementary Table 2. b, SDS-PAGE separation and Coomassie blue staining of proteins co-immunoprecipitated with a LRRC31- specific antibody. Bands indicated in the red boxes were cut and subjected to mass spectrometry analysis. c, WB analyses of proteins co-immunoprecipitated with a LRRC31- specific antibody for expression of the indicated proteins. d, WB analysis of the expression of Ku70, Ku80, ATR, and phosphorylated ATR at Ser428 (p-ATR) in cells with and without LRRC31 overexpression or/and irradiation at 4Gy. e, IP-WB analyses of the Ku70-Ku80-DNA-PKcs complex using an anti-Ku70 or an anti-Ku80 antibody. f, Changes of DNA-PK activity with time in cells with and without LRRC31 overexpression after irradiation at 4 Gy (n=3 biologically independent experiments). Data show the mean ± s.d.. Statistical analyses were performed using the two-tailed, unpaired Student’s t-test. Statistical calculations source data are included in Source Data 3. g, WB analysis of DNA-PKcs phosphorylation in cells with and without LRRC31 overexpression at the indicated time after irradiation at 4 Gy. h, WB analysis of DNA-PKcs phosphorylation in control and LRRC31 knockdown cells with indicated treatment and irradiation at 4 Gy. i, WB analysis of chromatin-recruitment of DNA-PKcs in the indicated cells after irradiation at 4 Gy. Experiments were carried out according the schematic diagram shown in Extended Data Fig 6. CBP, chromatin-banding protein; WCE, whole cell extract. j, IP-WB analyses of the formation of ATR-MSH2 complex in cells in which the expression of LRRC31 was down-regulated or up-regulated. k-m, WB analyses of the expression of CHK1 and phosphorylated CHK1 at Ser345 (p-CHK1) in cells received the indicated treatments and irradiation at 4 Gy. Blots this study are representatives of two biologically independent experiments with similar results obtained. Unprocessed immunoblots are shown in Source Data Fig. 3.
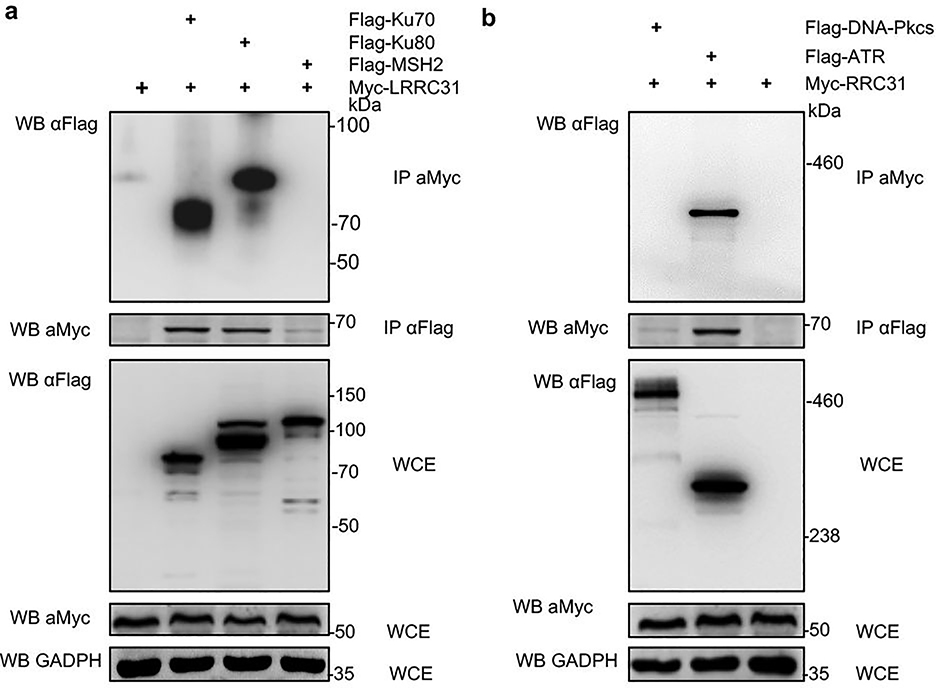
Ku70 is known to interact with Ku80 to form an obligate Ku70/Ku80 heterodimer, which recruits DNA-PKcs and assembles the DNA-PK complex. MSH2 interacts with ATR to form a signaling module in response to DNA methylation damage and mismatch incorporation 20. To determine exactly which proteins LRRC31 interacts with, we co-transfected HEK293 cells with constructs for expression of Myc-tagged LRRC31 and Flag-tagged candidate proteins. Protein complexes were immunoprecipitated with an anti-Myc antibody. The lysates were examined by WB using anti-Flag antibody. Analysis at the specific loading condition found that LRRC31 interacts with Ku70, Ku80, and ATR, but not others (Extended Data Fig. 4). We confirmed that overexpression of LRRC31, although inhibiting ATR phosphorylation, did not alter the expression of Ku70, Ku80, and ATR proteins (Fig. 3d).
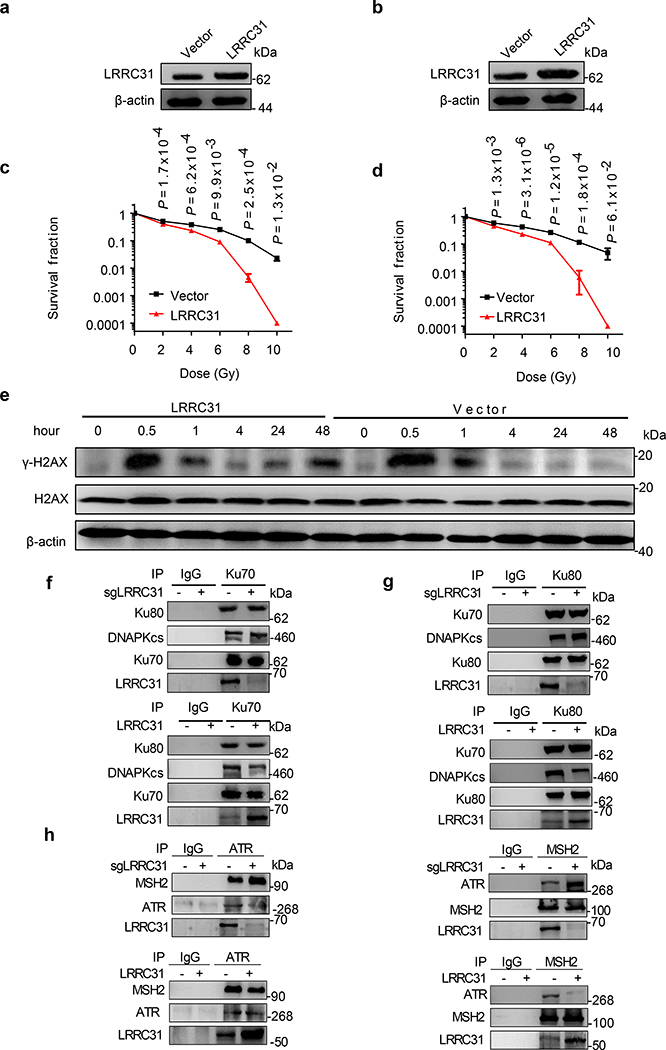
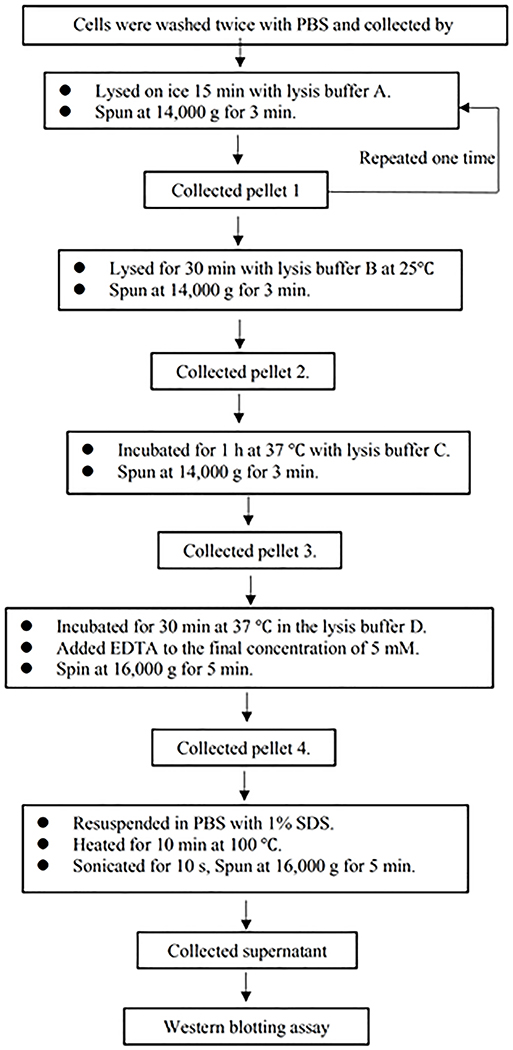
We characterized the biological consequences of LRRC31-Ku70/Ku80 interaction. As the formation of Ku70/Ku80 heterodimers is obligated, instead of studying both proteins, we focused on Ku70. Confocal microscopic analysis showed that, like Ku70, most LRRC31 locates in the nucleus (Extended Data Fig. 5a,b). Following irradiation, the DSB is recognized by Ku70 and Ku80 heterodimers, which recruit and activate DNA-PKcs kinase to initiate DNA repair through the NHEJ pathway 9, 10. We determined if LRRC31 inhibits formation of the Ku70-Ku80-DNA-PKcs complex by IP-WB and found that up- or down- regulation of LRRC31 did not alter the binding of Ku70 and Ku80, but negatively regulated the recruitment of DNA-PKcs (Fig. 3e, Extended Data Fig. 5c,d). Consistently, we found that overexpression of LRRC31 significantly inhibited the activity of DNA-PKcs (Fig. 3f). The regulation of LRRC31 on DNA-PKcs activation was confirmed by WB analysis of DNA-PKcs phosphorylation at Serine 2056 in cells with over-expression of LRRC31 (Fig. 3g). Conversely, down-regulation of LRRC31 expression promoted DNA-PKcs phosphorylation at Serine 2056, which could be inhibited by DNA-PK inhibitor NU7441 (Fig. 3h). We further assessed if LRRC31 inhibits the recruitment of DNA-PKcs through the standard biochemical fractionation assay 21, 22. Half an hour after irradiation, 231BR cells were collected. Whole cell extractive (WCE) and chromatin banding protein (CBP) were prepared according to procedures described in Extended Data Fig. 6, and then subjected to WB analysis. Results in Fig. 3i showed that overexpression of LRRC31 significantly reduced the enrichment of DNA-PKcs at the sites of DSBs. Collectively, these results suggest that LRRC31 inhibits DNA-PKcs recruitment and activation.
Since IP-MS analysis revealed that LRRC31 interacts with both MSH2 and ATR, we speculated that LRRC31 may interfere with the MSH2-ATR signaling module. Confocal analysis found that, like ATR, most LRRC31 is located in the nucleus (Extended Data Fig. 5e, f). IP-WB analyses showed that down-regulation of LRRC31 promoted formation of MSH2-ATR complex while up-regulation of LRRC31 inhibited their formation (Fig. 3j). Analysis of down-stream of the MSH2-ATR signaling found that overexpression of LRRC31 suppressed the phosphorylation of CHK1 upon irradiation in efficiency comparable to that achieved through inhibition of ATR or MSH2 (Fig. 3k–m). Taken together, these results suggest that LRRC31 competes with MSH2, disrupts the formation of MSH2-ATR complex, and functionally inhibits the down-stream signaling.
LRR domains mediates the interaction between LRRC31 with Ku70/Ku80 and ATR
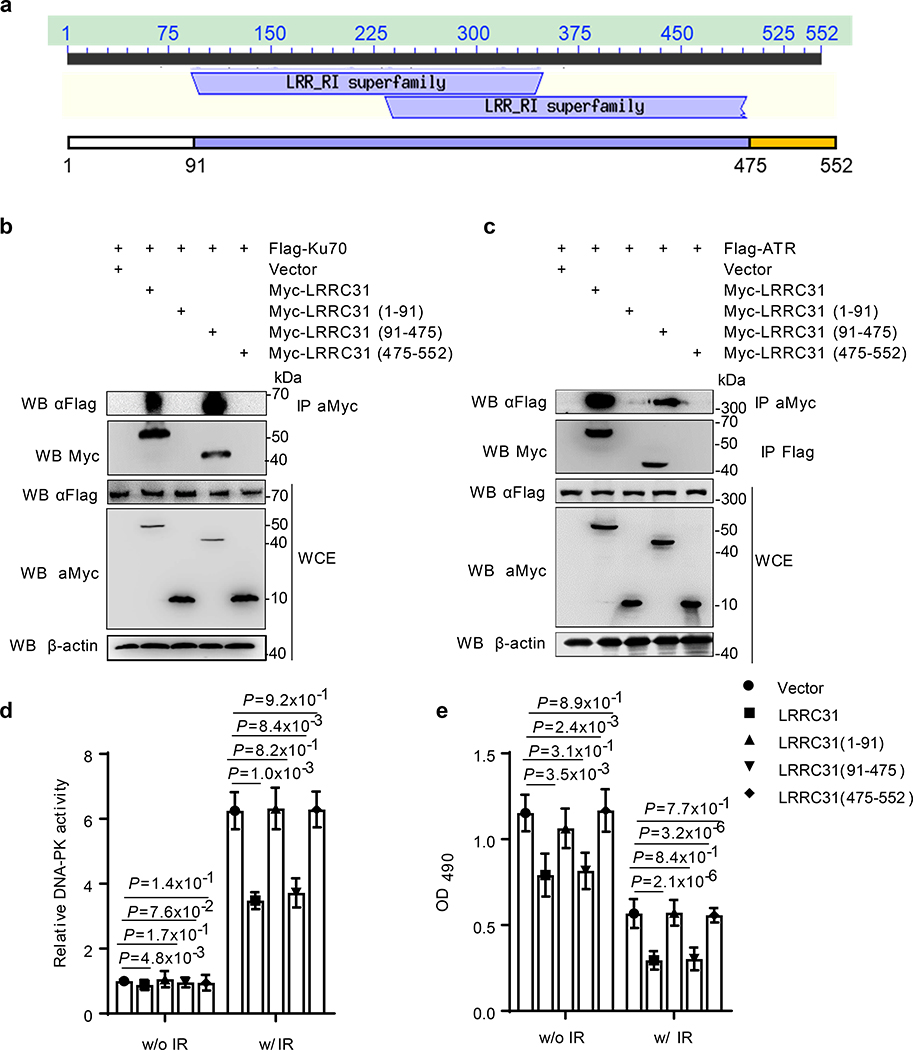
We explore the motifs within LRRC31 that mediate the interaction between LRRC31 and Ku70/Ku80 and ATR. Analysis by NCBI Conserved Domains shows that LRRC31 includes two LRR superfamily domains located between amino acid (aa) 91–475 (Fig. 4a). LRRs are protein structural motifs known to form α/β horseshoe folds 23, 24, and are frequently involved in the formation of protein–protein interactions 25, 26. Analysis by the I-TASSER (Iterative Threading Assembly Refinement) confirms that LRRC31 bears a horseshoe-shaped tertiary structure with a hydrophobic substrate-binding pocket suitable for protein-protein interaction 27. To characterize the domains within LRRC31 responsible for the LRRC31/Ku70/Ku80/ATR interaction, we generated various constructs for expression of myc-tagged putative functional domains, including aa1–91, aa91–475, and aa475–552. Again, as the formation Ku70/Ku80 heterodimers is obligated, we only analyzed the interaction with Ku70. These constructs were co-transfected into HEK293 cells with Flag-tagged Ku70 or ATR constructs. IP-WB analyses showed that the LRR superfamily domains, but not others, mediates the binding of LRRC31 with Ku70 and ATR (Fig. 4b,c). Consistently, we found that the LRR superfamily domains alone are sufficient to inhibit DNA-PKcs activation (Fig. 4d) and cell proliferation (Fig. 4e).
Fig. 4: Characterization of LRRC31 function motifs.
a, Analysis of the architecture of LRRC31. b,c, Co-IP analyses of the LRR superfamily domains (91–475) responsible for the interaction of LRRC31 with Ku70 (b) and ATR (c). Two biologically independent experiments were performed with similar results obtained. Unprocessed immunoblots are shown in Source Data Fig. 4. d,e, Characterization of the indicated domains within LRRC31 on DNA-PKcs activation (d) and cell proliferation (e) with the indicated treatments and irradiation at 4 Gy. Data show the mean ± s.d. (n=3 biologically independent experiments). Statistical analysis was performed using the two-tailed, unpaired Student’s t-test. Statistical calculations source data are included in Source Data 4.c.
Validation in additional cells
We characterized LRRC31 in two additional breast cancer cell lines, including MCF7 and 4T1-BR5, another BCBM line. We found that overexpression of LRRC31, which was confirmed by WB (Fig. 5a,b), sensitized both cells to irradiation in an efficiency comparable to that observed in 231BR cells (Fig. 5c,d). The biological effects of LRRC31 were further characterized using MCF7 cells. We found that overexpression of LRRC31 sensitized MCF7 cells to radiation, evident by the significantly increased accumulation of γ-H2AX (Fig. 5e). We found that LRRC31 does not alter the binding of Ku70 and Ku80 but dislocates DNA-PKcs from Ku70/K80 heterodimers (Fig. 5f, g, Extended Data Fig. 5g,h), and LRRC31 disrupts the formation of the ATR-MSH complex (Fig. 5h). All the findings are consistent with those identified in 231Br cells, suggesting that the radiosensitizing effect and molecular regulation of LRRC31 identified in 231BR cells are not unique to the selected cancer cells.
Fig. 5: Validation in additional cells.
a,b, WB analysis of the expression of LRRC31 and β-actin in MCF7 (a) and 4T1-BR5 (c) transduced with control vector or lentiviral vector for LRRC31 overexpression. c,d, Clonogenic analysis of the engineered MCF7 (c) and 4T1-BR5 (d) cells 7 days after irradiation. Data show as the mean ± s.d. (n=3 biologically independent experiments). Statistical analysis was performed using the two-tailed, unpaired Student’s t-test. Statistical calculations source data are included in Source Data 5. e, WB analysis of the expression of γ-H2AX in MCF7 cells with and without LRRC31 overexpression upon irradiation at 4 Gy. f,g, IP-WB analyses of the Ku70-Ku80-DNA-PKcs complex in MCF7 cells with down- (upper panel) and up-regulation (bottom panel) of LRRC31 using an anti-Ku70 (f) or an anti-Ku80 antibody (g). h, IP-WB analyses of the formation of ATR-MSH2 complex in MCF7 cells in which the expression of LRRC31 was down- or up-regulated. For all the studies other than c and d, two biologically independent experiments were performed with similar results obtained. Unprocessed immunoblots are shown in Source Data Fig. 5.
Targeted delivery of LRRC31 gene sensitizes BCBMs to radiation therapy
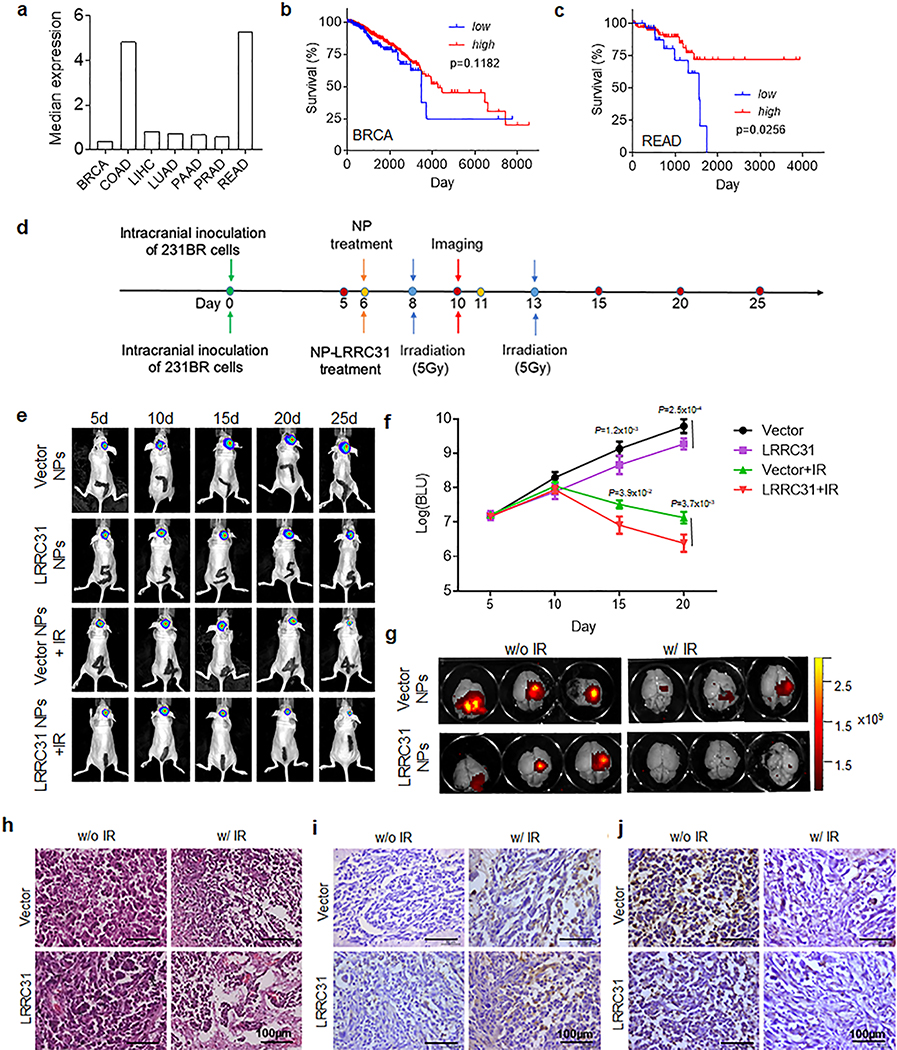
We analyzed the expression of LRRC31 in tumors in the TCGA database using Gene Expression Profiling Interactive Analysis (GEPIA) 28. Although that the expression of LRRC31 in human BCBMs is not available, our analysis showed that LRRC31 is expressed in most tumors (Extended Data Fig. 7a). We examined the correlation of patient survival with LRRC31 expression in prostate adenocarcinoma (PRAD), which has the highest LRRC31 expression level, and breast invasive carcinoma (BRCA), using OncoLnc 29, and found that, in both cohorts, patients with a high level of LRRC31 expression survive longer than those with a low level of expression (Extended Data Fig. 7b,c). The lack of a significant difference in the BRCA cohort may be attributed to the sample size, which may not be large enough to reach statistical significance. These results suggest LRRC31 as a promising therapeutic target for BCBM treatment.
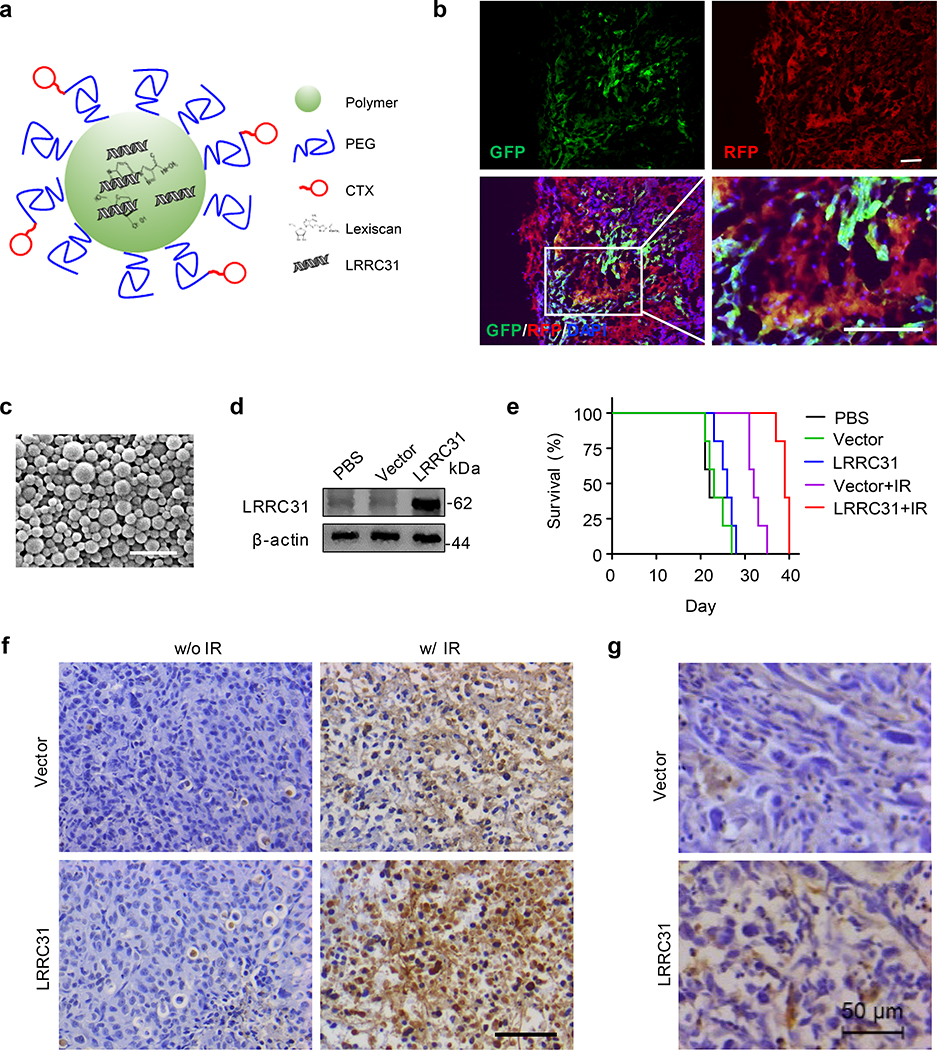
We evaluated if LRRC31 can be targeted to sensitize BCBMs to radiation therapy through delivery of LRRC31 cDNA. Targeted delivery of LRRC31 cDNA to BCBMs was achieved via autocatalytic brain tumor-targeted nanoparticles (ABTT NPs), which we recently developed for systemic delivery of gene therapy to intracranial tumors, including BCBMs 30, 31. NPs were synthesized using 60%-HDL-DES-MDEA, a polymer that was optimized for gene delivery 32. ABTT was achieved through surface conjugation of chlorotoxin (CTX), a brain tumor-targeting peptide 33, and internal encapsulation of lexiscan, a small molecule that can transiently open the blood-brain barrier (BBB) (Fig. 6a) 34, 35. We confirmed that intravenous administration of ABTT NPs loaded with plasmid DNA for expression of red fluorescence protein (RFP) transfected 231BR tumors in the brain (Fig. 6b). For characterization of LRRC31, ABTT NPs were synthesized with encapsulation of LRRC31 plasmid DNA, termed LRRC31 NPs, which are spherical in morphology and in diameter of ~150 nm (Fig. 6c). WB analysis showed that treatment with LRRC31 NPs elevated the expression of LRRC31 in 231BR cells (Fig. 6d). We tested LRRC31 NPs in BCBM-bearing mice established using 231BR cells that were engineered to express both luciferase and GFP (Extended Data Fig. 7d). We found that systemic administration of LRRC31 NPs significantly improved the therapeutic benefit of radiation therapy and the combination of LRRC31 NPs and irradiation inhibited tumor development in an efficiency significantly greater than all other treatments (Fig. 6e, Extended Data Fig. 7e–g). Consistently, histological analysis by TUNEL (Fig. 6f), H&E (Extended Data Fig. 7h), and Caspase-3 staining (Extended Data Fig. 7i) identified a marked increase in the number of apoptotic cells in tumors treatment with LRRC31-loaded NPs. Histological analysis by Ki67 staining showed that treatment with LRRC31-loaded NPs effectively decreased tumor cells proliferation (Extended Data Fig. 7j). We further characterized the expression of LRRC31 in tumors isolated from mice receive treatment of LRRC31- loaded NPs, and found that, compared to that in control mice, the expression of LRRC31 was significantly elevated (Fig. 6g). However, the immunostaining also showed that treatment of LRRC31 NPs only transfected 41% of tumor cells, suggesting that the therapeutic potential of LRRC31 treatment is underestimated in this study.
Fig. 6: Delivery of LRRC31 gene sensitizes BCBMs to radiation therapy.
a, Schematics of ABTT NPs. b, Representative images of 231BR tumors in the brain after treatment with RFP-loaded ABTT NPs. 231BR tumors expressed GFP. Scale bar: 100 μm. c, Morphology of LRRC31 NPs as captured by scanning electron microscope. Scale bar: 500 nm. d, WB analysis of the expression of LRRC31 in 231BR cells 24 hour after receiving the indicated treatments. e, Kaplan-Meier survival curves of tumor-bearing mice received the indicated treatments (n=5 animals). f, Representative images of TUNEL staining of tumors isolated from mice received the indicated treatment. Scale bar: 100 μm. g, Representative images of immunostaining of LRRC31 in the brains isolated from mice treated with control NPs or LRRC31 NPs. Scale bar: 50 μm. For all the studies other than e, two biologically independent experiments were performed with similar results obtained. Unprocessed immunoblots are shown in Source Data Fig. 6.
Discussion
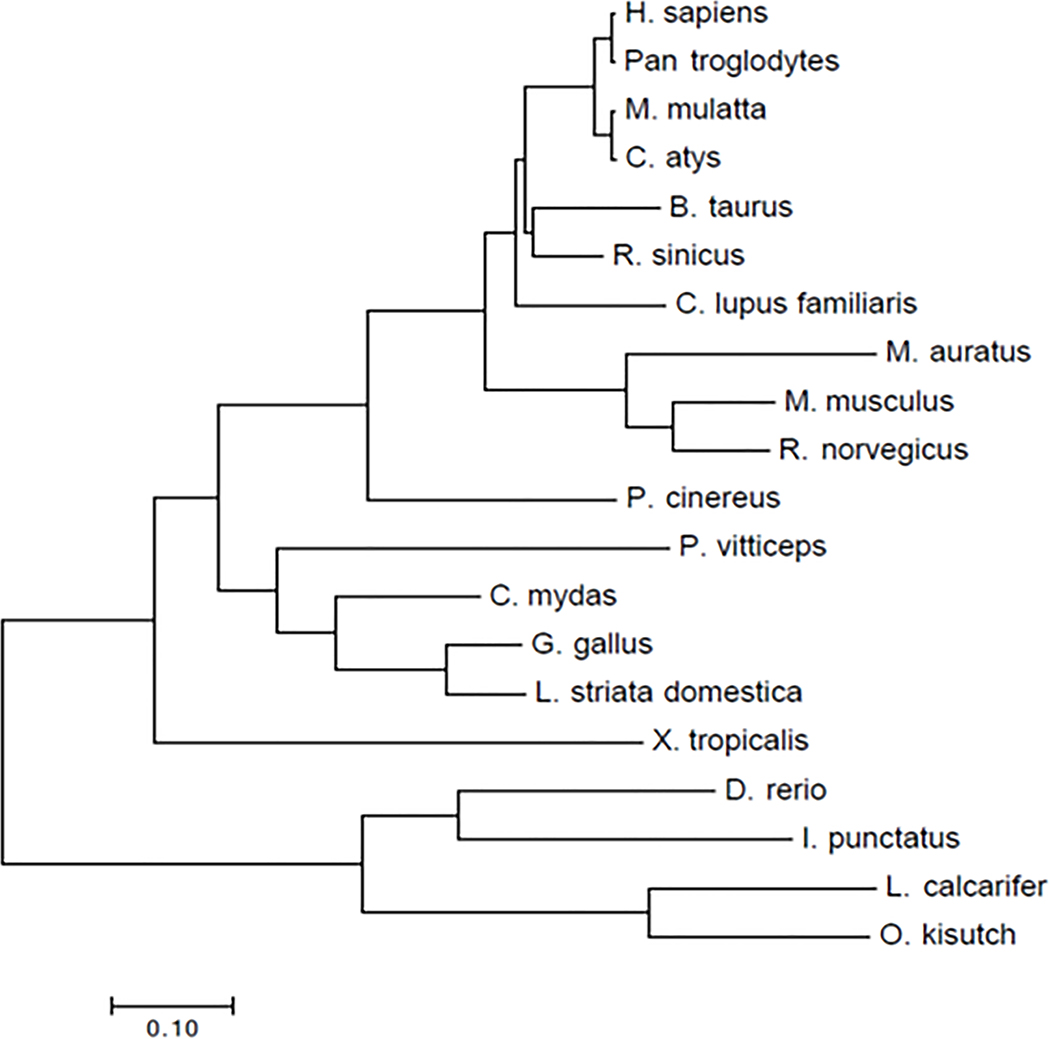
Improved treatment of BCBMs requires development of approaches to sensitize BCBMs to radiation therapy. Through a genome-wide CRISPR screen, we identified LRRC31 as a promising radiosensitizing gene. We showed that targeted delivery of the LRRC31 gene therapy effectively sensitized BCBMs to irradiation, leading to a significantly enhanced survival benefit. As a radiosensitizing gene, LRRC31 is unique in three ways. First, distinct from most traditional radiosensitizing genes that fulfil the ‘law of Bergonié and Tribondeau’ and promote cellular proliferation 36, LRRC31 functions as a tumor suppressor. Second, LRRC31 has a high degree of selectivity in inhibiting DNA repair through interaction with Ku70/Ku80 and ATR, key players in the DNA repair pathway. In contrast, most known radiosensitizing genes, such as cell cycle checkpoint regulatory gene checkpoint kinase 1 37, and oncogenic gene RAS 38, regulate cellular signaling other than DNA repair. Third, unlike most known DNA repair regulators that augment cellular DNA repair ability, LRRC31 functions as a suppressor of DNA repair. We confirmed that the biological functions identified in 231BR cells are not unique to the selected cells or a bias resulting from using cells with stable overexpression of LRRC31, as similar observations were also found in additional cells (Fig. 5), as well as in 231BR cells engineered with a doxycycline (DOX)-inducible construct for LRRC31 overexpression (Extended Data Fig. 8). LRRC31 is highly conserved among different vertebrate species (Extended Data Fig. 9). The role of LRRC31 as a DNA repair suppressor in the evolution of eukaryotic cells is yet to be defined.
LRRC31 was recently reported to regulate the pathogenesis of eosinophilic esophagitis 27. In that study, the authors performed an RNA-sequencing transcriptome analysis and identified 38 genes with an expression level change over 1.5-fold when LRRC31 was overexpressed. This finding is consistent with our cDNA array results, in which we identified 36 genes with an expression level change by over 1.5-fold (Supplementary Table 2). These results suggest that LRRC31 may not function through transcriptional regulation. Instead, we found that LRRC31 interacts with Ku70/Ku80 and ATR though its LRR superfamily domains at the protein level (Fig. 4).
Taken together, we identified LRRC31 as a major DNA repair suppressor that functions through interaction with Ku70/Ku80 and ATR at the protein level. Bearing inhibitory effects on both DNA repair and tumor progression, LRRC31 represents a promising gene that can be targeted to sensitize BCBMs to radiation therapy.
Methods
Cell culture and materials
HEK293, and MCF-7 cells were obtained from the ATCC. 231-Br and 4T1-BR5 cells were kindly provided by Prof. Patricia S. Steeg at the NCI. All cells were grown in Dulbecco’s modified Eagle’s medium (ThermoFisher) with 10% fetal bovine serum (ThermoFisher), 1% penicillin and streptomycin, and were maintained at 37°C and 5% CO2. Details about the antibodies used in this study were described in Supplementary Table 4. The anti-LRRC31 antibody was validated in 231BR cells and 231BR cells with up- or down- regulation of LRRC31 expression (Extended Data Fig. 10).
Selection of irradiation doses
For the initial screen, radiation at 10 Gy, a lethal dose that killed most wild type 231BR cells, was used, as this dose allowed us to collect a small fraction of cells transduced with the CRISPR library that survive the irradiation. For characterization of cellular radiosensitivity to irradiation, doses ranging from 2 to10 Gy were used. For the radiosensitivity study, we found that 6 Gy allowed for significant radiosensitizing effect without killing most cells and, therefore, chose for most studies, except for those involved with Western Blot analysis and DSB repair reporter assay, for which 4 Gy was used to allow collecting a sufficient amount of cells for the analysis. The doses for animal work, which are 10 Gy for tumors on the flank, and 5 Gy x 2 (10 Gy in total) for tumors in the brain, were selected based on a previous report for therapeutic evaluation in a similar animal model 39.
231BR-GeCKO library generation and genome-wide screen
Plasmids lentiCas9-blast (Catalog #: 52962, Addgene) and Human CRISPR Knockout Pooled Library (GeCKO v2) (Catalog #: 1000000049, Addgene) were gifts from Feng Zhang 13. 231BR-GeCKO library was generated using the two-vector system (lentiGuide-Puro and lentiCas9-blast) for sgRNA and Cas9 delivery as previously described 14. Details about plasmids used in this study were described in Supplementary Table 4. In brief, Cas9–231BR cells were obtained via lentivirus transduction of the Cas9 transgene and followed by blastcidine selection. Then clonal Cas9–231BR cells were transduced with lentivirus particles containing the human sgRNA library (Human GeCKO v2 Library A) with no greater than 1 sgRNA per cell. The Cas9/sgRNA-231BR cells were selected with 2ug/ml puromycin and 5ug/ml blastcidine for 2 weeks to achieve >95% gene knockdown. These Cas9/sgRNA-231BR cells were then irradiated at 10 Gy, and the surviving resistant population was expanded and subjected to deep sequencing analysis for candidate genes of radiosensitive. Schematic of the CRISPR screen is showed in Extended Data Fig. 1a.
Down- or up- regulation of the expression of candidate genes in breast cancer cells
Down-regulation of targeted genes was achieved using sgRNAs or siRNAs. Sequences of sgRNAs or siRNAs are listed in Supplementary Table 5. sgRNAs against LRRC31 were synthesized at the Yale Keck facility, cloned into the lentiGuide-Puro vector, and delivered to Cas9- expressing cells through lentiviral transduction according to previously published procedures 13. siRNAs were synthesized by Genepharma and delivered to cells through transfection using the Polyplus-transfection kit (Jetprime). Up-regulation of targeted genes was achieved through lentiviral transduction. For overexpression of miR-1287 or miR-4796, pre-miR-1287 or pre-miR-4796 coding region was cloned into GV217 lentiviral vector (Genechem). cDNA for KATNA1 (Catalog #: MHS6278–202802607) and LRRC31 (Catalog #: MHS6278–213244531) were purchased from GE Dharmacon. cDNA of MYBL2 (Catalog #: HG14536-G) was purchased from Sino Biological. For subcloning, cDNAs were amplify by PCR and cloned into pCDH-CMV-MCS-T2A-Puro lentiviral vector (System Biosciences). Lentiviral particles production and cell transduction were carried out according to our previous reports 40. Expression of miR4796 and miR1287 was confirmed by qRT-PCR. Expression of MYBL2, LRRC31and KATNA1 were confirmed by Western Blot.
In vitro radiosensitization assay
For a typical study, cells were plated in 6- well plates or T25 cell culture bottle. One day later, cells were irradiated (0 −10 Gy) using a ELEKTA Irradiator (ELEKTA, UK) at 4MV potentials. Focal source-surface distance (SSD) is 100 cm. Cell proliferation was determined at 12, 24,48, 72 and 96 h after irradiation using the standard MTT assay. Colony formation assay was performed at 7 days after irradiation 41.
Gene expression profile assay
Expression profiling of cells with and without overexpression of the selected gene was carried out using the Illumina HumanHT-12 v4 Expression BeadChip platform in triplicates in the Yale Center for Genome Analysis. Differentially-expressed genes (i.e., those with expression differences ≥ |2|-fold and with a significance threshold of FDR-adjusted P < 0.05) were identified according to our previous report 4.
qRT-PCR
Total RNA was extracted from cells using the TRIzol reagent (ThermoFisher, USA) according to the manufacturer’s protocol, and quantified with a NanoDrop spectrophotometer (ThermoFisher, USA). PrimeScript RT Reagent Kit and SYBR Premix Ex Taq II Kit (Takara, Japan) were used for the detection mRNA expression. β-Actin and U6 were used as control for mRNA and miRNA, respectively. The primers are listed in Supplementary Table 5. qRT-PCR was performed using an IQ5 Multicolor qRT-PCR Detection System (Bio-Rad, USA).
Western Blot
Total protein was extracted from cells or tissue using RIPA buffer (Cell Signaling, USA) containing proteinase inhibitors cocktail tablets (Roche,Catalog # 04693116001) and nuclear protein was isolated using MinuteTM Cytoplasmic and Nuclear Extraction Kit (ThermoFisher, USA). For a typical WB analysis, 10–20 μg of protein lysates were separated using 6–12% SDS-PAGE, and transferred to PVDF membranes (EMD Millipore, USA). The membranes were incubated with the selected primary antibodies and then secondary antibodies. Signals were detected by an ECL kit (Pierce, USA) according to the manufacturer’s instructions.
Neutral comet assay
DNA DSBs were evaluated using a neutral single-cell gel electrophoresis assay (comet assay) kit (Trevigen, USA) according to the manufacturer’s instructions. After electrophoresis, the slides were air dried at room temperature. Individual cells were stained with GelRed™ Nucleic Acid Gel Stain solution (Biotium, USA), and viewed using a fluorescence microscope. Quantification was achieved by analyzing at least 6 randomly selected comets per slide with the Comet software (NIH).
Co-immunoprecipitation assay
Cells were lysed in RIPA lysis buffer (0.75ml for 107cells) with cocktail protease inhibitors (Roche), and centrifuged at 14,000 g 4°C for 15min. The supernatant was transferred to new tubes. Cell lysate (1 mg) was aliquoted and incubated with a selected antibody (5 μg) at 4°C overnight. The following day, 20 μl Dynabeads™ Protein G (ThermoFisher, USA) were prepared and added to the lysate, which was further incubated at 4°C. After 4 h, the lysate was centrifuged at 14,000g at 4°C for 5 min. The supernatant was discarded. Protein G-beads were collected. Co-immunoprecipitation complex was eluted using 40μl elution buffer, and subjected to SDS-PAGE, WB, or MS analysis (I-omics).
DNA-dependent protein kinase activity assay
DNA-PK activity was determined using a DNA-PK kinase assay system (Catalog# V4106, Promega) according to the manufacturer’s instructions, with minor modifications. The system includes a recombinant DNA-PK kinase enzyme, a peptide substrate (EPPLSQEAFADLWKK) appropriate for the enzyme, a reaction buffer and a ADP-Glo™ Kinase Assay kit (Promega). It is a luminescence-based kinase assay that measures ADP formation from a DNA-PK kinase reaction. The luminescent signal is positively correlated with the ADP amount and thus the DNA-PK kinase activity. Briefly, for quantification of DNA-PK kinase activity, DNA‐PK enzyme was prepared in a mixed solution including 750 μM ATP 1μl, 1mg/ml peptide substrate 1μl, 5% DMSO 1μl, and 0–1000U DNA-PK kinase 2μl. The mixture was incubated at - 25°C for 60 minutes. Then, 5 μl of ADP‐Glo™ reagent was added, and the mixture was incubated at room temperature for 40 minutes to deplete excessive ATP. Then, 10 μl of kinase detection reagent was added, and the mixture was incubated at room temperature for 30 minutes. Luminescence signal was determined using a FLUOstar Omega reader (BMG Labtech). For detection of DNA-PK activity in 231BR cells with overexpression LRRC31, nuclear protein was isolated using Minute™ Cytoplasmic and Nuclear Extraction Kit (Invent Biotechnologies, USA). Reactions were initiated by adding 6 μl preincubated mixture without DNA-PK kinase to 4μl nuclear protein extractive. The DNA-PK enzymatic activity was determined as described above.
NHEJ and HR reporter assays
NHEJ and HR reporter assays were performed according to previously published methods 18, 19. Briefly, NHEJ reporter plasmid pEJ5-GFP or HR reporter plasmid DR-GFP was transfected into HEK293 cells. Stable expression clones were selected using 1 μg/ml puromycin. To induce DSB, pCBASce plasmid was co-transfected with either LRRC31-pcDNA3.1 plasmid or control vector pcDNA3.1 into pEJ5-GFP- or DR-GFP- expressing HEK293 cells. After 24 h, cells were treated with or without irradiation at 4 Gy. After an additional 24 h, GFP positive cells were quantified by flow cytometry.
Characterization of the binding of LRRC31 with candidate proteins
HEK293 cells were co-transfected with Myc -tagged LRRC31 or various truncations and Flag-tagged Ku70, or Ku80, or ATR, or MSH2, or DNA-PKcs. Cell were lysed in NETN buffer (100Mm Nacl, 1mM EDTA, 20Mm Tris-HCl (pH 7.0), 0.5% Nonidet P-40). Protein complexes were immunoprecipitated with anti-Myc (or anti-Flag) antibody coupled to magnetic beads and examined by WB with anti- Flag (or anti- Myc) for the presence of tagged proteins.
DOX-inducible LRRC31 overexpression
LRRC31cDNA subcloned into lentivirial Tet-one inducible expression vector pCW57.1 (Clontech Laboratories). Lentiviral particles production and cell transduction and antibiotic selection were carried out according to our previous reports 40. LRRC31 overexpression was induced by treating cells with doxycycline (DOX) at 100 ng/ml and subjected to analysis for LRRC31 expression, radiosensitivity, cell proliferation and DNA-PK activity.
Analysis of chromatin-recruitment of DNA-PKcs by biochemical fractionation and Immunoblotting
The analysis was performed according to procedures described in previous reports 21, 22. Fractionation procedures are schematically shown in Extended Data Fig.6. Briefly, 231BR cells with and without treatment of irradiation were washed twice with ice-cold phosphate-buffered saline (PBS. pH 6.8), collected by scraping, and centrifuged. Cell fractionation was carried out by two consecutive extractions in 200 μl of buffer A (50 mM HEPES-NaOH (pH 7.5), 150 mM NaCl, 1 mM EDTA, 0.1% Triton X-100, 10 mM NaF, 10 mM β-glycerophosphate, protease inhibitor mixture tablets (Complete MiniTM, Roche Diagnostics), phosphatase inhibitors cocktail (Sigma), 0.2% Nonidet P-40). Following centrifugation at 14,000g for 3 min, the supernatant was collected, and the pellet (pellet 1) was further extracted for 30 min on ice with 200 μl of fresh extraction buffer B (buffer A without Triton X-100, supplemented with 200 μg/ml RNase A). Following another centrifugation at 14,000 g for 3 min, the pellet (pellet 2) was collected and incubated in buffer C (20 mM Tris-HCl (pH 8), 100 units of calf intestine phosphatase, 2 mM magnesium chloride, and protease inhibitors) for 1 h at 37 °C. The solution was then spun at 14,000 g for 3 min. The pellet (pellet 3) was collected and resuspended in extraction buffer D (5 mM manganese chloride and 300 μg/ml DNase I) and incubated for 30 min at 37 °C. The reaction was terminated by the addition of EDTA to the final concentration of 5 mM. The solution was spun at 16,000 g for 5 min. The pellet (pellet 4) was resuspended in PBS buffer supplemented with 1% SDS, heated for 10 min at 100 °C, and sonicated for 10 s (Vibracel, Bioblock Scientific). Whole cell extracts of treated or mock-treated cells were obtained by direct lysis in PBS buffer supplemented with 1% SDS. The collected fractions were then subjected to Western blot analysis according to the standard procedures.
Flow cytometric cell cycle and apoptosis analysis
Cells were seeded at a density of 4×10⁵. At the second day, the cells were irradiated at 6 Gy. After incubation for 24 hours, the cells were collected, treated with RNase (Sigma, St. Louis, MO, USA) and propidium iodide (Sigma) and fixed with 70% ethanol. The percentages of cells in G1-, S-, and G2/M-phase were determined using FACS flow cytometry (BD Biosciences). Apoptosis of cells was assessed using a PE-Annexin V apoptosis detection kit (BD Biosciences) according to the manufacturer’s instructions.
In vivo tumor models
The study is compliant with all relevant ethical regulations regarding animal research. Animal studies were performed according to the protocols approved by the Animal Use Committee at Xi’an Jiaotong University. Female nude mice (BALB/c nu/nu, 6 weeks old) were purchased from Vitalrive, China, and maintained in a pathogen-free facility. Tumor xenografts were established by subcutaneous inoculation or intracranial injection of 231BR cells with overexpression of a selected gene, or vector control according to our recent reported procedures 30.
Validation of the candidate genes as molecular targets for radiosensitization therapy
Tumor bearing mice went through subcutaneous inoculation of 1×10⁶ 231BR cells with overexpression of a selected gene, or vector control. For evaluation in the flank tumor model, when tumor volumes reached 50~60 mm3, mice were randomly assigned into two groups. One group received local irradiation at 10 Gy using an ELEKTA Irradiator (Precision X-Ray, UK). The other group was used as a control. Mice were monitored for tumor sizes and body weight. For evaluation in the intracranial tumor model, tumor inoculation and treatment schedules are illustrated in Extended Data Fig. 1c. On days 7 and 17 after tumor inoculation, mice were irradiated at a dose of 5 Gy. The mice were monitored for survival daily, imaged at day 5, 10, 15, 20, and 25, and euthanized when neurological symptoms appeared.
NP synthesis and evaluation
ABTT NPs loaded with DsRed plasmid or LRRC31 plasmid were synthesized according to the procedures previous reports 30. The morphology and size of NPs were determined by SEM. For evaluation of NPs in vivo, mice bearing GFP/Luc- labeled 231BR cells in brain were established by intracranial injection as described above. Tumor inoculation and treatment schedules are illustrated in Extended Data Fig. 7d). The mice received intravenous administration with DNA-loaded ABTT NPs at a dose of 1 mg on days 6 and 11 after tumor inoculation. Two days after the treatment, mice of radiation groups received 5 Gy local brain IR. Tumor growth was monitored by in vivo bioluminescence imaging using the system of IVIS Spectrum. Mouse survival and body weight were recorded. When the mice died, the brain, liver, lungs, spleen, and kidney were collected, fixed and sliced.
Immunohistochemistry
Sections of cells or tissue were stained using corresponding primary antibodies. After extensively washing, they were incubated with the Fluor or HRP labeled secondary antibodies, and then colorized with the avidin-biotin peroxidase complex (ABC) method following the manufacturer’s protocol. Images were acquired using an optical microscope or a laser scanning confocal microscope FV1000 (Olympus, Japan) and Leica TCS SP8 (Leica, German).
Statistics and reproducibility
For in vitro experiments, at least three biologically independent experiments were performed unless stated otherwise. Data are presented as the means ± standard deviations (SDs). Differences in different groups were compared using the unpaired, two-tailed Student’s t-test. One-way ANOVA analysis was performed to determine the statistical significance of treatment related changes in survival. Statistical analyses were performed using Prism 8 (GraphPad) and Excel (Microsoft). A P value less than 0.05 were considered statistically significant.
Data availability
The cDNA array data that support the findings of this study have been deposited in the Gene Expression Omnibus under accession code GSE117453. The data for human rectum adenocarcinoma and breast invasive carcinoma were derived from the TCGA Research Network: http://cancergenome.nih.gov. The data-set derived from this resource that supports the findings of this study is available in Source Data Extended Data Fig. 7. All other data supporting the findings of this study are available from the corresponding authors upon reasonable request.
Extended Data
Extended Data Fig. 1. Characterize of lead candidate genes in vitro and in vivo.
a, Schematic of the CRISPR screen. b, Characterization of the proliferation of control or LRRC31-knockout 231BR cells with and without irradiation (6 Gy). c, Schematic diagram of characterization of LRRC31 in mice bearing intracranial 231BR tumors. Cells were engineered to express both luciferase and GFP. d, Changes of tumor volume versus time in mice received subcutaneous inoculation of control or LRRC31-knockout 231BR cells and treated with irradiation (10 Gy). e,f, qRT-PCR analysis of the expression of miR-4796 and miR-1287 in 231Br cells transduced with lentiviral vectors for expression of the candidate miRNAs or control vector. g,h, WB analysis of the expression of KATNA and MYBL2 in 231Br cells transduced with control vector or vectors for overexpression of the indicated gene. Blot is representative of two biologically independent experiments, with similar results obtained. Unprocessed immunoblots are shown in Source Data Extended Data Fig. 1. i-l, Clonogenic analysis of 231Br cells engineered for overexpression of miR4796 (i), miR1287 (j), KATNA1 (g) and MYBL2 (h) 7 days after irradiation. m, Characterization of the proliferation of control or LRRC31-overexpressed 231BR cells with and without irradiation (6 Gy). n, Changes of tumor volume versus time in mice received subcutaneous inoculation of control or LRRC31-overexpressed 231BR cells and treated with irradiation (10 Gy). For b, e, f, i-l, and m, data show the mean ± s.d. (n=3 biologically independent experiments). For d and n, data show the mean ± s.d. (n=3 animals). Statistical analysis was performed using the two-tailed, unpaired Student’s t-test.
Extended Data Fig. 2. Characterize of LRRC31 for its effects on tumor development in vivo, and on cell cycle, proliferation, and apoptosis in vitro.
Characterize of LRRC31 for its effects on tumor development in vivo, and on cell cycle, proliferation, and apoptosis in vitro. a, b, Representative images of tumors in the brain imaged by IVIS (a) and semi-quantification of the bioluminescence signal (b) in mice received intracranial inoculation of the indicated engineered cells with and without irradiation treatment (5Gyⅹ2). Data show the mean ± s.d. (n=5 animals). c, Ex vivo imaging the brains isolated from mice received the indicated treatment. d-g, Characterization of the effects of LRRC31 overexpression on cell cycle determined by flow cytometry (d), proliferation determined based on Brdu staining (e), apoptosis determined based Annexin V staining (f), and Caspase-3 cleavage determined based on WB analysis (g) in the indicated cells with and without irradiation at 6 Gy. For d-f, data show the mean ± s.d. (n=3 biologically independent experiments). Statistical analysis was performed using the two-tailed, unpaired Student’s t-test. Blot is representative of two biologically independent experiments with similar results obtained. Unprocessed immunoblots are shown in Source Data Extended Data Fig. 2.
Extended Data Fig. 3. Representative diagrams of flow cytometry analysis of the effects of LRRC31 overexpression on the NHEJ and HR pathways.
Representative diagrams of flow cytometry analysis of the effects of LRRC31 overexpression on the NHEJ and HR pathways. HEK293 cells were co-transfected with LRRC31- pcDNA3.1 plasmid or control vector and pEJ5-GFP or DR-GFP. After 24 hours, the cells were treated with or without irradiation at 4 Gy. After additional 24 hours, the expression of GFP in cells were quantified by flow cytometry. Example gating strategies were included. Three biologically independent experiments were performed. Data are presented in Fig. 2f and g in Main text.
Extended Data Fig. 4. Characterization of the interaction of LRRC31 with Ku70, Ku80 and MSH2 (a) and with DNA-PKC and ATR (b).
HEK293 cells were co-transfected with Myc-tagged LRRC31 and Flag-tagged Ku70, Ku80, MSH2, DNA-PKcs, or ATR. Cell lysates were prepared and immunoprecipitated with anti-Flag or anti-Myc antibody. The precipitated proteins were then separated using 10% (a) and 6% gel (b) SDS-PAGE, and probed with anti-Myc or anti-Flag antibody. WCE, whole cell extract. Two biologically independent experiments were performed with similar results obtained. Unprocessed immunoblots are shown in Source Data Extended Data Fig. 4.
Extended Data Fig. 5. Characterization of the intracellular localization of LRRC31 with Ku70 and ATR as well as the effects of LRRC31 on DNA-PKcs recruitment.
a,b, Confocal analysis of the intracellular localization of LRRC31 and Ku70 in 231BR cells without (a) and with (b) overexpression of LRRC31. Irradiation was performed at 4 Gy. Scale bar: 10 μm. c,d, IP-WB analysis (c) and semi-quantification (d) of the effect of LRRC31 downregulation or overexpression on DNA-PKcs recruitment in 231BR cells. e,f, Confocal analysis of the intracellular localization of LRRC31 and ATR in 231BR cells without (e) and with (f) overexpression of LRRC31. Irradiation was performed at 4 Gy. Scale bar: 10 μm. g,h, IP-WB analysis (g) and semi-quantification (h) of the effect of LRRC31 downregulation or overexpression on DNA-PKcs recruitment in MCF7 cells. For all the studies, three biologically independent experiments were performed with similar results obtained. Data in c and f show the mean ± s.d. (n=3 biologically independent experiments). Unprocessed immunoblots are shown in Source Data Extended Data Fig. 5.
Extended Data Fig. 6. Procedures for analysis of chromatin-recruitment of DNA-PKcs by biochemical fractionation and Immunoblotting.
Extended Data Fig. 7. Characterization of LRRC31 as a therapeutic target.
Characterization of LRRC31 as a therapeutic target. a, Analysis of the expression of LRRC31 in the indicated tumors in the TCGA database using Gene Expression Profiling Interactive Analysis (GEPIA). BRCA: breast invasive carcinoma; COAD: colon adenocarcinoma; LIHC: liver hepatocellular carcinoma; LUAD: lung adenocarcinoma; PAAD: pancreatic adenocarcinoma; PRAD: prostate adenocarcinoma; READ: rectum adenocarcinoma. b, Analysis of the correlation of patient survival with LRRC31 expression in BRCA patients using OncoLnc. Analysis was performed by comparing those patients with the expression level of LRRC31 among top 80th percentile (high, n=805 biologically independent samples) with the rest (low, n=200 biologically independent samples). c, Analysis of the correlation of patient survival with LRRC31 expression in READ patients. Analysis was performed by comparing those patients with the expression level of LRRC31 among top 80th percentile (high, n=127 biologically independent samples) with the rest (low, n=31 biologically independent samples). Statistical analyses for b and c were performed using the Log-rank (Mantel-Cox) test. d, Schematic diagram of characterization of LRRC31 NP-mediated gene therapy in mice bearing intracranial 231BR tumors. Cells were engineered to express both luciferase and GFP. e, f, Representative images of tumors in the brain imaged by IVIS (e) and semi-quantification of the bioluminescence signal (f) in tumor-bearing mice received intravenous administration of the indicated NPs following with and without irradiation treatment (5Gyⅹ2). Data in f show the mean ± s.d. (n=5 animals). Statistical analysis was performed using the two-tailed, unpaired Student’s t-test. g, Ex vivo imaging the brains isolated from the mice received the indicated treatment. h-j, Representative images of H&E (h), Caspase-3(i), and Ki67 (j), staining of tumors isolated from mice received the indicated treatment. Scale bar: 100 μm. Three biologically independent experiments were performed with similar results obtained.
Extended Data Fig. 8. Validation of the biological effects of LRRC31 in 231BR cells transduced with doxycycline (DOX)-inducible lentiviral vector.
a, WB analysis of the expression of LRRC31 expression in 231BR cells that were transduced with control vector or DOX-inducible LRRC31 overexpression vector and treated with and without DOX (100 ng/ml). Blot is representative of two biologically independent experiments with similar results obtained. Unprocessed immunoblots are shown in Source Data Extended Data Fig. 8. b–d, DOX-induced overexpression of LRRC31 sensitized cells to irradiation (b), and inhibited cell proliferation (c) and DNA-PK activity (d). Data show the mean ± s.d. (n=3 biologically independent experiments). Statistical analysis was performed using the two-tailed, unpaired Student’s t-test.
Extended Data Fig. 9. Unrooted phylogenetic tree based on LRRC31 mRNA sequences constructed by the Neighbor-Joining (NJ) method with 1000 bootstrap replicates in MEGA7.
The analysis was performed according to a previously reported method (Kumar S, Stecher G, and Tamura K. MEGA7: Molecular Evolutionary Genetics Analysis version 7.0 for bigger datasets (2016) Molecular Biology and Evolution 33:1870–1874). Branch lengths are proportional to percentage sequence difference. Scale bar: 10% difference.
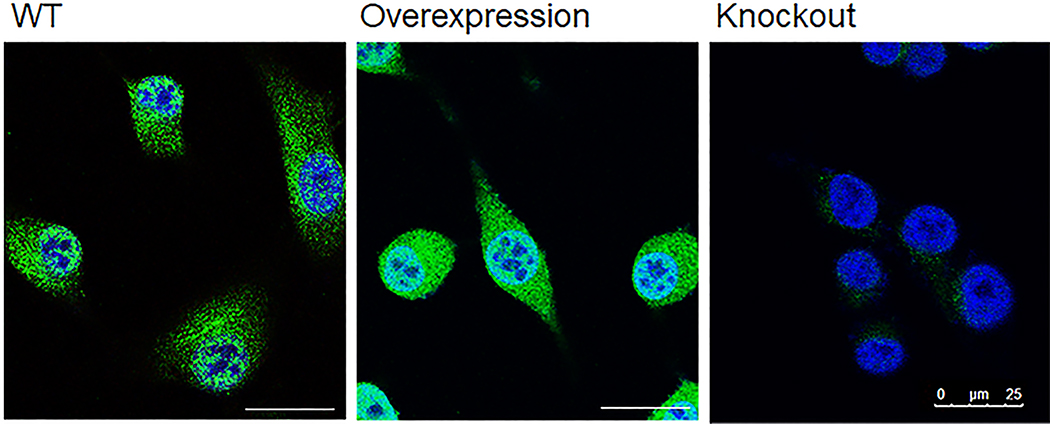
Extended Data Fig. 10. Validation of the selected LRRC31 antibody in 231BR cells with up- or down-regulation of LRRC31.
Scale bar: 100 μm. Two biologically independent experiments were performed with similar results obtained.
Supplementary Material
Acknowledgments
Y.C., T.J., H.Z., and X.G. contributed equally to this work. We thank Chao Ma, Tao Qin, Ruisan Zhang for assistance on surgical operation, and The Youth innovation team of Shaanxi Universities for help. This work was supported by NIH Grant NS095817 (JZ), State of Connecticut (JZ), Projects of International Cooperation and Exchanges Natural Science Foundation of ShaanXi Province of China (YC, 2017KW-059), the Scientific Research and Sharing Platform Construction Project of Shaanxi Province (YC, 2018PT-09).
Footnotes
Competing interests
The authors declare no competing interests.
References
- 1.Barnholtz-Sloan JS et al. Incidence proportions of brain metastases in patients diagnosed (1973 to 2001) in the Metropolitan Detroit Cancer Surveillance System. Journal of clinical oncology 22, 2865–2872 (2004). [DOI] [PubMed] [Google Scholar]
- 2.Davies MA Targeted therapy for brain metastases. Adv Pharmacol 65, 109–142 (2012). [DOI] [PubMed] [Google Scholar]
- 3.Lu J et al. Breast cancer metastasis: challenges and opportunities. Cancer research 69, 4951–4953 (2009). [DOI] [PubMed] [Google Scholar]
- 4.Zhou J et al. Activation of the PTEN/mTOR/STAT3 pathway in breast cancer stem-like cells is required for viability and maintenance. Proc Natl Acad Sci U S A 104, 16158–16163 (2007). [DOI] [PMC free article] [PubMed] [Google Scholar]
- 5.Arslan C, Dizdar O & Altundag K Systemic treatment in breast-cancer patients with brain metastasis. Expert Opin Pharmacother 11, 1089–1100 (2010). [DOI] [PubMed] [Google Scholar]
- 6.Steeg PS, Camphausen KA & Smith QR Brain metastases as preventive and therapeutic targets. Nature reviews. Cancer 11, 352–363 (2011). [DOI] [PMC free article] [PubMed] [Google Scholar]
- 7.Kuhnol J, Kuhnol C & Vordermark D Radiotherapy of brain metastases from breast cancer: Treatment results and prognostic factors. Oncol Lett 11, 3223–3227 (2016). [DOI] [PMC free article] [PubMed] [Google Scholar]
- 8.Shaw E et al. Single dose radiosurgical treatment of recurrent previously irradiated primary brain tumors and brain metastases: final report of RTOG protocol 90–05. International journal of radiation oncology, biology, physics 47, 291–298 (2000). [DOI] [PubMed] [Google Scholar]
- 9.Morgan MA & Lawrence TS Molecular Pathways: Overcoming Radiation Resistance by Targeting DNA Damage Response Pathways. Clinical cancer research : an official journal of the American Association for Cancer Research 21, 2898–2904 (2015). [DOI] [PMC free article] [PubMed] [Google Scholar]
- 10.Santivasi WL & Xia F Ionizing radiation-induced DNA damage, response, and repair. Antioxid Redox Signal 21, 251–259 (2014). [DOI] [PubMed] [Google Scholar]
- 11.Palmieri D et al. Her-2 overexpression increases the metastatic outgrowth of breast cancer cells in the brain. Cancer research 67, 4190–4198 (2007). [DOI] [PubMed] [Google Scholar]
- 12.Yoneda T, Williams PJ, Hiraga T, Niewolna M & Nishimura R A bone-seeking clone exhibits different biological properties from the MDA-MB-231 parental human breast cancer cells and a brain-seeking clone in vivo and in vitro. Journal of bone and mineral research 16, 1486–1495 (2001). [DOI] [PubMed] [Google Scholar]
- 13.Sanjana NE, Shalem O & Zhang F Improved vectors and genome-wide libraries for CRISPR screening. Nature methods 11, 783–784 (2014). [DOI] [PMC free article] [PubMed] [Google Scholar]
- 14.Olive PL & Banath JP The comet assay: a method to measure DNA damage in individual cells. Nat Protoc 1, 23–29 (2006). [DOI] [PubMed] [Google Scholar]
- 15.Ayoub N, Jeyasekharan AD, Bernal JA & Venkitaraman AR HP1-beta mobilization promotes chromatin changes that initiate the DNA damage response. Nature 453, 682–686 (2008). [DOI] [PubMed] [Google Scholar]
- 16.Riballo E et al. A pathway of double-strand break rejoining dependent upon ATM, artemis, and proteins locating to gamma-H2AX foci. Mol Cell 16, 715–724 (2004). [DOI] [PubMed] [Google Scholar]
- 17.Goodarzi AA et al. DNA-PK autophosphorylation facilitates Artemis endonuclease activity. Embo J 25, 3880–3889 (2006). [DOI] [PMC free article] [PubMed] [Google Scholar]
- 18.Bennardo N, Cheng A, Huang N & Stark JM Alternative-NHEJ is a mechanistically distinct pathway of mammalian chromosome break repair. PLoS Genet 4, e1000110 (2008). [DOI] [PMC free article] [PubMed] [Google Scholar]
- 19.Nakanishi K, Cavallo F, Brunet E & Jasin M Homologous recombination assay for interstrand cross-link repair. Methods Mol Biol 745, 283–291 (2011). [DOI] [PMC free article] [PubMed] [Google Scholar]
- 20.Wang Y & Qin J MSH2 and ATR form a signaling module and regulate two branches of the damage response to DNA methylation. Proc Natl Acad Sci U S A 100, 15387–15392 (2003). [DOI] [PMC free article] [PubMed] [Google Scholar]
- 21.Kamdar RP & Matsumoto Y Radiation-induced XRCC4 association with chromatin DNA analyzed by biochemical fractionation. J Radiat Res 51, 303–313 (2010). [DOI] [PubMed] [Google Scholar]
- 22.Drouet J et al. DNA-dependent protein kinase and XRCC4-DNA ligase IV mobilization in the cell in response to DNA double strand breaks. J Biol Chem 280, 7060–7069 (2005). [DOI] [PubMed] [Google Scholar]
- 23.Kobe B & Deisenhofer J The leucine-rich repeat: a versatile binding motif. Trends Biochem Sci 19, 415–421 (1994). [DOI] [PubMed] [Google Scholar]
- 24.Enkhbayar P, Kamiya M, Osaki M, Matsumoto T & Matsushima N Structural principles of leucine-rich repeat (LRR) proteins. Proteins 54, 394–403 (2004). [DOI] [PubMed] [Google Scholar]
- 25.Kobe B & Kajava AV The leucine-rich repeat as a protein recognition motif. Curr Opin Struc Biol 11, 725–732 (2001). [DOI] [PubMed] [Google Scholar]
- 26.Gay NJ, Packman LC, Weldon MA & Barna JCJ A Leucine-Rich Repeat Peptide Derived from the Drosophila Toll Receptor Forms Extended Filaments with a Beta-Sheet Structure. Febs Lett 291, 87–91 (1991). [DOI] [PubMed] [Google Scholar]
- 27.D’Mello RJ et al. LRRC31 is induced by IL-13 and regulates kallikrein expression and barrier function in the esophageal epithelium. Mucosal Immunol 9, 744–756 (2016). [DOI] [PMC free article] [PubMed] [Google Scholar]
- 28.Tang Z et al. GEPIA: a web server for cancer and normal gene expression profiling and interactive analyses. Nucleic Acids Res 45, W98–W102 (2017). [DOI] [PMC free article] [PubMed] [Google Scholar]
- 29.Anaya J OncoLnc: linking TCGA survival data to mRNAs, miRNAs, and lncRNAs. Peerj Comput Sci 2, e67 (2016). [Google Scholar]
- 30.Han L et al. Increased Nanoparticle Delivery to Brain Tumors by Autocatalytic Priming for Improved Treatment and Imaging. ACS nano 10, 4209–4218 (2016). [DOI] [PMC free article] [PubMed] [Google Scholar]
- 31.Chen Z et al. Targeted delivery of CRISPR/Cas9-mediated cancer gene therapy via liposome-templated hydrogel nanoparticles. Adv Funct Mater 27, 1703036 (2017). [DOI] [PMC free article] [PubMed] [Google Scholar]
- 32.Zhou J et al. Biodegradable poly(amine-co-ester) terpolymers for targeted gene delivery. Nat Mater 11, 82–90 (2012). [DOI] [PMC free article] [PubMed] [Google Scholar]
- 33.Veiseh O et al. Specific Targeting of Brain Tumors with an Optical/Magnetic Resonance Imaging Nanoprobe across the Blood-Brain Barrier. Cancer research 69, 6200–6207 (2009). [DOI] [PMC free article] [PubMed] [Google Scholar]
- 34.Carman AJ, Mills JH, Krenz A, Kim DG & Bynoe MS Adenosine receptor signaling modulates permeability of the blood-brain barrier. The Journal of neuroscience 31, 13272–13280 (2011). [DOI] [PMC free article] [PubMed] [Google Scholar]
- 35.Han L et al. Targeted drug delivery to ischemic stroke via chlorotoxin-anchored, lexiscan-loaded nanoparticles. Nanomedicine 12, 1833–1842 (2016). [DOI] [PMC free article] [PubMed] [Google Scholar]
- 36.Haber AH & Rothstein BE Radiosensitivity and rate of cell division: “law of Bergonie and Tribondeau”. Science 163, 1338–1339 (1969). [DOI] [PubMed] [Google Scholar]
- 37.Sorensen CS et al. The cell-cycle checkpoint kinase Chk1 is required for mammalian homologous recombination repair. Nat Cell Biol 7, 195–U121 (2005). [DOI] [PubMed] [Google Scholar]
- 38.Bernhard EJ et al. Inhibiting ras prenylation increases the radiosensitivity of human tumor cell lines with activating mutations of ras oncogenes. Cancer research 58, 1754–1761 (1998). [PubMed] [Google Scholar]
References
- 39.Yang H et al. Radiosensitization of brain metastasis by targeting c-MET. Lab Invest 93, 344–353 (2013). [DOI] [PubMed] [Google Scholar]
- 40.Chen Y et al. EMMPRIN regulates tumor growth and metastasis by recruiting bone marrow-derived cells through paracrine signaling of SDF-1 and VEGF. Oncotarget 6, 32575–32585 (2015). [DOI] [PMC free article] [PubMed] [Google Scholar]
- 41.Franken NA, Rodermond HM, Stap J, Haveman J & van Bree C Clonogenic assay of cells in vitro. Nat Protoc 1, 2315–2319 (2006). [DOI] [PubMed] [Google Scholar]
Associated Data
This section collects any data citations, data availability statements, or supplementary materials included in this article.
Supplementary Materials
Data Availability Statement
The cDNA array data that support the findings of this study have been deposited in the Gene Expression Omnibus under accession code GSE117453. The data for human rectum adenocarcinoma and breast invasive carcinoma were derived from the TCGA Research Network: http://cancergenome.nih.gov. The data-set derived from this resource that supports the findings of this study is available in Source Data Extended Data Fig. 7. All other data supporting the findings of this study are available from the corresponding authors upon reasonable request.


