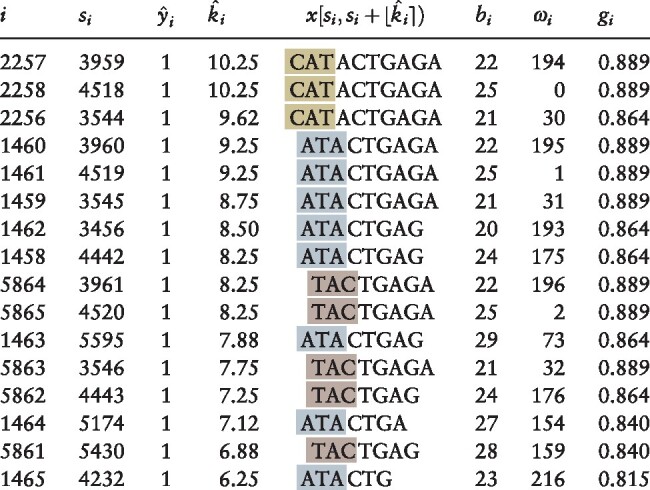
Table 1.
Suffix array peak positions with

|
Note: Illustration of motif selection process (Section 2.1) applied to simulated data (using kernel half-width κ = 4). All positions for which sequence smoothed score are shown; table is sorted in descending order of the estimated motif length . Columns indicate values of key variables for the suffix associated with the corresponding peak: (i) suffix array index i giving position of suffix in lexicographically sorted list of all suffixes; (si) suffix array value si giving spatial position of suffix in concatenated sequence x; () kernel-smoothed score (Equation 4); () estimated length (Equation 7) of conserved -mer prefix of suffixes within smoothing window centered on suffix array index i; () the corresponding conserved -mer (Equation 9); (bi) the input sequence bi (Equation 3) from which the suffix is derived; (ωi) the spatial position ωi at which the suffix is found within sequence bi; and (gi) the Gini impurity gi (Equation S4) for the smoothing window centered at i. Note that each of these peaks corresponds to a suffix derived from a position within the first three characters of an instance of the embedded motif CATACTGAGA. Gold highlighting indicates peaks starting from the first character of the embedded motif, silver the second and bronze the third.
