

Summary
Yeast cells must grow to a critical size before committing to division. It is unknown how size is measured. We find that as cells grow, mRNAs for some cell cycle activators scale faster than size, increasing in concentration, while mRNAs for some inhibitors scale slower than size, decreasing in concentration. Size-scaled gene expression could cause an increasing ratio of activators to inhibitors with size, triggering cell cycle entry. Consistent with this, expression of the CLN2 activator from the promoter of the WHI5 inhibitor, or vice versa, interfered with cell size homeostasis, yielding a broader distribution of cell sizes. We suggest that size homeostasis comes from differential scaling of gene expression with size. Differential regulation of gene expression as a function of cell size could affect many cellular processes.
Graphical Abstract
eTOC
Chen et al. explain the fact that cell division depends on cell growth. They find that large cells systematically over-express a set of cell division activators, while systematically under-expressing cell division inhibitors. The ratio of activators to inhibitors could trigger division. Altering this pattern of expression increases cell size variation.
Introduction
The cell division cycle is a biochemical oscillator (Adames et al., 2015; Chen et al., 2004; Ferrell et al., 2011; Kraikivski et al., 2015). This oscillator must be entrained to growth such that one mass doubling on average induces one cell division—otherwise, cells would become indefinitely large or small. The mechanism of entrainment--the means by which growth modulates division--is unknown. Entrainment of division to growth produces cell size homeostasis—the same narrow cell size distribution one generation after another. Yeast and other microbes have a size control permitting division only after cells have achieved a critical size (about 30 femtoliters in S. cerevisiae) (Fig. 1) (Di Talia et al., 2007; Di Talia et al., 2009; Fantes, 1977; Hartwell and Unger, 1977; Johnston et al., 1977; Schneider et al., 2004; Turner et al., 2012; Wang et al., 2009). In mammals the issue is complex, but most evidence also favors size control (Ginzberg et al., 2015; Godin et al., 2010; Kafri et al., 2013; Son et al., 2012; Sung et al., 2013; Tzur et al., 2009). How size control works is unknown, but there are many models (Fantes et al., 1975; Ginzberg et al., 2015; Heldt et al., 2018; Turner et al., 2012).
Fig. 1. Cell size mutants of S. cerevisiae have no homeostasis defect.
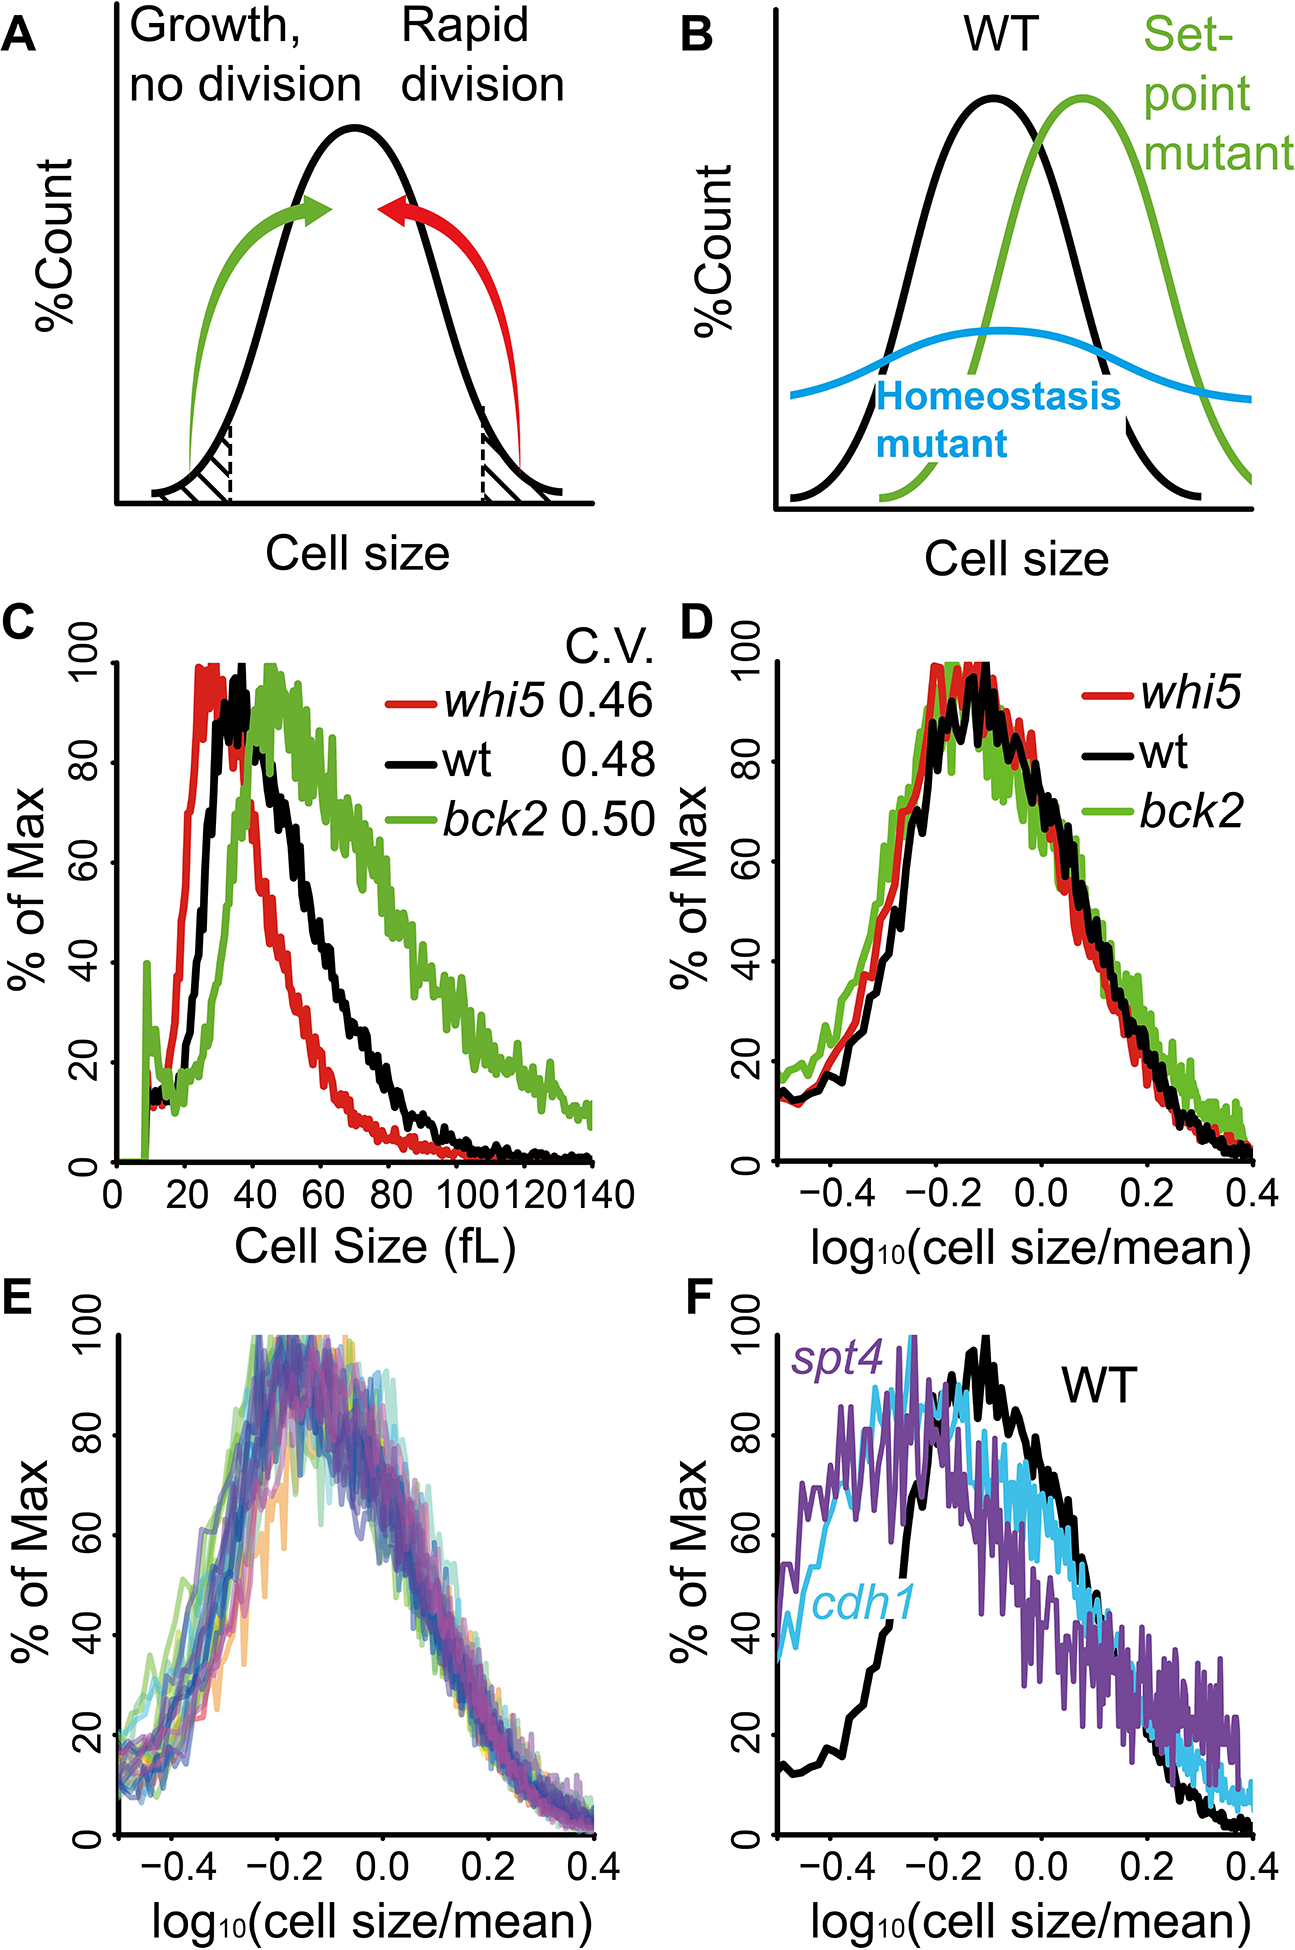
A. Size control. Small cells grow in size to become bigger; large cells divide to become smaller.
B. “Set-point” mutant with shifted mean but WT breadth (green); “homeostasis” mutant with WT mean but wide breadth (blue).
C. Cell size distributions and CVs of whi5 (red), bck2 (green) and wild type (black). Similar results were obtained with two biological replicates.
D. Cell size distributions from C, displayed as mean-subtracted Box-Cox transformations.
E. Cell size distribution overlay of mean-subtracted Box-Cox transformations of WT and 30 mutants (Materials and Methods). In most cases, there were not biological replicates.
F. Mean-subtracted Box-Cox transformations of WT, spt4Δ, cdh1Δ.
See also Fig. S1.
In S. cerevisiae, size control is effected at a size-dependent G1 event called “Start”, which commits cells to division. Start is induced after the G1 cyclin Cln3 binds the cyclin dependent kinase (CDK) Cdc28, and somehow inactivates the repressor protein Whi5. This activates the transcription factor SBF, consisting of the DNA binding protein Swi4 and modulator Swi6 (Costanzo et al., 2004; de Bruin et al., 2008; de Bruin et al., 2004; Travesa et al., 2013; Wagner et al., 2009; Wang et al., 2009). SBF induces transcription of many targets including two other G1 cyclins, Cln1 and Cln2. These also activate the CDK and therefore SBF. Crucially, this forms a positive feedback loop, in which G1 cyclin activates CDK and SBF, and SBF activates transcription of G1 cyclin (Bean et al., 2006; Skotheim et al., 2008). This positive feedback loop constitutes commitment, or “Start”. Activated SBF induces expression of about 100 additional genes for budding and DNA synthesis (Charvin et al., 2010; Skotheim et al., 2008) and pushes cells into the cycle.
Geneticists have studied size control by finding cell size mutants (Nurse, 1975; Sudbery et al., 1980). In general, null mutations that produce large cells (e.g., cln3) have identified activators of Start, while null mutations that produce small cells (e.g., whi3, whi5) have identified inhibitors of Start. Many activators and inhibitors are known, and have been instrumental in understanding commitment to division. In broad terms, commitment to division can be understood as a battle between activators such as Cln3, and inhibitors such as Whi5.
But—and this is the central issue here--how is this battle between activators and inhibitors connected to cell size? Why does growth to a critical size allow activators to win, and inhibitors to lose? In general, as cells grow, protein abundance increases in proportion; i.e., most proteins maintain constant concentration, so it is not obvious how growth would favor one protein over another. But proportionality of growth and expression might not always be true. Abundance of the activator Cln3 has been measured as cells grow. Cln3 is non-abundant and unstable, and its measurement is difficult. Three papers found Cln3 concentration stays about the same when cells grow (Schmoller et al., 2015; Tyers et al., 1993; Tyers et al., 1992), while two found concentration increases (Thorburn et al., 2013; Zapata et al., 2014). With respect to Whi5, Schmoller et al. found that Whi5 concentration decreases as cells grow (Schmoller et al., 2015), while Dorsey et al. found it stayed constant (Dorsey et al., 2018). Although results vary, some are consistent with the view that cell size could differentially affect concentrations of Cln3 and Whi5, and “Start” could occur when the Cln3/Whi5 ratio is high. However, there is no known mechanism for this—why would these protein concentrations change with cell size?
But even if differential changes in Cln3 and Whi5 abundance do occur, cell size control would still be a mystery, because even when CLN3 or WHI5 or both are deleted, cells indeed have an aberrant mean size, but, surprisingly, still exhibit good size homeostasis—they maintain a narrow cell size distribution around their new mean cell size, and are still strongly size-dependent for Start (Di Talia et al., 2009; Schneider et al., 2004; Wang et al., 2009). In S. pombe, some instances of poor homeostasis have been seen including the wee1–50 rum1Δ mutant (Moreno et al., 1994; Moreno and Nurse, 1994; Sveiczer et al., 1996), and various mutants (e.g. wee1–50 cdc25Δ) that fail to properly regulate Tyr15 phosphorylation of Cdc2 (Sveiczer et al., 1996, 1999). Wood and Nurse showed that cells completely unable to regulate Tyr15 phosphorylation (a cdc13–cdc2AF mutant fusion) had poor homeostasis, and yet still maintained substantial size control, ultimately concluding that “ … the size sensing mechanism in fission yeast may act through an unidentified pathway regulating CDK activity by an unknown mechanism” (Wood and Nurse, 2013).
The fact some classic S. cerevisiae size mutants (cln3, whi5) have aberrant size but good homeostasis has made us rethink things. Here, we consider the mean cell size (the “set point”) separately from the breadth of the cell size distribution (“homeostasis”), possibly controlled by different mechanisms. We measured size homeostasis in all known S. cerevisiae cell size mutants. If a size sensing device were partially defective, cells would have poor size control and a broad size distribution (Fig. 1b). Instead, we find that while most known yeast cell size mutants do indeed change the “set-point”, they have no effect on homeostasis. We go on to show that as small G1 cells grow in mass, the expression of most mRNAs changes in proportion, but with crucial exceptions. Some cell cycle activators scale faster-than-size, while some inhibitors scale slower-than-size, suggesting why cells become more prone to divide as they grow larger.
Results
Classic yeast cell size mutants have aberrant mean sizes, but wild-type homeostasis
We assayed cell size distributions for size mutants using a Coulter Counter Z2, measuring mean and mode cell size, standard deviation, and the approximate coefficient of variation (CV). (Approximate, because the size distributions are neither normal nor log-normal.) Consistent with earlier studies (Costanzo et al., 2004; de Bruin et al., 2004; Di Como et al., 1995), Δwhi5 had small cells while Δbck2 had large cells (Fig. 1C). In absolute terms, the breadth of the size distribution is wider for Δbck2 than for Δwhi5, but mean size is also larger for Δbck2 cells. To fairly compare the distributions, they must be normalized by their means. This is the coefficient of variation (CV), the standard deviation divided by the mean. For Δbck2 and Δwhi5, the approximate CV was about 0.48, the same as wild-type (Fig. 1C). Similar results were obtained for CLN3–1 (small cells) and Δcln3 (large cells). These mutants, despite aberrant sizes, have in this sense wild-type size homeostasis—the breadths of the size distributions are proportional to the means, with the same ratio as wild-type.
We also used alternative statistical approaches. The mutant and wild-type CVs were also the same when the size distributions were treated as log-normal. The method of (Coudreuse and Nurse, 2010), where cells of different sizes are binned as percent deviation from the median, again found no difference in homeostasis between wild-type and mutants (Fig. S1). Box-Cox normalization likewise found no difference in mean-normalized variance in cell size between whi5, bck2, and wild-type (Fig. 1D).
Other mutants were assayed. 30 of 32 cell size mutants (e.g. (Dungrawala et al., 2012; Jorgensen et al., 2002; Soifer and Barkai, 2014) had C.V.s indistinguishable from wild-type (Fig. 1E). The two exceptions were spt4 and cdh1 (Fig. 1F). Spt4 (C.V of 0.59 versus 0.48 for WT) is a transcription elongation factor, affects RNA processing and mRNA half-lives. Cdh1 (C.V = 0.63) targets cell cycle proteins for degradation via the proteasome. Both genes could play important roles in homeostasis (see below).
To address redundancy, we checked the combined effects of selected multiple cell size mutations. We picked mutations with a large effect on size, generating highly aberrant, extremely large cells. A cln1 cln2 cln3 sic1 strain, despite having huge cells with a mode size of 97.8 fL, had a CV of only about 0.38, lower than WT (likely an underestimate because some cells were over the upper limit of measurement). A GAL-CLN3 bck2 whi5 stb1 strain, shifted from YEPRaff+Gal to YPD for 5 hours to shut off GAL-CLN3, had very large cells (mode 57.0 fL), but had a CV of 0.48, like wild-type.
These results suggest most known size mutants are capable of sensing and modulating size, albeit to an aberrant mean. This is consistent with two separate mechanisms, one (defined by existing size mutants) for setting mean cell size, and a second (still undefined by mutants) for homeostasis. Accordingly, we refer to “set-point” and (hypothetical) “homeostasis” classes of mutants (Fig. 1B).
Global search for mutants with a defect in size homeostasis.
Why are there no known mutants with aberrant homeostasis? Classic screens for size mutants looked for altered mean cell size, but did not look for altered variance. Furthermore, a complete lack of homeostasis would likely be inviable. But essential processes can often be disturbed by null mutations in accessory genes.
Two large-scale experiments examined cell size variability amongst the viable deletion strains (Jorgensen et al., 2002; Ohya et al., 2005). We re-analyzed these two datasets by calculating all coefficients of variation and looking for mutants with high CVs in both datasets. Full results are complex (Chen and Futcher in preparation), but no mutant emerged as likely to have a significant homeostasis defect. Small homeostasis defects were found in rai1, dcs1, and xrn1, which are involved in RNA processing. We cannot exclude the possibility that size homeostasis is generated by some unknown essential gene.
Global scaling of mRNA abundance with cell size
It is unclear how gene expression changes as cells grow in size, though Zhurinsky et al. have addressed this issue in S. pombe (Zhurinsky et al., 2010). A presumption is that gene products scale proportionally to cell size; that is, remain constant in concentration. But alternatively, some cell cycle activators might scale faster-than-size (i.e., increase in concentration with growth), or cell cycle inhibitors might scale slower-than-size (decrease in concentration). Such differential scaling would solve the size control problem—as cells grow, activators would increase relative to inhibitors, triggering division at a critical size. To allow rigorous statistical analysis of this hypothesis and avoid p-hacking (Simmons et al., 2011), we pre-selected eight cell cycle activators and eight cell cycle inhibitors as candidates for differential scaling (Fig. 2, Table S2) before analyzing data.
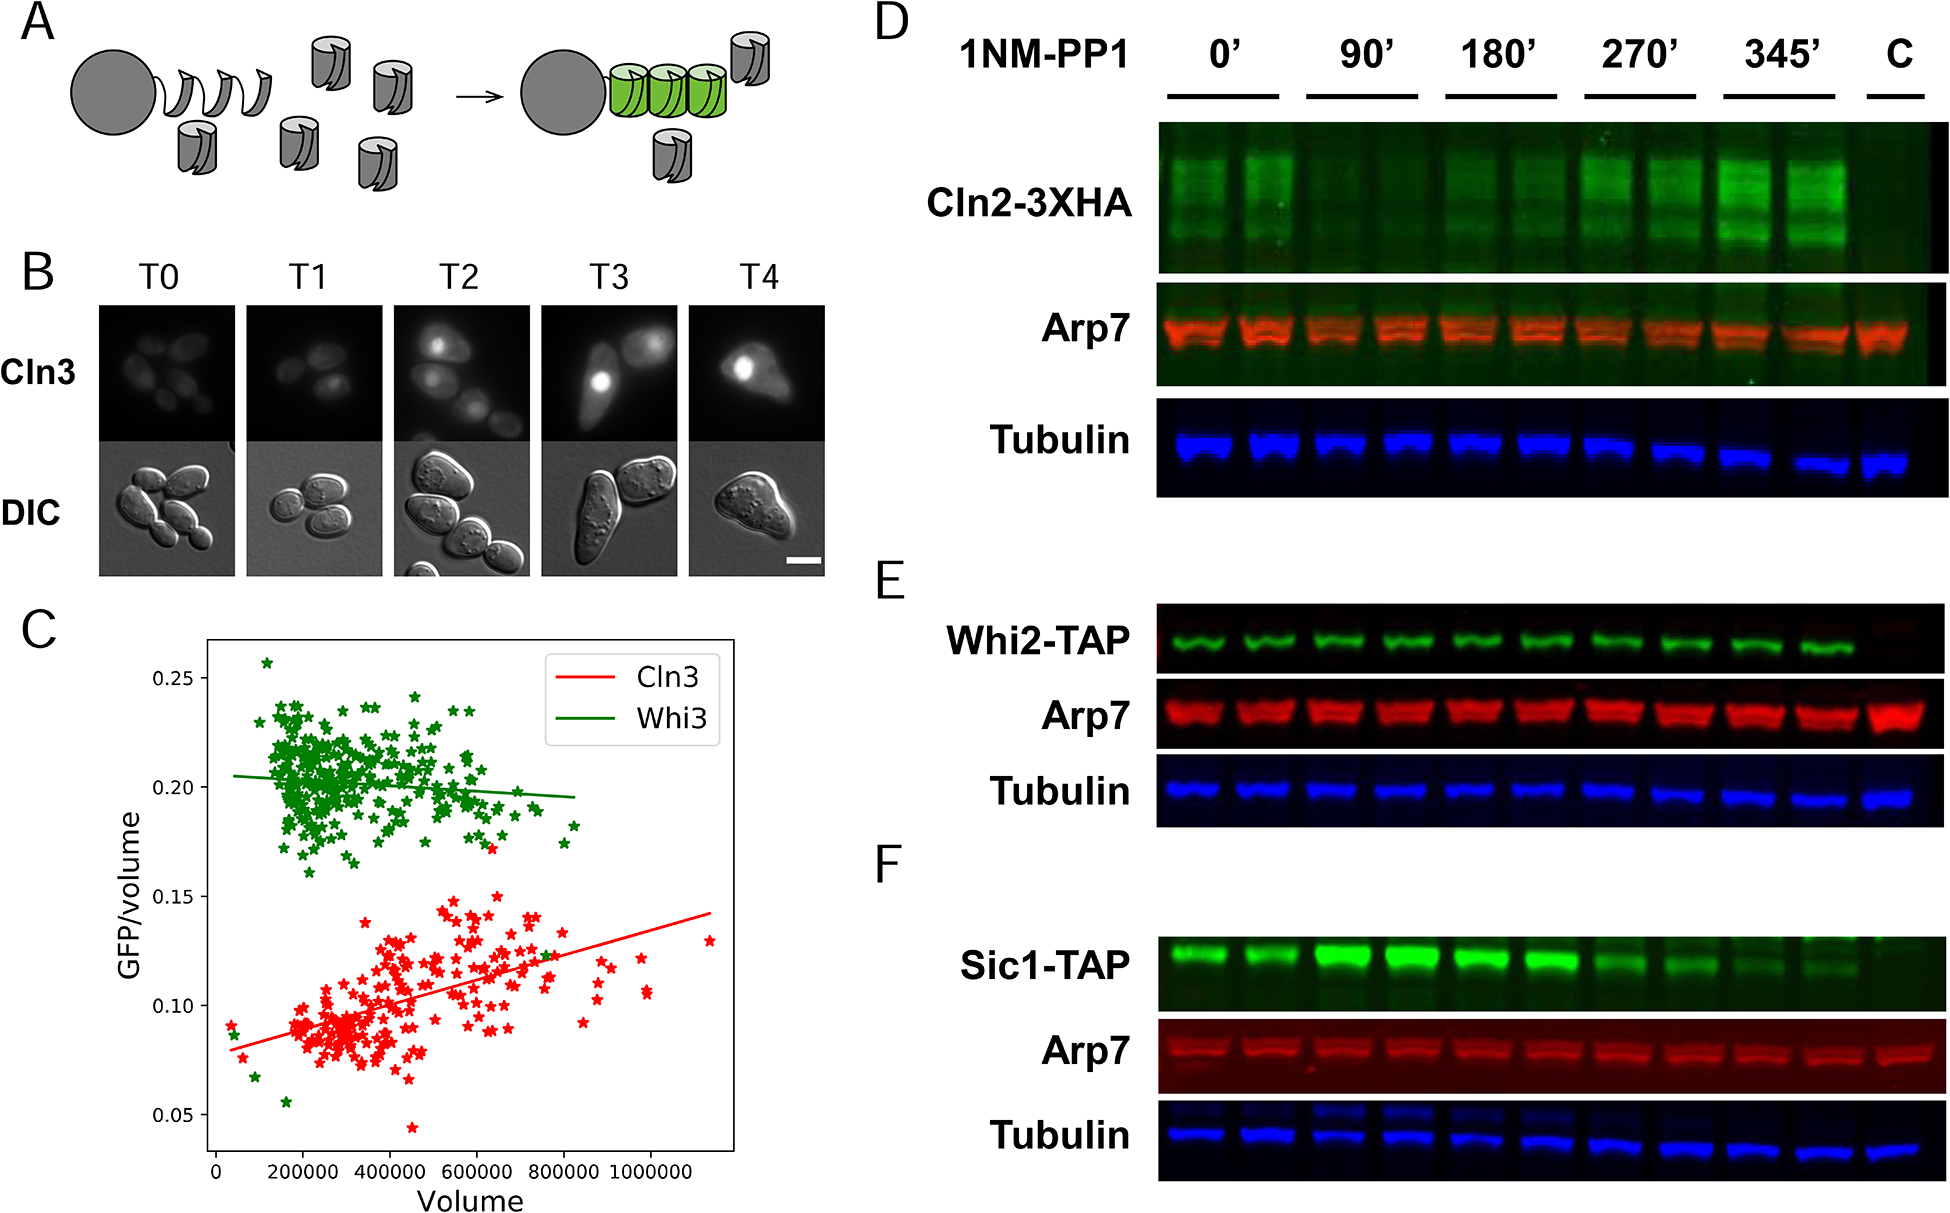
Fig. 2. Scaling of expression of cell cycle activators and inhibitors with cell size.
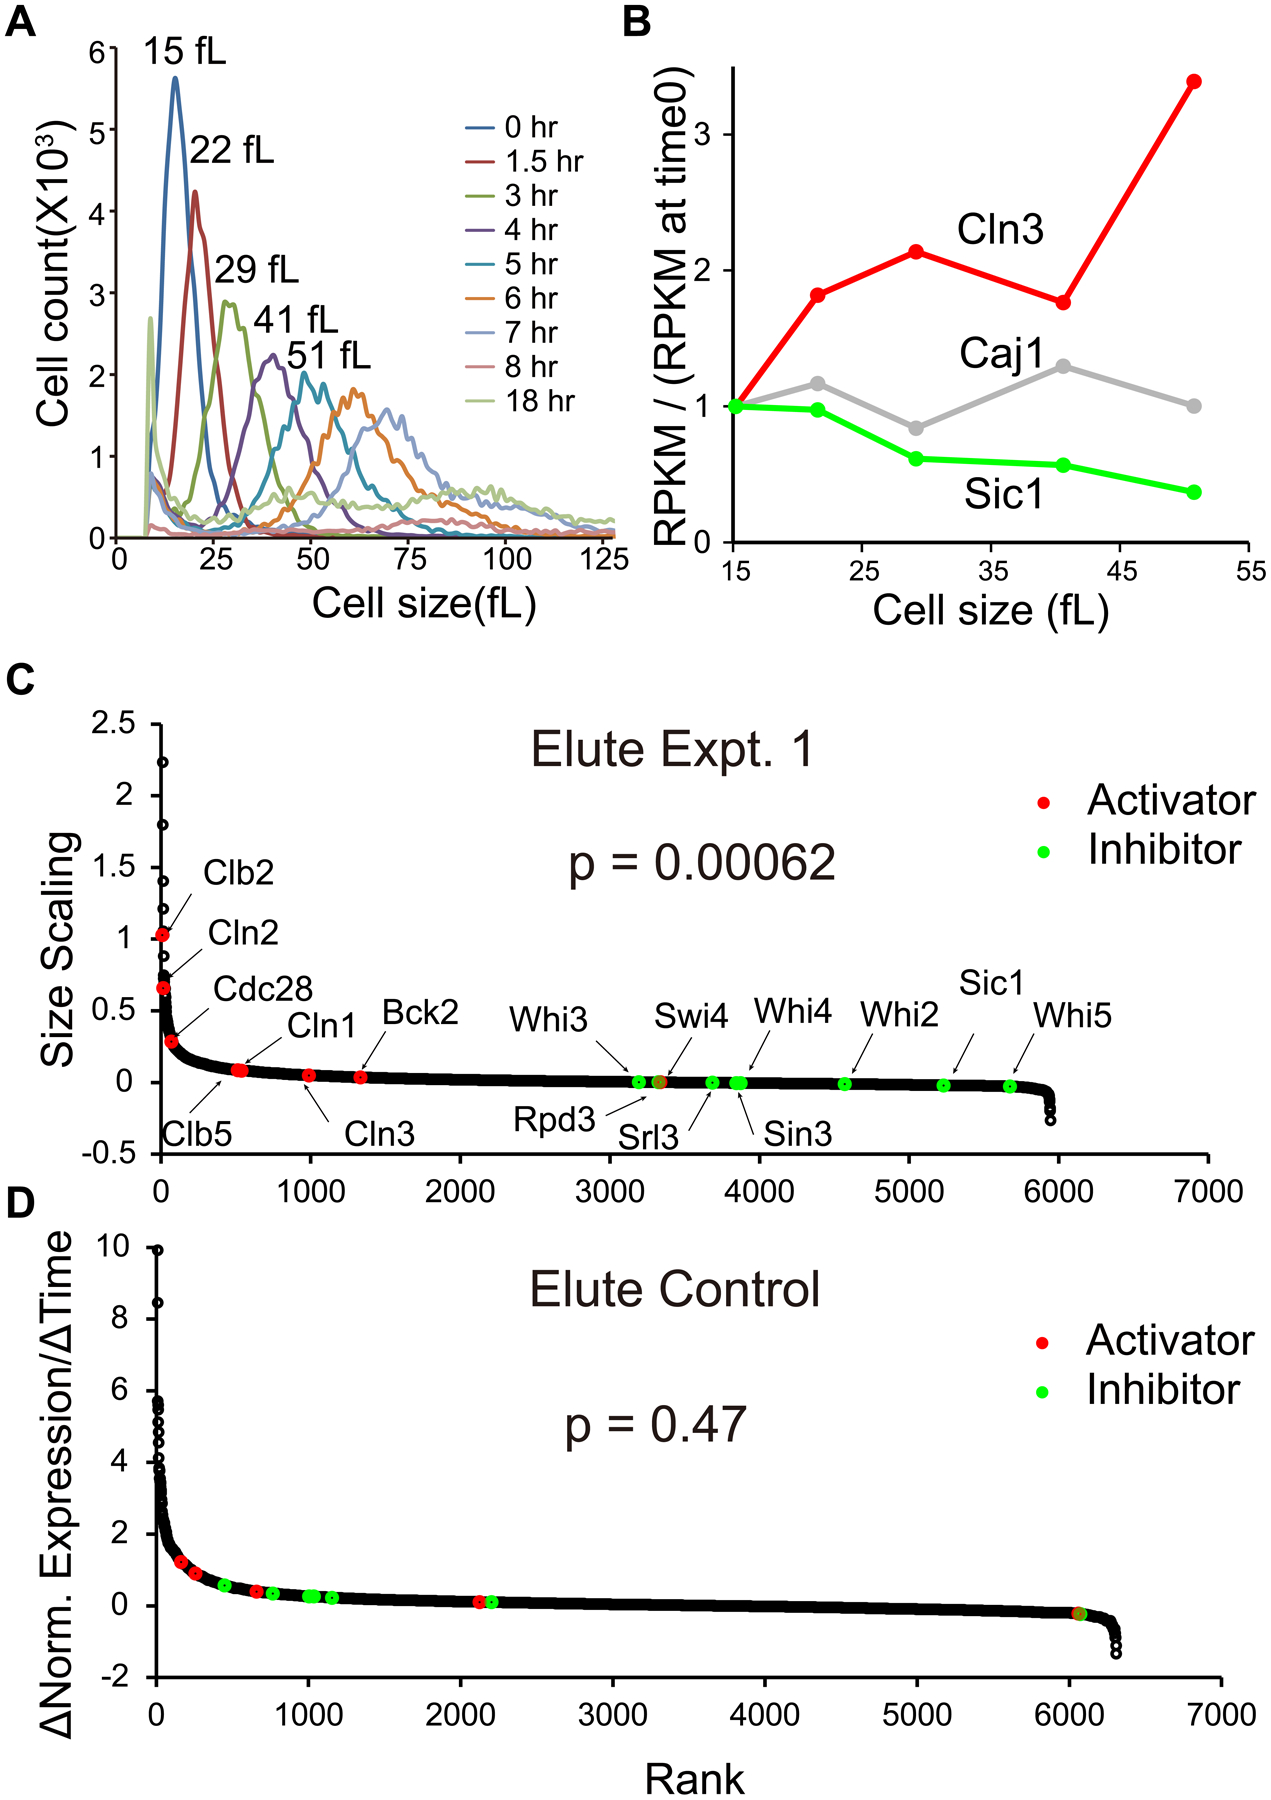
A. Cell size distributions in elutriation expt. 1.
B. For example genes, concentrations of mRNA at sizes of 15, 22, 29, 41, and 51 fL are compared to initial (15 fL) concentration of mRNA. mRNAs were measured as RPKM (Reads Per Kilobase per Million mapped reads), and the ratio of RPKM(sample 0 to 4)/RPKM(sample 0) (“concentration”) for each gene is plotted against cell size. Best-fit linear regression lines and slopes were calculated.
C. For each mRNA, a best-fit line and slope was calculated for [RPKM(sample 0 to 4)/RPKM(sample 0)], as in B. We call these slopes “size scaling values”. Each gene is plotted as a dot, ranked left to right by size scaling value. A large size scaling value (i.e., large positive slope) means the mRNA scales faster-than-size, i.e., increases in concentration as the cell grows. Pre-selected cell cycle activators are colored red, and inhibitors green. The Wilcoxon p-value was calculated for a rank difference between activators and inhibitors. The experiment was done three times with similar results (see Fig. 3).
D. Elutriation control. CDC28 cells were held in the elutriation chamber during centrifugation, then flushed out without size separation. 1NMPP1 inhibitor was added, but these cells were not sensitive to the inhibitor. Samples were taken processed and analyzed as in panel C.
A complication is that as cells grow, they also progress through the cell cycle, and hundreds of genes change in expression as a function of cell cycle (Spellman et al., 1998). We wished to enquire about gene expression purely as a function of cell size. Our approach was to isolate small cells, trap them in G1 by inhibiting CDK activity, allow them to grow large while still in G1, and analyze transcript abundance by RNA-Seq as a function of size.
We used elutriation to isolate small, growing G1 daughter cells. To block cell cycle progress, we used a cdc28-as mutant, and added the ATP analog 1NMPP1, which specifically inhibits the kinase activity of Cdc28-as (a 1NMPP1-sensitive allele of the cyclin dependent kinase) (Bishop et al., 2000; Ubersax et al., 2003). The cells were grown to large cell sizes, but without development of CDK activity or cell cycle progress. That is, we generated cells differing in size, but not cell cycle state.
Samples were taken with time (Fig. 2A). Initially, cells had a size of 15 femtoliters (fL), and by 5 hr (fifth sample) they had grown to 51 fL (Fig. 2A). Larger cells are non-physiological. None (0 of ~ 400 per sample) of the cells budded, so by this assay there was no cell cycle progression. To allow absolute quantification, samples were supplemented with a constant number of C. albicans cells. Samples were processed for RNA-Seq. Transcript reads were mapped to S. cerevisiae or C. albicans. Because the C. albicans mRNAs were constant in number in each sample, absolute abundance of each S. cerevisiae mRNA could be calculated, as well as the relative abundance of the S. cerevisiae transcripts to each other. We call this relative abundance (the ratio of mRNA for a given gene to total mRNA) the “concentration” of the mRNA, though it is not literally a concentration. Thus, for essentially every mRNA, we had a measure of relative and absolute abundance as a function of cell size from 15 to 51 fL.
For each mRNA, we calculated a best-fit line of abundance (relative or absolute abundance gave similar results) versus cell volume, and calculated slope. For an mRNA not changing in concentration, this slope was 0, while for mRNAs where concentration increased, slope was positive, and for mRNAs where concentration decreased, slope was negative (Fig. 2B). As examples of results, CLN3 and SIC1 are genes with high positive or negative slopes, respectively, and CAJ1 was the median gene, with a slope of essentially 0 (i.e., constant concentration).
We plotted slopes of each of the ~6,000 gene mRNAs from highest to lowest (Fig. 2C). Genes on the left have mRNAs increasing in concentration with size, genes on the right have mRNAs decreasing in concentration, and the many genes in the flatish part in the middle have little if any change. Even at the right end of the plot, the absolute amount of each mRNA is increasing—it is just not increasing as fast as cell volume. The changes in concentration are substantial. On the left, some mRNAs are increasing 10 to 15-fold in abundance, and 3 to 5-fold in concentration. On the right, some mRNAs are decreasing ~3-fold in concentration, and only just barely increasing in absolute abundance as cells triple in size.
The pre-selected activators (red dots) tended to be in the left half, increasing in concentration with growth, while the pre-selected inhibitors (green dots) tended to be in the right half, decreasing in concentration (Fig. 2C). A Wilcoxon rank test showed that the separation of activators from inhibitors was highly significant (p = 6.2 × 10⁻⁴). Furthermore, 15 of the 16 scaling slopes (combined over experiments) were statistically significant (16th p-value = 0.055, Table S1).
Some of this differential scaling has been seen previously. Schmoller et al. found that Whi5 protein is diluted as cells grow (Schmoller et al., 2015), while three groups previously found size-dependent but CDK-independent increases in CLN1 and/or CLN2 mRNA (Cross et al., 1994; Dirick and Nasmyth, 1991; Stuart and Wittenberg, 1994). After analyzing the data, we could see additional activators scaled faster-than-size, while additional inhibitors scaled slower (Table S3). Notably, these included SPT4 and CDH1, the two cell size mutants that had an increased C.V. (Fig. 1). However, to avoid p-hacking (Simmons et al., 2011), we limited analysis to the pre-selected 16 activators/inhibitors.
As a control, we repeated the experiment using isogenic CDC28 cells. Cells were loaded into the elutriator, held with centrifugation for the same time as before, then flushed out without size selection. 1NMPP1 was then added to these CDC28 cells (which should not respond). The cells were incubated, sampled and processed for RNA-seq. In this control, there was no fractionation by size, no cell cycle arrest, and no net size change with time. However, all physical manipulations were the same as previously. Slopes of gene expression were calculated as a function of time (Fig. 2D). There was no separation between activators and inhibitors (Wilcoxon p = 0.47). (Surprisingly, however, ribosomal protein and biogenesis genes in this CDC28 strain did seem to respond to 1NMPP1.) This suggests the differential scaling of activators and inhibitors in the cdc28-as experiment was indeed due to changes in cell size.
The experiment was repeated twice (Fig. 3A, B, Table S2). The ranks of activators and inhibitors are well preserved between experiments (Table S2). The Wilcoxon p-values for the separation of activators from inhibitors were again highly significant (p = 4.7 × 10⁻³, p = 6.2 × 10⁻⁴). The 16 cell cycle regulators had similar ranks in each experiment: the pairwise Spearman rank correlations for the 16 regulators (Table S2) ranged from 0.68 to 0.77. In each experiment, WHI5 is the bottom-ranked of the 16 genes (p = 0.0002) (Table S2), consistent with (Schmoller et al., 2015). The pairwise Spearman correlations for all ~6354 genes are smaller, ~ 0.3, but this is expected, because in the middle of the plot, a small change in slope leads to a big change in rank.
Fig. 3. Size scaling is repeatable.
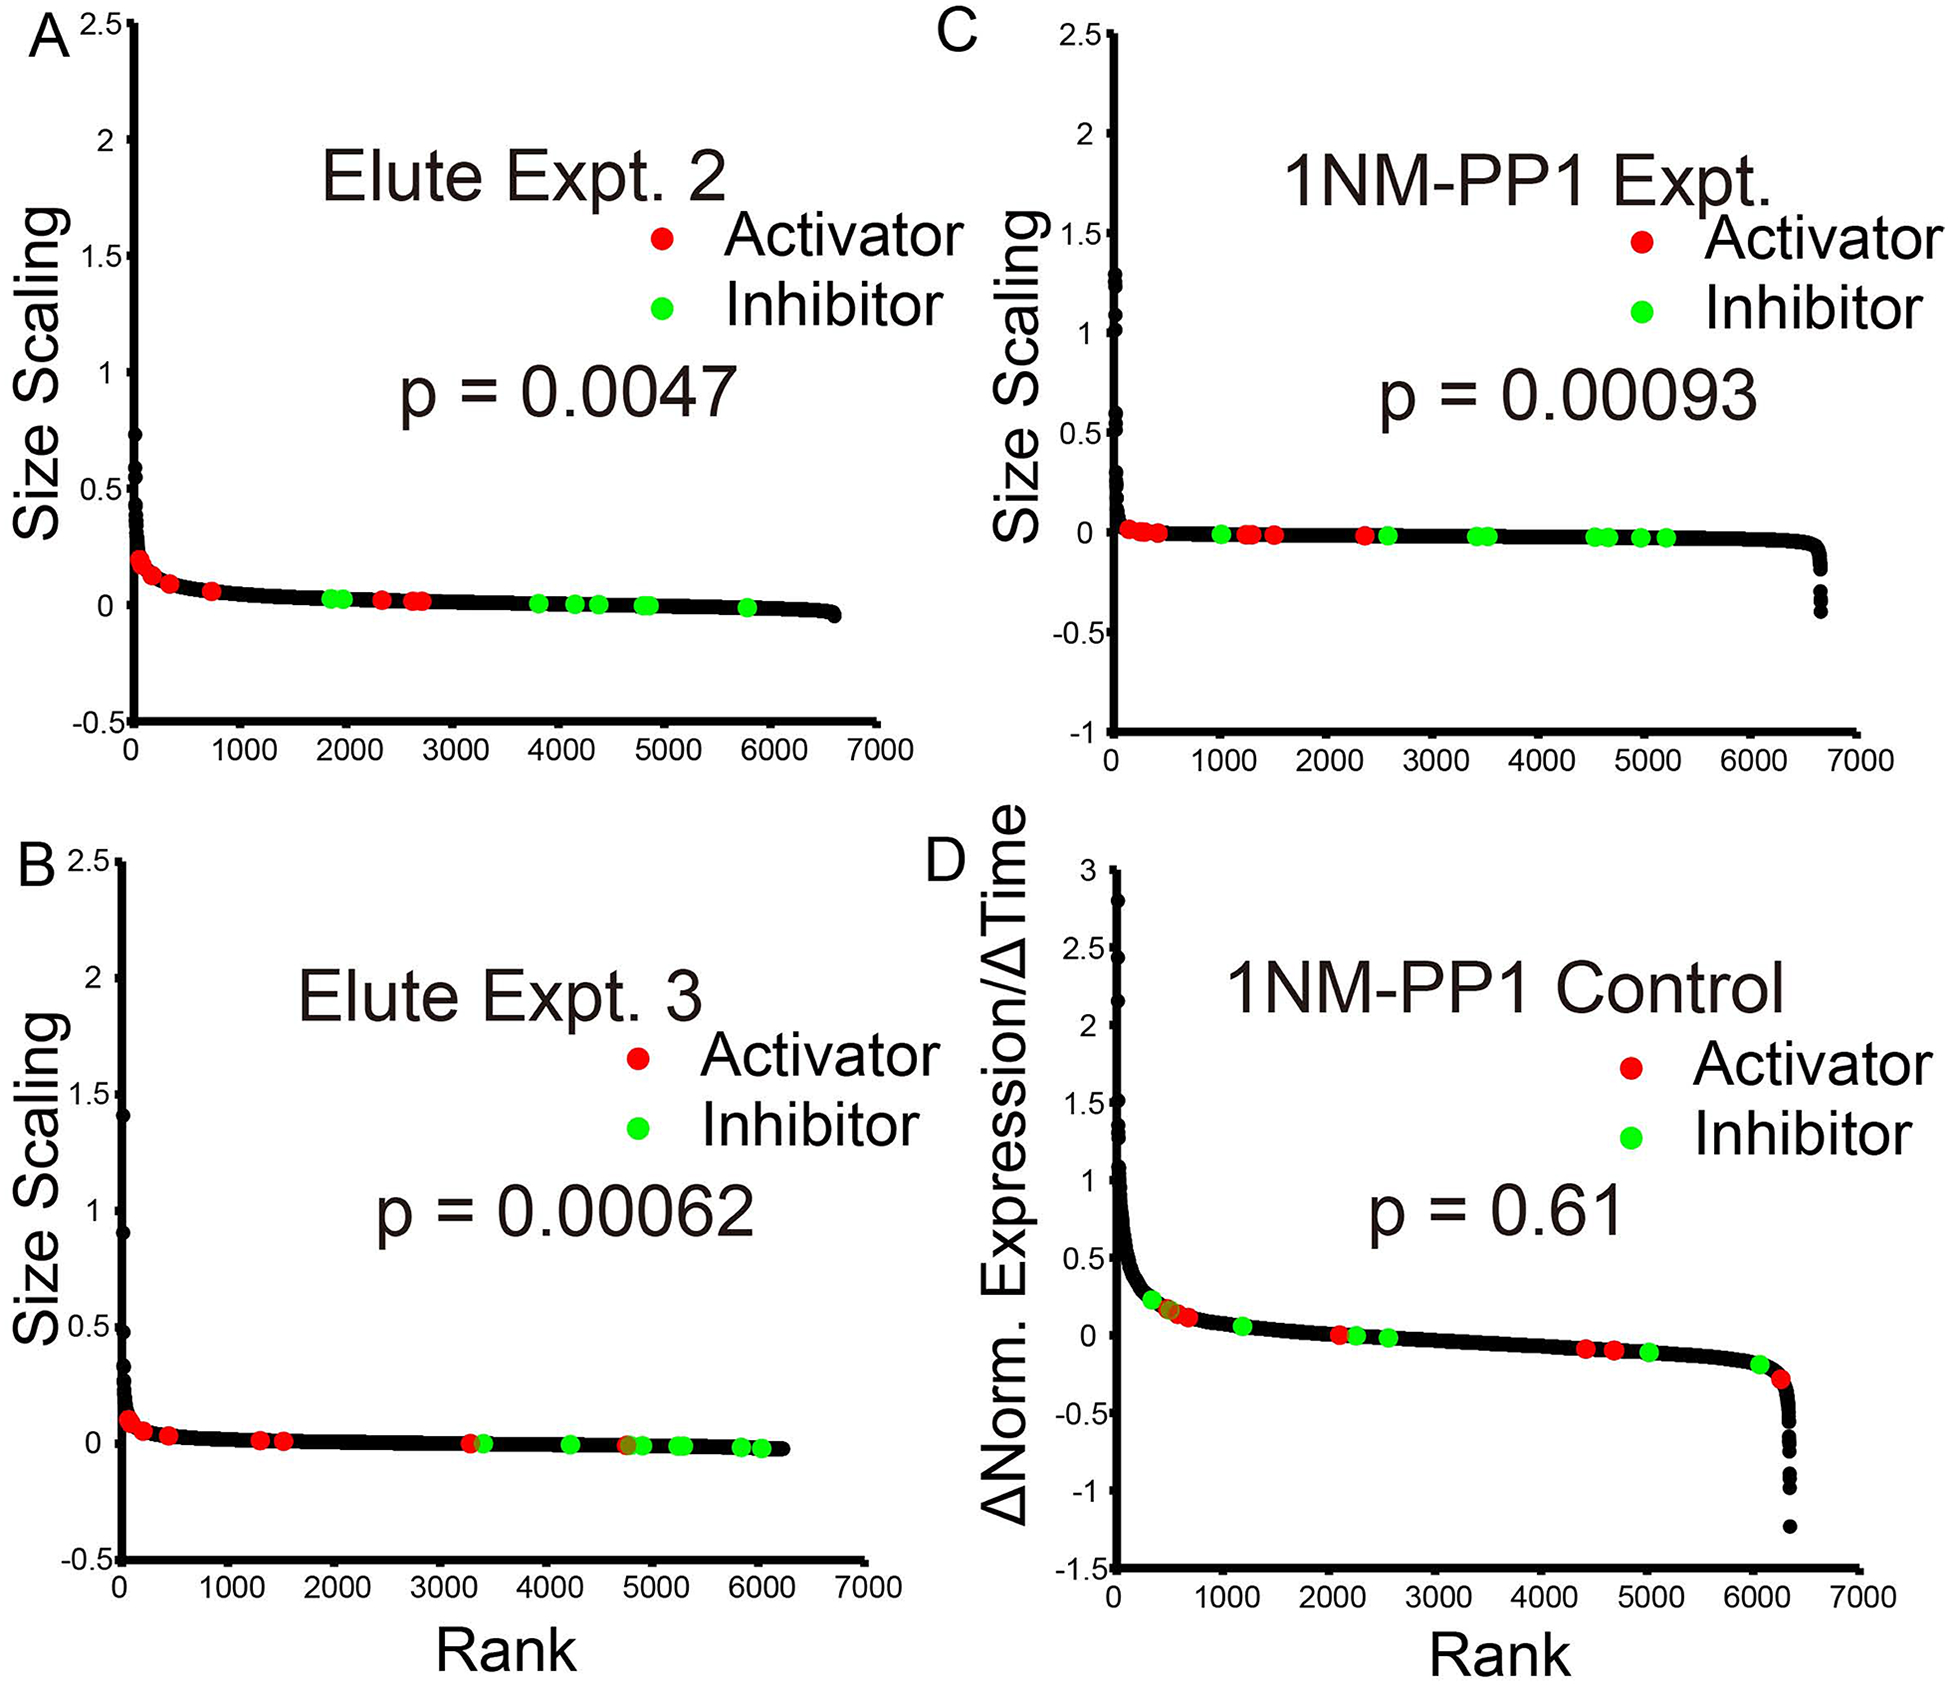
A. Elutriation expt. 2. Repeat of Elutriation experiment 1.
B. Elutriation expt. 3. Repeat of Elutriation experiment 1.
C. Alternative size-scaling experiment. cdc28-as cells were treated with 1NMPP1 to block cell cycle progress without additional manipulations. Samples were taken with time, characterized for cell size and cell cycle distribution, processed for RNA-Seq, and analyzed as in Fig. 2C (Materials and Methods).
D. Control. As panel 3C, but using WT CDC28 cells (not sensitive to 1NMPP1). The Wilcoxon p-values for separation of activators and inhibitors are shown.
An alternative approach did not use elutriation. We grew WT (control) or cdc28-as (experimental) cells in synthetic medium with 1% ethanol. In this slow-growth medium, most cells (>60%) were in G1. 1NMPP1 was added directly to the cultures without any other manipulations (this is the “+1NMPP1” experiment in Tables and Figures). In the presence of the drug, WT cells continued in the cycle without changing size, as expected. In contrast, the cdc28-as cells arrested in the cycle and increased in size. By flow cytometry, most arrested in G1, and some arrested in G2/M, with a near complete depletion of S-phase cells by 1 hour, as expected from rapid loss of CDK activity. We sampled, performed RNA-Seq, and analyzed the data as before. For the arrested, enlarging cdc28-as cells, the pre-chosen cell cycle activators were well-separated from cell cycle inhibitors (Wilcoxon p = 0.00093) (Fig. 3C). In contrast, these genes were not separated in the WT control (Wilcoxon p = 0.61) (Fig. 3D) (though again there was a surprising response of ribosomal protein and biogenesis genes).
We considered four possible artefacts. First, cell cycle regulation might somehow be conflated with size regulation. Cell Cycle Regulation Scores (Spellman et al., 1998) of the 16 genes are shown in Table S2A, where scores >5 show strong cell cycle regulation. Some genes show strong size dependence without cell cycle regulation (e.g., CDC28, BCK2, WHI2), while many genes that are strongly cell cycle regulated are not size regulated (e.g., histones).
Second, despite the CDK inhibitor and lack of budding, the cells might progress in the cycle in some sense, and induce cell-cycle genes. The first induced would be G1/S genes, which include the strongly regulated histone genes. However, the histone mRNAs are not over-expressed in the 51 fL sample and are distributed all along the scaling plot (Fig. S2), suggesting size-scaling is not a cell cycle effect.
Third, gene expression could be affected by stress. There are about 900 “Environmental Stress Response” (ESR) genes, ~600 repressed by stress, and ~300 induced (Gasch et al., 2000). Elutriation is somewhat stressful, and despite a 30 minute recovery period, cells might still be recovering from stress during the time-courses. Indeed, in the elutriation experiments, most ribosomal protein genes had positive size-scaling (Fig. S3); these are repressed by stress, and would have positive slopes during recovery. However, there are four reasons to think differential scaling is not primarily due to stress recovery. First, none of the 16 genes analyzed is amongst the 900 genes of the ESR. Although this does not exclude the possibility they might respond to stress, it suggests any such response is likely small. Second, the positive size-scaling slope of the ribosomal genes may be a surprising but specific response to 1NMPP1, since it occurs even in CDC28 strains without elutriation (Fig. S3F). Third, we analyzed the size-scaling slopes of the 900 ESR genes in the elutriation experiments (but excluding ribosomal protein and biogenesis genes). Although the repressed ESR genes did have slightly positive size-scaling, this slope was smaller (about three-fold, difference statistically significant) than the mean slope of the eight activators. It was difficult to compare the slopes of the inhibitors to the slopes of the induced ESR genes because of a large difference between these sets in the elutriation control—but this difference favored the idea that the negative slopes of the inhibitors were independent of stress. Fourth, we examined the ESR genes (excluding ribosomal proteins) in the experiment where cells were arrested by direct addition of 1NMPP1 without elutriation. Both the repressed and induced ESR genes had normalized size-scaling slopes of about zero. That is, there was no sign of stress, or recovery from stress, in this experiment. Nevertheless, the eight activators still scaled differently from the eight inhibitors (Fig. 3C).
Finally, we examined noise. mRNAs with few reads in the RNA-seq experiments would be noisy, and could give rise to the left-and right-hand tails. We plotted the median number of RNA-seq reads per gene versus scaling score (Fig. S4). Although as expected there was some enrichment of mRNAs with few reads at the high and low ends, the effect was small.
Size-scaling at the Protein level.
Changes in mRNA levels often predict changes in protein levels. Newman et al. compared changes in mRNA and protein expression for 2,223 yeast genes, and found only 21 instances (<1%) where a change in mRNA level failed to predict a change in protein (Newman et al., 2006). We likewise asked whether super- and sub-scaling of mRNA expression extends to the protein level. Cln3 was of special interest. Cln3 is difficult to visualize, because it is non-abundant with a short half-life. Here, we used split-GFP (Cabantous et al., 2005; Kamiyama et al., 2016) to tag Cln3 with 5 copies of GFP beta-strand 11, while an excess of GFP beta strands 1 through 10 was expressed elsewhere. In the split-GFP approach, the beta barrel of strands 1–10 pre-folds, then quickly binds strand 11 as it becomes available, and fluoresces, allowing visualization of short-lived proteins such as Cln3. We showed that a single copy of this split-GFP Cln3 was visible, behaved as wild-type in complementing the size phenotype of Δcln3, and was nuclear (compared to an ER marker) in all cell cycle morphologies (Chen and Futcher, in preparation).
To examine size-scaling of Cln3 protein, we constructed a strain with the split-GFP Cln3, cdc28-as, and a partly destabilized mCherry control protein. 1NMPP1 was added to exponentially growing cells to inhibit Cdc28-as. Cells quickly arrested with both budded and unbudded morphologies, and stayed arrested for the duration of the experiment (Methods and Materials). Samples were taken with time over 6 hours. Samples were assayed for cell size (which increased continuously), and by microscopy for morphology. For analysis of Cln3 protein scaling, GFP fluorescence of individual unbudded cells was examined from each sample. mCherry fluorescence was measured as a proxy for total cell protein; and cell cross-sectional area was assayed as a proxy for cell volume. Cells became much larger with time. Cln3 concentration increases with cell size (see cell images in Fig. S5A), whether cell volume is calculated by cross-sectional area (Fig. 4), or the mCherry proxy (Fig. S5B) or time after addition of 1NMPP1 (Fig. S5C).
Fig 4. Size Scaling at the Protein Level.
A. The split-GFP system.
B. Timecourse of GFP-Cln3 fluorescence after addition of 1NMPP1 (scalebar = 5 microns).
C. Quantitation of GFP-Cln3 and Whi3-GFP concentration as function of volume in unbudded cells in timecourse after arrest by 1NMPP1. Volume (arbitrary units) estimated from cross-sectional area of cells.
D, E, F. Western analysis of Cln2, Whi2, and Sic1 abundance after arrest by 1NMPP1. Samples (equal total protein) loaded in duplicate (technical replicate). Lane “C” is an untagged control. Arp7 and tubulin are controls.
See also Fig. S5.
Similar experiments were done with the inhibitors Whi3 and Whi5 (Fig. 4, Fig. S5C), showing decreasing concentrations with growth in unbudded cells, consistent with the negative scaling of their mRNAs, and consistent with (Schmoller et al., 2015). Whi3 was visualized with a GFP tag (Cai and Futcher, 2013) instead of split-GFP. Controls are shown in Fig. S5C.
Again using addition of 1NMPP1 to an asynchronous, cdc28-as culture, we examined scaling of the activator Cln2 and the inhibitors Whi2 and Sic1 by Western. (In this experiment, both budded and unbudded cells were assayed. The cell cycle state of the budded but CDK-inactive cells is unclear.) Cln2, an activator, had strong positive scaling, while Sic1, an inhibitor, had strong negative scaling (Fig. 4, quantitation in Fig. S5D). Both Cln2 and Sic1 expression was initially perturbed by addition of the 1NMPP1, as expected: for Cln2, expression drops initially because 1NMPP1 collapses the G1 cyclin/SBF positive feedback loop for Cln2 expression (Skotheim et al., 2008), followed by a CDK-independent increase in Cln2 expression as cells grow. For Sic1, there is an initial burst of expression as the transcription factors Swi5 and Ace2 enter the nucleus upon inhibition of CDK (Moll et al., 1991), followed by loss of Sic1 expression as cells grow. In the case of Whi2, however, we failed to see the predicted negative scaling. Overall, differential scaling was seen for five of the six proteins tested.
Other Size-Scaling Genes?
The tails of the size-scaling graphs (Fig. 2, 3) show hundreds of genes that may scale differentially with size. GO analysis showed that protein translation genes were enriched amongst super-scaling mRNAs. However, we saw a similar enrichment for the same genes in two control experiments (Fig. S3). This showed that although the ribosomal protein genes were co-ordinately regulated with each other, as is well-known, they were not co-regulated with cell size. One exploratory experiment where 1NMPP1 was not added (not shown) suggests that 1NMPP1 itself may induce protein translation genes, whether or not cdc28-as is present, and without inducing an ESR. We did not see enrichment for other GO terms.
We extracted the top 1000 genes (excluding ribosomal proteins) in each of the four experiments and asked which were in common, but were not in the top 1000 genes of the controls. There were 42 such genes (Table S3B) (7 false positives expected), with significant GO terms being “mitotic cell cycle process”, “mitotic cell cycle” and “mitotic nuclear division”. We found 170 genes common to the bottom 1600 (Table S3C).
Two of the size mutants examined in Fig. 1, spt4 and cdh1, had large CVs. spt4 has large cells, so genetically an activator, predicting super-scaling. cdh1 has small cells, so genetically an inhibitor, predicting sub-scaling. Indeed, in aggregate results (Table S4), the SPT4 mRNA super-scales with rank 1099, and CDH1 mRNA sub-scales with rank 5711 (placing it second only to WHI5 as a sub-scaling inhibitor).
Table S4 presents gene scaling scores, in individual experiments, and averaged over experiments.
Mechanisms of differential scaling.
What is the mechanism of differential size-scaling? We found a Spearman rank correlation of 0.36 between size-scaling and mRNA half-lives (using the top and bottom 1000 size-scaling genes). The mRNAs that scale fastest with size have the shortest half-lives (Fig. S6). Activators may be tuned to have short-lived mRNAs, so their abundance increases rapidly as cells grow and absolute synthesis rates increase, while inhibitors may be tuned to have long-lived mRNAs, so abundance lags changes in size. Essentially, abundance of short-lived mRNAs responds quickly to increasing absolute synthesis as cells grow, whereas abundance of long-lived mRNAs lags. PCA analysis suggests mRNA half-life could explain ~20% of the variance in the size-scaling RNA-seq data. Thus, there must be other factors.
A second mechanism could be transcription factor co-operativity. Once nuclear, transcription factors spend most of their time bound to DNA, partitioning between a small number of high-affinity sites and a large number of low-affinity sites (Bhattacherjee and Levy, 2014; Blainey et al., 2009; Halford, 2009; Hauser et al., 2016; Jen-Jacobson et al., 2000; Mahmutovic et al., 2015; Marcovitz and Levy, 2013; Marklund et al., 2013; Mechetin and Zharkov, 2014; Melero et al., 2011; Riggs et al., 1970; Slutsky et al., 2004; Zhou, 2011). Thus, the effective concentration of a transcription factor is the amount of transcription factor divided by the amount of DNA, with a modest adjustment for volume of nucleoplasm. In G1 phase, the amount of DNA stays constant, while transcription factor rises in proportion to total protein synthesis, which rises with cell size. Thus, as cells grow in G1, we expect effective concentration (i.e., TF/DNA) of most transcription factors to increase. This could dramatically affect gene expression for promoters with multiple transcription factor binding sites, and with co-operativity between transcription factor molecules either for binding or activation.
Two related yeast cell cycle transcription factors are SBF (Swi4 plus Swi6) and MBF (Mbp1 plus Swi6), and these are responsible for the late G1 induction of CLN1, CLN2, CLB5, and many other genes. We did genome-wide analysis of size-scaling versus number of SBF and/or MBF binding sites (Fig. 5) in promoters of SBF- and MBF target genes. Genes with no sites (most genes) scale just in proportion to size. But genes with two, three, or more sites scale increasingly rapidly with size. In fact, scaling is approximately exponential with number of sites (Fig. 5). Thus we hypothesize that as cells grow, the effective concentrations of transcription factors rise, and this can increase the expression of some target genes. This effect may not be limited to SBF/MBF; it could include Mcm1 (Fig. S7), which uses multiple binding sites to drive expression of CLN3 (Mai et al., 2002). Similarly, a repressive transcription factor could drive slower-than-size scaling.
Fig. 5. Size-scaling increases non-linearly with number of binding sites for SBF or MBF transcription factors.
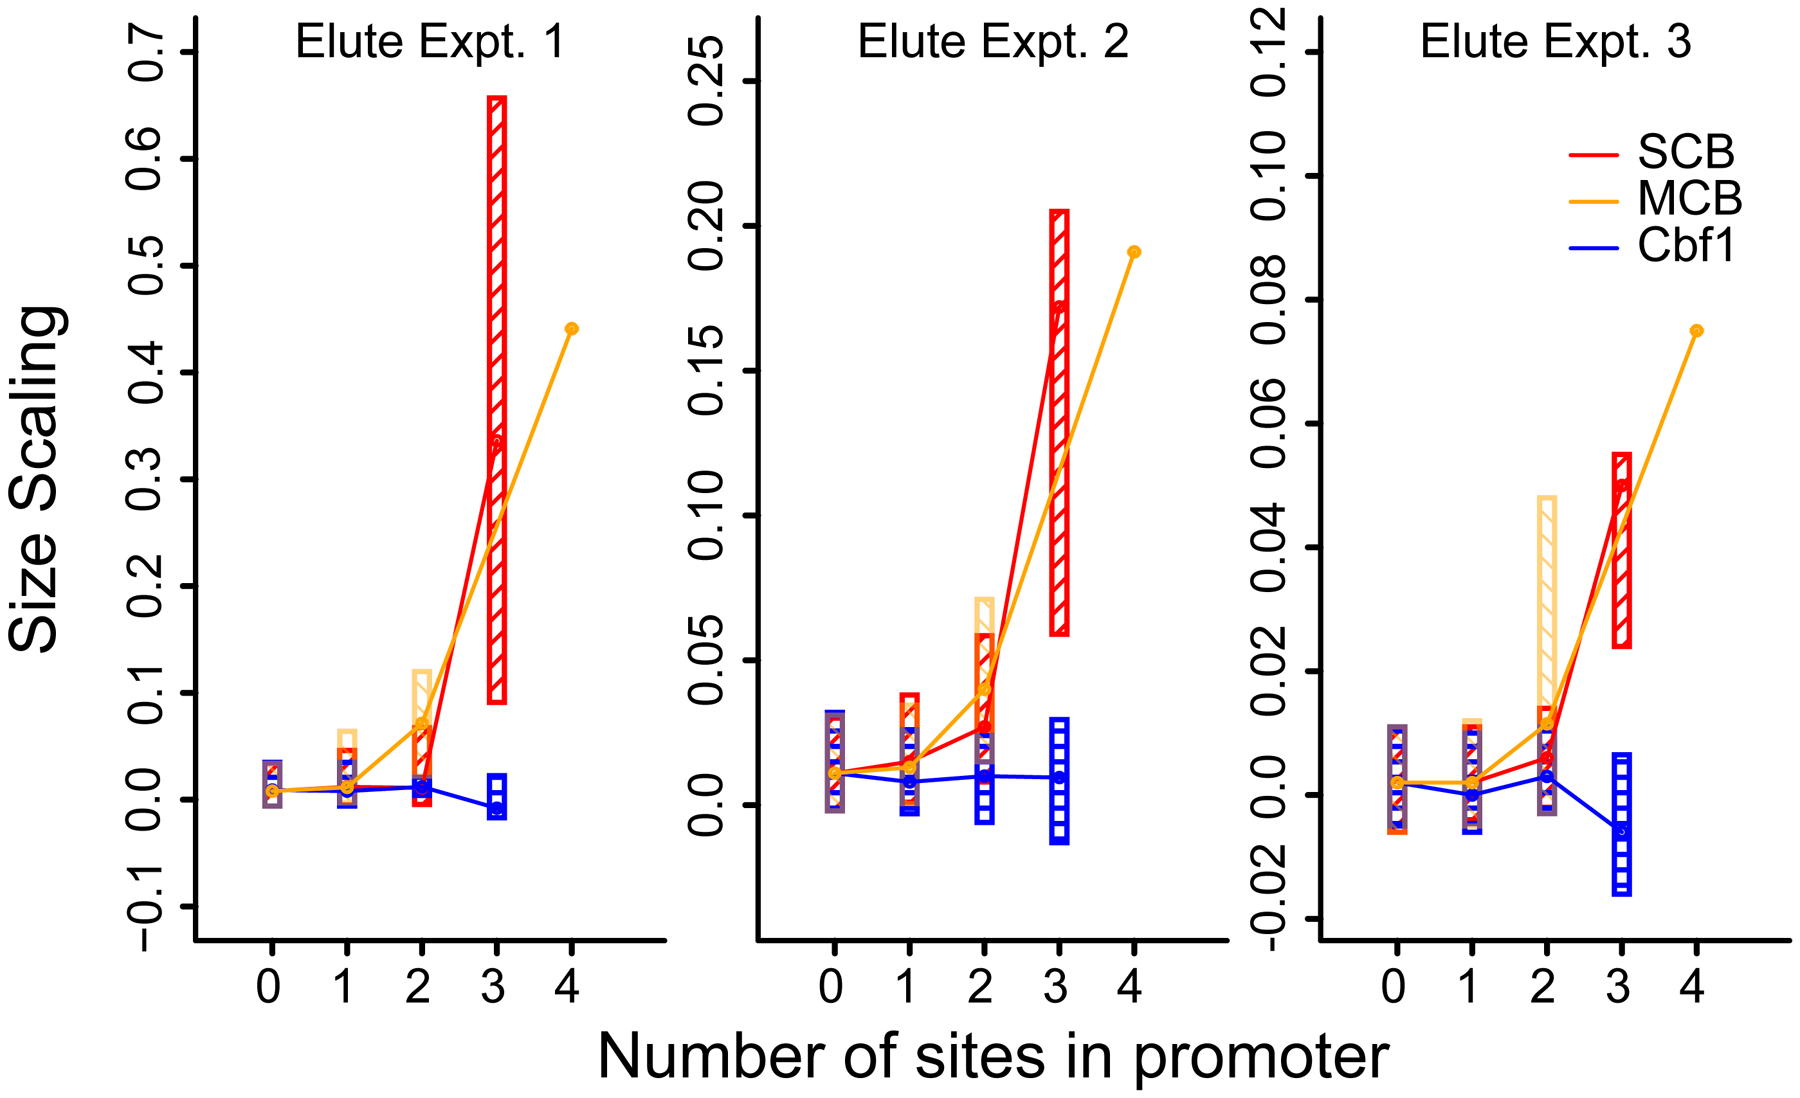
Transcripts were grouped by the number of transcription factor consensus sites in the promoter (x-axis). Promoters are defined as 300bp upstream of transcription start sites, defined as in Xu et al. (2009). SCB (grey) = “CACGAAA” or “CGCGAAA”. MCB (black) = “ACGCGT”. SCB sites were counted on both strands. MCB sites (palindromic) counted on one strand. The plotted boxes include the second and third quartiles of size scaling values. Lines connect medians. Only one gene contains 4 MCB sites. Results for a control factor, Cbf1 (CACGTG), are also shown.
Swapping ORFs between Activators and Inhibitors Confuses the Sizer.
We postulate that size homeostasis results from the way activators and inhibitors scale with size. An activator might scale incorrectly if expressed from the control regions of an inhibitor. Incorrect scaling of the activator might then lead to poor homeostasis.
We picked one cell cycle activator, CLN2, and one inhibitor, WHI5, with strong phenotypes. We “swapped” the two open reading frames (Fig. 6A). That is, we put the open reading frame of CLN2 inside the rest of the WHI5 gene, yielding WHI5pr-CLN2, and, vice versa, put the open reading frame of WHI5 inside the rest of CLN2 gene, yielding CLN2pr-WHI5. We then made yeast strains with WHI5pr-CLN2 integrated at the native WHI5 locus (whi5::WHI5pr-CLN2), or with CLN2pr-WHI5 integrated at the native CLN2 locus (cln2::CLN2pr-WHI5), or with both swapped genes.
Fig. 6. Swapping ORFs between an activator and inhibitor confuses the sizer.
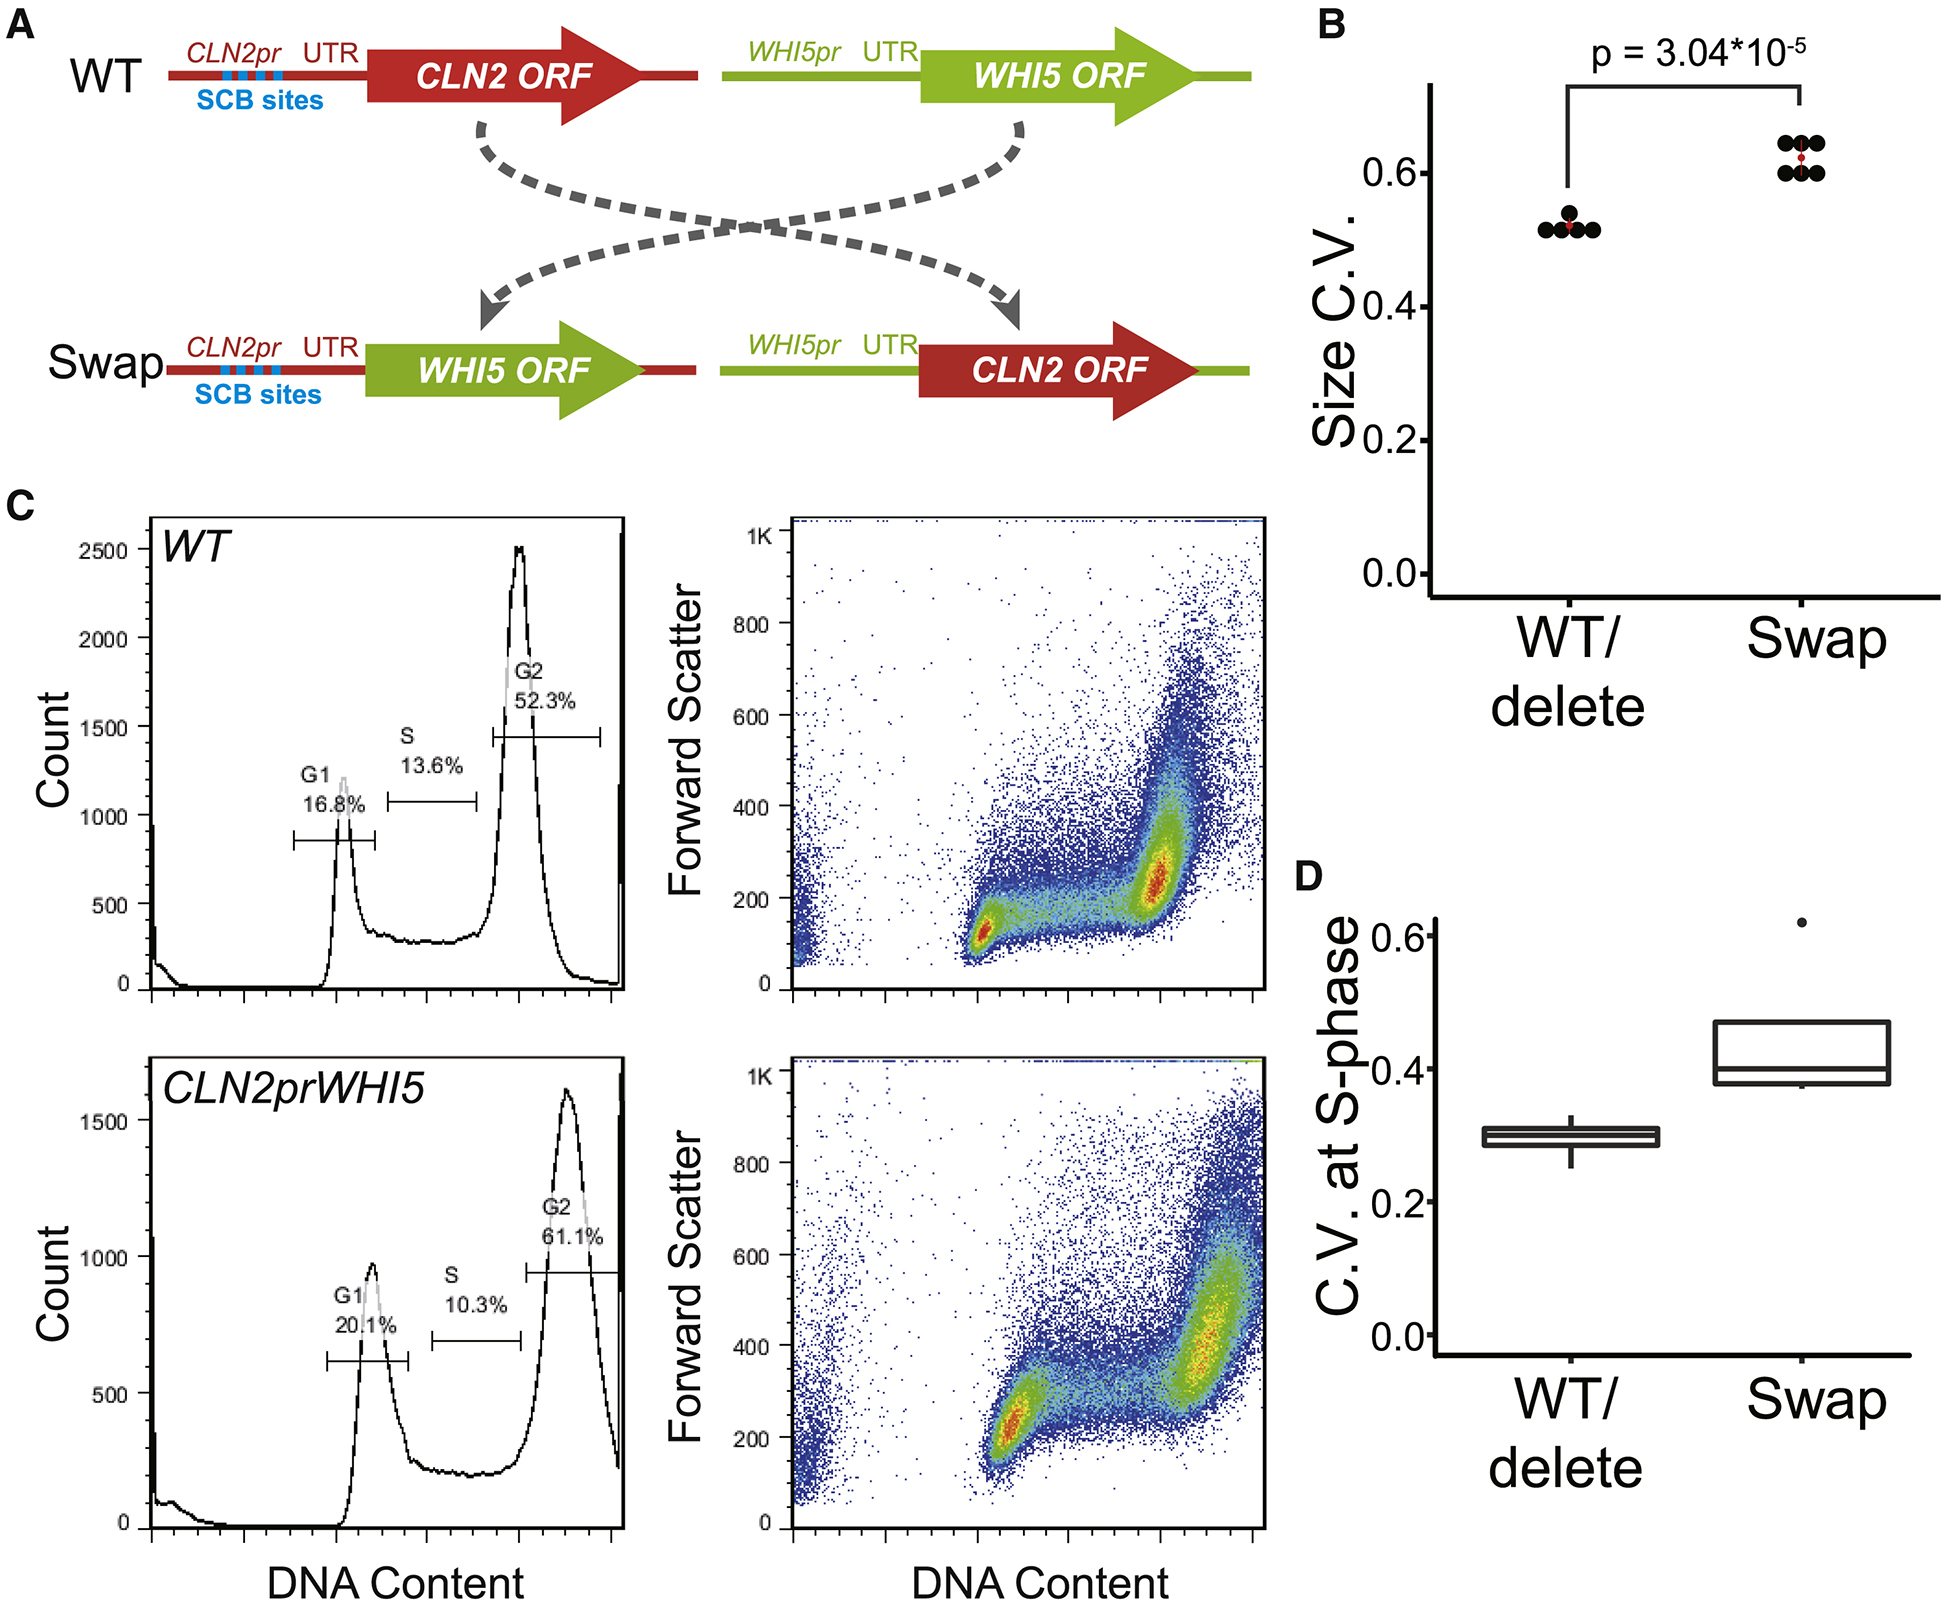
A. Loci in the “swap” experiments.
B. Size distributions of growing cells were measured using a Coulter Channelizer. CVs of two wild-type strains, and one strain each of cln2, whi5, and cln2 whi5 were aggregated as “WT/delete”. Two whi5 cln2::CLN2pr-WHI5 strains, and one strain each of cln2 whi5::WHI5pr-CLN2, cln2::CLN2pr-WHI5 whi5::WHI5pr-CLN2, cln2::CLN2pr-WHI5, and whi5::WHI5pr-CLN2 were aggregated as “Swap”.
C. Representative flow cytometer plots of WT and CLN2pr-WHI5. Left shows gating. Right shows size vs Sytox Green.
D. CVs of gated S-phase cells. WT, cln2, whi5, cln3, cln2 whi5 were aggregated as “WT/delete”; cln2::CLN2prWHI5 whi5::WHI5prCLN2, cln2::CLN2prWHI5, and cln2::CLN2prWHI5 whi5 were aggregated as “Swap”.
See also Table S5.
We used two methods to measure coefficients of variation. First, we used Coulter Z2 volume measurements of populations. WT, cln2, whi5, and cln2 whi5 strains had similar coefficients of variation of about 0.52. In contrast, the double “swap” mutants had a coefficient of variation of 0.64 (Fig. 6B, Table S5A). Even when only one swap was used, i.e. cln2 whi5::WHI5pr-CLN2 or whi5 cln2::CLN2pr-WHI5, the coefficient of variation was about 0.63. The strains that had at least one “swap” allele had coefficients of variation significantly higher than WT or deletion mutants (t-test p = 3.05 × 10⁻⁵) (Fig. 6B, Table S5A).
Second, we used flow cytometry to assay cell sizes in S-phase (Fig. 6C, D, Table S5B). In cells with good size-control, Start generates a tight size distribution at S-phase; whereas in cells with poor size-control, the size distribution of cells entering S would be broader. We assayed WT, cln2 and whi5 deletion mutants, and swap mutants. The fluorescence signal from Sytox green staining allowed gating for cells in S-phase. We used forward light scatter as a single-cell estimate of cell size. As shown in Fig. 6C and D, cln2::CLN2pr-WHI5 mutants have a higher coefficient of variation of cell size in S-phase than deletion mutants or wild-types (t-test p = 0.0038) (Table S5B). C.V.s of the cln2 and whi5 deletion mutants were not different from WT (t-test p = 0.20).
Discussion
Surprisingly, at least 30 of 32 classic cell size mutants have wild-type size homeostasis, in the sense that the normalized widths of the cell size distributions are similar to wild-type. This highlights a gap in our knowledge of cell size control. We have some understanding of regulators determining mean cell size (the “set point”), but not an understanding of size variance. This is connected to a lack of mechanistic understanding of how changes in cell size affect probability of cell cycle entry.
A related fundamental issue is how gene expression scales with cell mass. We used RNA-seq on growing cells arrested in the cell cycle to measure how abundance of every mRNA scales with cell mass. Most mRNAs scaled almost proportionally to cell mass. However, there were also genes that repeatably scaled faster or slower. Cells have evolved gene expression programs responding to hundreds of environmental stimuli. Since every cycling cell experiences changes in mass, it may not be surprising if there are gene expression programs responding to mass.
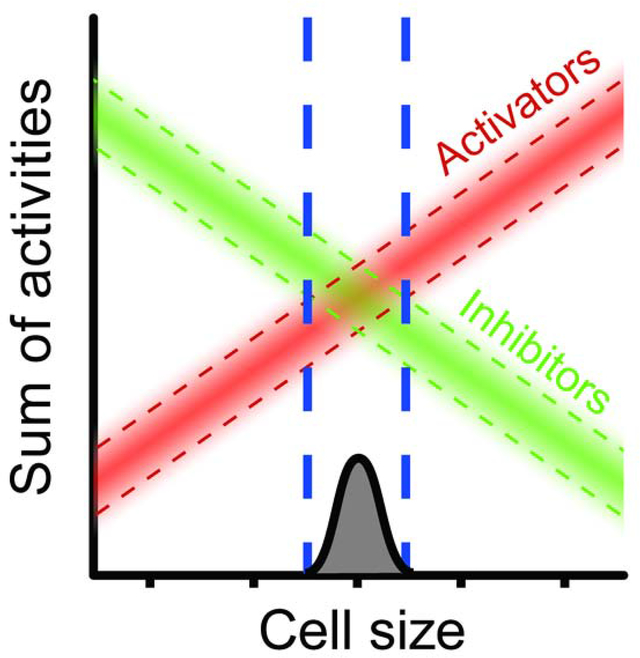
We pre-selected eight cell cycle activators and eight inhibitors. The activator mRNAs tended to scale faster-than-size, while the inhibitors scaled slower-than-size. This differential scaling implies an obvious size control model: At small cell sizes, inhibitors dominate, and prevent cell cycle entry. As cells grow, activators scale faster than inhibitors, until at some sufficiently large critical size, the activators dominate. This now triggers cell cycle entry. Homeostasis is achieved by whatever mechanism is responsible for differential, size-dependent scaling of mRNA abundance, setting the slopes of activator and inhibitor scaling.
This model is related to the insightful “Whi5 inhibitor dilution” model of Schmoller et al. (Schmoller et al., 2015). Like Schmoller et al., we find that WHI5 synthesis (in our case, at the mRNA level) does not keep pace with growth—that is, Whi5 is diluted by cell growth. However, we suggest there are many regulators, both activators and inhibitors, systematically changing in concentration, rather than one. Second, we focus on cell size heterogeneity--the width of the cell size distribution. We note that a whi5 null mutant retains a wild-type cell size distribution (normalized for mean) (Fig. 1), demonstrating that WHI5 alone cannot account for size homeostasis. Whereas the model of Schmoller et al. can account for the “set point”—the mean of the size distribution—our model can account for the breadth.
In our model for size homeostasis (Fig. 7), the width of the size distribution depends on the slopes of the activators and inhibitors. Steep slopes will lead to a narrow cell size distribution, while shallow slopes will lead to a wide size distribution. Absence of an activator (e.g., a cln3 null mutant) usually would not significantly affect slope, and so would not greatly affect the size distribution, but it would shift the entire activator line downwards (Fig. 7, middle). The remaining activators would now overcome the inhibitor only at a larger cell size. That is, deleting CLN3 or other activator would produce larger cells, but with a nearly wild-type coefficient of variation. Deleting an inhibitor would have the opposite effect: smaller cells, with nearly wild-type CV.
Fig. 7. Model of Cell Size control.
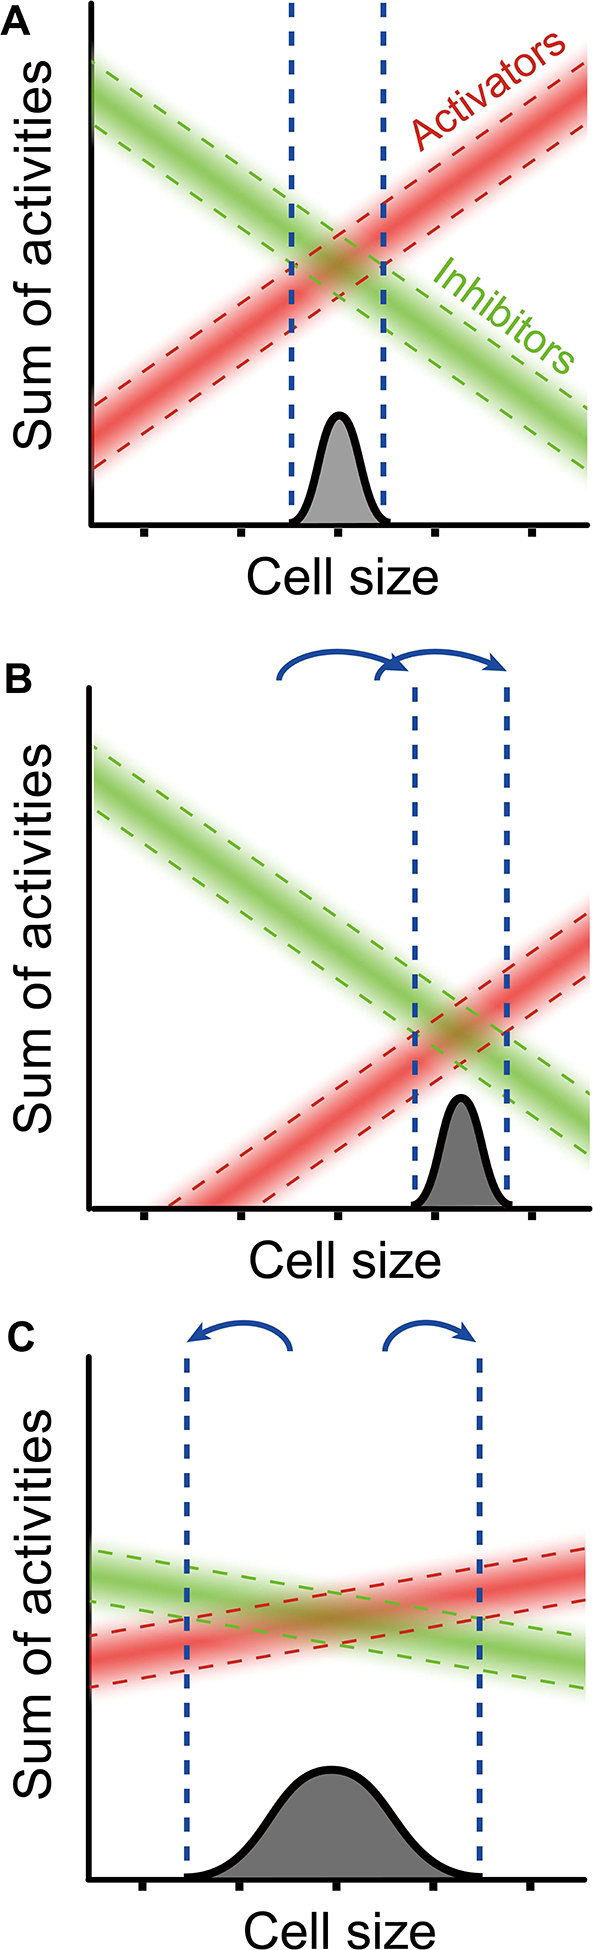
A. Wild-type. Activators (red) increase in concentration with cell size, while inhibitors (green) decrease. Start occurs when activators predominate over inhibitors. Variation in expression of activators/inhibitors causes a range of sizes for Start.
B. cln3 null mutant. Total activator activity decreases in cln3 cells, but it is assumed that the average slope of remaining activators does not change significantly. Critical size becomes larger, but no more variable.
C. Size control where the slopes for size-scaling are shallow. With shallow slopes, variation leads to Start at a wider range of sizes. Critical size remains wild-type, but variability increases. Slopes would change if the mechanism linking gene expression to size changed.
However, an activator that scales slower-than-size, or an inhibitor that scales faster-than-size, should flatten the slopes of the overall activator or inhibitor lines, and make it more difficult for the cell to discern critical size (Fig. 7, bottom). Indeed, in the “swap” experiments, cell sizes showed a significantly increased CV for cell size. A caveat with this experiment is that we have not yet shown that the “swapped” genes indeed scale in a novel way.
This “team activator vs team inhibitor” model allows many activators and inhibitors to contribute. This explains the awkward fact that key cell cycle regulators in one organism (CLN3, WHI5, BCK2 of S. cerevisiae, pom1, wee1, cdc25 of S. pombe) are often not key regulators in other organisms and may not even be present. If size homeostasis depends on many activators and inhibitors, often no one regulator will be critical, and the system can evolve to suit the needs of the organism and the challenges of environment. Highly redundant effectors of homeostasis could help explain why S. pombe cdc13-cdc2AF mutants have high CVs for size, and yet retain strong size control (Wood and Nurse, 2013). This model could even be applicable to bacterial division.
What is the mechanism of differential scaling? Some differential scaling may be due to the transcription factor/DNA ratio. Because DNA content stays constant through G1, while transcription factor amounts typically rise in proportion to cell mass, the ratio of a transcription factor to its binding sites will rise as a cell grows. Promoters with different numbers of binding sites could differentially scale if there is co-operativity (Dorsey et al., 2018; Wang et al., 2009). Consistently, genes controlled by the SBF/MBF transcription factor (e.g., CLN1, CLN2) scale in a way that depends on the number of binding sites. Other transcription factors with multiple binding sites might also lead to size-scaling.
Ploidy affects cell size, and yeast of different ploidies have been compared by RNA-seq (Wu et al., 2010). Modest effects on gene expression were found, which do not correlate with the effects found here (Spearman correlation = 0.03). Cell sizes changed in both cases, but in Wu et al., the size-to-DNA ratio was constant, while in our study, the size-to-DNA ratio increased. The lack of correlation between these two datasets suggests that scaling is affected by size-to-DNA ratio, rather than size as such.
Finally, while we have focused on size-scaling at the transcriptional level, there could also be mechanisms that operate at translational and other levels. Size-scaling could affect many processes in addition to the cell cycle.
STAR Methods
LEAD CONTACT AND MATERIALS AVAILABILITY
Further information and requests for resources and reagents should be directed to and will be fulfilled by the Lead Contact, Dr. B. Futcher (bfutcher@gmail.com). All unique/stable reagents generated in this study are available from the Lead Contact without restriction.
EXPERIMENTAL MODEL AND SUBJECT DETAILS
The experimental model system was Saccharomyces cerevisiae.
Experiments measuring the coefficient of variation of cell size (e.g. Fig. 1) used deletion mutants in the BY4741 background (MATa hisD1 leu2D0 met15D0 ura3D0). These were obtained from the Yeast Deletion Set, currently available from Horizon Discovery (horizondiscovery.com).
Other experiments used strains developed in the course of this work in the GZ prototrophic background (Zhao et al. 2016). The genotypes of these strains are given in the Key Reagents table.
Yeast were cultured in standard YEP media (1% yeast extract, 2% peptone), or in standard Synthetic Nitrogen Base media. Carbon sources were either 2% D-glucose or 2% ethanol, as indicated. In some cases cells were grown with 2% filter-sterilized raffinose as the carbon source prior to induction of GAL promoters with an additional 2% filter-sterilized galactose. Cells were cultured at 30°C.
METHOD DETAILS
Measurements of cell size distributions
Cells were grown in YEPD overnight then 1:50 diluted with fresh medium and incubated at 30°C for additional 5–6 hours until the cells were in early exponential phase (5*106 to 2*107 cells/ml). Cells were briefly sonicated. Cell distributions were measured and exported into Beckman-Coulter files with a Z2 Beckman-Coulter Counter. A custom Perl script was used to extract the size distributions from the exported Beckman-Coulter Counter files and to calculate Coefficient of Variation of cell size. The extracted cell size distributions were analyzed with a custom R script that performed Box-Cox transformation. Scripts are available at https://github.com/yupchen/sizer-paper. Fig. 1E contains data for rpa49Δ, ygr151cΔ, rsr1Δ, gpa2Δ, pih1Δ, ssf1Δ, kel1Δ, cdc10Δ, swe1Δ, rpa14Δ, hxk2Δ, lge1Δ, kap122Δ, jjj1Δ, whi6Δ, rpl34bΔ, scp160Δ, prs3Δ, ycr061wΔ, ptk2Δ, pho5Δ, and tom1Δ, which were obtained from the yeast haploid deletion collection. Fig. 1E also contained data for stb1Δ, whi5Δ, bck2Δ, cln3Δ, 4XWHI3 and whi3Δ, which were strains previously generated in the lab (Cai and Futcher, 2013; Nash et al., 1988; Nash et al., 2001; Wang et al., 2009). Note that the cln31 deletion strain in the standard yeast deletion set may not be correct.
In Fig. 6B, WT (YC31–1c), WT (GZ238), cln2 (YCT02), whi5 (YCT01), and cln2 whi5 (Y31–2a) were aggregated as “WT/delete”. cln2 whi5::WHI5pr-CLN2 (YC32–2d) and whi5 cln2::CLN2pr-WHI5 (YCT33–2c), whi5 cln2::CLN2pr-WHI5 (YCT33–1d), cln2::CLN2pr-WHI5 whi5::WHI5pr-CLN2 (YC34–1a), cln2::CLN2pr-WHI5 (YCT04) and whi5::WHI5pr-CLN2 (YCT03a) were aggregated as “swap”. These strains are in the GZ background (Zhao et al., 2016)
Elutriation size experiments (Fig. 2, 3)
cdc28-as cells were grown to early exponential phase in filtered YEP medium with 1% ethanol, then collected by centrifugation using two 40 ml chambers in series and sonicated. Small unbudded G1 cells were isolated by centrifugal elutriation at room temperature, then diluted with the clarified original medium. After 30 minutes recovery at room temperature, the first sample was taken (“0 time”), and 2.5 μM (final concentration) 1NMPP1 in DMSO was then added to the culture to block CDK activity, and cultures were shifted to a shaking 30°C air incubator. Depending on the experiment, a second dose of 2.5 μM 1NMPP1 was added 3.5 or 4 hours after the first dose (Expt. 2, 112415 3.5 hours, Expt. 3. 022616 4 hours). Cell sizes were monitored with Beckman-Coulter Counter Z2. Budding indicies were measured with a microscope. Samples were harvested for RNA-seq, with cell numbers measured with Beckman-Coulter Counter.
For the elutriation control, an isogenic CDC28 strain was processed similarly. Cells were loaded into the elutriation chambers (two 40 ml chambers in series) as for the experiments above, but cells were held at constant rpm and pump speed inside the chamber for 30 min (the time when the first sample was removed in the three experiments above). After 30 min., the centrifuge was shut off, while pump speed was maintained, and all cells from the chamber were collected. Cells were diluted into clarified original medium as above. 1NMPP1 in DMSO was added as above to a final concentration of 2.5 μM. Samples were taken with time (approximately the same times as for the elutriation experiments above), and samples were processed for RNA-Seq.
1NMPP1 Size Experiments (Fig. 3)
YC18–2a (cdc28-as, 1NMPP1 Expt.) or GZ240 (isogenic CDC28 WT, 1NMPP1 control) were grown in synthetic minimal media with 1% ethanol as carbon-source (“SM-EtOH”; 1.7% yeast nitrogen source without amino acids, 5% ammonium sulfate, 1% ethanol) at 30°C to log-phase (2*107 cells/ml, doubling time ~ 5 hours). 1NMPP1 in DMSO was added to a final concentration of 2.5 μM to each culture. A sample (~35 ml) was taken immediately before addition of 1NMPP1, and then every 1.5 hours afterwards. For every sample, 30 mL of the sample was immediately mixed with 30% by weight ice, put on an ice-water slurry, then spun down and frozen at −80 °C for RNA-seq library preparation. 1 mL of the sample was fixed with ethanol (70% ethanol final concentration) for flow cytometry; a third portion (0.5 mL) was immediately pulse sonicated, assayed on a Coulter Counter for cell size distribution and cell number and observed under the microscope for budding index.
RNA-seq
Each time course sample from the elutriation experiment was infused with a known amount of Candida albicans standard prior to RNA extraction. The Candida albicans strain BWP17 was grown over-night in YEPD supplemented with 80 μg/ml uridine. Cells were diluted 1:50 the next day and allowed to grow to early exponential phase with cell concentration of 1*107 cells/ml measured by Beckman-Coulter Counter. Cell size distributions were recorded. Cells were spun down, washed twice with ice cold H2O and aliquoted into 1/10 the cell number of one S. cerevisiae sample and frozen at - 70°C. Prior to RNA extraction, the frozen pellets of S. cerevisiae and C. albicans were thawed on ice. Each S. cerevisiae sample was resuspended in TES buffer and transferred to one tube containing C. albicans. The reagents and cells were well mixed. Then the samples were processed with hot phenol RNA extraction method described in Collart and Oliviero (2001). RNA-seq libraries were prepared with the Ovation Universal RNA-Seq System (NuGEN). Once past quality control on an Agilent Bioanalyzer, the libraries were multiplexed, and sequenced using Illumina machines. The sequencing reads were aligned to the yeast genome using Bowtie2, rRNA reads were removed with custom perl scripts and RPKM values were measured using SeqMonk. The RPKM value for each sample was normalized to the first sample of the same time-course by division using R (http://www.Rproject.org). The linear regression of normalized RPKM values against cell size were calculated using R to yield a slope (see below). BAM files from RNA-Seq have been deposited at GEO (GSE145206)
Calculation of slopes (i.e., scaling scores)
The scaling score is the slope (linear fit) of the line obtained by plotting [RPKM(sample i) divided by the RPKM(sample 0)] against [size (fL) in sample i] in each timecourse experiment, generally for samples i = 0, 1, 2, 3, 4. In control experiments with no cell cycle arrest and no change in size, [RPKM(sample i)/RPKM(sample 0)] is plotted against time. RPKM is the ratio of (the number of reads mapped to one gene) to (the total number of reads mapped to the genome) divided by the kilobase length of the gene, where all identical reads are considered as one read and the reads mapped to ribosomal DNA loci are discarded. Any reads that overlap (including partial overlap) the coding sequence of a gene are considered as reads mapped to that gene.
Slopes (scaling scores) calculated in this way have a median score of ~0, but they are not symmetrical around 0; instead, the absolute values of positive slopes are larger than those of negative slopes. Also, the slopes are not distributed normally.
Experiments for measurement of protein scaling.
For measurement of protein by Western analysis, the cells used carried a cdc28-as mutation and a tagged gene (CLN2–3xHA (derived from (Tyers et al., 1993), or SIC1-TAP or WHI2-TAP (acquired from Horizon Discovery (horizondiscovery.com), (Ghaemmaghami et al., 2003). The double mutant cdc28-as, tagged gene combination was produced by crossing.
Cells were grown to ~ 1 × 10^7 cells per ml in 250 ml YEPD at 30°C. At zero time, a sample of 80 ml was taken by pouring cells into two 50 ml tubes each containing 10 ml ice. After chilling to 0°C, cells were pelleted by centrifugation, washed and transferred to a 1.5 ml tube, flash-frozen, and stored at −75 °C. Also at zero time, 1NMPP1 in DMSO was added to a final concentration of 10 μM, and 50 ml of fresh, pre-warmed (30°C) YEPD, also containing 10 μM 1NMPP1, was added to the culture flask, such that the flask now contained 220 ml. This procedure was repeated every 90 minutes until 5 samples had been taken (that is, 50 ml of prewarmed medium containing 10 μM 1NMPP1 was added every 90 minutes, immediately following removal of a 50 to 80 ml sample). Later samples used a somewhat smaller volume of cells, but a larger biomass. Cell density (cells/ml) and cell size (mean, median, and mode) was tracked throughout the experiment using a Coulter Counter Z2, and the number of budded and unbudded cells was assayed for selected samples by microscopy.
There was some cell division between the 0 and 90 minute sample, but no cell division thereafter. Because of the dilution every 90 minutes, the number of cells per ml decreased at every sample after 90 min, but biomass per ml increased. Mean, median, and mode cell size increased at every sample, and by 6 hr mode cell size had increased about 5-fold, with mean and median cell sizes showing similar increases. At 0 time, 30% to 40% of the cells were unbudded (the percentage of unbudded cells is relatively low in these cultures because of the cdc28-as mutation). By 90 minutes after addition of 10 μM 1NMPP1, the percentage of unbudded cells rose to about 50% to 55%, which stayed constant for the duration of the experiment. Cell morphology at 6 hr became aberrant in some strains.
The cell cycle status of the budded cells in these experiments is unclear. These cells were in S, G2, or M when the 1NMPP1 was applied. But because of the 1NMPP1, the cells should have little or no CDK activity (similar to a G1 cell).
Immunochemistry.
Frozen yeast cell pellets were thawed on ice and resuspended in aqueous lysis buffer (50 mM Tris-HCl pH 7.5, 150 mM NaCl, 0.5% Triton X-100, 5 mM EDTA, 50 mM NaF) containing 1 mM PMSF (Sigma) and cOmplete protease inhibitor cocktail (Roche). Cells were lysed by beating with zirconia beads (0.5 mm) for 2 cycles of 40 sec (4.5 m/sec) on a bead beater (MP FastPrep-24), each followed by two minutes incubation on ice. The resulting homogenate was cleared by centrifugation at 14,000 rpm for 10 minutes at 4°C. The supernatant (whole cell extract: WCE) was used for the determination of total protein content and immunoblot analysis. The total protein concentration in the WCE was determined by Bradford 1x dye reagent (BioRad).
Yeast WCE samples were mixed with equal volume of 2x Laemmli protein sample buffer (BioRad) pre-mixed with reducing agent 2-mercaptoethanol (1/20 v/v) and heated at 95°C for 5 min. Samples were briefly centrifuged and then loaded (15–20 [g total protein in each sample) on a 10% SDS–polyacrylamide gel. 6 μl of Precision Plus Protein™ Dual Color standards (Bio-Rad) were loaded in each gel run. Electrophoresis was performed using constant voltage (200V) at room temperature in 1X Tris/Glycine/SDS buffer (BioRad) until the dye front reached at the bottom of the gel. Proteins were transferred to Immun-Blot LF PVDF membrane (BioRad) using 1x Tris/Glycine buffer in a Mini Trans-Blot® Electrophoretic Transfer Cell (BioRad) connected to 100V for 1 hour at 4°C. Proteins on the PVDF membrane were visualized by staining for 3 min with Ponceau S solution (Sigma). The blot was destained by washing 3x with deionized distilled water for 5 minutes prior to incubating with intercept TBS blocking buffer (LI-COR) for one hour on a rocker at room temp. For the immunodetection of proteins, the blot was incubated with primary antibodies (HA Tag Recombinant rabbit polyclonal antibody (8HCLC: Invitrogen) for Cln2 3xHA; TAP Tag rabbit polyclonal antibody (CAB1001:Invirogen) for Sic1-TAP or Whi2-TAP; Anti-Arp7 goat polyclonal antibody (Santa Cruz Biotechnology) for Arp7; Anti-tubulin mouse monoclonal for tubulin) diluted in TBS buffer containing 0.1% Tween-20 overnight at 4°C. After washing 3× 5 min with TBST, the blot was then incubated with the secondary antibodies labeled with spectrally-distinct NIR fluorescent dyes (Donkey anti-mouse IRDye 800CW or Donkey anti-rabbit IRDye 800CW or Donkey anti-goat 680RD from LI-COR) at a dilution of 1/10,000 in TBST for one hour at room temp. The fluorescence signal was recorded by scanning the blot on LI-COR Odyssey CLx set to auto for both 800 and 700 channels. The quantitative analysis of data was done using Image Studio Lite Ver 5.2.
Measuring protein abundance by fluorescence.
The split-GFP system was used (Cabantous et al., 2005; Kamiyama et al., 2016). Five copies of beta-strand 11 of GFP (Key Resources) was appended to the N-terminus of Cln3, with short linkers between the beta strands. This was done by PCR amplification of the 5xGFP(strand 11)_CLN3 fusion from plasmid pRS426_GAL1_sc5xGFP11_CLN3 (Key Resources), and homologous integration at the native CLN3 locus (marker free) after cutting the native locus using CRISPR-Cas9. pRS426_GAL1_sc5xGFP11_CLN3 was created by cloning synthetic DNA into pRS426. The synthetic 5xGFP(11) sequence fused to CLN3 was:
ATGGGATCAGGAGCGACAGCATCAGGGACAGCTAGTGGCCGTGACCATATGGTTTTACATGAATACGTGAATGCTGCCGGCATTACAGGTAGTGGTGCAACTGCATCTGGTACAGCATCTGGAAGAGATCATATGGTCCTACATGAGTACGTAAATGCGGCGGGTATAACAGGTAGCGGCGCTACCGCTTCTGGAACCGCCAGTGGCCGTGATCATATGGTCCTACACGAATATGTTAATGCAGCGGGTATTACAGGGTCAGGCGCAACGGCCTCTGGTACTGCTAGCGGCAGGGATCACATGGTTCTTCACGAATACGTCAATGCAGCTGGGATTACCGGTTCAGGTGCCACCGCCTCTGGAACTGCGAGTGGCAGGGATCATATGGTCTTGCATGAGTACGTTAACGCCGCGGGTATCACC
Similarly, 6 copies of beta-strand 11 of GFP (RDHMVLHEYVNAAGIT) were appended to the C-terminus of Whi5 at its native locus (but in this case with a histidine selectable marker further downstream), with 7 a.a. linkers between the beta strands, using the 6xGFP(11) synthetic sequence in plasmid Pap_6GFP_HIS5 (Key Resources). Pap_6GFP_HIS5 is the result of a synthetic DNA (synthesized at Twist) cloned (at Twist) into the Twist vector pTwist Amp High Copy. The sequence of 6xGFP11 was (internal fragment, no AUG, no stop):
GGTAAAACTGGATCTGGCTTACGTGACCATATGGTTTTACATGAATATGTGAATGCTGCCGGCATTACAGGCACAGCAGGTAGAGGATTGAGAGATCATATGGTCCTACATGAGTACGTAAACGCTGCTGGTATAACTTCCGGTGGATTAGATGGTTTTCGTGATCATATGGTACTGCACGAATATGTTAATGCAGCAGGTATTACAGGAAATGAAACTGGCGGTATTAGAGACCACATGGTTCTTCACGAATACGTCAACGCAGCTGGAATTACTGAAGGAGCCCAAGGTGGATTAAGAGATCATATGGTGTTGCACGAGTATGTTAACGCCGCAGGTATCACCGGTAAGACTGATTTAGGAATTAGGGACCACATGGTCTTACATGAGTATGTAAATGCAGCCGGCATAACC
GFP beta strands 1 to 10 (sequence derived from plasmid pRS425_TEF1_GFP1– 10_IDT), Key Resources) were integrated at the GAL1/GAL10 locus, but expressed from the A. gossypii TEF promoter and terminated with the CYC1 terminator (Chen and Futcher, in preparation). pRS425_TEF1_GFP1–10_IDT was created by cloning synthetic DNA sequences into pRS425. The sequence of GFP1–10 was (internal fragment, AUG but no stop):
ATGTCCAAGGGTGAAGAATTGTTTACCGGTGTCGTTCCTATCTTAGTCGAATTGGATGGTGACGTTAACGGTCATAAGTTCTCTGTCCGTGGTGAAGGTGAAGGTGACGCCACCATCGGTAAGTTGACCTTGAAATTCATTTGTACCACTGGTAAATTGCCAGTTCCATGGCCTACCTTAGTCACTACCTTGACTTATGGTGTTCAATGTTTCTCTCGTTACCCTGATCATATGAAAAGACACGATTTCTTCAAGTCTGCCATGCCAGAAGGTTACGTTCAAGAAAGAACCATCTCTTTCAAGGATGATGGTAAGTATAAGACTAGAGCTGTTGTCAAGTTTGAAGGTGATACTTTGGTTAACAGAATCGAATTGAAGGGTACTGACTTCAAGGAGGATGGTAACATTTTGGGTCATAAGTTAGAATACAATTTTAACTCCCATAACGTTTACATCACCGCTGATAAGCAAAAGAACGGTATTAAGGCTAACTTCACCGTCAGACACAATGTCGAAGATGGTTCTGTCCAATTGGCCGACCACTACCAACAAAACACTCCAATTGGTGATGGTCCAGTTTTGTTGCCAGACAACCACTATTTGTCTACCCAAACTGTTTTGTCTAAGGATCCAAACGAGAAGGGTACTGTCGATGGTACTGCTGGTCCAGGTTCTACTGGTTCTAGA
Whi3 was assayed using the chromosomally-integrated Whi3-GFP fusion described by (Cai and Futcher, 2013).
Strains containing the Cln3, Whi3, and Whi5 GFP fusions also contained the cdc28-as allele, and also contained a weakly-fluorescent mCherry construct as a proxy for total protein/cell size.
Cells were grown for the fluorescence experiments essentially by the same method as for the Western blotting experiments, except that the starting volume was 5 ml, and other volumes were scaled down proportionally. Sampled cells were not frozen, but were stored on ice for <30 minutes before being analyzed by microscopy. Cells were concentrated for microscopy by centrifugation. The culture medium used for fluorescence experiments was synthetic medium with glucose. The synthetic medium used “low fluorescence” yeast nitrogen base (i.e., lacking riboflavin and folic acid) (cat. Number Y2025–01 from US Biological Life Sciences). Unbudded cells were chosen for quantitation.
Flow Cytometry (Fig. 6)
Cells were fixed with ethanol (70% final w/v) at 4°C overnight. 5 × 10⁶ cells were pelleted by centrifugation and rehydrated in 1 mL 50 mM sodium citrate (pH 7.2, Sigma-Aldrich) for at least 30 min at room temperature. The cells were sonicated (Branson Sonifier 250; microtip; output = 1; 2 × 0.5 sec pulses) pelleted again and resuspended in 500 YL of RNase A Solution (5 mg/mL in 50mM sodium citrate, pH 7.2, Sigma-Aldrich catalog# 10109169001). Incubated at 50°C for 1 hour. Added 50 μL of 20 mg/mL proteinase K (in 50mM sodium citrate, pH 7.2, Sigma-Aldrich catalog#03115887001) and incubated at 50°C for 2 hours. Added 500 μL of Sytox Green Solution (4 μM in 50 mM sodium citrate, pH 7.2, Thermo Fisher catalog #S7020), mixed, incubated in the dark for 30 min. The cells were transfered to Falcon 2054 tubes and analyzed with BD FACS Calibur Flow Cytometer (BD Biosciences). Parameters FSC, SSC and FL1 were recorded. To calculate C.V. at S-phase, cells were gated by DNA content. Size was estimated by FSC height measurement.
QUANTIFICATION AND STATISTICAL ANALYSIS.
RNA-Seq
The sequencing reads were aligned to the yeast genome using Bowtie2, rRNA reads were removed with custom perl scripts (see below) and RPKM values were measured using SeqMonk. The RPKM value for each sample was normalized to the first sample of the same time-course by division using R (http://www.Rproject.org). The linear regression of normalized RPKM values against cell size were calculated using R to yield a slope.
Statistics
The general approach to statistical analysis involved prediction (i.e., before seeing data) of super-scaling and sub-scaling gene candidates (Simmons et al. 2011). This avoided the multiple-hypothesis testing problem that would inevitably occur if one first looked at RNA-seq data to determine super-scaling and sub-scaling genes.
Several tests of significance were used. These are described in the relevant figures and text. The main test used was the Wilcoxon signed rank test. This and other tests were carried out using the R software package (http://www.Rproject.org).
Because most tests were non-parametric, normality of distributions was not required. Indeed, many of the relevant distributions were not normal. In some exploratory statistics, we used t-tests (R language), and normality was investigated using the Shapiro-Wilk test (R language).
GO analysis
GO analysis was done on the website version of Gene Ontology Consortium (http://www.geneontology.org).
DATA AND CODE AVAILABILITY.
Custom scripts.
Scripts are available at https://github.com/yupchen/sizer-paper .
Data.
BAM files from RNA-Seq have been deposited at GEO (GSE145206), and are available at that URL. Processed RNA-Seq data are in Excel files in Supplementary Material.
Supplementary Material
Table S1. P-values of scaling scores (Related to Fig. 2).
The p-values of each best-fit line in each experiment were calculated (i.e., p-value of a difference from a slope of 0).
Table S3. Size-scaling scores of example additional cell cycle regulators (Related to Fig. 2).
A. Shown are the average size-scaling scores (averaged over four experiments, Elute 1, Elute 2, Elute 3, +1NMPP1) for some examples of additional candidate cell cycle regulators. (The “+1NMPP1” experiment is the experiment with 1NMPP1, but without elutriation.) Most of these regulators are classified here as cell cycle activators or cell cycle inhibitors, but several are classified as “Ambiguous” because there are both activating and inhibiting roles. Activators and inhibitors were selected on the basis of known molecular activities, or on the basis of cell size phenotypes (Jorgensen et al 2002; Dungrawala et al. 2012; Soifer and Barkai 2014), but were not chosen on the basis of scaling scores. For instance, SWE1 (inhibits Cdc28 by phosphorylation) and NRM1 (repressor of MBF genes) were chosen inhibitors because of their key molecular activities, while PRS3 and SFP1 were chosen inhibitors because prs3 and sfp1 mutants have small cells (indicative of an inhibitor).
Genes with effects on cell size were not chosen if the effects on size are thought to be largely via a nutritional, growth or metabolic effect, as opposed to a direct cell cycle effect. Genes with effects on the cell cycle were not chosen if the effects are not thought to affect regulatory steps (e.g. cdc8, cdc9).
The corresponding data for the 8 pre-selected activators and inhibitors is also shown.
B. (second tab) Genes common to top 1000 (Related to Fig. 2).
Shown are the 42 genes that are among the top (scaling faster-than-size) 1000 genes in each of four experiments (Elute 1, Elute 2, Elute 3, +1NMPP1), but not in the top 700 of two controls (Elute control, +1NMPP1 CDC28 control). (The “+1NMPP1” experiment is the experiment with 1NMPP1, but without elutriation.) All ribosome protein genes were excluded before identifying the top 1000 in each experiment. The rank of each gene in each experiment (after excluding ribosomal protein genes) is shown in columns C through H. GO terms for these 42 genes are “mitotic cell cycle process”, “mitotic cell cycle”, and “mitotic nuclear division”.
C. (third tab) Genes common to the bottom 1600 (Related to Fig. 2).
Shown are 170 genes common to the bottom 1600 genes in each of the four experiments. These may also be in the bottom 1600 in the controls.
Table S4. Summary Scaling Scores (Related to Fig. 2).
A (first tab). Shows the individual scaling scores (the slopes) in each of the four experiments and two controls (six experiments total). Includes ribosomal protein genes. Also shows the median read count in Elute Experiment 1 for each gene.
B. (second tab) Summary Average Scaling Scores (Related to Fig. 2).
Shows the scaling score average over the four size scaling experiments (Elute 1, Elute 2, Elute 3, +1NMPP1). (The “+1NMPP1” experiment is the experiment with 1NMPP1, but without elutriation.) Does not include ribosomal protein genes. Genes whose scores are more or less than 3 standard deviations from the mean are indicated; however, since the distribution of scores is not normal, these calculations are approximate.
Table S5. Coefficients of Variation for Swap mutants (Related to Fig. 6)
A (first tab). Shows the coefficients of variation (CV) for the various mutants and swap mutants in Fig. 6B. Also shows the CVs if size distributions are treated as log normal.
B (second tab). Coefficients of Variation for Swap mutants in S-phase (Related to Fig. 6D).
KEY RESOURCES TABLE
| REAGENT or RESOURCE | SOURCE | IDENTIFIER |
|---|---|---|
| Antibodies | ||
| HA Tag recombinant rabbit polyclonal | Invitrogen | 8HCLC |
| TAP Tag rabbit polyclonal | Invitrogen | CAB1001 |
| Anti-Arp7 goat polyclonal | Santa Cruz | Sc-8961 |
| Donkey anti-mouse | LI-COR | IRDye 800Cw |
| Donkey anti-rabbit | LI-COR | IRDye 800Cw |
| Donkey anti-goat | LI-COR | 680RD |
| Chemicals, Peptides, and Recombinant Proteins | ||
| 1NMPP1 (4-Amino-1-tert-butyl-3-(1’-naphthylmethyl)pyrazolo[3,4-d]pyrimidine) | Toronto Research Chemicals | A603003 |
| Low Fluorescence Yeast Nitrogen Base | US Biological Life Sciences | Y2025–01 |
| Yeast Nitrogen Base w/o AA, carb & w/AS | US Biological Life Sciences | Y2025 |
| Yeast Extract | US Biological Life Sciences | Y2010 |
| Peptone-Y | Bio101 | 4018–532 |
| DMSO (dimethylsulfoxide) | J.T. Baker | 9224–01 |
| cOmplete protease inhibitor cocktail | Millipore-Sigma | 11697498001 |
| Bradford dye reagent | BioRad | 5000006 |
| Laemmli protein sample buffer | BioRad | 1610747 |
| Precision Plus Protein Dual Color standards | BioRad | 1610374 |
| HA Tag Recombinant rabbit polyclonal antibody | Invitrogen | 8HCLC |
| Sytox green | Thermo Fisher | S7020 |
| Critical Commercial Assays | ||
| Ovation Universal RNA-Seq System, Custom | NuGen | N/A |
| Deposited Data | ||
| BAM files from RNA-Seq | GEO | GSE145206 |
| Experimental Models: Organisms/Strains | ||
| Yeast Deletion Set, strains BY4741, BY4742 | Horizon (current source) | N/A |
| YC31–1c MATα leu2 ura3 | This work | N/A |
| YC34–1a cln2::CLN2prWHI5 whi5::WHI5prCLN2 | This work | N/A |
| YC18–2a MATα cdc28-as | This work | N/A |
| YC31–2a MATα leu2 ura3 cln2::kanMX whi5::kanMX | This work | N/A |
| YCT01 MATα leu2 ura3 whi5::kanMX | This work | N/A |
| YCT02 MATa leu2 ura3 cln2::kanMX | This work | N/A |
| YCT03a MATα leu2 ura3 whi5::WHI5pr-CLN2 | This work | N/A |
| YC32–2d MATα leu2 ura3 cln2::kanMX whi5::WHI5pr-CLN2 | This work | N/A |
| YC33–1d MATα leu2 ura3 cln2::CLN2pr-WHI5 whi5::kanMX | This work | N/A |
| YCT04 MATα leu2 ura3 cln2::CLN2pr-WHI5 | This work | N/A |
| GZ238 MATa leu2 ura3 | Zhao et al. 2016 | N/A |
| GZ240 MATa | Zhao et al. 2016 | N/A |
| GZ241 MATalpha | Zhao et al. 2016 | N/A |
| BF532–2a cdc28-as 5xGFP11-CLN3 gal1,10::TEF-GFP1–10 mCherry-PEST::LEU2 ade2 his3 ura3 leu2 | This work | N/A |
| BF530–6b cdc28-as SIC1-TAP | This work | N/A |
| BF530–6b cdc28-as WHI2-TAP | This work | N/A |
| CLN2C cdc28-as | This work | N/A |
| WHI3-GFP (BY4741 background) | Cai and Futcher 2013 | N/A |
| Recombinant DNA | ||
| pRS425_TEF1_GFP1–10_IDT | This work | N/A |
| Pap_6GFP_HIS5 | This work | N/A |
| pRS426_GAL1_sc5xGFP11_CLN3 | This work | N/A |
| Software and Algorithms | ||
| R Programming language | http://www.rproject.org | N/A |
| Custom R and Perl scripts | https://github.com/yupchen/sizer-paper | N/A |
| Bowtie2 | http://bowtie-bio.sourceforge.net/bowtie2/index.shtml | N/A |
| SeqMonk | https://www.bioinformatics.babraham.ac.uk/projects/seqmonk/ | N/A |
Highlights.
In yeast, some cell cycle activators increase in concentration as cells grow larger.
Cell cycle inhibitors decrease in concentration as cells grow larger.
These effects can explain why cells divide at increased sizes.
Reversal of this natural scaling of expression caused poor cell size control.
Acknowledgements.
This work was funded by NIH R01 GM127542 to BF. JZ is a visiting scientist supported by the Czech Academy of Sciences, grant number MSM200391901. Andrew Murray contributed the phrase “team activator vs team inhibitor.” We thank Jan Skotheim, Mike Tyers, Janet Leatherwood, and Kim Nasmyth for conversations at various times contributing to this work, and particularly Matthew Swaffer for conversations and for suggestions of controls.
Footnotes
Publisher's Disclaimer: This is a PDF file of an unedited manuscript that has been accepted for publication. As a service to our customers we are providing this early version of the manuscript. The manuscript will undergo copyediting, typesetting, and review of the resulting proof before it is published in its final form. Please note that during the production process errors may be discovered which could affect the content, and all legal disclaimers that apply to the journal pertain.
Declaration of Interests. The authors declare no competing interests.
References:
- Adames NR, Schuck PL, Chen KC, Murali TM, Tyson JJ, and Peccoud J (2015). Experimental testing of a new integrated model of the budding yeast Start transition. Mol Biol Cell 26, 3966–3984. [DOI] [PMC free article] [PubMed] [Google Scholar]
- Bean JM, Siggia ED, and Cross FR (2006). Coherence and timing of cell cycle start examined at single-cell resolution. Mol Cell 21, 3–14. [DOI] [PubMed] [Google Scholar]
- Bhattacherjee A, and Levy Y (2014). Search by proteins for their DNA target site: 1. The effect of DNA conformation on protein sliding. Nucleic Acids Res 42, 12404–12414. [DOI] [PMC free article] [PubMed] [Google Scholar]
- Bishop AC, Ubersax JA, Petsch DT, Matheos DP, Gray NS, Blethrow J, Shimizu E, Tsien JZ, Schultz PG, Rose MD, et al. (2000). A chemical switch for inhibitor-sensitive alleles of any protein kinase. Nature 407, 395–401. [DOI] [PubMed] [Google Scholar]
- Blainey PC, Luo G, Kou SC, Mangel WF, Verdine GL, Bagchi B, and Xie XS (2009). Nonspecifically bound proteins spin while diffusing along DNA. Nat Struct Mol Biol 16, 1224–1229. [DOI] [PMC free article] [PubMed] [Google Scholar]
- Cabantous S, Terwilliger TC, and Waldo GS (2005). Protein tagging and detection with engineered self-assembling fragments of green fluorescent protein. Nat Biotechnol 23, 102–107. [DOI] [PubMed] [Google Scholar]
- Cai Y, and Futcher B (2013). Effects of the yeast RNA-binding protein Whi3 on the half-life and abundance of CLN3 mRNA and other targets. PLoS One 8, e84630. [DOI] [PMC free article] [PubMed] [Google Scholar]
- Charvin G, Oikonomou C, Siggia ED, and Cross FR (2010). Origin of irreversibility of cell cycle start in budding yeast. PLoS Biol 8, e1000284. [DOI] [PMC free article] [PubMed] [Google Scholar]
- Chen KC, Calzone L, Csikasz-Nagy A, Cross FR, Novak B, and Tyson JJ (2004). Integrative analysis of cell cycle control in budding yeast. Mol Biol Cell 15, 3841–3862. [DOI] [PMC free article] [PubMed] [Google Scholar]
- Costanzo M, Nishikawa JL, Tang X, Millman JS, Schub O, Breitkreuz K, Dewar D, Rupes I, Andrews B, and Tyers M (2004). CDK activity antagonizes Whi5, an inhibitor of G1/S transcription in yeast. Cell 117, 899–913. [DOI] [PubMed] [Google Scholar]
- Coudreuse D, and Nurse P (2010). Driving the cell cycle with a minimal CDK control network. Nature 468, 1074–1079. [DOI] [PubMed] [Google Scholar]
- Cross FR, Hoek M, McKinney JD, and Tinkelenberg AH (1994). Role of Swi4 in cell cycle regulation of CLN2 expression. Mol Cell Biol 14, 4779–4787. [DOI] [PMC free article] [PubMed] [Google Scholar]
- de Bruin RA, Kalashnikova TI, and Wittenberg C (2008). Stb1 collaborates with other regulators to modulate the G1-specific transcriptional circuit. Mol Cell Biol 28, 6919–6928. [DOI] [PMC free article] [PubMed] [Google Scholar]
- de Bruin RA, McDonald WH, Kalashnikova TI, Yates J 3rd, and Wittenberg C (2004). Cln3 activates G1-specific transcription via phosphorylation of the SBF bound repressor Whi5. Cell 117, 887–898. [DOI] [PubMed] [Google Scholar]
- Di Como CJ, Chang H, and Arndt KT (1995). Activation of CLN1 and CLN2 G1 cyclin gene expression by BCK2. Mol Cell Biol 15, 1835–1846. [DOI] [PMC free article] [PubMed] [Google Scholar]
- Di Talia S, Skotheim JM, Bean JM, Siggia ED, and Cross FR (2007). The effects of molecular noise and size control on variability in the budding yeast cell cycle. Nature 448, 947–951. [DOI] [PubMed] [Google Scholar]
- Di Talia S, Wang H, Skotheim JM, Rosebrock AP, Futcher B, and Cross FR (2009). Daughter-specific transcription factors regulate cell size control in budding yeast. PLoS Biol 7, e1000221. [DOI] [PMC free article] [PubMed] [Google Scholar]
- Dirick L, and Nasmyth K (1991). Positive feedback in the activation of G1 cyclins in yeast. Nature 351, 754–757. [DOI] [PubMed] [Google Scholar]
- Dorsey S, Tollis S, Cheng J, Black L, Notley S, Tyers M, and Royer CA (2018). G1/S Transcription Factor Copy Number Is a Growth-Dependent Determinant of Cell Cycle Commitment in Yeast. Cell Syst 6, 539–554 e511. [DOI] [PubMed] [Google Scholar]
- Dungrawala H, Hua H, Wright J, Abraham L, Kasemsri T, McDowell A, Stilwell J, and Schneider BL (2012). Identification of new cell size control genes in S. cerevisiae. Cell Div 7, 24. [DOI] [PMC free article] [PubMed] [Google Scholar]
- Fantes PA (1977). Control of cell size and cycle time in Schizosaccharomyces pombe. J Cell Sci 24, 51–67. [DOI] [PubMed] [Google Scholar]
- Fantes PA, Grant WD, Pritchard RH, Sudbery PE, and Wheals AE (1975). The regulation of cell size and the control of mitosis. J Theor Biol 50, 213–244. [DOI] [PubMed] [Google Scholar]
- Ferrell JE Jr., Tsai TY, and Yang Q (2011). Modeling the cell cycle: why do certain circuits oscillate? Cell 144, 874–885. [DOI] [PubMed] [Google Scholar]
- Gasch AP, Spellman PT, Kao CM, Carmel-Harel O, Eisen MB, Storz G, Botstein D, and Brown PO (2000). Genomic expression programs in the response of yeast cells to environmental changes. Mol Biol Cell 11, 4241–4257. [DOI] [PMC free article] [PubMed] [Google Scholar]
- Ghaemmaghami S, Huh WK, Bower K, Howson RW, Belle A, Dephoure N, O’Shea EK, and Weissman JS (2003). Global analysis of protein expression in yeast. Nature 425, 737–741. [DOI] [PubMed] [Google Scholar]
- Ginzberg MB, Kafri R, and Kirschner M (2015). Cell biology. On being the right (cell) size. Science 348, 1245075. [DOI] [PMC free article] [PubMed] [Google Scholar]
- Godin M, Delgado FF, Son S, Grover WH, Bryan AK, Tzur A, Jorgensen P, Payer K, Grossman AD, Kirschner MW, et al. (2010). Using buoyant mass to measure the growth of single cells. Nat Methods 7, 387–390. [DOI] [PMC free article] [PubMed] [Google Scholar]
- Halford SE (2009). An end to 40 years of mistakes in DNA-protein association kinetics? Biochem Soc Trans 37, 343–348. [DOI] [PubMed] [Google Scholar]
- Hartwell LH, and Unger MW (1977). Unequal division in Saccharomyces cerevisiae and its implications for the control of cell division. J Cell Biol 75, 422–435. [DOI] [PMC free article] [PubMed] [Google Scholar]
- Hauser K, Essuman B, He Y, Coutsias E, Garcia-Diaz M, and Simmerling C (2016). A human transcription factor in search mode. Nucleic Acids Res 44, 63–74. [DOI] [PMC free article] [PubMed] [Google Scholar]
- Heldt FS, Lunstone R, Tyson JJ, and Novak B (2018). Dilution and titration of cell-cycle regulators may control cell size in budding yeast. PLoS Comput Biol 14, e1006548. [DOI] [PMC free article] [PubMed] [Google Scholar]
- Jen-Jacobson L, Engler LE, and Jacobson LA (2000). Structural and thermodynamic strategies for site-specific DNA binding proteins. Structure 8, 1015–1023. [DOI] [PubMed] [Google Scholar]
- Johnston GC, Pringle JR, and Hartwell LH (1977). Coordination of growth with cell division in the yeast Saccharomyces cerevisiae. Exp Cell Res 105, 79–98. [DOI] [PubMed] [Google Scholar]
- Jorgensen P, Nishikawa JL, Breitkreutz BJ, and Tyers M (2002). Systematic identification of pathways that couple cell growth and division in yeast. Science 297, 395–400. [DOI] [PubMed] [Google Scholar]
- Kafri R, Levy J, Ginzberg MB, Oh S, Lahav G, and Kirschner MW (2013). Dynamics extracted from fixed cells reveal feedback linking cell growth to cell cycle. Nature 494, 480–483. [DOI] [PMC free article] [PubMed] [Google Scholar]
- Kamiyama D, Sekine S, Barsi-Rhyne B, Hu J, Chen B, Gilbert LA, Ishikawa H, Leonetti MD, Marshall WF, Weissman JS, et al. (2016). Versatile protein tagging in cells with split fluorescent protein. Nat Commun 7, 11046. [DOI] [PMC free article] [PubMed] [Google Scholar]
- Kraikivski P, Chen KC, Laomettachit T, Murali TM, and Tyson JJ (2015). From START to FINISH: computational analysis of cell cycle control in budding yeast. NPJ Syst Biol Appl 1, 15016. [DOI] [PMC free article] [PubMed] [Google Scholar]
- Mahmutovic A, Berg OG, and Elf J (2015). What matters for lac repressor search in vivo--sliding, hopping, intersegment transfer, crowding on DNA or recognition? Nucleic Acids Res 43, 3454–3464. [DOI] [PMC free article] [PubMed] [Google Scholar]
- Mai B, Miles S, and Breeden LL (2002). Characterization of the ECB binding complex responsible for the M/G(1)-specific transcription of CLN3 and SWI4. Mol Cell Biol 22, 430–441. [DOI] [PMC free article] [PubMed] [Google Scholar]
- Marcovitz A, and Levy Y (2013). Weak frustration regulates sliding and binding kinetics on rugged protein-DNA landscapes. J Phys Chem B 117, 13005–13014. [DOI] [PubMed] [Google Scholar]
- Marklund EG, Mahmutovic A, Berg OG, Hammar P, van der Spoel D, Fange D, and Elf J (2013). Transcription-factor binding and sliding on DNA studied using micro- and macroscopic models. Proc Natl Acad Sci U S A 110, 19796–19801. [DOI] [PMC free article] [PubMed] [Google Scholar]
- Mechetin GV, and Zharkov DO (2014). Mechanisms of diffusional search for specific targets by DNA-dependent proteins. Biochemistry (Mosc) 79, 496–505. [DOI] [PubMed] [Google Scholar]
- Melero R, Rajagopalan S, Lazaro M, Joerger AC, Brandt T, Veprintsev DB, Lasso G, Gil D, Scheres SH, Carazo JM, et al. (2011). Electron microscopy studies on the quaternary structure of p53 reveal different binding modes for p53 tetramers in complex with DNA. Proc Natl Acad Sci U S A 108, 557–562. [DOI] [PMC free article] [PubMed] [Google Scholar]
- Moll T, Tebb G, Surana U, Robitsch H, and Nasmyth K (1991). The role of phosphorylation and the CDC28 protein kinase in cell cycle-regulated nuclear import of the S. cerevisiae transcription factor SWI5. Cell 66, 743–758. [DOI] [PubMed] [Google Scholar]
- Moreno S, Labib K, Correa J, and Nurse P (1994). Regulation of the cell cycle timing of Start in fission yeast by the rum1+ gene. J Cell Sci Suppl 18, 63–68. [DOI] [PubMed] [Google Scholar]
- Moreno S, and Nurse P (1994). Regulation of progression through the G1 phase of the cell cycle by the rum1+ gene. Nature 367, 236–242. [DOI] [PubMed] [Google Scholar]
- Nash R, Tokiwa G, Anand S, Erickson K, and Futcher AB (1988). The WHI1+ gene of Saccharomyces cerevisiae tethers cell division to cell size and is a cyclin homolog. EMBO J 7, 4335–4346. [DOI] [PMC free article] [PubMed] [Google Scholar]
- Nash RS, Volpe T, and Futcher B (2001). Isolation and characterization of WHI3, a size-control gene of Saccharomyces cerevisiae. Genetics 157, 1469–1480. [DOI] [PMC free article] [PubMed] [Google Scholar]
- Newman JR, Ghaemmaghami S, Ihmels J, Breslow DK, Noble M, DeRisi JL, and Weissman JS (2006). Single-cell proteomic analysis of S. cerevisiae reveals the architecture of biological noise. Nature 441, 840–846. [DOI] [PubMed] [Google Scholar]
- Nurse P (1975). Genetic control of cell size at cell division in yeast. Nature 256, 547–551. [DOI] [PubMed] [Google Scholar]
- Ohya Y, Sese J, Yukawa M, Sano F, Nakatani Y, Saito TL, Saka A, Fukuda T, Ishihara S, Oka S, et al. (2005). High-dimensional and large-scale phenotyping of yeast mutants. Proc Natl Acad Sci U S A 102, 19015–19020. [DOI] [PMC free article] [PubMed] [Google Scholar]
- Riggs AD, Bourgeois S, and Cohn M (1970). The lac repressor-operator interaction. 3. Kinetic studies. J Mol Biol 53, 401–417. [DOI] [PubMed] [Google Scholar]
- Schmoller KM, Turner JJ, Koivomagi M, and Skotheim JM (2015). Dilution of the cell cycle inhibitor Whi5 controls budding-yeast cell size. Nature 526, 268–272. [DOI] [PMC free article] [PubMed] [Google Scholar]
- Schneider BL, Zhang J, Markwardt J, Tokiwa G, Volpe T, Honey S, and Futcher B (2004). Growth rate and cell size modulate the synthesis of, and requirement for, G1-phase cyclins at start. Mol Cell Biol 24, 10802–10813. [DOI] [PMC free article] [PubMed] [Google Scholar]
- Simmons JP, Nelson LD, and Simonsohn U (2011). False-positive psychology: undisclosed flexibility in data collection and analysis allows presenting anything as significant. Psychol Sci 22, 1359–1366. [DOI] [PubMed] [Google Scholar]
- Skotheim JM, Di Talia S, Siggia ED, and Cross FR (2008). Positive feedback of G1 cyclins ensures coherent cell cycle entry. Nature 454, 291–296. [DOI] [PMC free article] [PubMed] [Google Scholar]
- Slutsky M, Kardar M, and Mirny LA (2004). Diffusion in correlated random potentials, with applications to DNA. Phys Rev E Stat Nonlin Soft Matter Phys 69, 061903. [DOI] [PubMed] [Google Scholar]
- Soifer I, and Barkai N (2014). Systematic identification of cell size regulators in budding yeast. Mol Syst Biol 10, 761. [DOI] [PMC free article] [PubMed] [Google Scholar]
- Son S, Tzur A, Weng Y, Jorgensen P, Kim J, Kirschner MW, and Manalis SR (2012). Direct observation of mammalian cell growth and size regulation. Nat Methods 9, 910–912. [DOI] [PMC free article] [PubMed] [Google Scholar]
- Spellman PT, Sherlock G, Zhang MQ, Iyer VR, Anders K, Eisen MB, Brown PO, Botstein D, and Futcher B (1998). Comprehensive identification of cell cycle-regulated genes of the yeast Saccharomyces cerevisiae by microarray hybridization. Mol Biol Cell 9, 3273–3297. [DOI] [PMC free article] [PubMed] [Google Scholar]
- Stuart D, and Wittenberg C (1994). Cell cycle-dependent transcription of CLN2 is conferred by multiple distinct cis-acting regulatory elements. Mol Cell Biol 14, 4788–4801. [DOI] [PMC free article] [PubMed] [Google Scholar]
- Sudbery PE, Goodey AR, and Carter BL (1980). Genes which control cell proliferation in the yeast Saccharomyces cerevisiae. Nature 288, 401–404. [DOI] [PubMed] [Google Scholar]
- Sung Y, Tzur A, Oh S, Choi W, Li V, Dasari RR, Yaqoob Z, and Kirschner MW (2013). Size homeostasis in adherent cells studied by synthetic phase microscopy. Proc Natl Acad Sci U S A 110, 16687–16692. [DOI] [PMC free article] [PubMed] [Google Scholar]
- Sveiczer A, Novak B, and Mitchison JM (1996). The size control of fission yeast revisited. J Cell Sci 109 (Pt 12), 2947–2957. [DOI] [PubMed] [Google Scholar]
- Sveiczer A, Novak B, and Mitchison JM (1999). Mitotic control in the absence of cdc25 mitotic inducer in fission yeast. J Cell Sci 112 (Pt 7), 1085–1092. [DOI] [PubMed] [Google Scholar]
- Thorburn RR, Gonzalez C, Brar GA, Christen S, Carlile TM, Ingolia NT, Sauer U, Weissman JS, and Amon A (2013). Aneuploid yeast strains exhibit defects in cell growth and passage through START. Mol Biol Cell 24, 1274–1289. [DOI] [PMC free article] [PubMed] [Google Scholar]
- Travesa A, Kalashnikova TI, de Bruin RA, Cass SR, Chahwan C, Lee DE, Lowndes NF, and Wittenberg C (2013). Repression of G1/S transcription is mediated via interaction of the GTB motifs of Nrm1 and Whi5 with Swi6. Mol Cell Biol 33, 1476–1486. [DOI] [PMC free article] [PubMed] [Google Scholar]
- Turner JJ, Ewald JC, and Skotheim JM (2012). Cell size control in yeast. Curr Biol 22, R350–359. [DOI] [PMC free article] [PubMed] [Google Scholar]
- Tyers M, Tokiwa G, and Futcher B (1993). Comparison of the Saccharomyces cerevisiae G1 cyclins: Cln3 may be an upstream activator of Cln1, Cln2 and other cyclins. EMBO J 12, 1955–1968. [DOI] [PMC free article] [PubMed] [Google Scholar]
- Tyers M, Tokiwa G, Nash R, and Futcher B (1992). The Cln3-Cdc28 kinase complex of S. cerevisiae is regulated by proteolysis and phosphorylation. EMBO J 11, 1773–1784. [DOI] [PMC free article] [PubMed] [Google Scholar]
- Tzur A, Kafri R, LeBleu VS, Lahav G, and Kirschner MW (2009). Cell growth and size homeostasis in proliferating animal cells. Science 325, 167–171. [DOI] [PMC free article] [PubMed] [Google Scholar]
- Ubersax JA, Woodbury EL, Quang PN, Paraz M, Blethrow JD, Shah K, Shokat KM, and Morgan DO (2003). Targets of the cyclin-dependent kinase Cdk1. Nature 425, 859–864. [DOI] [PubMed] [Google Scholar]
- Wagner MV, Smolka MB, de Bruin RA, Zhou H, Wittenberg C, and Dowdy SF (2009). Whi5 regulation by site specific CDK-phosphorylation in Saccharomyces cerevisiae. PLoS One 4, e4300. [DOI] [PMC free article] [PubMed] [Google Scholar]
- Wang H, Carey LB, Cai Y, Wijnen H, and Futcher B (2009). Recruitment of Cln3 cyclin to promoters controls cell cycle entry via histone deacetylase and other targets. PLoS Biol 7, e1000189. [DOI] [PMC free article] [PubMed] [Google Scholar]
- Wood E, and Nurse P (2013). Pom1 and cell size homeostasis in fission yeast. Cell Cycle 12, 3228–3236. [DOI] [PMC free article] [PubMed] [Google Scholar]
- Wu CY, Rolfe PA, Gifford DK, and Fink GR (2010). Control of transcription by cell size. PLoS Biol 8, e1000523. [DOI] [PMC free article] [PubMed] [Google Scholar]
- Zapata J, Dephoure N, Macdonough T, Yu Y, Parnell EJ, Mooring M, Gygi SP, Stillman DJ, and Kellogg DR (2014). PP2ARts1 is a master regulator of pathways that control cell size. J Cell Biol 204, 359–376. [DOI] [PMC free article] [PubMed] [Google Scholar]
- Zhao G, Chen Y, Carey L, and Futcher B (2016). Cyclin-Dependent Kinase Co-Ordinates Carbohydrate Metabolism and Cell Cycle in S. cerevisiae. Mol Cell 62, 546–557. [DOI] [PMC free article] [PubMed] [Google Scholar]
- Zhou HX (2011). Rapid search for specific sites on DNA through conformational switch of nonspecifically bound proteins. Proc Natl Acad Sci U S A 108, 8651–8656. [DOI] [PMC free article] [PubMed] [Google Scholar]
- Zhurinsky J, Leonhard K, Watt S, Marguerat S, Bahler J, and Nurse P (2010). A coordinated global control over cellular transcription. Curr Biol 20, 2010–2015. [DOI] [PubMed] [Google Scholar]
Associated Data
This section collects any data citations, data availability statements, or supplementary materials included in this article.
Supplementary Materials
Table S1. P-values of scaling scores (Related to Fig. 2).
The p-values of each best-fit line in each experiment were calculated (i.e., p-value of a difference from a slope of 0).
Table S3. Size-scaling scores of example additional cell cycle regulators (Related to Fig. 2).
A. Shown are the average size-scaling scores (averaged over four experiments, Elute 1, Elute 2, Elute 3, +1NMPP1) for some examples of additional candidate cell cycle regulators. (The “+1NMPP1” experiment is the experiment with 1NMPP1, but without elutriation.) Most of these regulators are classified here as cell cycle activators or cell cycle inhibitors, but several are classified as “Ambiguous” because there are both activating and inhibiting roles. Activators and inhibitors were selected on the basis of known molecular activities, or on the basis of cell size phenotypes (Jorgensen et al 2002; Dungrawala et al. 2012; Soifer and Barkai 2014), but were not chosen on the basis of scaling scores. For instance, SWE1 (inhibits Cdc28 by phosphorylation) and NRM1 (repressor of MBF genes) were chosen inhibitors because of their key molecular activities, while PRS3 and SFP1 were chosen inhibitors because prs3 and sfp1 mutants have small cells (indicative of an inhibitor).
Genes with effects on cell size were not chosen if the effects on size are thought to be largely via a nutritional, growth or metabolic effect, as opposed to a direct cell cycle effect. Genes with effects on the cell cycle were not chosen if the effects are not thought to affect regulatory steps (e.g. cdc8, cdc9).
The corresponding data for the 8 pre-selected activators and inhibitors is also shown.
B. (second tab) Genes common to top 1000 (Related to Fig. 2).
Shown are the 42 genes that are among the top (scaling faster-than-size) 1000 genes in each of four experiments (Elute 1, Elute 2, Elute 3, +1NMPP1), but not in the top 700 of two controls (Elute control, +1NMPP1 CDC28 control). (The “+1NMPP1” experiment is the experiment with 1NMPP1, but without elutriation.) All ribosome protein genes were excluded before identifying the top 1000 in each experiment. The rank of each gene in each experiment (after excluding ribosomal protein genes) is shown in columns C through H. GO terms for these 42 genes are “mitotic cell cycle process”, “mitotic cell cycle”, and “mitotic nuclear division”.
C. (third tab) Genes common to the bottom 1600 (Related to Fig. 2).
Shown are 170 genes common to the bottom 1600 genes in each of the four experiments. These may also be in the bottom 1600 in the controls.
Table S4. Summary Scaling Scores (Related to Fig. 2).
A (first tab). Shows the individual scaling scores (the slopes) in each of the four experiments and two controls (six experiments total). Includes ribosomal protein genes. Also shows the median read count in Elute Experiment 1 for each gene.
B. (second tab) Summary Average Scaling Scores (Related to Fig. 2).
Shows the scaling score average over the four size scaling experiments (Elute 1, Elute 2, Elute 3, +1NMPP1). (The “+1NMPP1” experiment is the experiment with 1NMPP1, but without elutriation.) Does not include ribosomal protein genes. Genes whose scores are more or less than 3 standard deviations from the mean are indicated; however, since the distribution of scores is not normal, these calculations are approximate.
Table S5. Coefficients of Variation for Swap mutants (Related to Fig. 6)
A (first tab). Shows the coefficients of variation (CV) for the various mutants and swap mutants in Fig. 6B. Also shows the CVs if size distributions are treated as log normal.
B (second tab). Coefficients of Variation for Swap mutants in S-phase (Related to Fig. 6D).
Data Availability Statement
Custom scripts.
Scripts are available at https://github.com/yupchen/sizer-paper .
Data.
BAM files from RNA-Seq have been deposited at GEO (GSE145206), and are available at that URL. Processed RNA-Seq data are in Excel files in Supplementary Material.