Abstract
Coronavirus disease 2019 (COVID-19), caused by severe acute respiratory syndrome coronavirus 2 (SARS-CoV-2), was first reported in Wuhan, China. The infection rapidly spread to more than 200 countries around the world. The clinical presentation of the disease may vary from mild illness to severe pneumonia such as acute respiratory distress syndrome (ARDS). The chest computed tomography (CT) has an important complementary role in diagnosis of the disease. The predominant CT findings of the disease are ground glass opacities and consolidations located in subpleural areas of lower lobes. Widespread ground-glass opacities, consolidation, air bronchograms, central involvement of lung parenchyma, mediastinal lymphadenopathy are more common in patients with the severe form of the disease. CT imaging also guides in differentiation of alternative diagnosis or in assessment of associated pulmonary embolism during the course of the disease. In this pictorial review we aim to review the CT features of COVID-19 pneumonia and mention the changes throughout the disease process.
In December 2019, the World Health Organization (WHO) reported pneumonia cases of unknown etiology in Wuhan city, China. The epidemic that started in Wuhan was stated as a pandemic by the WHO on 10 March 2020 and as of 24 April 2020, rapid spread to more than 200 countries around the world has been reported (1, 2).
A new coronavirus, which was not previously detected in humans was detected in these pneumonia cases and was named as severe acute respiratory syndrome coronavirus 2 (SARS-CoV-2). The spectrum of symptomatic infection caused by this virus may vary from common cold to severe pneumonia such as acute respiratory distress syndrome (ARDS). Early detection of the infected cases and control of spread are the main effective strategies to limit this outbreak. The diagnosis is confirmed by the molecular test real-time reverse transcription polymerase chain reaction (RT-PCR), which detects the new coronavirus nucleic acid in swabs or sputum (1–6).
Computed tomography (CT) imaging is recommended to support faster triage when access to the test kits is limited or when there is a concern for false negative test result. A recent meta-analysis reported the pooled sensitivity of RT-PCR as 89% (7). However, sensitivity of the test is affected by the sample collection method, timing of sample collection and the sensitivity of sampling kit. During the follow-up of patients, initial negative RT-PCR test results may change to positive within a range of 4–8 days (8). Tao et al. (9) mentioned that in patients with negative RT-PCR test results, 67% had positive CT findings indicating diagnosis of COVID-19 pneumonia (9). The pooled sensitivity of chest CT for diagnosis of COVID-19 pneumonia is reported at 90%–94% (7, 10). Therefore, CT has an important complementary role in initially RT-PCR test negative cases with high clinical suspicion of COVID-19 pneumonia (11). If radiological and clinical findings support the diagnosis of COVID-19 disease, RT-PCR test negative patients should have a repeat test after 24 hours.
The characteristic CT findings in COVID-19 pneumonia are patchy areas of ground glass opacities (GGOs) or consolidations, scattered bilaterally at peripheral, subpleural areas of lower lung fields (3–6). With the increased number of CT analysis data obtained, various CT findings of COVID-19 pneumonia are described in the literature.
The aim of this article is to review the typical diagnostic imaging findings of COVID-19 pneumonia and to report the changes of these findings throughout the disease process.
Imaging method
A thin slice (1–1.5 mm) high-resolution non-contrast-enhanced CT protocol is preferred in examination of the patients. Depending on the age and clinical findings of the patients, initial CT examination may be performed using standard-dose or low-dose protocol. Follow-up imaging is recommended in case of clinical progression, secondary cardiopulmonary diseases such as pulmonary embolism or superimposed bacterial infections. In patients with suspected pulmonary embolism, contrast-enhanced CT angiography protocol is preferred considering renal function.
Imaging findings
Ground-glass opacity
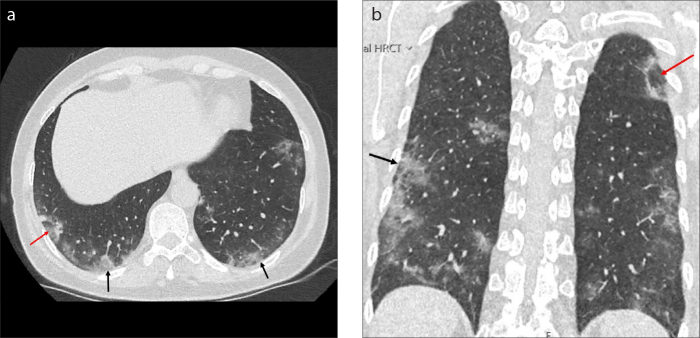
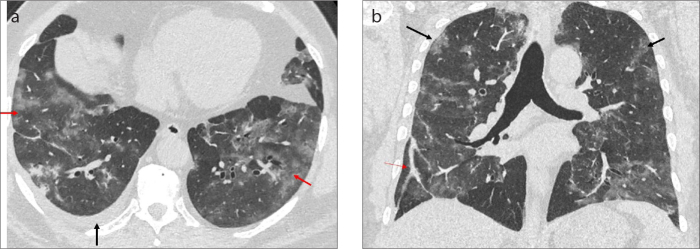
GGO, described as areas of increased attenuation in the lung with preserved bronchial and vascular markings, is the most common abnormality (40%–83%) detected in this disease (8, 10, 12, 13). The predominant lobar distribution includes right and left lower lobes. Involvement of more than three or more lobes is commonly detected. Bilateral, peripheral and subpleural distribution is seen in most of the cases (Figs. 1, 2) (3, 10, 13–15). However, COVID-19 pneumonia may manifest as unilateral GGOs even before the onset of symptoms and may rapidly evolve into a diffuse, bilateral disease (3). GGO may be in the form of round nodules (Fig. 3).
Figure 1. a, b.
Axial (a) and coronal (b) CT images of a 55-year-old female patient with progressive dyspnea and fever shows the peripheral distribution of ground glass opacities (GGOs, black arrows) more prominent at lower lobes. CT scans shows GGO surrounded by a rim of consolidation (the reversed halo sign) at right lower and left upper lobes (red arrows).
Figure 2.
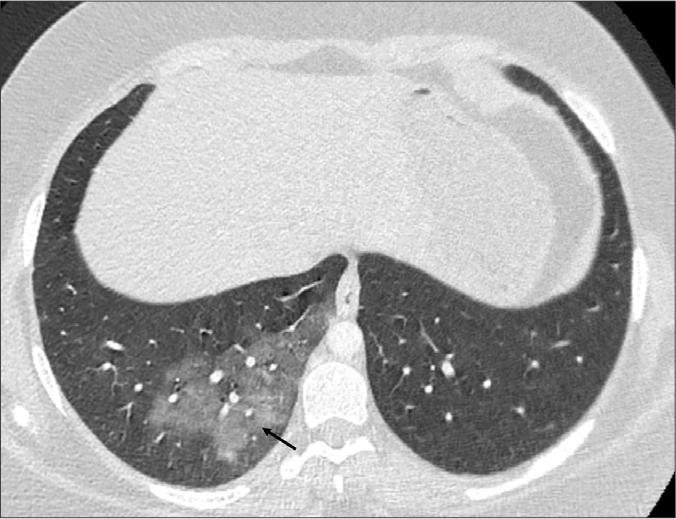
Contrast-enhanced axial CT image of an 18-year-old COVID-19 patient with complaints of headache, cough, and hemoptysis. The CT image shows a large peripheral GGO in the right lower lobe (black arrow).
Figure 3.
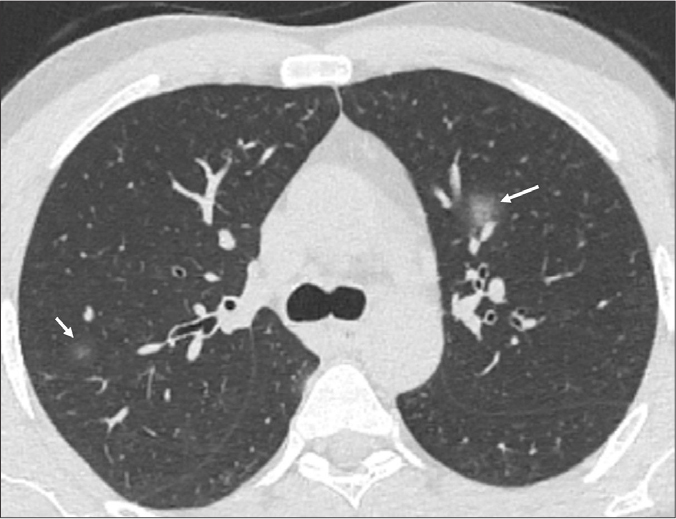
Unenhanced axial CT image of a 40-year-old male COVID-19 patient presenting with fever and cough shows focal areas of GGOs in the form of round nodules in both upper lobes (white arrows).
Consolidation
Consolidation is defined as replacement of alveolar airspaces with an alveolar-filling process. An increase in pulmonary parenchymal density and obscuration of the margins of airways and vessels are seen on CT. Consolidation is the second most common presentation of the disease (22%–43%) (Fig. 4) (8, 10). Consolidation may be associated with GGOs or crazy-paving pattern (Fig. 5). Consolidation is thought to reflect the progression stage of the disease and structural distortion may accompany consolidation over time (16). This mixed pattern, showing perilobular and peripheral distribution suggests the presence of a secondary organizing pneumonia. The organizing pneumonia pattern associated with viral pneumonia has been similarly described for H1N1 infections and MERS-CoV infections (17, 18).
Figure 4. a, b.
Axial CT images of a 66-year-old male COVID-19 pneumonia patient presenting with fever, cough and dyspnea shows consolidation (red arrows) and GGOs (black arrows) in peripheral areas of both lungs.
Figure 5.
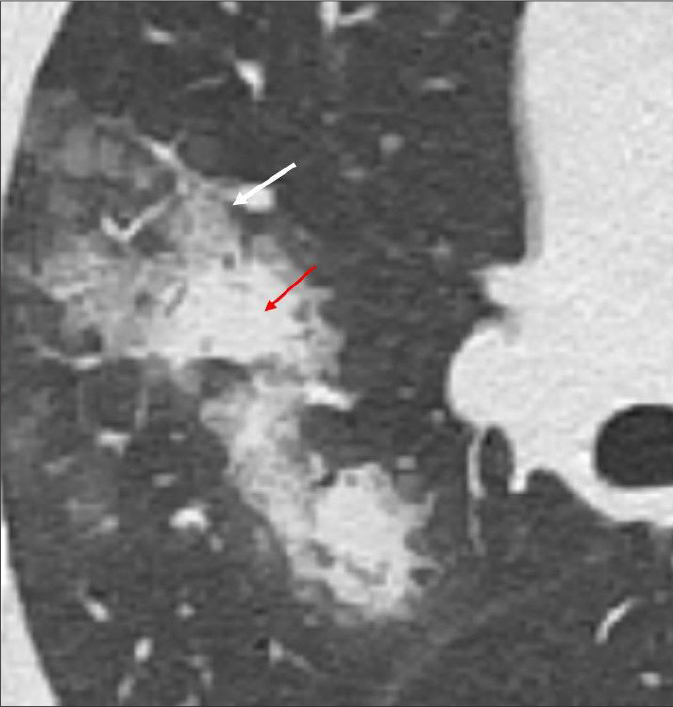
Axial CT image of a 24-year-old male COVID-19 pneumonia patient shows both crazy-paving pattern (white arrow) and consolidation (red arrow) in right upper lobe.
Air bronchogram sign
The air bronchogram sign is formed when the air-filled bronchus is surrounded with consolidated parenchyma. Although this finding is frequently observed in bacterial infections, it can be encountered in any type of infection and is also defined in COVID-19 pneumonia (19). Air bronchogram was reported in around 10%–47% of patients in different meta-analyses (8, 10). This finding is more commonly detected in patients with severe disease (Figs. 6, 7) (3, 16, 20). This sign suggests advanced stage of COVID-19 pneumonia or possible presence of coexistent superimposed processes such as pulmonary edema (16).
Figure 6.
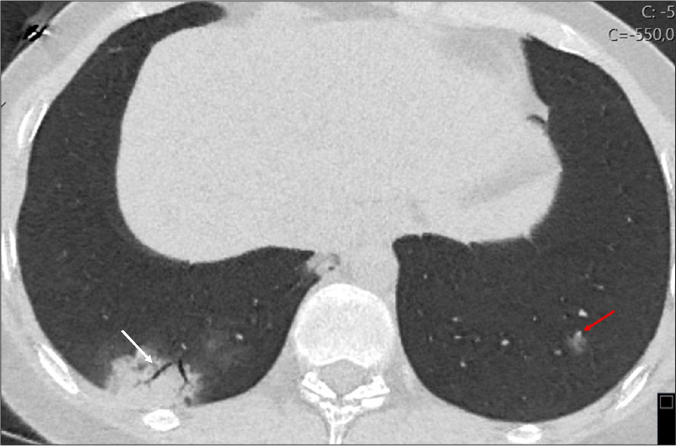
A 21-year-old female COVID-19 pneumonia patient, presenting with cough and dyspnea. Axial minimum intensity projection (MinIP) CT image shows the peripheral consolidation in air bronchogram right lower lobe (white arrow) and focal GGO in left lower lobe (red arrow).
Figure 7.
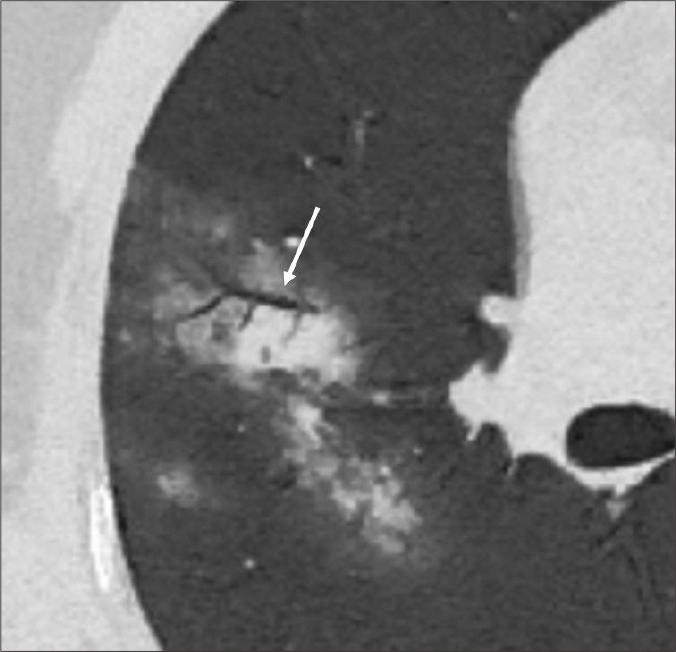
A 24-year-old male patient with COVID-19 pneumonia presenting with fever, headache, and diarrhea. Axial MinIP CT image shows the air filled bronchi within consolidation and GGO (air bronchogram) (white arrow).
Tian et al. (21) have reported the pathological findings in early phase of the COVID-19 pneumonia. The pathological changes such as proteinaceous exudate and edema were present within lung specimens corresponding to areas of GGO on CT. The same group has reported postmortem biopsy examinations of patients with severe disease. Injury of alveolar epithelial cells, fibrin forming clusters in airspaces and hyaline membrane formation indicating diffuse alveolar damage were present in this series. The corresponding CT images of these patients had GGOs associated with consolidation and air bronchogram. Superimposed bacterial infection findings such as intraalveolar neutrophilic infiltration was noted in one case with consolidation (21, 22). However, Copin et al. (23) stress on the acute fibrinous and organizing pneumonia (AFOP) pattern rather than diffuse alveolar damage in their postmortem biopsy observations in patients with prolonged disease course. Over time, the radiological-pathological correlation will be better illuminated with new postmortem studies.
Interlobular septal thickening
Interlobular septal thickening is the linear pattern observed as a result of thickening in the interstitium surrounding the secondary pulmonary lobule. This pattern is recognized in 14%–35% of COVID-19 pneumonia cases (3,10). It is commonly associated with GGOs and often appears as the disease severity progresses and the disease course extends (Fig. 8) (16, 24).
Figure 8.
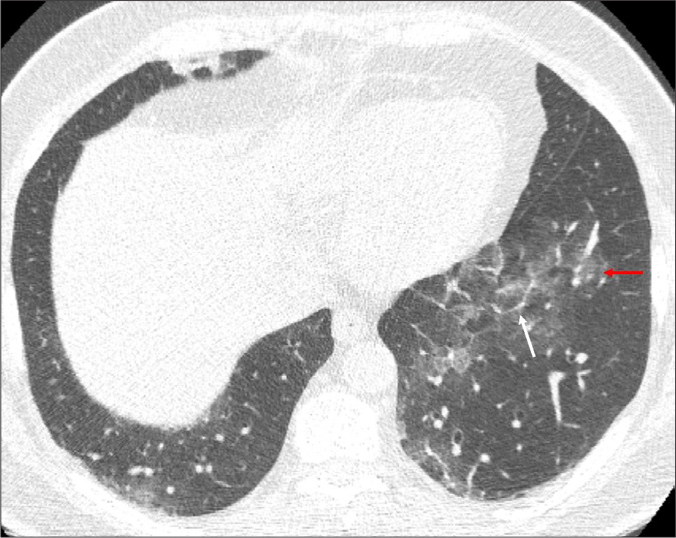
Axial CT image of a 53-year-old male COVID-19 patient presenting with complaints of diarrhea and back pain shows GGO (red arrow) and interlobular septal thickening (white arrow) in left lower lobe.
Crazy-paving pattern
The crazy-paving pattern, defined as linear pattern superimposed on GGO, is observed in COVID-19 pneumonia similar to other coronavirus pneumonias (3, 12, 13, 24). Crazy-paving pattern has been reported in 10%–15% of COVID-19 pneumonia patients in recent studies (3, 10). In their study, Pan et al. (25) investigated the radiological changes observed during the disease course. They mention that the subpleural GGOs observed in the early period grow over time, and progress to crazy-paving appearance and consolidation (Fig. 9).
Figure 9.
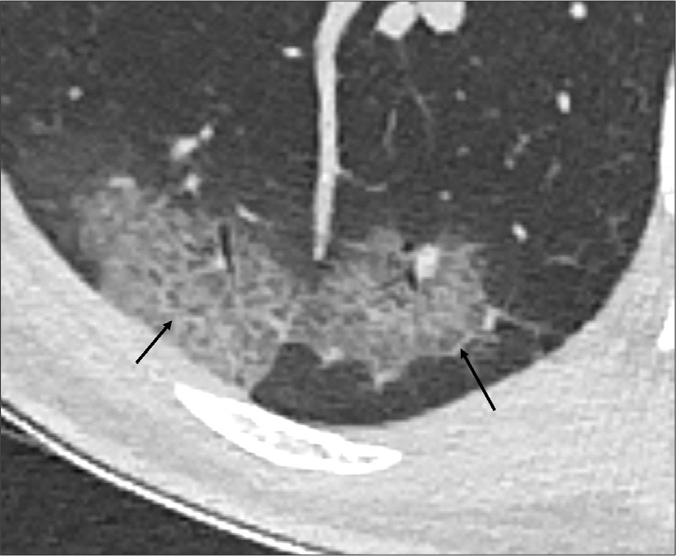
Axial CT image of a 62-year-old male COVID-19 pneumonia patient shows GGO with thickened intralobular and interlobular septum (crazy paving appearance) (black arrows).
Vascular dilatation
Vascular dilatation is the enlargement of the small pulmonary vessels within the affected pulmonary parenchyma. This finding has been reported in 45%–89% of the cases (4, 8, 26, 27). In a recent series of autopsies, authors have mentioned the thrombosed small vessels detected in the lung periphery (28). Thrombotic microangiopathy findings detected in the autopsy series may be the underlying mechanism of the vascular dilatation appearance on CT (Fig. 10).
Figure 10. a, b.
CT images of a 71-year-old male COVID-19 patient. Image (a) shows peripheral location of GGOs in both lower lobes (black arrow). Image (b) shows vascular enlargement seen in right lower lobe within a GGO (red arrow).
Subpleural lines
Subpleural lines are curvilinear lines located at subpleural area. They run parallel to pleura and have been reported in 2%–33% of the COVID-19 pneumonia patients (8, 29). Subpleural lines are most commonly observed during the recovery stage of the disease and may represent a repair process with fibrosis (Fig. 11) (23, 29).
Figure 11.
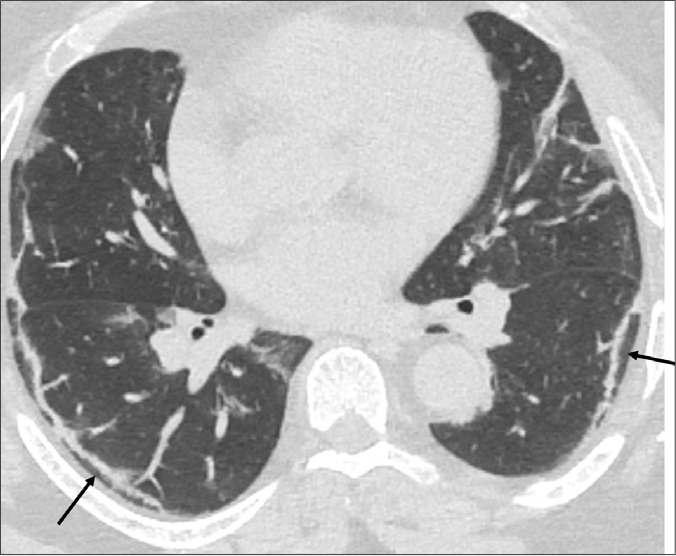
Axial CT image of 57-year-old male COVID-19 pneumonia patient presenting with cough and fever shows subpleural line extending parallel to pleura in both lower lobes (black arrows).
Pleural thickening and retraction
Pleural thickening and retraction can be detected adjacent to areas of subpleural involvement in 32%–48% during the course of the disease and this may be due to a reactive inflammatory reaction (3, 29).
Pleural effusion
Pleural effusion generally develops in 5%–7% during the course of the disease and is thought to be a more prevalent in severe/critical form of the disease (3, 8, 12, 16).
Vacuolar sign
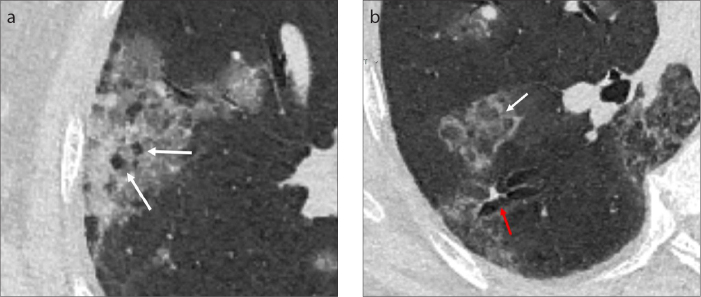
Vacuolar sign refers to a vacuole-like focal air bubble measuring less than 5 mm in diameter detected in affected lung areas. This finding may be seen secondary to distortion and dilatation of the bronchiole within parenchymal consolidation. It is mentioned as round cystic changes or air bubble sign in several studies (Fig. 12a) (3, 29).
Figure 12. a, b.
Axial MinIP CT images of a 40-year-old male patient with COVID pneumonia. Image (a) shows the vacuole-like focal air bubble within areas of GGO (vacuolar sign) in the right upper lobe (white arrows). Image (b) shows reticular pattern superimposed on the background of GGO at the right lower lobe (white arrows). Bronchial dilatation is seen within the GGO (red arrow).
Airway involvement
Airway involvement in the form of bronchial wall thickening and bronchial deformation due to fibrosis has been mentioned in 10%–52% of the cases (Fig. 12b) (4, 27). This deformation in the wall may later have an effect on respiratory function.
Halo sign
Halo sign is a CT finding describing a nodule or consolidation surrounded by a GGO. This finding was initially thought as a specific finding for invasive pulmonary aspergillosis. However, it was identified in other diseases such as other infectious diseases (mucormycosis, candidiasis, viral pneumonias) and hemorrhagic nodules of noninfectious origin (such as granulomatous polyangiitis, metastasis, Kaposi sarcoma). This sign has been reported in 12%–17.6% of COVID-19 pneumonia cases (Figs. 13, 14) (26, 27).
Figure 13.
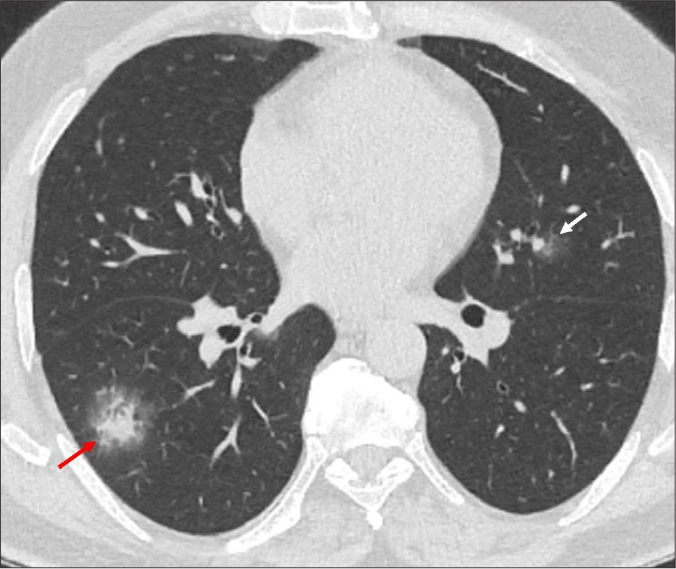
Axial chest CT image of a 48-year-old male COVID-19 pneumonia patient with fever and dyspnea, shows a focal area of GGO in left superior lingular segment (white arrow) and solid nodular infiltration surrounded by GGO (the halo sign) in the right lower lobe (red arrow).
Figure 14.
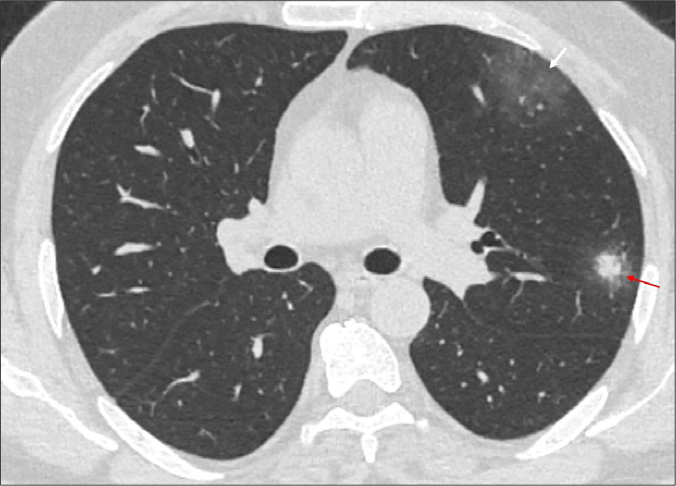
Axial CT image of a 48-year-old male COVID-19 pneumonia patient presenting with fever and cough shows solid nodular opacity surrounded by GGO (red arrow) in the left upper lobe anterior to major fissure and a focal area of GGO at subpleural area in the left upper lobe (white arrow).
Reversed halo sign
Reverse halo sign refers to an area of central GGO surrounded by a peripheral crescentic or circumferential consolidation. Organizing pneumonia is the most common cause of this finding. Lung biopsy findings of organizing pneumonia have been reported in viral infections (18, 22). The acute fibrinous and organizing pneumonia has been reported in postmortem biopsy observations of COVID-19 pneumonia cases (23). A similar lung injury pattern may be present in COVID-19 pneumonia cases. Reversed halo sign has been reported in around 4% of COVID-19 pneumonia patients and is more prominent in later stages of the disease (Fig. 1) (5, 27, 30).
Pulmonary embolism
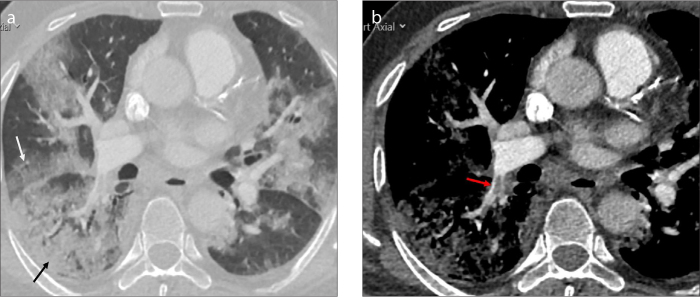
Recently there are emerging reports regarding acute pulmonary embolism associated with COVID-19 pneumonia (31, 32). Leonard-Lorant et al. (31) have reported that they detected pulmonary thromboembolism in 32 of 106 cases (30%) examined by CT angiography in their tertiary medical center. They mention that this rate is much higher compared with critically ill patients without COVID-19 pneumonia (1.3%). These data suggest that coagulopathy cascade is affected by this disease (Fig. 15).
Figure 15. a, b.
Contrast-enhanced CT image (a) of a 69-year-old male patient with intensive care unit admission due to severe COVID-19 pneumonia, shows bilateral diffuse GGOs (white arrow) and consolidation (black arrow). Image (b) shows pulmonary embolism at right lower lobe pulmonary artery (red arrow) on mediastinal window settings.
Temporal evolution of CT findings
Laboratory-confirmed COVID-19 patients may have a normal CT scan (11%–56%) during asymptomatic and early stages (within first 2 days) of the disease. However, during the follow-up period, parenchymal changes are detected in most of the patients (5, 8). Therefore, a normal chest CT examination does not rule out SARS-CoV-2 infection. Unilateral or multifocal GGOs were reported in CT examinations of subclinical, asymptomatic patients (3). The CT changes during the course of the disease are summarized below.
Early stage
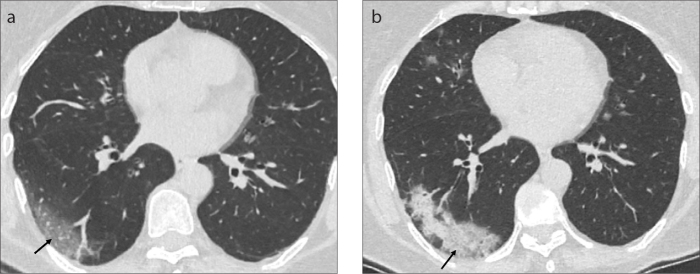
At this stage of the disease patchy GGOs affecting peripheral areas of the lower lobes is the predominant finding. Unilateral or bilateral involvement may be present (Fig. 16a) (3, 12, 25).
Figure 16. a, b.
Axial CT image (a) of a 60-year-old female COVID-19 pneumonia patient presenting with fatigue and sore throat shows peripheral GGO in subpleural area of the right lower lobe at the early stage of the disease (black arrow). The follow-up CT scan (b) is acquired 10 days after the onset of the first symptom due to clinical progression. The axial CT image, shows the evolution of GGO to consolidation pattern in the right lower lobe indicating progressive stage (black arrow).
Progressive stage
As the disease progresses, new lesions may appear and bilateral multilobar involvement develops. Relative decrease in GGO pattern and evolution to crazy-paving and consolidation is seen (Fig. 16b) (3, 25).
Severe stage
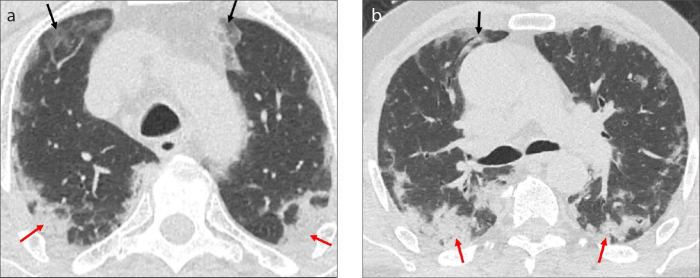
The peak levels of lung involvement generally develop around 10–13 days from symptom onset (11, 22). Consolidation becomes prominent at this stage. Air bronchograms and architectural distortion, bronchial dilatation accompany these findings. Pleural effusion may be present (Fig. 17) (3, 6, 33).
Figure 17.
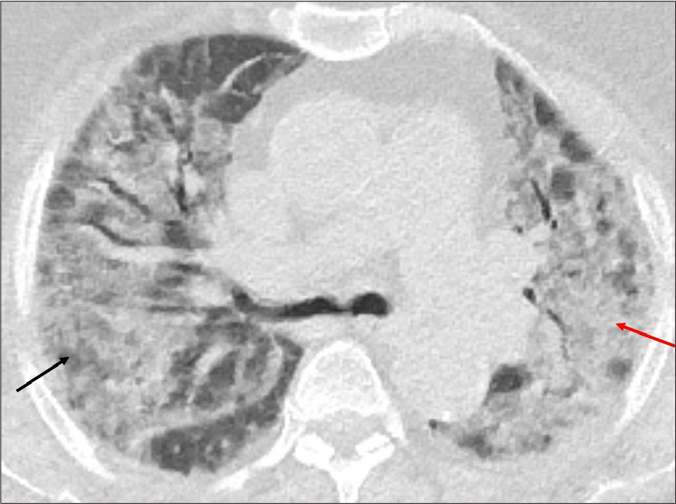
A 78-year-old female patient with history of diabetes and chronic renal failure admitted to hospital with complaints of dyspnea and fever. The patient was diagnosed as COVID-19 pneumonia and admitted to intensive care unit due to progressive dyspnea. The axial CT image shows diffuse bilateral upper lobe involvement with GGOs (black arrow) and consolidation (red arrow). The imaging findings are consistent with severe stage of the disease.
Absorption stage
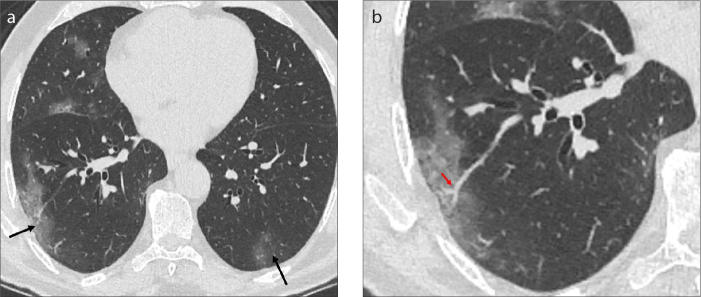
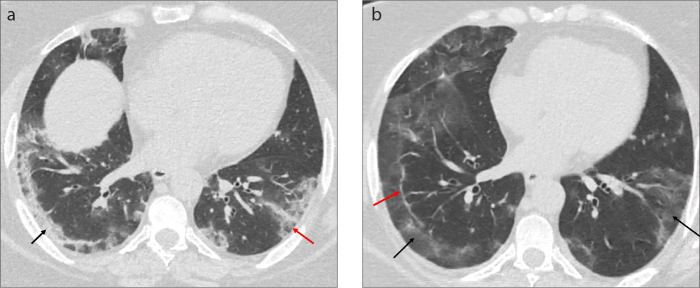
The consolidation gradually resolves and consolidation areas are replaced by GGOs. Linear lines and interfaces may accompany GGOs. The resolution of parenchymal findings may extend beyond 26 days (Fig. 18) (3, 6, 25, 33).
Figure 18. a, b.
Tha axial CT image (a) of a 47-year-old female COVID-19 pneumonia patient with cough and fever shows peripheral consolidation (black arrow) and ground glass opacities (red arrow) in both lower lobes. Follow-up CT scan (b) acquired 1 week later shows the replacement of consolidation areas with GGOs (black arrows) and the subpleural line in right lower lobe (red arrow) indicating the absorption stage.
CT differences between mild and severe disease
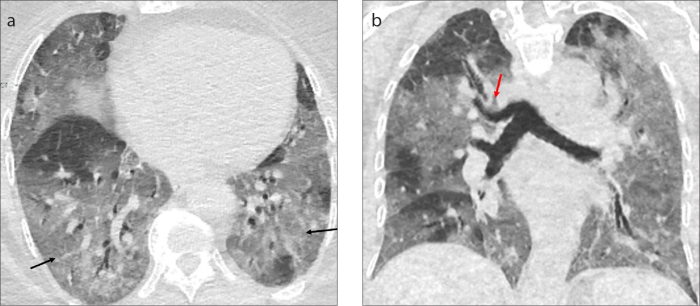
While peripheral subpleural focal GGOs are observed in milder forms of the disease, in severe forms of the disease, the GGOs become extensive and diffuse parenchymal involvement develops. Consolidation, air bronchograms, central and upper lobe involvement of lung parenchyma, mediastinal lymphadenopathy are seen more common in patients with intensive care unit admission and have prognostic importance (Figs. 17, 19) (3, 20).
Figure 19. a, b.
CT images of a 79-year-old male patient with severe COVID-19 pneumonia findings. Axial CT image (a) shows the diffuse distribution of GGOs in lower lobes (black arrows). Coronal CT image (b) shows extensive GGOs in both lung fields (black arrows). Tracheal bronchus is also seen as an incidental finding (red arrow).
Pleural fluid, which may be due to fluid overload or parapneumonic effusion, is detected in patients with severe form of the disease (Fig. 20) (16, 20). Yang et al. (34) in their study, mention about CT severity score that they used to quantify the number of affected segments. They state a correlation between CT scores and disease severity. Similarly Yu et al. (16), also showed that in patients with more severe disease, there was widespread parenchymal opacification in the lung parenchyma than in patients with mild clinical course. These findings suggest that the CT score can be an important criterion in determining the severity of the disease and can be potentially used in the triage of patients requiring hospitalization.
Figure 20. a, b.
Axial CT image (a) of a 60-year-old male COVID-19 pneumonia patient presenting with dyspnea shows right pleural effusion (black arrow) and GGOs in bilateral lower lobes (red arrows). Coronal CT image (b) shows the extension of GGOs to upper lobes (black arrows) and subpleural line (red arrow) at the right lower lobe.
Conclusion
Radiological imaging plays an important role in the diagnosis of COVID-19 pneumonia. The characteristic imaging findings are helpful in diagnosis. Findings such as extensive involvement of the lungs, predominant consolidation and air bronchogram pattern, associated pleural fluid detected on CT are more common in patients with severe disease. CT imaging also guides in differentiation of alternative diagnosis or in assessment of associated pulmonary embolism. This review attempts to highlight typical CT findings of COVID-19 pneumonia. It is of vital importance for radiologists to familiarize with these findings for correct diagnosis of the patients.
Main points.
Chest CT has an important role in diagnosis of COVID-19 pneumonia. The characteristic CT findings in COVID-19 pneumonia are patchy areas of ground glass opacities or consolidations, scattered bilaterally at peripheral and subpleural areas of lower lung fields.
Unilateral or multifocal ground glass opacities are reported in CT examinations of subclinical, asymptomatic patients. Laboratory-confirmed COVID-19 patients may have a normal CT scan during asymptomatic and early stages (within first 2 days) of the disease.
Widespread ground-glass opacities, consolidation, air bronchograms, central involvement of lung parenchyma, mediastinal lymphadenopathy are seen more commonly in patients with severe disease.
Footnotes
Conflict of interest disclosure
The authors declared no conflicts of interest.
References
- 1.World Health Organization. Coronavirus disease 2019 (COVID-19) situation report-51. World Health Organization; Geneva: 2020. Available at: https://www.who.int/docs/default-source/coronaviruse/situa-tionreports/20200311-sitrep-51-covid-19.pdf?sfvrsn=1ba62e57_10. [Google Scholar]
- 2.World Health Organization. Coronavirus disease 2019 (COVID-19) situation report-94. World Health Organization; Geneva: 2020. Available at: https://www.who.int/docs/default-source/coronaviruse/situation-reports/20200423-sitrep-94-covid-19.pdf?sfvrsn=b8304bf0_4. [Google Scholar]
- 3.Shi H, Han X, Jiang N, et al. Radiological findings from 81 patients with COVID-19 pneumonia in Wuhan, China: a descriptive study. Lancet Infect Dis. 2020;20:425–434. doi: 10.1016/S1473-3099(20)30086-4. [DOI] [PMC free article] [PubMed] [Google Scholar]
- 4.Zhao W, Zhong Z, Xie X, Yu Q, Liu J. Relation between chest CT findings and clinical conditions of coronavirus disease (COVID-19) pneumonia: a multicenter study. AJR Am J Roentgenol. 2020;214:1072–1077. doi: 10.2214/AJR.20.22976. [DOI] [PubMed] [Google Scholar]
- 5.Bernheim A, Mei X, Huang M, et al. Chest CT findings in coronavirus disease-19 (COVID-19): relationship to duration of infection. Radiology. 2020;295:200463. doi: 10.1148/radiol.2020200463. [DOI] [PMC free article] [PubMed] [Google Scholar]
- 6.Yang W, Sirajuddin A, Zhang X, et al. The role of imaging in 2019 novel coronavirus pneumonia (COVID-19) Eur Radiol. 2020 Apr 15;:1–9. doi: 10.1007/s00330-020-06827-4. [Epub Ahead of Print] [DOI] [PMC free article] [PubMed] [Google Scholar]
- 7.Kim H, Hong H, Yoon SH. Diagnostic Performance of CT and reverse transcriptase-polymerase chain reaction for coronavirus disease 2019: a meta-analysis. Radiology. 2020 Apr 17;:201343. doi: 10.1148/radiol.2020201343. [Epub Ahead of Print] [DOI] [PMC free article] [PubMed] [Google Scholar]
- 8.Venugopal VK, Mahajan V, Rajans S, et al. A systematic meta-analysis of CT features of COVID-19: lessons from radiology. medRxiv. 2020. Apr 7, 2020.04.04/20052241. [DOI]
- 9.Ai T, Yang Z, Hou H, et al. Correlation of chest CT and RT-PCR testing in coronavirus disease 2019 (COVID-19) in China: a report of 1014 cases. Radiology. 2020 Feb 26;:200642. doi: 10.1148/radiol.2020200642. [Epub Ahead of Print] [DOI] [PMC free article] [PubMed] [Google Scholar]
- 10.Bao C, Liu X, Zhang H, Li Y, Liu J. COVID-19 computed tomography findings: a systematic review and meta-analysis. J Am Coll Radiol. 2020;17:701–709. doi: 10.1016/j.jacr.2020.03.006. [DOI] [PMC free article] [PubMed] [Google Scholar]
- 11.Long C, Xu H, Shen Q, et al. Diagnosis of the coronavirus disease (COVID-19): rRT-PCR or CT? Eur J Radiol. 2020;126:108961. doi: 10.1016/j.ejrad.2020.108961. [DOI] [PMC free article] [PubMed] [Google Scholar]
- 12.Wang Y, Dong C, Hu Y, et al. Temporal changes of CT findings in 90 patients with COVID-19 pneumonia: a longitudinal study. Radiology. 2020 Mar 19;:200843. doi: 10.1148/radiol.2020200843. [Epub Ahead of Print] [DOI] [PMC free article] [PubMed] [Google Scholar]
- 13.Chung M, Bernheim A, Mei X, et al. CT imaging features of 2019 novel coronavirus (2019-nCoV) Radiology. 2020;295:202–207. doi: 10.1148/radiol.2020200230. [DOI] [PMC free article] [PubMed] [Google Scholar]
- 14.Lin X, Gong Z, Xiao Z, et al. Novel coronavirus pneumonia outbreak in 2019: computed tomographic findings in two cases. Korean J Radiol. 2020;21:365–368. doi: 10.3348/kjr.2020.007. [DOI] [PMC free article] [PubMed] [Google Scholar]
- 15.An P, Zhang M. Novel coronavirus SARS-CoV-2: familial spread resulting in COVID-19 pneumonia in a pediatric patient. Diagn Interv Radiol. 2020;26:262–263. doi: 10.5152/dir.2020.20157. [DOI] [PMC free article] [PubMed] [Google Scholar]
- 16.Yu M, Xu D, Lan L, et al. Thin-section chest CT imaging of coronavirus disease 2019 pneumonia: comparison between patients with mild and severe disease. Radiol Cardiothorac Imaging. 2020. Apr 23, [Epub Ahead of Print] [DOI] [PMC free article] [PubMed]
- 17.Ajlan AM, Ahyad RA, Jamjoom LG, Alharthy A, Madani TA. Middle East respiratory syndromecoronavirus (MERS-CoV) infection: chest CT findings. AJR Am J Roentgenol. 2014;203:782–787. doi: 10.2214/AJR.14.13021. [DOI] [PubMed] [Google Scholar]
- 18.Cornejo R, Llanos O, Fernández C, et al. Organizing pneumonia in patients with severe respiratory failure due to novel A (H1N1) influenza. BMJ Case Rep. 2010;2010 doi: 10.1136/bcr.02.2010.2708. bcr0220102708. [DOI] [PMC free article] [PubMed] [Google Scholar]
- 19.Walker CM, Abbott GF, Greene RE, Shepard JA, Vummidi D, Digumarthy SR. Imaging pulmonary infection: classic signs and patterns. AJR Am J Roentgenol. 2014;202:479–492. doi: 10.2214/AJR.13.11463. [DOI] [PubMed] [Google Scholar]
- 20.Tabatabaei SMH, Talari H, Moghaddas F, et al. Computed tomographic features and short-term prognosis of coronavirus disease 2019 (COVID-19) pneumonia: a single-center study from Kashan, Iran. Radiol Cardiothorac Imaging. 2020;2:e200130. doi: 10.1148/ryct.2020200130. [DOI] [PMC free article] [PubMed] [Google Scholar]
- 21.Tian S, Hu W, Niu L, Liu H, Xu H, Xiao SY. pulmonary pathology of early-phase 2019 novel coronavirus (COVID-19) pneumonia in two patients with lung cancer. J Thorac Oncol. 2020;15:700–704. doi: 10.1016/j.jtho.2020.02.010. [DOI] [PMC free article] [PubMed] [Google Scholar]
- 22.Tian S, Xiong Y, Liu H, et al. Pathological study of the 2019 novel coronavirus disease (COVID-19) through postmortem core biopsies. Mod Pathol. 2020. Apr 14, [Epub Ahead of Print] [DOI] [PMC free article] [PubMed]
- 23.Mathieu D Lille COVID-19 ICU and Anatomopathology Group. Time to consider histologic pattern of lung injury to treat critically ill patients with COVID-19 infection. Intensive Care Med. 2020;46:1124–1126. doi: 10.1007/s00134-020-06057-8. [DOI] [PMC free article] [PubMed] [Google Scholar]
- 24.Ye Z, Zhang Y, Wang Y, Huang Z, Song B. Chest CT manifestations of new coronavirus disease 2019 (COVID-19): a pictorial review. Eur Radiol. 2020. Mar 19, [Epub Ahead of Print] [DOI] [PMC free article] [PubMed]
- 25.Pan F, Ye T, Sun P, et al. Time course of lung changes on chest CT during recovery from 2019 novel coronavirus (COVID-19) pneumonia. Radiology. 2020;295:795–721. doi: 10.1148/radiol.2020200370. [DOI] [PMC free article] [PubMed] [Google Scholar]
- 26.Caruso D, Zerunian M, Polici M, et al. Chest CT features of COVID-19 in Rome, Italy. Radiology. 2020. Apr 3, [Epub Ahead of Print] [DOI] [PMC free article] [PubMed]
- 27.Li Y, Xia L. Coronavirus disease 2019 (COVID-19): role of chest CT in diagnosis and management. AJR Am J Roentgenol. 2020;214:1280–1286. doi: 10.2214/AJR.20.22954. [DOI] [PubMed] [Google Scholar]
- 28.Fox SE, Akmatbekov A, Harbert JL, et al. Pulmonary and cardiac pathology in COVID-19: the first autopsy series from New Orleans. medRxiv. 2020. Apr 10, 2020.04.06.20050575. [DOI] [PMC free article] [PubMed]
- 29.Zhou S, Wang Y, Zhu T, Xia L. CT features of coronavirus disease 2019 (COVID-19) pneumonia in 62 patients in Wuhan, China. AJR Am J Roentgenol. 2020;214:1287–1294. doi: 10.2214/AJR.20.22975. [DOI] [PubMed] [Google Scholar]
- 30.Bekci T. “Reversed halo sign” on 3D CT in COVID-19. Diagn Interv Radiol. 2020. Apr 30, [Epub Ahead of Print] [DOI] [PMC free article] [PubMed]
- 31.Leonard-Lorant I, Delabranche X, Severac F, et al. Acute pulmonary embolism in COVID-19 patients on CT angiography and relationship to D-dimer levels. Radiology. 2020 Apr 23;:201561. doi: 10.1148/radiol.2020201561. [Epub Ahead of Print] [DOI] [PMC free article] [PubMed] [Google Scholar]
- 32.Klok FA, Kruip MJHA, van der Meer NJM, et al. Incidence of thrombotic complications in critically ill ICU patients with COVID-19. Thromb Res. 2020;191:145–147. doi: 10.1016/j.thromres.2020.04.013. [DOI] [PMC free article] [PubMed] [Google Scholar]
- 33.Li M, Lei P, Zeng B, et al. Coronavirus disease (COVID-19): spectrum of CT findings and temporal progression of the disease. Acad Radiol. 2020;27:603–608. doi: 10.1016/j.acra.2020.03.003. [DOI] [PMC free article] [PubMed] [Google Scholar]
- 34.Yang R, Li X, Liu H, et al. Chest CT severity score: an imaging tool for assessing severe COVID-19. Radiol Cardiothorac Imaging. 2020 Mar 30;:2. doi: 10.1148/ryct.2020200047. [Epub Ahead of Print] [DOI] [PMC free article] [PubMed] [Google Scholar]


