

Abstract
Despite objective responses to PARP inhibition and improvements in progression-free survival compared to standard chemotherapy in patients with BRCA-associated triple-negative breast cancer (TNBC), benefits are transitory. Using high dimensional single-cell profiling of human TNBC, here we demonstrate that macrophages are the predominant infiltrating immune cell type in BRCA-associated TNBC. Through multi-omics profiling we show that PARP inhibitors enhance both anti- and pro-tumor features of macrophages through glucose and lipid metabolic reprogramming driven by the sterol regulatory element-binding protein 1 (SREBP-1) pathway. Combined PARP inhibitor therapy with CSF-1R blocking antibodies significantly enhanced innate and adaptive anti-tumor immunity and extends survival in BRCA-deficient tumors in vivo and is mediated by CD8+ T-cells. Collectively, our results uncover macrophage-mediated immune suppression as a liability of PARP inhibitor treatment and demonstrate combined PARP inhibition and macrophage targeting therapy induces a durable reprogramming of the tumor microenvironment, thus constituting a promising therapeutic strategy for TNBC.
Introduction
Several mutations have been identified that are associated with an increased risk of TNBC including those that are deleterious in the breast cancer susceptibility (BRCA) gene.1 BRCA1 and BRCA2 are tumor-suppressor genes involved in the maintenance of genome integrity through homologous recombination, a major DNA damage repair pathway.2 Mutations in BRCA genes render cells susceptible to chromosomal instability through defective DNA strand break repair, leading to increased risk of breast cancer.3 Poly (adenosine diphosphate-ribose) polymerase (PARP) inhibitors are FDA-approved for the treatment of BRCA-associated HER2-negative metastatic breast cancer based on rates of response and progression-free survival (PFS) that were superior to standard chemotherapy.4,5 Nonetheless, responses to PARP inhibitors have not been durable4–7, indicating that strategies to prolong PFS and overcome resistance are of high priority, including combinations with agents that activate the immune response.
Targeting T-cells with immune checkpoint blockade (ICB) in combination with chemotherapy has recently been shown to prolong PFS in a subset of patients with metastatic TNBC, leading to approval of combined atezolizumab-mediated PD-L1 blockade and nab-paclitaxel.8 ICB is nonetheless associated with modest rates of response and clinical benefit in TNBC8,9, possibly due to the presence of immune-suppressive cells in the tumor microenvironment (TME).10 Tumor macrophages comprise one of the primary populations of tumor-infiltrating leukocytes in breast tumors11–13, induce a highly suppressive TME14, and are associated with poor clinical outcome.15,16 Macrophages are a heterogeneous population of cells that have previously been classified in a dichotomous manner as either M2-like (pro-tumor phenotype) or M1-like (anti-tumor phenotype).17 Extensive characterization of murine tumor macrophages has revealed that they generally promote tumorigenesis and metastasis by secreting cytokines and growth factors that enhance tumor cell proliferation, angiogenesis and dissemination.18–21
A substantial effort has focused on targeting macrophages for anticancer therapy including depleting, inhibiting or reprogramming immune-suppressive M2-like macrophages.22–24 Among the best-described strategies involves blocking colony stimulating factor-1 (CSF-1) or its receptor, CSF-1R, to deplete and/or inhibit pro-tumor macrophages.12,22 CSF-1 is released from tumor cells and cytotoxic therapies have been shown to induce CSF-1 expression in mammary epithelial cells, which results in CSF-1R-dependent macrophage infiltration, thereby promoting an immune-suppressive TME.12 In mice that lack CSF-1, tumor growth and metastasis are significantly reduced.25–27 Early clinical trial results indicate that CSF-1/CSF-1R inhibitors are generally well tolerated with modest efficacy.28–30 To maximize therapeutic potential, better understanding is required of the context and tumor types in which blocking CSF-1/CSF-1R is most effective.
Here, we have mechanistically dissected the TME of human BRCA-associated TNBC using high dimensional single-cell profiling to reveal that BRCA-associated TNBC has significantly more macrophages than BRCA-proficient TNBC. We have characterized the effects of PARP inhibition on macrophages in a pre-clinical model of BRCA1-deficient TNBC, as well as on human macrophages cultured ex vivo. We provide evidence that PARP inhibition can modulate macrophage state, phenotype, function and metabolism. In addition, we have shown that PARP inhibition increase the expression of CSF-1R on differentiating macrophages, providing rationale for the combination of anti-CSF-1R plus PARP inhibitor therapy to reduce pro-tumor macrophages, resulting in activation of anti-tumor macrophages and CD8+ T-cells and induction of long-term anti-tumor immunity to overcome PARP inhibitor resistance.
Results
BRCA1-associated TNBC is highly infiltrated with T-cells and macrophages
We profiled both T-cell and macrophage populations in tissue resection specimens from untreated patients with either BRCA-wild type (WT; n=6) or BRCA1-associated (n=10) TNBC. Profiling was performed using tissue cyclic immunofluorescence (CyCIF) imaging, a recently developed method for highly multiplexed imaging of tissue sections at subcellular resolution31–33 (Fig. 1A–B, Extended Fig. 1A–E, Table 1). Approximately 200,000 cells were segmented and profiled per specimen (Fig. 1C) and as previously reported34, T-cells were abundant in BRCA1-associated TNBC; both CD3+CD8+ and CD3+CD4+ cells were significantly enriched compared to BRCA-WT TNBC (Fig. 1A, D and Extended Fig. 1F–H). We observed significant increases in the percentage of cytotoxic T lymphocytes (CTLs; CD8+GrB+), and an increase in regulatory T-cells (Tregs; CD4+FoxP3+; Fig. 1B, D, Extended Fig. 1G–H). There were also more T-cells that expressed PD-1 (CD8+PD-1+; CD4+PD-1+) in BRCA1-associated compared to BRCA-WT TNBC tumors (Fig 1D).
Figure 1. BRCA-mutated TNBC are highly infiltrated with T-cells and macrophages.
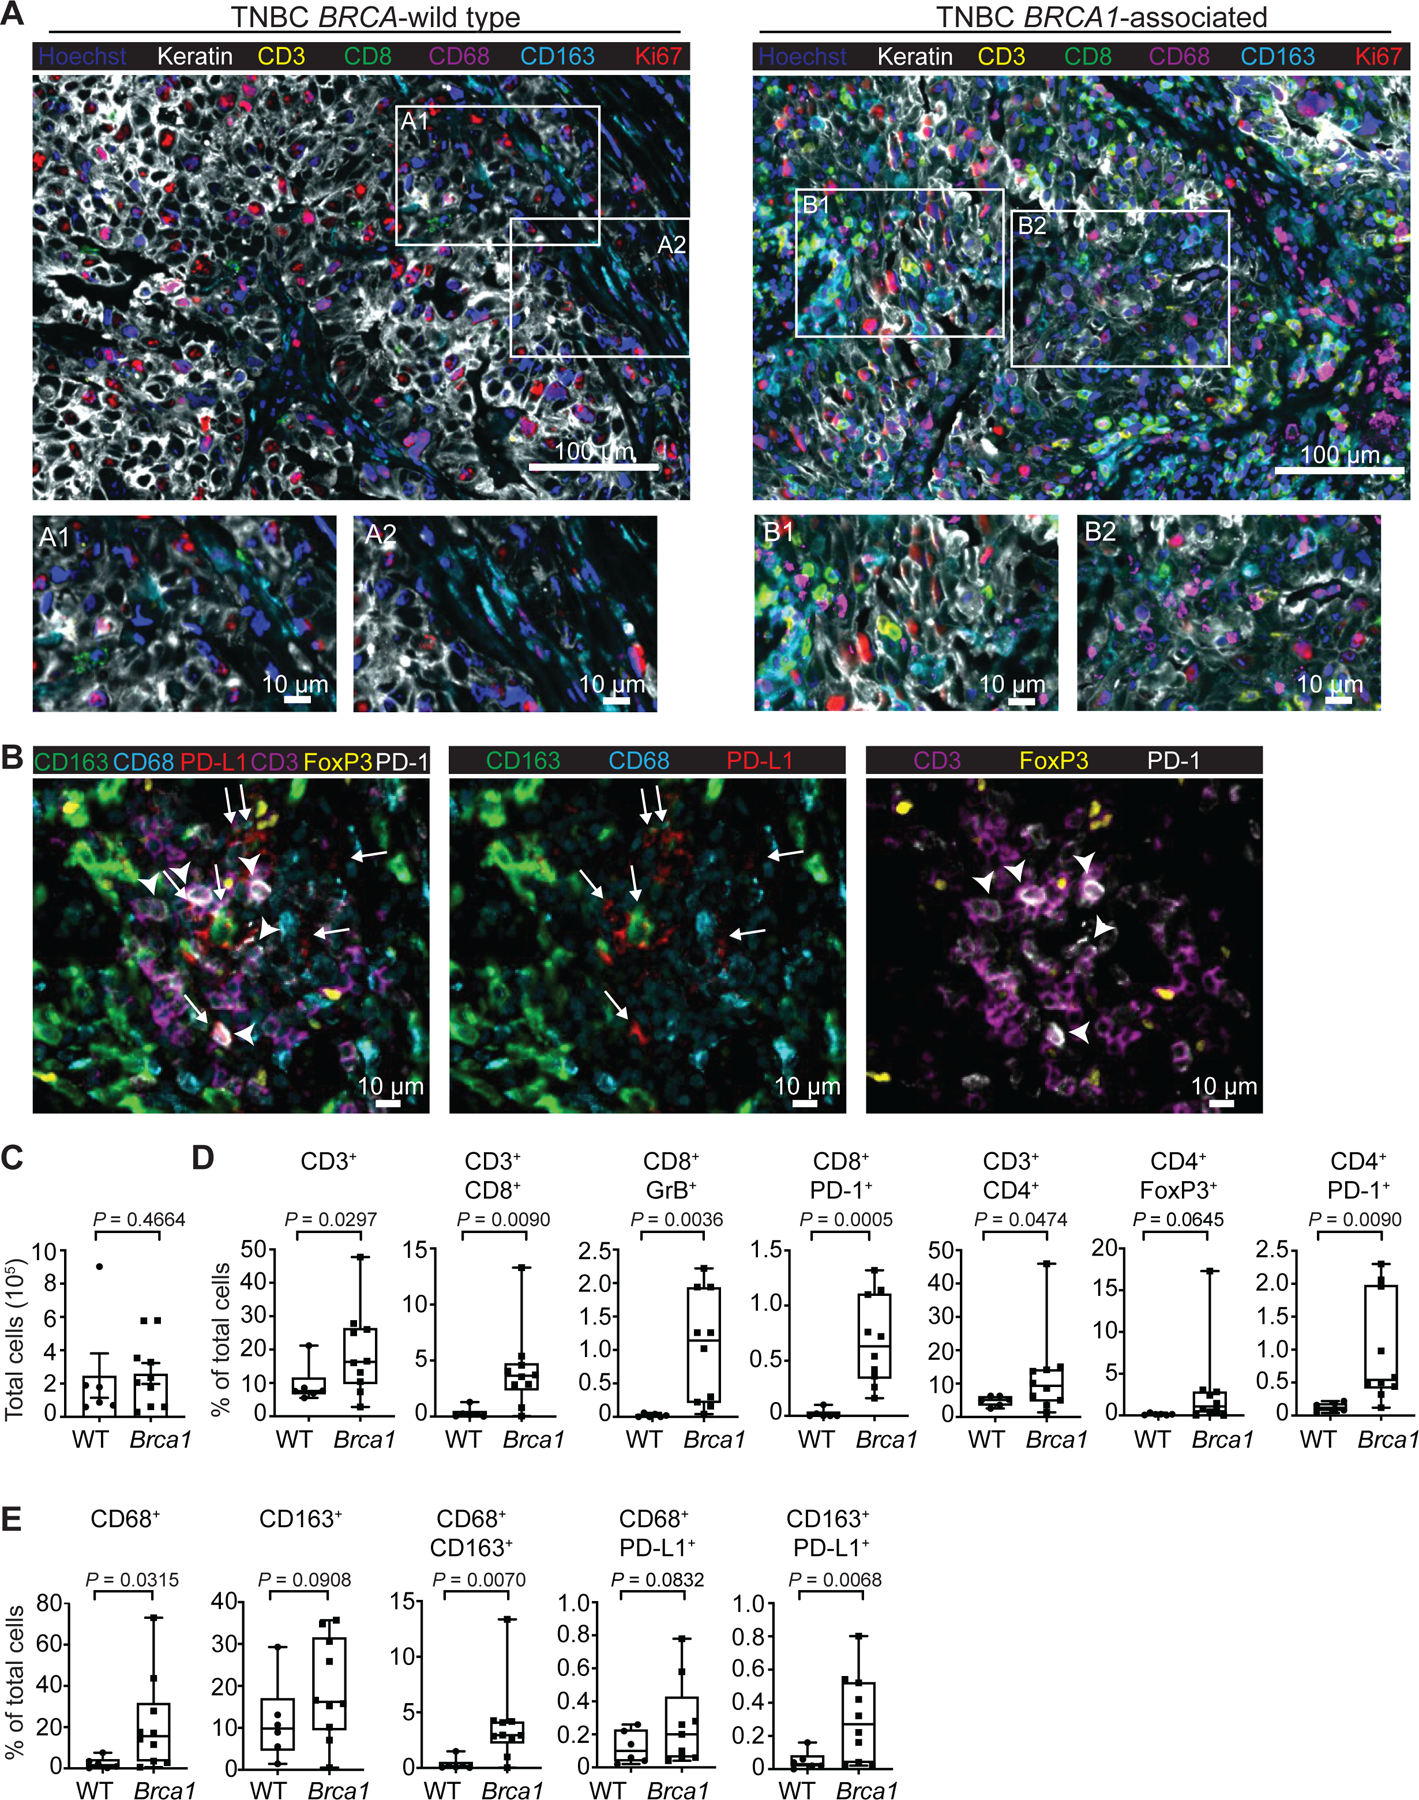
CyCIF was performed on BRCA wild type (WT; n=6) and BRCA1-associated (n=10) triple negative breast cancer tumors from consented patients. a, Nuclei were stained with DAPI (blue), and tumor cells were identified using a Keratin antibody (white). The T-cell compartment was identified using CD3 (yellow) and CD8 (green) antibodies. Macrophages were identified by CD68 (magenta) and CD163 (cyan) antibodies. Proliferating cells are shown by Ki67 (red). Images were taken at 20x magnification and representative images from all patients are shown. Scale bars are shown at either 100 or 10 μm. Insets A1 and A2 show BRCA-WT tumors with few immune cells. Insets B1 and B2 show BRCA1-associated TNBC with abundant immune cells representing both macrophages and T-cells. b, BRCA1-associated TNBC tumor showing PD-L1+ macrophages (white arrow) and PD-1+ T-cells (white arrowhead) adjacent to each other. There are no keratin positive tumor cells in this field (data not shown). c-e, Quantitation was performed and graphs indicate the minimum, the maximum and the sample median. c, Total number of cells analyzed per tumor section. d, Respective cell populations as a percent of total cells in the tumor are shown. Significant increases in CD3+, CD3+CD8+, CD8+GrB+, CD8+PD-1+, CD3+CD4+, and CD4+PD-1+ populations in the BRCA1-associated compared to BRCA-WT tumors were observed. e, Significant increases in CD68+, CD68+CD163+, and CD163+PD-L1+ macrophages were observed in the BRCA1-associated compared to BRCA-WT tumors. Statistical analysis was performed using Welch’s unpaired one-way t-test. Exact p values indicated in each panel for each comparison. Error bars represent standard error of the mean (±SEM).
Table 1.
Antibodies used for CyCIF
| Cycle | Channel | Antibody | Fluorophore | Manufacturer | Clone | Catalog Number | Dilution |
|---|---|---|---|---|---|---|---|
| Cycle1 | FITC | anti-Rabbit-488 | Alexa Fluor 488 | ThermoFisher | Polyclonal | A-21246 | 1:2000 |
| Cy3 | anti-Rat-555 | Alexa Fluor 555 | ThermoFisher | Polyclonal | A-21434 | 1:2000 | |
| Cy5 | anti-Mouse-647 | Alexa Fluor 647 | ThermoFisher | Polyclonal | A-21237 | 1:2000 | |
| Cycle 2 | FITC | anti-GZMB | anti-Rabbit-488 | Abcam | Polyclonal | AB4059 | 1:500 |
| Cy3 | anti-GZMB | anti-Rat-555 | eBioscience | 496B | 14–8889-80 | 1:250 | |
| Cy5 | anti-GZMB | anti-Mouse-647 | Dako | GrB-7 | M7235 | 1:200 | |
| Cycle 3 | FITC | CD8a-488 | Alexa Fluor 488 | eBioscience | AMC908 | 53–0008-80 | 1:400 |
| Cy3 | CD3D-555 | Alexa Fluor 555 | Abcam | EP4426 | AB208514 | 1:200 | |
| Cy5 | CD45–647 | Alexa Fluor 647 | BioLegend | HI30 | 304020 | 1:200 | |
| Cycle 4 | FITC | CD68–488 | Alexa Fluor 488 | CST | D4B9C | 24850S | 1:200 |
| Cy3 | Foxp3–570 | eFluor 570 | eBioscience | 236A/E7 | 41–4777-82 | 1:150 | |
| Cy5 | CD14–647 | Alexa Fluor 647 | Abcam | Polyclonal | ab196169 | 1:400 | |
| Cycle 5 | FITC | CD163–488 | Alexa Fluor 488 | Abcam | EPR14643–36 | ab218293 | 1:200 |
| Cy3 | Keratin-570 | eFluor 570 | eBioscience | AE1/AE3 | 41–9003-82 | 1:400 | |
| Cy5 | PD1–647 | Alexa Fluor 647 | Abcam | EPR4877(2) | ab201825 | 1:200 | |
| Cycle 6 | FITC | CD4–488 | Alexa Fluor 488 | R&D Systems | Polyclonal | FAB8165G | 1:200 |
| Cy3 | Ki67–570 | eFluor 570 | eBioscience | 20Raj1 | 41–5699-80 | 1:200 | |
| Cy5 | PDL1–647 | Alexa Fluor 647 | CST | E1L3N | 15005 | 1:200 |
In BRCA1-associated TNBC, macrophages were strikingly the most abundant immune cell population in the tumor, as demonstrated by a significant enrichment of CD68+ and CD163+ cells. There were significantly more macrophages in BRCA1-associated compared to BRCA-WT TNBC tumors (Fig. 1A, E). CD68 and CD163 have previously been used to discriminate between M1 and M2-like macrophages, respectively, but literature suggests that neither marker is sufficient to establish phenotype.35 We measured expression of the immune-suppressive co-inhibitory molecule PD-L1 on CD68+ and CD163+ macrophages. Both CD68+PD-L1+ and CD163+ PD-L1+ macrophages were increased in BRCA1-associated TNBC (Fig 1B, E, Extended Fig. 1I), suggestive of an immune-suppressive function within the TME. These data indicate that BRCA1-associated TNBC has significantly more T-cells and macrophages compared to BRCA-WT TNBC and that the latter are immune-suppressive.
PARP inhibition modulates the tumor microenvironment in BRCA1-deficient TNBC and results in increased intra-tumoral macrophages
To study macrophage phenotype and biology in the context of BRCA1-associated TNBC, we utilized the K14-Cre-Brca1f/fp53f/f murine model of TNBC.36,37 We recently showed that the PARP inhibitor Olaparib induce an influx of white blood cells, including CD8+ T-cells, into these tumors.38 This influx is mediated by activation of the STING pathway in BRCA-deficient breast tumor cells and contributes substantially to the efficacy of PARP inhibition in mice.38 Here we showed after 5 days of treatment, Olaparib induced a modest reduction in tumor burden (Fig. 2A, Extended Fig. 2A) as well as a significant increase in CD45+ leukocytes, measured by flow cytometry (Fig. 2B; Extended Fig. 2B, Table 2). This was largely attributable to an increase in myeloid cells, as shown by a 2-fold increase in the frequency of cells positive for CD11b and F480 (mature macrophages; Fig. 2B) and confirmed using immunohistochemistry (IHC; Fig. 2C and Extended Fig 2C). As we previously reported, Olaparib also induced a modest, yet significant increase in the number of CD3+ and CD8+ T-cells (Fig. 2B).38 Importantly, similar to human BRCA1-associated TNBC tumors (Fig. 1), we find that macrophages are the dominant immune population in the TME of this BRCA1-deficient mouse model.
Figure 2. PARP inhibition modulates the tumor microenvironment and increases intratumoral macrophages in BRCA1-deficient TNBC.
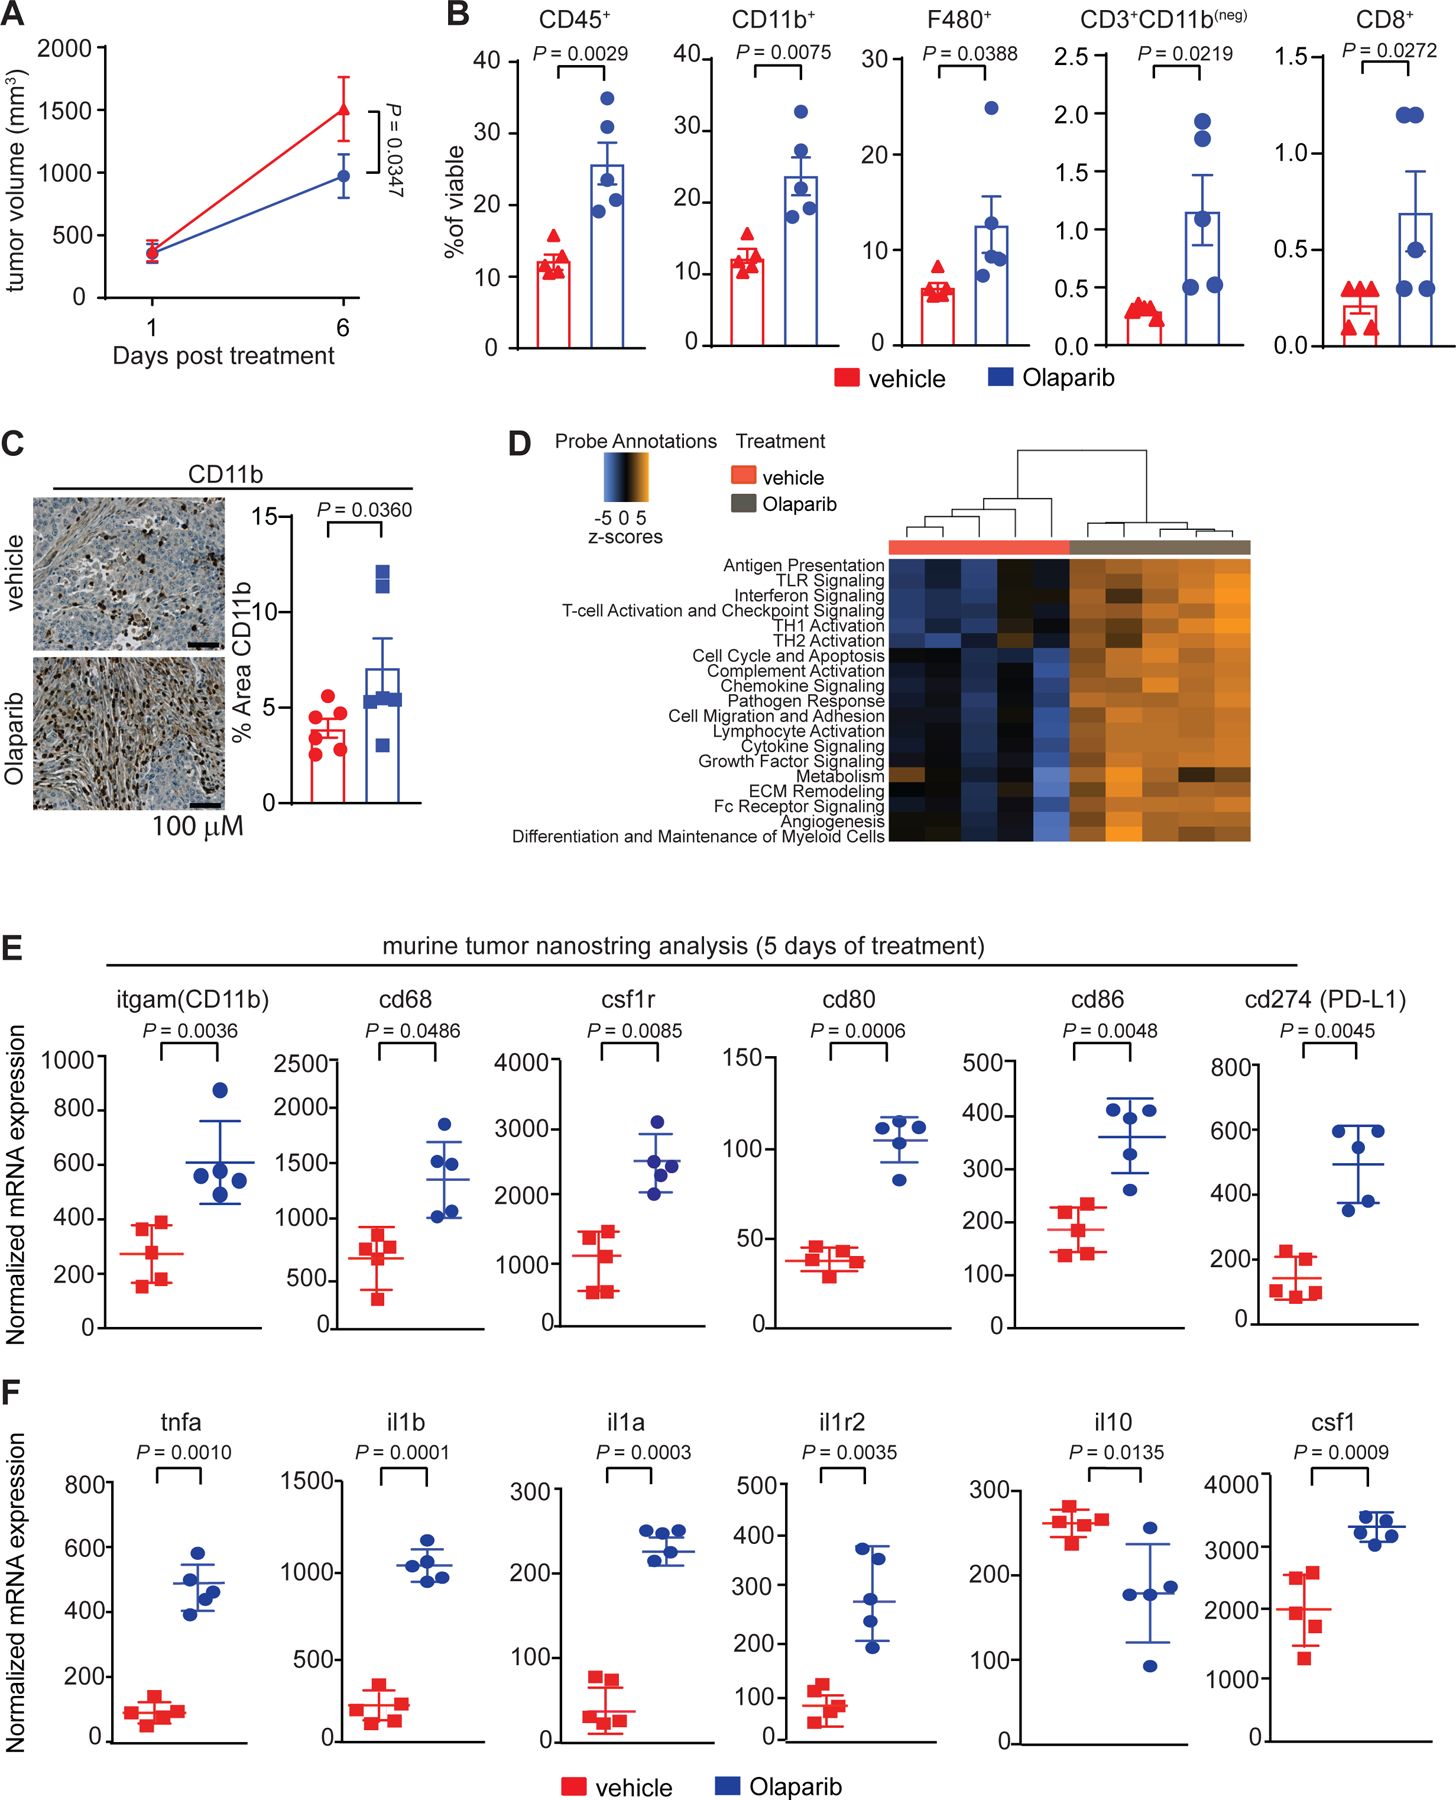
Mice bearing BRCA-deficient TNBC tumors were treated with either vehicle or 50 mg kg−1 of Olaparib. a, Olaparib significantly decreased the total tumor burden after 5 days of treatment. Statistical analysis was performed using two-way ANOVA with multiple comparison and error bar represents ±SEM with n=5 mice per group. b, Olaparib significantly increased the proportion of leukocytes (CD45+), myeloid cells (CD11b+), macrophages (F480+), T-cells (CD3+CD11b(neg)) and CD8+ T-cells, of the total live cells. Statistical analysis was performed using one-tailed unpaired t-test and error bar represents ±SEM with n=5 mice per group. c, Immunohistochemistry for myeloid cells (CD11b+). Images were taken at 20x and representative image of the n=6 mice are shown. Statistical analysis was performed using one-tailed unpaired t-test and error bar represents ±SEM with n=6 mice per group. d-f, RNA was extracted from tumors of mice treated for 5 days with vehicle or Olaparib and NanoString was performed using the myeloid panel V2. d, Pathway scores that are statistically significant (P < 0.05) are shown. e, Gene expression changes associated with Olaparib treatment are shown. Significant increases in the transcripts associated with myeloid cells are shown: (itgam; CD11b), macrophages (cd68), colony stimulating factor 1 receptor (csf1r), co-stimulatory molecules (cd80, cd86), and PD-L1 (cd274). f, Olaparib significantly increased gene expression of pro-inflammatory cytokines (tnfa, il1b, il1a) and their receptors (il1r2) and decreased the anti-inflammatory cytokine (il10) transcript levels. Colony stimulating factor 1 (csf1) was also increased following Olaparib therapy. Normalized data from the NanoString advanced analysis was used and Statistical analysis was performed using unpaired two-tailed t-test. Error bars represent ±SEM with n=5 mice per group. Exact p values indicated in each panel for each comparison.
Table 2.
Antibodies used for murine flow cytometry
| Antibody | Fluorophore | Manufacturer | Clone | Catalog Number | Dilution |
|---|---|---|---|---|---|
| CD45 | AF488 | BioLegend | 30-F11 | 103122 | 1:500 |
| CD11b | BV711 | BioLegend | M1/70 | 101241 | 1:1000 |
| CD3 | AF594 | BioLegend | 17A2 | 100240 | 1:1000 |
| MHCII | BV421 | BioLegend | M5/114.15.2 | 107631 | 1:1000 |
| F480 | AF647 | BioLegend | BM8 | 123121 | 1:500 |
| CD11c | BV650 | BD Horizon | HL3 | 564079 | 1:500 |
| CD80 | BV605 | BioLegend | 16–10A1 | 104729 | 1:250 |
| CD86 | Percp/Cy5.5 | BioLegend | GL-1 | 105027 | 1:100 |
| CD40 | PE/Cy7 | BioLegend | 23-Mar | 124621 | 1:500 |
| CD206 | PE | BioLegend | C068C2 | 141706 | 1:500 |
| CD8 | PE/Cy7 | BioLegend | 53–6.7 | 100721 | 1:1000 |
| CD4 | PE | BioLegend | GK1.5 | 100408 | 1:1000 |
| GrnzB | AF647 | BioLegend | GB11 | 515405 | 1:250 |
| FoxP3 | Percp/Cy5.5 | BD Horizon | R16–715 | 563902 | 1:100 |
| PD-1 | BV421 | BioLegend | 29F.1A12 | 135217 | 1:250 |
| PD-L1 | PE | BioLegend | 10F.9G2 | 124307 | 1:250 |
| CD115 | BV605 | BioLegend | AFS98 | 135517 | 1:500 |
| CD121b | BV421 | BD | 4.00E+02 | 562926 | 1:100 |
| TNFα | PerCP-Cy5.5 | BD | MP6-XT22 | 560659 | 1:100 |
| IL-1B | FITC | R&D | 166931 | IC4013A | 1:100 |
| CD120a | Unconjugated | BioLegend | 55R-286 | 113001 | 1:100 |
| IL-1a | PE | BD | ALF-161 | 550610 | 1:100 |
| CD120b | PE | BD | TR75–89 | 550086 | 1:100 |
| CD121a | A647 | BD | 35F5 | 563629 | 1:100 |
| CD120a | APC | BioLegend | 55R-286 | 113005 | 1:100 |
| Streptavidin | BV711 | BioLegend | 405241 | 1:250 |
To investigate the broad effects of Olaparib on the TME, we performed NanoString gene expression profiling (Fig. 2D–F and Extended Fig. 3A–J) and confirmed key findings using quantitative PCR (qPCR; Extended Fig. 3K; Table 3). NanoString gene expression scores39 showed that Olaparib induced substantial changes in the composition of the TME and increased innate and adaptive immune cell signaling (Fig. 2D). Consistent with flow cytometry, CD45 levels were increased (Extended Fig. 3C), as were transcripts related to macrophage and myeloid biology, including itgam (CD11b), cd68, csf1r, co-stimulatory molecules (cd80, cd86), programmed death ligand-1 (cd274; PD-L1) and the dendritic cell marker CD11c (itgax; Fig. 2E, Extended Fig. 3I). Genes involved in antigen presentation, chemokine and cytokine signaling cascades and TLRs were also induced by Olaparib (Extended Fig. 3E–H), suggesting increased myeloid function. We observed increases in transcripts among genes involved in pro-inflammatory cytokine signaling, including tumor-necrosis factor-α (tnf-α), interleukin-1 beta (il1β), interleukin-1 alpha (il1α) and its receptor interleukin-1 receptor 2 (il1r2; Fig. 2F) as well as interferon-related genes (irf5 and irf8; Extended Fig 3J). In contrast, expression of the immune-suppressive cytokine interleukin-10 (il-10; Fig. 2F) decreased. Increases in csf1 also occurred following Olaparib exposure, consistent with previous reports that chemotherapy or irradiation can induce expression of CSF-1 in tumor cells, resulting in recruitment of macrophages12, potentially explaining the increase in macrophage numbers following Olaparib treatment.
Table 3.
Sequences of Oligonucleotides
| Gene | Forward Primer (5’−3’) | Reverse Primer (5’−3’) |
|---|---|---|
| Mouse IL1β | GGGGACATTAGGCAGCACTC | TGCGGGCTATGACCAATTCA |
| Mouse IL1R1 | TTGGTGAGGAATGTGGCTGAA | CTTCCCCCGGAACGTATAGGA |
| Mouse IL1R2 | GCATCCCACTGTGAGCAAATG | GCAAGTAGGAGACATGAGGCA |
| Mouse IL1α | ACCACTTGGTTAAATGACCTGC | TAGAGTCGTCTCCTCCCGAC |
| Mouse TNFα | AACTAGTGGTGCCAGCCGA | GGGCAGCCTTGTCCCTTGAA |
| Mouse IRF5 | CCGTGACTTCCAGCTGTTCTAT | TTGGAGCAGACCTCGTAGAT |
| Mouse GAPDH | AACACAGTCCATGCCATCAC | TCCACCACCCTGTTGCTGTA |
| Mouse CSF1 | AAGAATCTCCTTGAAAAGGACTGG | GCTGTTGTTGCAGTTCTTGGTA |
| Human BRCA1 | GGACAAAGCAGCGGATACA | TTGATCTCCCACACTGCAATAA |
| Human CSF1 | GCCCGGGGAAAGTGAAAGTT | CACCGCTGTCCTGGGATG |
| Human GAPDH | GACAGTCAGCCGCATCTTCT | TAGCCTCCCGGGTTTCTCTC |
PARP inhibitor therapy modulates macrophage phenotype in BRCA1-deficient TNBC
After Olaparib treatment, F480+CD45+ cells increased expression of the co-stimulatory molecule CD80 as well as the activation marker CD40, demonstrating potential induction of an anti-tumor phenotype and confirming gene expression data (Fig. 3A). Levels of CD206, which is associated with a pro-tumor phenotype40, did not change. Approximately 50% of F480+ macrophages expressed CD206 in tumors from both vehicle and Olaparib-treated mice (Fig. 3A). F480+ cells were then gated by CD206 expression. Both CD206− and CD206+ cells increased CD80/CD86 and CD40 following Olaparib treatment, consistent with anti-tumor function (Fig. 3B). Overall, the ratio of CD40+ anti-tumor macrophages to CD206+ pro-tumor macrophages significantly increased following Olaparib exposure (Fig. 3C). In line with this, Olaparib induced activation of the STING pathway effector TANK-binding kinase-1 (TBK1), as measured by phosphorylation on Ser-172 in macrophages (Fig. 3D). Following Olaparib treatment, there was also a significant increase in the frequency of F480+PD-L1+ macrophages as well as PD-L1+ tumor cells and other non-lymphoid cells (CD45(neg) cells; Fig. 3E), consistent with previous reports that PD-L1 expression may be a consequence of increased IFNγ production by abundant CD8+ T-cells11 and may be upregulated by PARP inhibition on TNBC tumor cells.41 In line with the gene expression analysis (Fig. 2E), there was a significant increase in the frequency of F480+CSF-1R+ macrophages (Fig. 3F); which also expressed PD-L1 (Fig. 3G). Taken together, these data reveal that Olaparib treatment drives opposing phenotypes, demonstrated by increased expression of functional anti-tumor markers (CD80, CD86, CD40 and pTBK1) as well as immune-suppressive markers (PD-L1 and CSF-1R).
Figure 3. PARP inhibition modulates macrophage phenotype.

a-g, Mice bearing BRCA-deficient TNBC tumors were treated with either vehicle or 50 mg kg−1 of Olaparib. Tumors were harvested and immunophenotyping was performed by flow cytometry. a, Following Olaparib therapy, there was an increase in macrophages (CD45+F480+) that express co-stimulatory (CD80) and activation (CD40) markers. b, The CD80+CD86+ and CD40+ populations were significantly increased in both the CD206 positive and negative macrophage populations. c, The anti-tumor to pro-tumor macrophage ratio was increased after Olaparib treatment. d, pTBK1 was increased in macrophages (F480+) and mature macrophages (F480+MHCII+) in tumors of Olaparib-treated mice. e, The proportion of PD-L1+ macrophages (PD-L1+F480+) and tumor cells (CD45(neg)) increased following Olaparib treatment, as did CSF-1R expression on macrophages (F480+CSF-1R+ (f)) including an increase in the double positive population of (PD-L1+CSF-1R+) (g). Error bars represent standard error of mean (±SEM). Statistical analyses were performed using two tailed t-test with n=5 mice per group. h-p, CD14+ cells were isolated from healthy human donors and differentiated to mature myeloid cells with either IL-4 plus GM-CSF (h-n) or M-CSF (o,p) in the presence or absence of Olaparib for 5 days, and analysis was performed by flow cytometry. Shown are changes in h, CD14+ cells, i, CD163, j, CD80 and CD86 on different myeloid populations. The same flow plots are used for k and l; highlighted quadrants in each figure are plotted. m-n, Olaparib increased the expression of pTBK1 and PD-L1 on CD11b+ myeloid cells. o-p, M-CSF differentiated macrophages treated with Olaparib increased expression of CSF-1R and CD206+. Error bars represent standard error of mean (±SEM). Statistical analyses were performed using two tailed t-test with n=4 healthy human donors. Exact p values indicated in each panel for each comparison.
PARP inhibition modulates the phenotype of differentiating human macrophages ex vivo
Given the phenotypic changes of macrophages in the TME after PARP inhibitor therapy, we next tested if Olaparib could modulate macrophages independent of the TME. To investigate this possibility, CD14+ monocytes were isolated from healthy human donors and treated ex vivo with Olaparib. Both human monocytes as well as mature macrophages were treated to determine how Olaparib affects the two different stages of macrophage maturation. In the first experiment, monocytes were differentiated ex vivo for 5 days using GM-CSF plus IL-4 or M-CSF, in the presence or absence of Olaparib (Extended Fig. 4A). Exposure of human monocytes to GM-CSF plus IL-4 induced differentiation into both macrophages (CD11b+) and dendritic cells (DC; CD11bneg; Extended Fig. 4C and Table 4).42 Exposure to M-CSF alone induces a more homogenous differentiation to immature macrophages.43 After 5 days of treatment with Olaparib, there was no change in viability (Extended Fig. 4C). Interestingly, Olaparib enhanced the differentiation of monocytes to mature myeloid cells in the presence of IL-4 plus GM-CSF, as measured by a decrease in the frequency of CD14+ cells (Fig. 3H, Extended Fig. 4B). Olaparib also reduced the frequency of CD163+ cells (Fig. 3I) and induced an increase in CD80+ expression (Fig. 3J), which also occurred in the DC population (Fig. 3K). The frequency of CD86+ macrophages but not DCs also increased (Fig. 3L). Consistent with STING pathway activation in macrophages from murine tumors (Fig. 3D), Olaparib induced a significant increase in pTBK1 levels in macrophages (Fig. 3M) and DCs (Extended Fig. 4D). Olaparib also induced expression of PD-L1 and CSF-1R on M-CSF differentiating macrophages; the CSF-1R+ population also expressed CD206 (Fig. 3N–P; Extended Fig. 4E), mimicking the data observed in Olaparib-treated murine tumors. In a second experiment, monocytes were first differentiated into mature myeloid cells using GM-CSF plus IL-4 for 5 days and on the 5th day vehicle or Olaparib was added for 4 additional days (Extended Fig. 4F). In contrast to the changes identified on differentiating myeloid cells, mature myeloid cells remained relatively unchanged in response to Olaparib (Extended Fig. 4G). Taken together, these data demonstrate that PARP inhibition results in phenotypic changes of differentiating human macrophages, but not in mature macrophages. We identified that two other PARP inhibitors, Niraparib and Talazoparib induced similar phenotypic changes as Olaparib (Extended Fig. 5A–H).
Table 4.
Antibodies used for human flow cytometry
| Antibody | Fluorophore | Manufacturer | Clone | Catalog Number | Dilution |
|---|---|---|---|---|---|
| CD45 | FITC | BioLegend | 2D1 | 368507 | 1:500 |
| CD14 | APC | BioLegend | 63D3 | 367117 | 1:500 |
| CD86 | BV711 | BioLegend | IT2.2 | 305439 | 1:500 |
| CD80 | BV605 | BioLegend | 2D10 | 305225 | 1:500 |
| CD3 | AF594 | BioLegend | UCHTI | 300446 | 1:1000 |
| CD11b | BV421 | BioLegend | ICRF44 | 301323 | 1:500 |
| CD40 | PE/CY7 | BioLegend | 5C3 | 334321 | 1:500 |
| CD115 | BV421 | BioLegend | 9–4D2–1E4 | 347321 | 1:200 |
| CD206 | APC/CY7 | BioLegend | 15–2 | 321119 | 1:500 |
| CD163 | BV605 | BioLegend | GHI/61 | 333615 | 1:250 |
| CD68 | Percp-Cy5.5 | BioLegend | Y1/82A | 333813 | 1:500 |
| pTBK1 (Ser 172) | PE | CST | D52C2 | 13498 | 1:200 |
| PDL1/CD274 | AF594 | BioLegend | 29E2A3 | 329742 | 1:250 |
The Role of PARP1 in differentiating macrophages
The mechanism of PARP inhibitors has been associated with their ability to trap PARP1 at sites of DNA damage44, therefore bone marrow from wild-type, parp1−/− and parp2−/− mice was differentiated for 5 days in IL-4 plus GM-CSF in the presence or absence of Olaparib. We found that the increases in PD-L1 expression was independent of PARP1, because the phenotype was still present in parp1−/− bone marrow and thus we termed this phenotype “PARP1-independent”. However, the presence of PARP1 was required for changes in expression of CSF-1R and pTBK1 because these phenotypes were not observed in the absence of PARP1, therefore we termed these phenotypes “PARP1-dependent” (Extended Fig. 5I–O). These changes were consistent in response to Talazoparib (Extended Fig. 6A–E) and were not dependent on PARP2 (Extended Fig. 6H–L). These changes may be attributed to PARP-induced PARP1 trapping as others have reported PARP inhibitor phenotypes being lost with PARP1 is absent or mutated.45
Unbiased analysis of the effects of Olaparib on differentiating macrophages
We employed both RNA sequencing (RNAseq) and multiplex quantitative tandem mass tag (TMT) proteomics as unbiased approaches to study Olaparib-treated macrophages (Fig. 4A–I and Extended Fig. 7A,B). Consistent with flow cytometry and NanoString, genes associated with myeloid cell development, LPS-like inflammatory responses and interferon signaling were significantly enriched following Olaparib treatment (Fig. 4A–I; Extended Fig. 7A,B). Proteomic analysis confirmed the flow cytometry data, demonstrating significant decreases in expression of CD14 and CD163, as well as increases in CD86 (Fig. 4F,G). Allograft inflammatory factor 1 (AIF1), known to be expressed by M2-like pro-tumor macrophages46, was significantly reduced following Olaparib treatment (Fig. 4F,G). Proteomics also revealed that Olaparib induced expression of several single-strand break SSB repair proteins including PARP1, PARP1 polynucleotide kinase 3’-phosphatase (PNKP), X-ray repair cross-complementing protein 1 (XRCC1), DNA ligase-3 (LIG3), Forkhead-Associated Domain Histidine Triad-Like Protein (APTX) and Ring Finger Protein 146 (RNF146; Fig. 4F,H), which have been shown to be activated after PARP inhibition.47
Figure 4. PARP inhibition modulates the metabolic phenotype of differentiating macrophages.
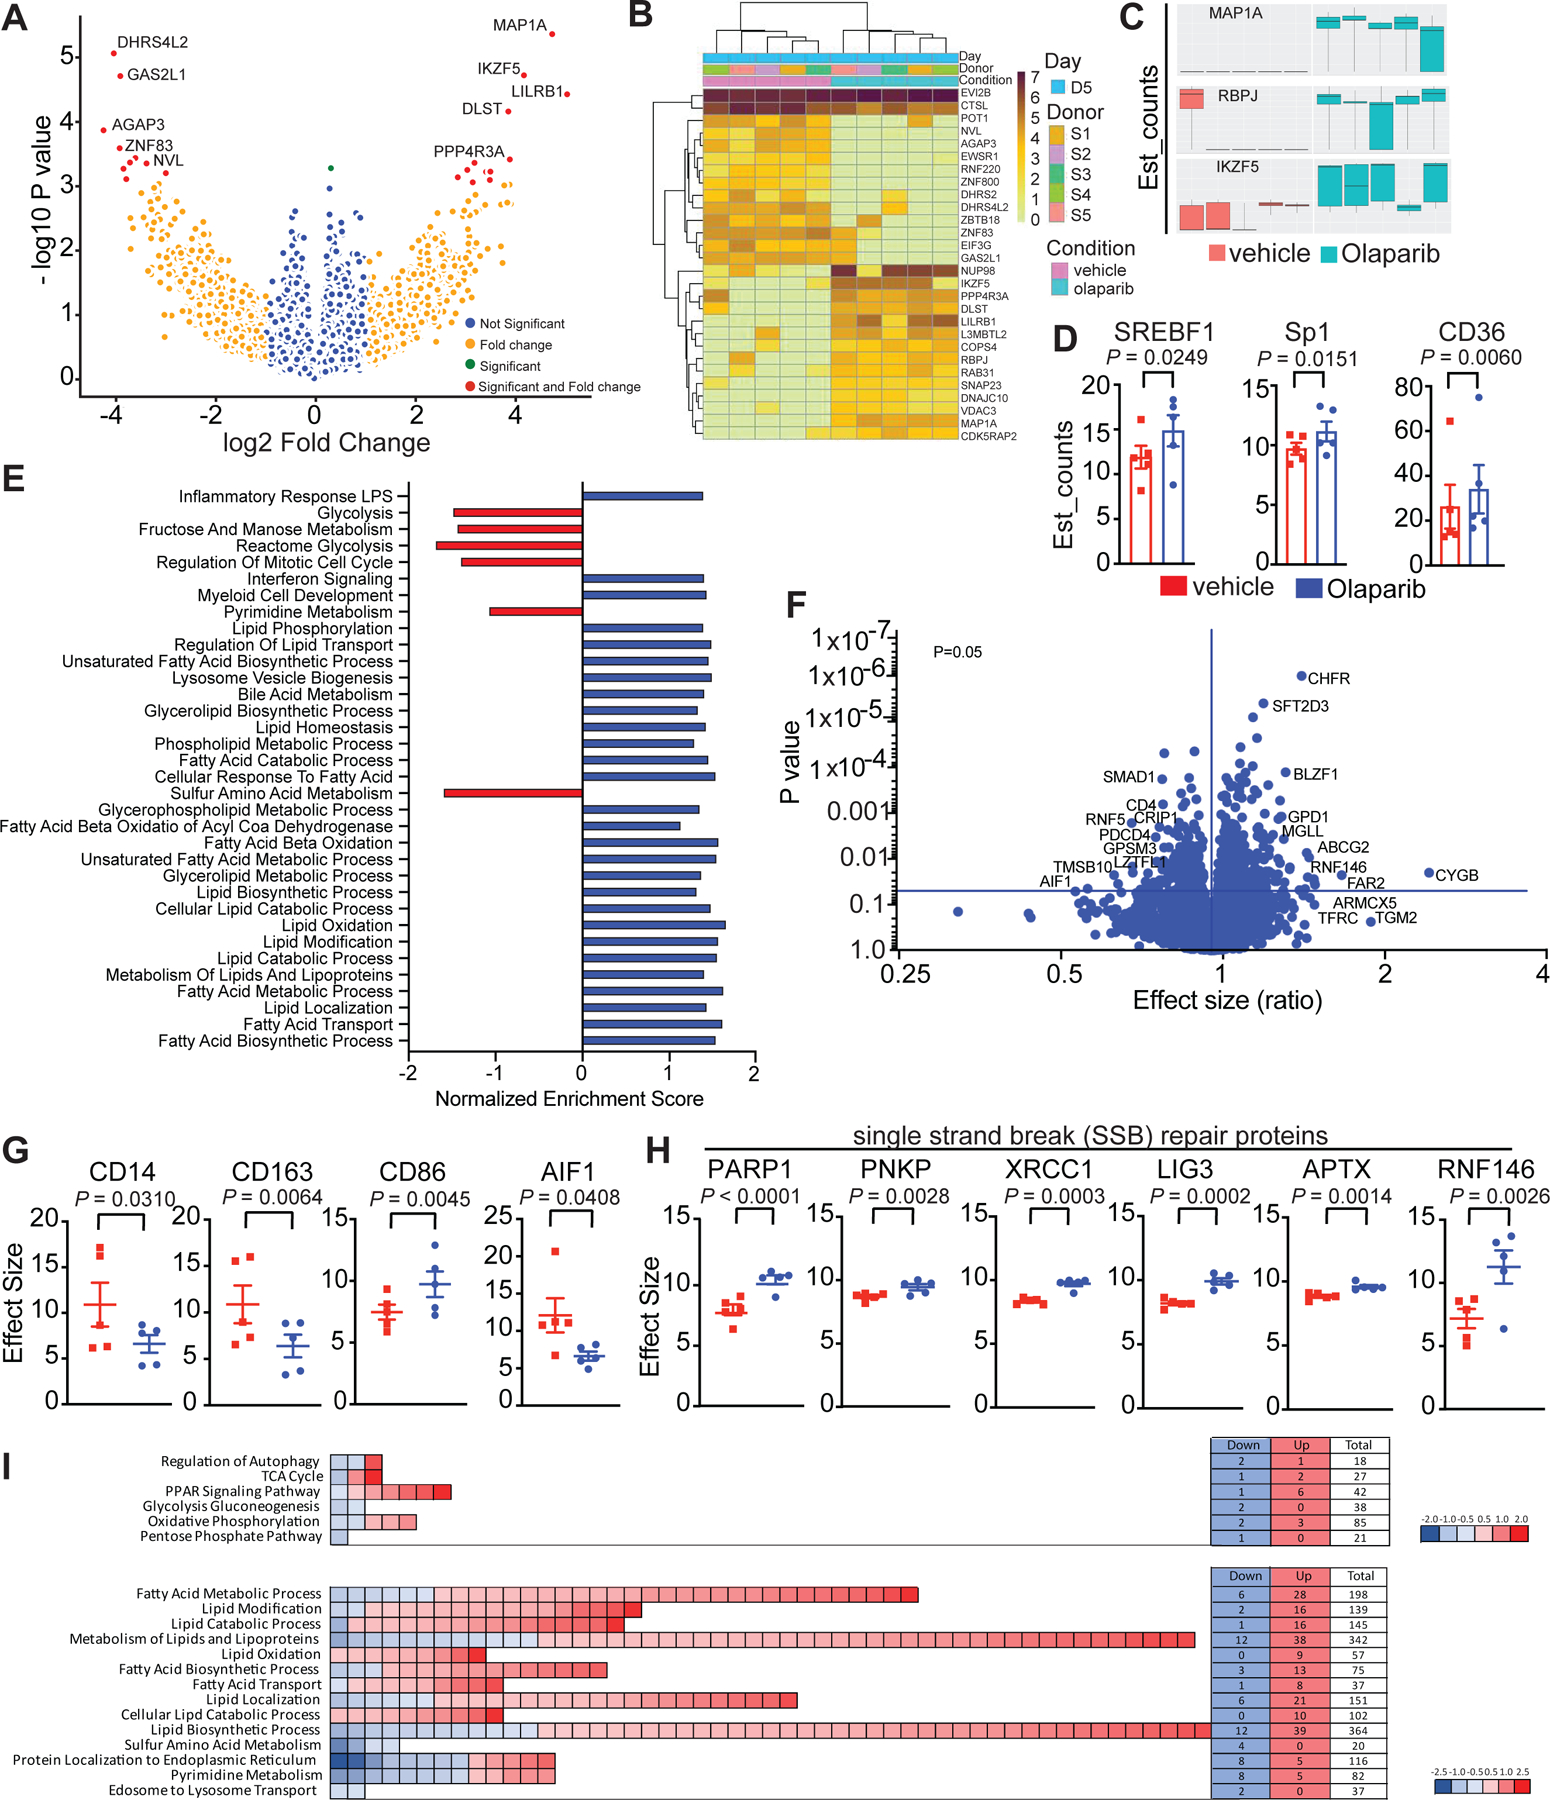
CD14+ cells from healthy human donors were isolated and differentiated to immature myeloid cells with GM-CSF + IL-4 in presence or absence of Olaparib for 5 days. a-f, RNA sequencing was performed. a, Transcriptomic data is represented as a volcano plot, showing the five most significantly upregulated or downregulated genes after Olaparib treatment and b, in a heatmap showing the most significantly upregulated (dark brown) or downregulated (light yellow) genes after Olaparib treatment. c, Box plots represents most significantly upregulated genes in donor dependent manner, all 5 donors are shown, the minimum, the maximum, the sample median are shown. Statistical analysis for transcriptomics analysis is described in the methods section. d, Genes associated with lipid metabolism are shown. Statistical analyses were performed using one-tailed t-test. Error bars represent standard error of the mean (±SEM) with n=5 healthy human donors per group. e, RNA sequencing revealed significantly enriched gene sets in Olaparib treated donors. Exact p values indicated in each panel for each comparison. f-i, Proteomics was performed and f, a volcano plot is shown, on the x-axis is the effect size (ratio) and on the y-axis is the p-value. The most significantly upregulated and downregulated proteins with a false discovery rate (FDR<0.05) are shown. g-h, Olaparib induced changes are shown. Error bars represent standard error of mean (±SEM). Statistical analyses were performed using one-tailed t-test. Exact p values indicated in each panel for each comparison. i, The number of genes associated with glucose and lipid metabolism are shown.
PARP inhibition modulates macrophage metabolism
RNAseq and proteomic analyses indicated changes in cell metabolism, specifically in lipid metabolic processes and in β-oxidation of fatty acids following Olaparib treatment (Fig. 4A–I, Extended Fig. 7A,B), including increases in key regulatory elements involved in fatty acid metabolism (Fig. 4E). To understand Olaparib-induced metabolic changes, human monocytes were differentiated, and oxidative phosphorylation and glycolysis were assayed using mitochondrial stress test (Agilent). In cells treated with Olaparib, oxygen consumption rate (OCR) fell, demonstrating depression of mitochondrial respiration synonymous with reduced OCR-linked ATP generation and diminished maximal respiratory capacity (Fig. 5A–D). Basal oxygen consumption rates (OCR) also fell, with a concomitant decrease in oligomycin-sensitive respiration; these data are consistent with decreased mitochondrial ATP production following Olaparib treatment (Fig. 5A). The maximal respiratory capacity (MRC) of myeloid cells also decreased following Olaparib treatment (Fig. 5A). Though the rate of glycolysis (measured by proton efflux rates (PER) corrected for contributions by oxidative phosphorylation) was not significantly changed at baseline, glycolytic capacity was markedly decreased in Olaparib-treated cells (Fig. 5B–D). We observed a similar trend in M-CSF-differentiated macrophages treated with Olaparib (Fig. 5E–H). The decrease in glycolysis of Olaparib-treated macrophages was further confirmed in differentiated murine macrophages by their reduced capacity to take up a fluorescent glucose analogue, 2-NBDG. Importantly, WT, parp1−/− and parp2−/− macrophages exhibited reduced glucose uptake after Olaparib, indicating the switch in metabolism is independent of PARP1 (Fig. 5I,J) and PARP2 (Extended Fig. 6 M–N). In response to Talazoparib, the WT and parp2−/− macrophages exhibited similar responses as to Olaparib but the parp1−/− macrophages resembled the wild-type macrophages, indicating a dependence on PARP1 (Extended Fig. 6F–G). The redundancy between PARP1 and PARP2 cannot be excluded in these experiments.
Figure 5. PARP inhibition modulates the glycolytic capacity of macrophages.
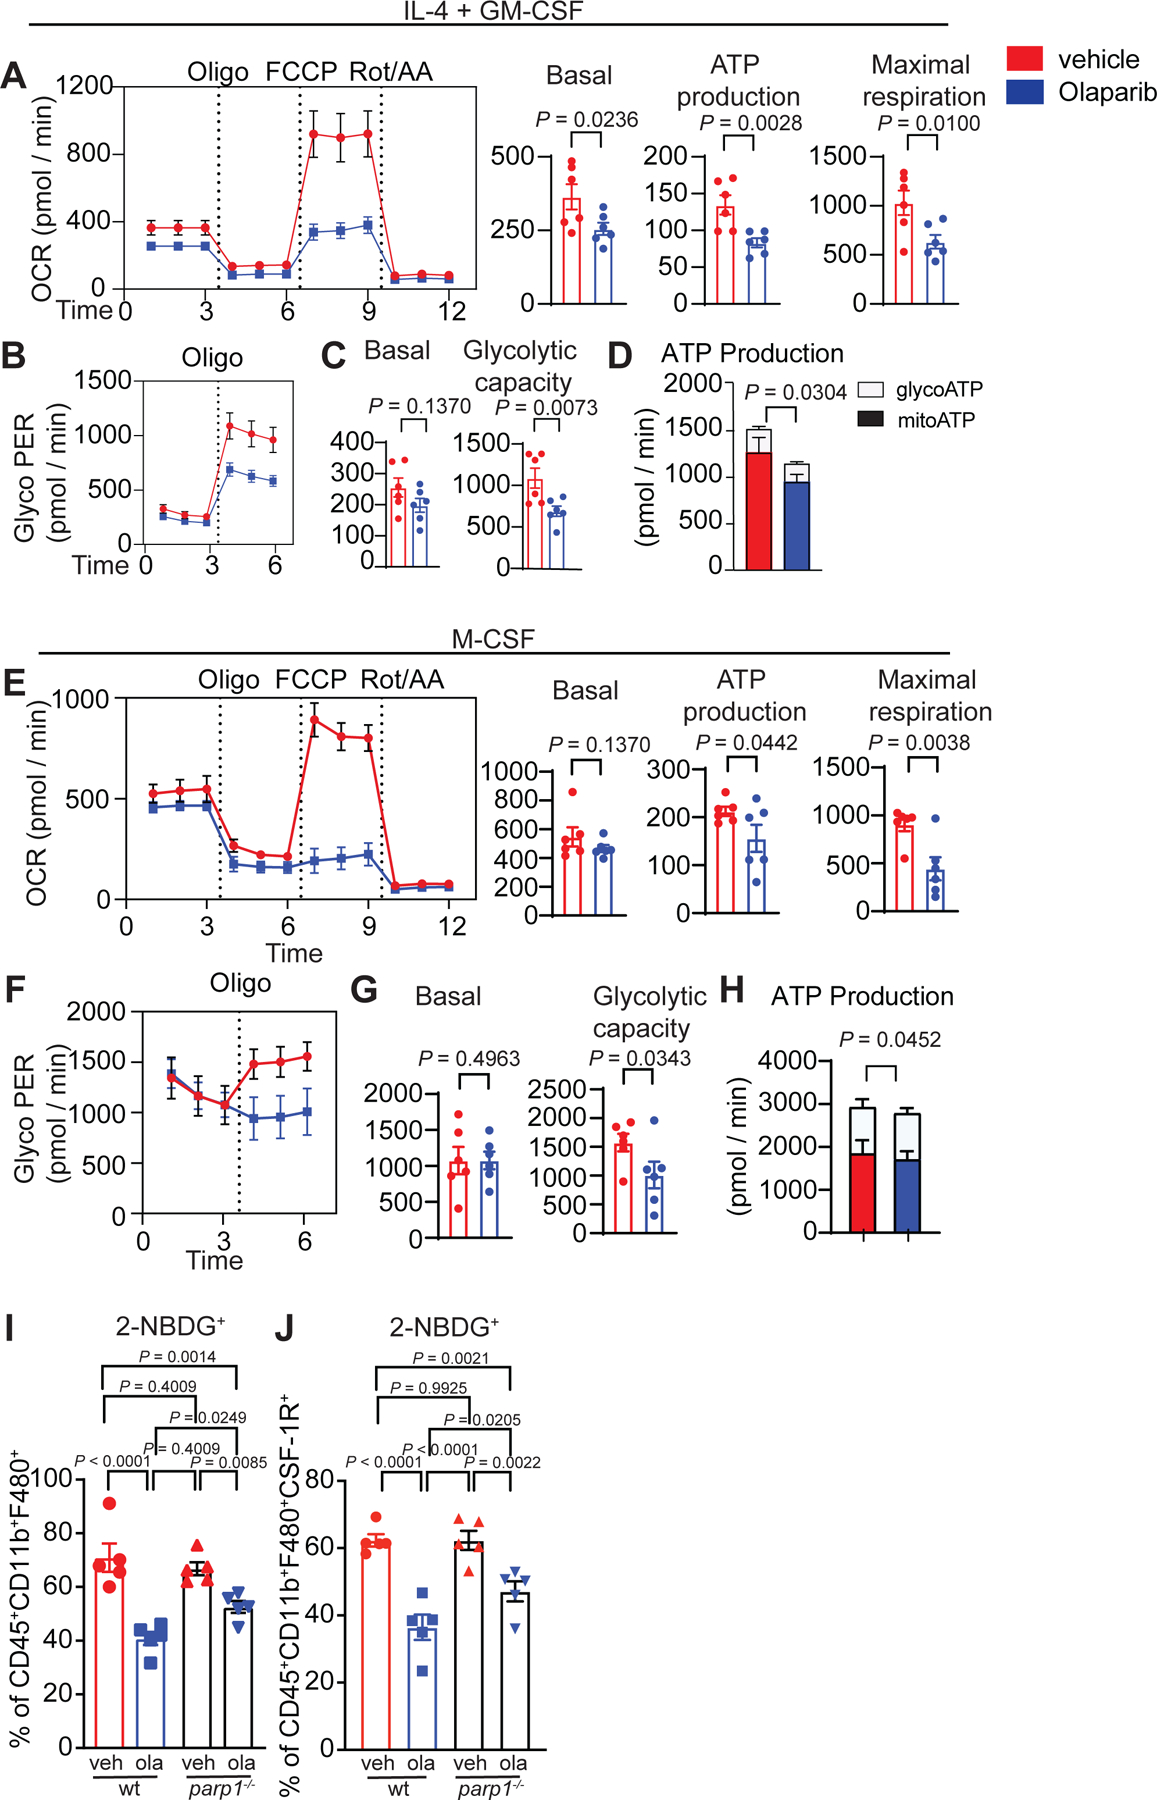
CD14+ cells from healthy human donors were isolated and differentiated to immature myeloid cells with GM-CSF + IL-4 (a-d) or M-CSF (e-h) in presence or absence of Olaparib for 5 days. Myeloid cells were collected, and extracellular flux measurements by Seahorse was performed on n=6 healthy human donors. a,e, Olaparib decreases the oxygen consumption rate of myeloid cells. b, f, Glyco PER, a proxy for the rate of lactate production measured in vehicle and Olaparib treated human myeloid cells under basal condition and after 1 μM oligomycin. c-d,g-h, Metabolic parameters obtained from the Glyco PER profiling. Error bars represent standard error of mean (±SEM). Statistical analyses were performed using one-tailed t-test. Statistical analysis for transcriptomics analysis is described in the methods section. Exact p values indicated in each panel for each comparison. i-j, Bone marrow from wild-type (wt) and parp1−/− mice were isolated and differentiated to mature myeloid cells with IL-4 plus GM-CSF in the presence or absence of Olaparib for 5 days. Both wt and parp1−/− differentiated myeloid cells treated with Olaparib exhibited reduced glucose uptake independent of PARP1. Statistical analysis was performed using One-way ANOVA with Uncorrected Fisher’s LSD. Error bars represent standard error of the mean (±SEM) with n=5 mice per group. Exact p values indicated in each panel for each comparison.
Macrophages dependent on lipid metabolism contribute to an immune-suppressive TME and fatostatin, a fatty acid synthesis (FAS)/sterol regulatory element-binding protein 1 (SREBP1) inhibitor, has been shown to enhance checkpoint blockade therapy.48 To determine if the SREBP1 and/or STING pathways regulate the Olaparib-induced macrophage phenotype, inhibitors for these pathways were incorporated into our ex vivo human macrophage differentiation assays (Extended Fig. 8A–E). SREBP1 inhibition rescued the Olaparib-induced expression of PD-L1 and CSF-1R (Extended Fig. 8C–D). STING was likely not the major mediator of the phenotype because a STING agonist increased expression of CD80, PD-L1 and pTBK1, but not CSF-1R (Extended Fig. 8F) and sting−/− macrophages behaved like wildtype macrophages (Extended Fig. 8G–L). Taken together, these data suggest that the SREBP1 is a major regulator of the Olaparib-induced macrophage phenotype.
Anti-CSF-1R therapy reduces immune-suppressive macrophages and overcomes PARP inhibitor resistance in BRCA1-deficient TNBC
Anti-CSF-1R therapy has been shown to deplete a subset of macrophages, primarily tumor promoting macrophages12,49, therefore, we hypothesized that targeting CSF-1R-positive macrophages would enhance Olaparib treatment. To test this hypothesis, mice bearing BRCA1-deficient TNBC tumors were treated with vehicle, anti-CSF-1R, Olaparib or anti-CSF-1R plus Olaparib for 35 days. In Olaparib-treated animals, tumor growth was inhibited (Fig. 6A) and the median overall survival was extended from 11 days to 63 days (Fig. 6B). Anti-CSF-1R was not active as a single agent, however, when anti-CSF-1R was administered in combination with Olaparib, overall survival was significantly extended (median overall survival of 82.5 days; Fig. 6A–B). Moreover, the combination of anti-CSF-1R plus Olaparib induced complete elimination of tumors by day 34 in 4 out of 5 mice and the effect was durable to day 63, when Olaparib monotherapy-treated mice reached endpoint (Fig. 6C). To characterize changes in the TME after 5 days of treatment, tumors were isolated from mice and analyzed by flow cytometry. Olaparib alone and in combination with anti-CSF-1R induced a small but significant reduction in tumor burden (Extended Fig. 9A). As previously described12, anti-CSF-1R reduced the frequency of F480+ macrophages and selectively depleted CD206-expressing pro-tumor macrophages (Fig. 6D). This effect was associated with an increase in the ratio of anti-tumor (CD40+F480+) to pro-tumor (CD206+F480+) macrophages (Fig. 6E). Importantly, anti-CSF-1R therapy significantly reduced the Olaparib-mediated increase in expression of CSF-1R and PD-L1 on F480+ macrophages (Fig. 6D). While single agent anti-CSF-1R treatment did not increase either MDSCs or neutrophils, both were significantly increased following anti-CSF-1R plus Olaparib treatment (Extended Fig. 9D).
Figure 6. Anti-CSF-1R therapy enhances PARP inhibitor therapy in BRCA1-deficient TNBC.

Mice bearing BRCA-deficient TNBC tumors were treated with either vehicle, anti-CSF-1R, Olaparib, or anti-CSF-1R plus Olaparib for the indicated time. Mice were treated daily with Olaparib (50 mg kg−1, IP) and twice a week with anti-CSF-1R (1.2 mg/mouse). a-c, Mice were treated for 35 days and tumor volumes were recorded at indicated time points. The combination of anti-CSF-1R plus Olaparib significantly increased overall survival compared to single agent treatment. The number of mice are shown, with median survival. Statistical analysis was performed using Gehan-Breslow-Wilcoxon test. c, Four out of 5 mice treated with anti-CSF-1R plus Olaparib remained tumor free out to day 63, whereas the Olaparib treated mice had relapsed. Error bars represent standard error of mean (±SEM). Statistical analyses were performed using two-tailed t-test with n=5 mice per group. d-e, Mice were treated for five days and tumors were harvested and immunophenotyping was performed by flow cytometry and changes in macrophages are shown. Statistical analyses were performed using one-way ANOVA with n=5 mice per group. f-g. K14-Cre Brca1f/fTrp53f/f parental and BRCA1 restored isogenic tumors were treated for 5 days, (f) n=5 mice per group except Olaparib group where there were n=6 mice per group; and (g, left) n=3 tumors per group and (g, right) n=4 tumors per group. f, Flow cytometry revealed decreased recruitment of macrophages into BRCA1-restored tumors. g, qRT-PCR analysis of brca1 and csf1 of murine K14-Cre Brca1f/fTrp53f/f parental and BRCA1-restored cells. K14 cells were treated with 5 μM of Olaparib for 72 hours. h-i, Nude mice were inoculated with MDA-MB-436 parental or BRCA1-restored tumor cells,(h) n=5 mice per group and (i, left) n=3 tumors per group and (i, right) n=4 tumors per group. h, Tumor volume. i, qRT-PCR analysis of brca1 and csf1. Error bars represent standard error of mean (±SEM). Statistical analyses were performed using two-way ANOVA. j, Olaparib-resistant tumors were implanted into immunocompetent animals as described and mice were treated with vehicle, anti-CSF-1R, Olaparib, or anti-CSF-1R plus Olaparib for the indicated time. Statistical analysis was performed using Gehan-Breslow-Wilcoxon test. Mice in the anti-CSF-1R plus Olaparib treatment group exhibited decreased tumor volume at day 31. Statistical analyses were performed using unpaired two-tailed t-test. Error bars represent standard error of mean (±SEM) with n=4–6 mice per group, as shown. k, Mice bearing 4T1 tumors were treated as indicated and tumor volume was collected out to day 21. Statistics were performed using a 2-way ANOVA with Turkey test with n=7 mice in the Veh and anti-CSF-1R groups and n=8 in the Olaparib and Olaparib plus anti-CSF-1R groups. l-t, Mice bearing EMT6 tumors were treated as indicated. l, Overall survival (left) and tumor burden (right) was plotted, number of mice per group are shown. m-t, Mice bearing EMT6 tumors were treated for 5 days and tumors were harvested for flow cytometry. Statistical analysis was performed using one-way ANOVA with Uncorrected Fisher’s LSD. Error bars represent standard error of the mean (±SEM) with (n=4–5) mice per group. Exact p values indicated in each panel for each comparison.
NanoString gene expression revealed changes in IL-1 and TNF signaling following Olaparib therapy, which can be secreted by anti-tumor macrophages. Patients with high IL-1β expression exhibit improved overall survival.50 Olaparib increased the frequency of F480+ macrophages expressing IL-1β and anti-CSF-1R therapy increased expression of the IL-1β receptor IL-1R2 (Extended Fig. 9E). CD11b and CD11c positive cells revealed similar activation of the IL-1 signaling pathways (Extended Fig. 9G–I). Both anti-CSF-1R and Olaparib, alone and in combination, significantly increased the expression of TNFα on F480+ macrophages, CD11b+ myeloid cells and CD11c+ DCs; however, expression of its receptors CD120a (TNFRI) and CD120b (TNFRII) was not changed (Extended Fig. 9F, H, J).
The efficacy of anti-CSF-1R plus Olaparib is dependent on the BRCA-status of tumor cells
To determine if the combination of anti-CSF-1R plus Olaparib recruits macrophages to tumors independent of BRCA1 status of the tumor cell, K14-Cre-Brca1f/fp53f/f tumor cells were restored with BRCA1. After 5 days of treatment, BRCA1-restored tumors had attenuated recruitment of macrophages to tumors (Fig. 6F) and had attenuated CSF-1 expression after Olaparib treatment compared to BRCA-deficient tumor cells (Fig. 6G). Further confirming these findings, human MDA-MB-436 tumor cells restored with BRCA1 failed to respond to single-agent Olaparib treatment (Fig. 6H) and like the K14 BRCA1-restored tumors, had attenuated induction of CSF-1 in response to Olaparib (Fig. 6I). To determine if this combination could overcome acquired resistance, Olaparib-resistant tumors were obtained from mice that relapsed despite daily treatment and implanted into naïve mice. Olaparib treated tumors displayed some response to Olaparib but were more resistant than their parental tumor, and the combination overcame PARP inhibitor resistance (Fig. 6J).
We next tested the combination in two BRCA-proficient TNBC murine models, 4T1 and EMT6. Neither murine model exhibited single agent efficacy and the combination of anti-CSF-1R plus Olaparib was not effective in the 4T1 model (Fig. 6K) yet elicited a small reduction in tumor burden in the EMT6 model (Fig. 6L). Immunophenotyping of the EMT6 model after 5 days of treatment revealed no increase in leukocyte or myeloid recruitment (Fig. 6M–O) and no change in the expression of macrophages expressing CSF-1R, PD-L1 or CD206 (Fig. 6P–R) after Olaparib. The increase in CTL:Treg ratio in the combination treatment, may have attributed to the observed efficacy (Fig. 6S,T). Taken together this indicates that the BRCA status of the tumor cell dictates the outcome of the TME related to monocyte/macrophage recruitment after Olaparib treatment.
Olaparib-treated differentiating macrophages functionally suppress T-cells
To test how Olaparib-treated macrophages may functionally influence the TME, media alone, media with Olaparib, or media collected from human macrophages differentiated in vehicle or Olaparib were collected for this purpose. Conditioned media from Olaparib-treated macrophages induced cell death in the BRCA1-proficient human TNBC BT20 and ER+ MCF7 cell lines, whereas Olaparib by itself was not able to induce cell death (Extended Fig. 10A,B). Similarly, T-cells were cultured for 48 hours in the different media conditions to test the impact on T-cell viability and function. Olaparib alone enhanced T-cell viability (Extended Fig. 10C–D) whereas supernatant from Olaparib-treated macrophages diminished T-cell viability and induced apoptosis (Extended Fig. 10C–D). The Olaparib-treated macrophage supernatants induced both tumor cell and T-cell death suggesting this is independent of the BRCA1 status of the target cell. Additionally, IFN-γ production from T-cells treated with Olaparib-alone was enhanced, but supernatant from Olaparib-treated macrophages abolished this effect and further reduced expression of IFN-γ (Fig. 7A). To gain insight if Olaparib-treated macrophages may shift T-cell metabolism, Seahorse ATP rate assay was used to measure glycolytic and mitochondrial-specific metabolic energy. Olaparib alone did not reduce glycoATP or mitoATP, but supernatants from Olaparib-treated macrophages diminished glycoATP and promoted mitoATP (Fig. 7B–C), indicating that Olaparib-treated macrophages reshape T-cells away from effector metabolic phenotype.
Figure 7. Olaparib-treated macrophages suppress T-cell function, which is overcome with anti-CSF-1R therapy in BRCA1-deficient TNBC.

a-c, OT-1 T cells cultured in supernatants collected from media with vehicle (red) or Olaparib (blue), and media collected from human macrophages treated with vehicle (black, donors 1–3), or human macrophages treated with Olaparib (light blue, donors 1–3) were assessed for a, IFN-g expression using FACS analysis and b, glycolytic or c, mitochondrial ATP production using Seahorse Bioanalysis. Error bars represent standard error of mean (±SEM). Statistical analyses were performed using paired t-test or one-way ANOVA as indicated on graphs. d-j, Mice bearing BRCA-deficient TNBC tumors were treated with either vehicle, anti-CSF-1R, Olaparib, or anti-CSF-1R plus Olaparib for the indicated time. Mice were treated daily with Olaparib (50 mg kg−1, IP) and twice with anti-CSF-1R (1.2 mg/mouse). d-f, Mice were treated for 5 days and tumors were collected for flow cytometry to analyze T-cell populations. Error bars represent standard error of mean (±SEM). Statistical analyses were performed comparing each group using one-tailed t-test. g, Overall survival is shown for all treatment groups indicated. The median survival is shown in brackets with (n=6–14 mice/group). Survival analysis was done using percent survival with Gehan-Breslow-Wilcoxon test in Graph Pad prism and p-values. h-j, Seven-day treated mice were injected IP with a fluorescent labeled glucose analogue, 2-NBDG 30 minutes before tumors were harvested and glucose uptake was measured by flow cytometry. k-l, Mice were treated with fatostatin to inhibit lipid metabolism. k, Tumor volumes at day 14 (k) and 105 (l) are shown. Statistical analysis was performed using One-way ANOVA with Uncorrected Fisher’s LSD for subfigures h, j and unpaired one-tailed t-test for subfigures i, k-l. Error bars represent standard error of the mean (±SEM) with n=3–6 mice per group. Exact p values indicated in each panel for each comparison.
CD8+ T-cells are required for efficacy of anti-CSF-1R plus PARP inhibitor therapy
After 5 days of treatment there was a significant increase in the frequency of cytotoxic T-cells (CTLs; scored as GrB+ of CD8+ CD45+) following Olaparib therapy, which was further increased when Olaparib was combined with anti-CSF-1R (Fig. 7D). In addition, there were significantly fewer Tregs (FoxP3+CD4+ cells) following single-agent and combination therapy (Fig. 7E) which resulted in a significant increase in the ratio of CTLs to Tregs (Fig. 7F). To determine if CD8+ T-cells are required for anti-tumor responses observed with anti-CSF-1R plus Olaparib, CD8+ T-cells were depleted in each of the treatment arms (Extended Fig. 10 E–G). The combination of anti-CSF-1R plus Olaparib significantly extended overall survival by approximately 100 days compared to Olaparib alone and was abolished when CD8+ T-cells were depleted (Fig. 7G). Thus, reductions in immune-suppressive macrophages and increases in CD8+ T-cells both appear to play a role in the responses observed and in the long-term overall survival achieved in mice bearing BRCA1-deficient TNBC treated with anti-CSF-1R plus Olaparib.
The SREBP1 pathway contributes to PARP inhibitor resistance
Informed by the Olaparib-induced metabolic phenotype changes of macrophages identified ex vivo, we next sought to identify this phenotype in vivo. Tumor bearing K14-Cre-Brca1f/fTp53f/f mice were treated for 4–7-days and prior to harvesting tumors, mice were injected with a fluorescent glucose analogue, 2-NBDG, to measure glucose uptake in vivo. In line with the ex vivo analysis, Olaparib treatment significantly reduced the ability of tumor macrophages to take up glucose, which was restored with anti-CSF-1R treatment (Fig 6H, Extended Fig. 10H). These findings were consistent with the Olaparib-induced metabolic switch away from glycolysis to lipid metabolism. Interestingly, T-cells in the tumor also had impairment of glucose uptake following Olaparib treatment and this was also restored after anti-CSF-1R treatment (Fig. 7I–J).
To test how the SREBP1 pathway may contribute to Olaparib resistance, K14-Cre-Brca1f/fTp53f/f tumor bearing mice were treated with vehicle, anti-CSF-1R, Olaparib or anti-CSF-1R plus Olaparib with or without fatostatin (Fig. 7K). At day 105, when most mice had reached study endpoint, 5/6 mice treated with anti-CSF-1R plus Olaparib were still viable. Interestingly, the only other group with more than 50% surviving mice was the triple combination of anti-CSF-1R plus Olaparib plus fatostatin; which had significantly smaller tumors when compared to tumors in mice treated with the double combination of anti-CSF-1R plus Olaparib (Fig. 7L). Mice treated with Olaparib plus fatostatin did not display a survival benefit indicating that CSF-1R+ macrophages and the SREBP1 pathway are major regulators of PARP inhibitor resistance.
Discussion
This work has established that macrophages are prevalent in TNBC and that their numbers are significantly increased in BRCA1-associated TNBC. Extensive characterization of tumor macrophages in a mouse model of BRCA1-deficient TNBC revealed that macrophages are further increased after PARP inhibitor treatment and have both anti- and pro-tumor phenotypes. We found that Olaparib increased expression of CD80 and CD40 and activated the STING pathway of macrophages from murine tumors and human macrophages differentiated ex vivo, indicative of an anti-tumor phenotype. However, a concomitant increase of the immune-suppressive ligands PD-L1 and CSF-1R, and a switch from glycolysis to lipid metabolism occurred, which would be expected to limit anti-tumor activity. Further, Olaparib-treated macrophages functionally limited T-cell proliferation and anti-tumor function. Based on the changes that Olaparib exerts on differentiating macrophages, we combined anti-CSF-1R and Olaparib therapy in a BRCA1-defecient TNBC mouse model. This combination reduced the number of CD206+/PD-L1+/CSF-1R+ pro-tumor macrophages and restored their glycolytic function, which translated to improved durability of response and progression-free survival compared to Olaparib alone.
The therapeutic benefit of anti-CSF-1R plus Olaparib was restricted to BRCA-associated TNBC, as BRCA-WT TNBC had relatively limited response to Olaparib or the combination. Olaparib treatment failed to recruit macrophages to BRCA1-proficient tumors and had attenuated expression of CSF-1 compared to vehicle. We further identified that Olaparib significantly alters differentiating macrophages but has little effect on mature macrophages (Fig. 3H–P and Extended Fig. 4). These data suggest that changes in the macrophage component of the TME resulting from systemic Olaparib treatment are dependent on BRCA-deficient tumor cell death, as well as CSF-1 recruitment of CSF-1R+ monocytes that differentiate to macrophages (Fig. 7).
PARP1 maintains genome stability through SSB repair, nucleotide excision repair, double strand break repair and the stabilization of replication forks.51 The role of PARP1 in multiple DNA repair pathways, as well as PARP trapping have explained the synthetic lethality of PARP inhibition in BRCA1/2-deficient cells44,51, however PARP inhibitors can have PARP‐independent cellular functions.47 Here we provide evidence that Olaparib can modulate the maturation, phenotype, function and metabolic state of macrophages through PARP1-independent and dependent pathways, which can be reversed by inhibiting SREBP1. While the majority of PARP inhibitor activity is attributed to PARP1 (80%–85%), the remaining (15–20%) is dependent on PARP252, however we did not find that PARP2 was involved in the regulation of macrophage phenotype in response to PARP inhibitor treatment. However, we cannot exclude redundancy between PARP1 and PARP2 in these experiments.
Macrophage metabolism has been an area of intense study and it has been shown that the functionality of macrophages can be influenced by metabolic programming.48,53 In Olaparib-treated macrophages, we observed a significant decrease in glycolysis and a shift to pathways associated with lipid metabolism. We reveal both tumor macrophages and ex vivo cultured human macrophages have decreased ability to take up glucose. We found that Olaparib modulated the metabolic profile of differentiated macrophages through a PARP1-independent process; yet was dependent on PARP1 after Talazoparib treatment. Further work is required to define the mechanisms of how Olaparib and Talazoparib regulate the observed differences in metabolism through PARP1. This is in line with other reports where the PARP1-p38 pathway has been shown to play a central role in the glycolytic flux of cells where either silencing of PARP1 or inhibition of p38 has been shown to prevent mitochondrial respiration and glycolytic activity.54,55 Similarly, PARP1 expression and activity has been shown to negatively regulate ATP-binding cassette transporters (ABCA1) expression and cholesterol efflux in macrophages56 and PARP2 expression negatively regulates de novo cholesterol biosynthesis through suppression of SREBP1. PARP inhibition has been shown to induce SREBP1 protein expression by modulating the transcription factor specificity protein 1 (Sp1), which leads to increased lipid accumulation in the liver57, consistent with our finding of increased gene expression of SREBF1 (gene for SREBP1) and Sp1 increase after Olaparib treatment. Taken together with recent reports demonstrating that macrophages dependent on lipid metabolism are immune-suppressive, our data suggest that the metabolic rewiring of macrophages in response to PARP inhibition may limit PARP inhibitor efficacy and contribute to resistance.
Combining PARP inhibitors with anti-CSF-1R therapy represents a strategy for anti-cancer therapy in BRCA-associated TNBC. There is early clinical data suggesting tolerability of CSF-1/CSF-1R-targeting compounds28 and PARP inhibitors have been well tolerated.58 Mature data on the efficacy of anti-CSF-1R therapy in humans is not yet available but compelling anti-tumor activity has been observed in diffuse-type tenosynovial giant cell tumors (dt-GCT), a benign connective tissue disorder driven by CSF-1 that involves an abnormally high density of macrophages59, in which an oral CSF-1R inhibitor has been FDA approved.60 We demonstrate here that BRCA-associated TNBC cells increase CSF-1 expression after exposure to Olaparib, suggesting a similar recruitment mechanism of macrophages to BRCA-associated TNBC compared to Dt-GCT. Resistant mechanisms to anti-CSF-1R have been identified, including AIF1+ macrophages that drive recurrent glioblastomas in a murine model following anti-CSF-1R treatment.29 Interestingly, Olaparib decreased expression of AIF1 in ex vivo human myeloid cell (Extended Fig. 7E). In addition, PARP enzyme activity has been shown to suppress PD-L1 tumor cell expression where low levels of PARylation have been found in PD-L1 high tumors. PARP inhibitor therapy blocks PARP1 PARylation which may lead to increased PD-L1 expression41, which is consistent with the increase in PD-L1 expression observed on tumor macrophages and ex vivo cultured human monocytes after Olaparib. Importantly, anti-CSF-1R treatment reverses Olaparib-induced PD-L1 expression on myeloid cells (Fig. 6D). Taken together, these findings provide rationale for the use of anti-CSF-1R with PARP inhibitor therapy.
In, summary, our data demonstrate the importance of detailed, mechanistic, analysis of the TME before and after therapy with an emphasis on profiling the precise signaling and metabolic states of diverse immune cell populations. Mechanistic studies performed ex vivo aimed at identifying drug-induced changes in specific cell populations may also inform how immuno-oncology agents and cytotoxic therapies can best be combined to increase the frequency and durability of anti-tumor responses. We have shown that Olaparib induces differentiation, maturation and anti-tumor activation of macrophages, which subsequently turn on an immune-suppressive signaling pathway, manifested by increased PD-L1 and CSF-1R expression, as well as reliance on lipid metabolism. The observation that Olaparib induces an anti-tumor macrophage phenotype but drives them to a dependence on CSF-1/CSF-1R signaling translate to an important therapeutic strategy for BRCA1-associated TNBC. We have shown that Olaparib induces differentiation, maturation and anti-tumor activation of macrophages, which subsequently turn on an immune-suppressive signaling pathway, manifested by increased PD-L1 and CSF-1R expression, as well as reliance on lipid metabolism (Figure 8).
Figure 8. Anti-CSF-1R therapy overcomes PARP inhibitor-induced immune-suppressive macrophages and activates an anti-tumor immune response in BRCA-associated TNBC.
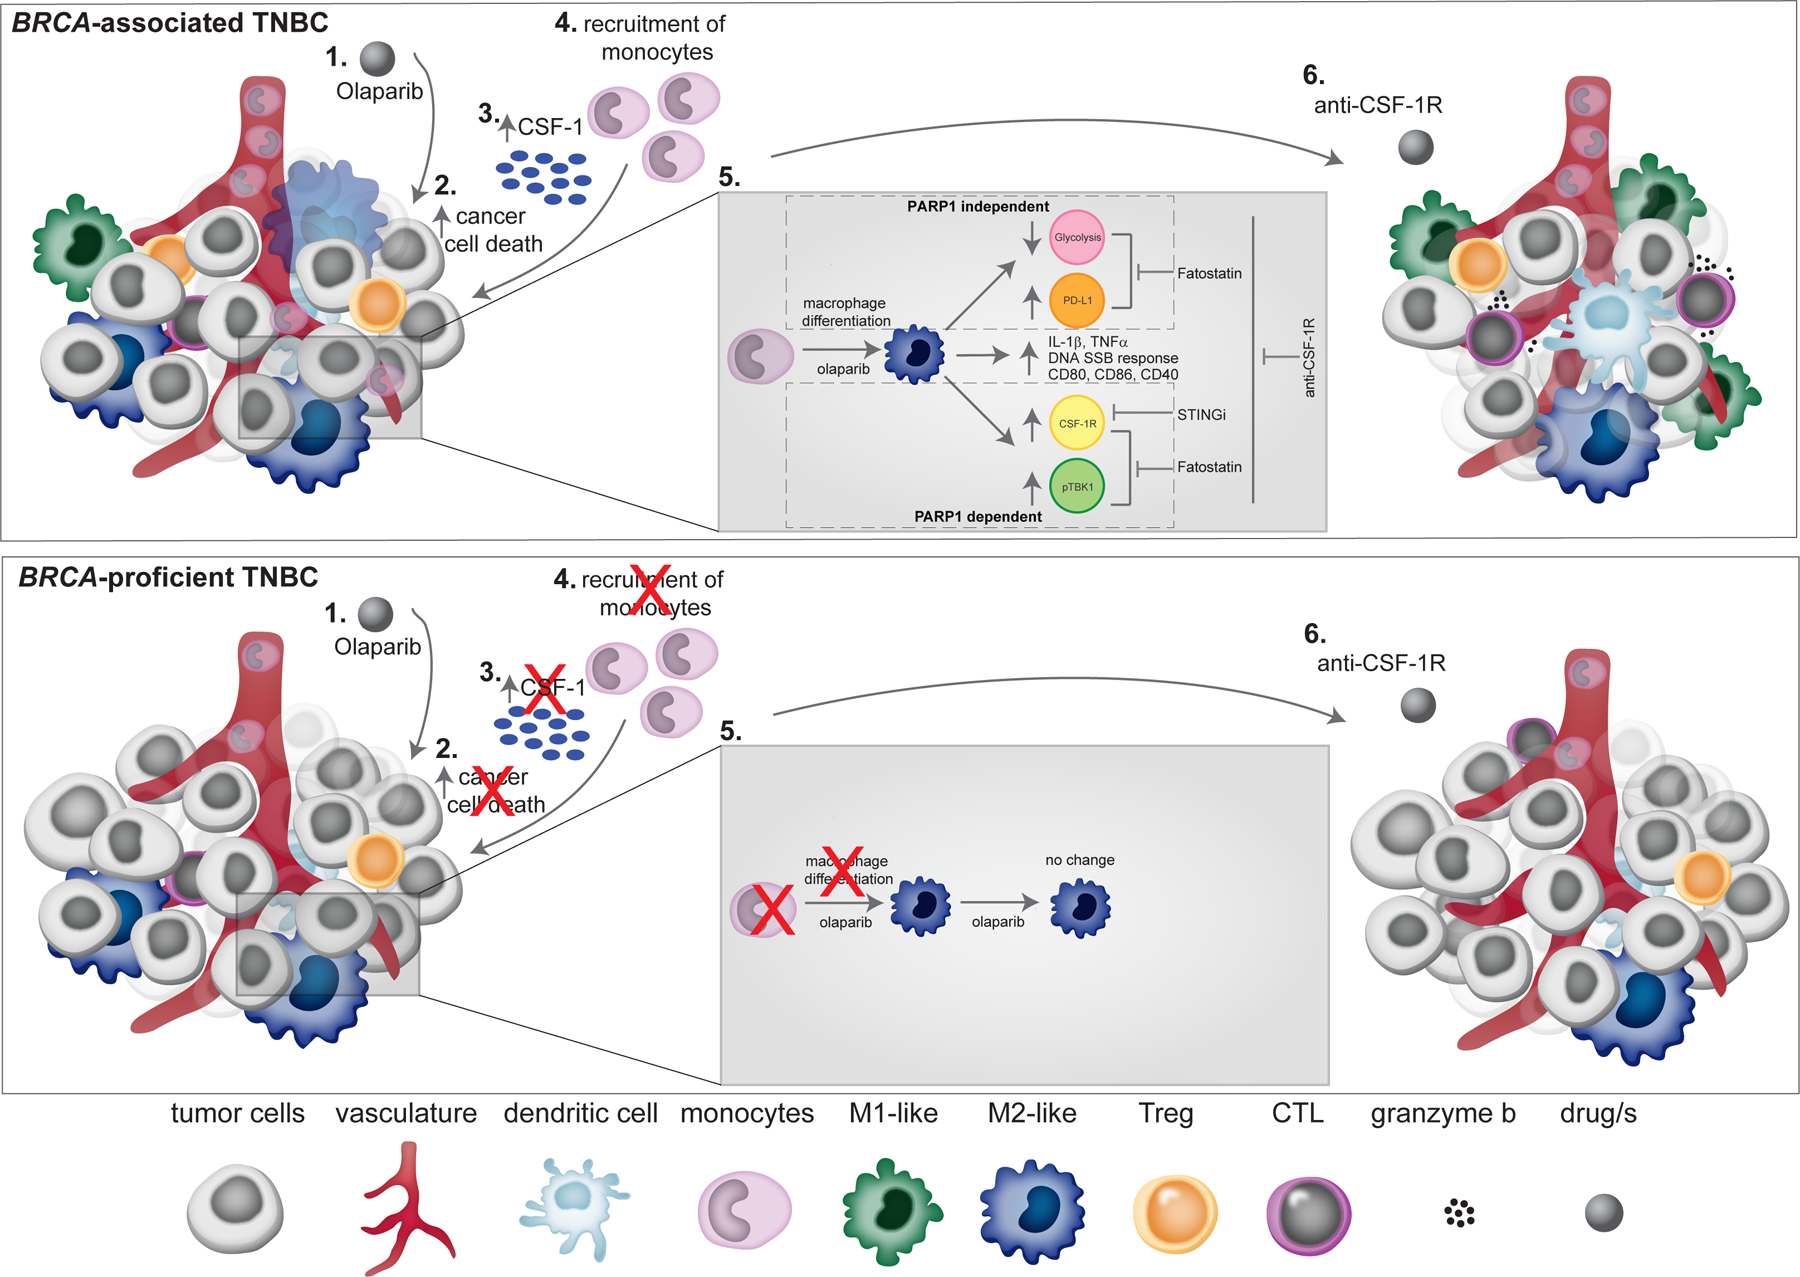
Schematic overview of PARP inhibitor-induced changes of tumor macrophages in BRCA-associated and proficient TNBC. In BRCA-associated TNBC: (1) Olaparib treatment induces cancer cell death (2), which leads to increased expression of CSF-1(3), leading to recruitment of monocyte to the tumor (4). (5) Olaparib enhances the differentiation of monocytes to macrophages and decreases glycolytic capacity and increase in PD-L1 expression in macrophages that is PARP1-independent. Olaparib increases the expression level of CSF-1R and pTBK1 in macrophages that is PARP1-dependent. Olaparib also induces expression of pro-inflammatory cytokines (IL-1β and TNF-α), DNA SSB repair response, and expression of co-stimulatory/activation molecules (CD86, CD80 and CD40) on macrophages. Fatostatin reverses the immune-suppressive phenotypic changes on macrophages caused by Olaparib. (6) Addition of anti-CSF-1R to Olaparib leads to an increase in M1-like macrophages and CTLs, which leads to tumor reduction. In the setting of BRCA-proficient TNBC, Olaparib does not induce cancer cell death and therefore there is attenuated tumor cell CSF-1 expression and no recruitment of monocytes to the tumor.
Methods
Patients and tumor samples
Tumors were obtained from untreated, de-identified TNBC breast cancer patients from Dana-Farber Cancer Institute (DFCI) and Beth Israel Deaconess Medical Center (BIDMC) from consented patients. Formalin-fixed, paraffin embedded (FFPE) tissue was sectioned at 5 μm. All analysis was approved by the institutional review boards of DFCI or BIDMC.
CyCIF in TNBC samples
CyCIF (https://www.cycif.org/) was performed as described previously.61 Briefly, unstained slides (USS) were baked (30 mins at 60oC) and antigen retrieval was performed using Leica BOND RX with ER1 solution (Leica Biosystems #AR9961). The staining steps were done at 4oC overnight and bleaching steps were performed with 25mM NaOH with 4.5% H2O2 for 45 mins with light exposure. All antibodies are detailed in Table 1. The RareCyte CyteFinder (RareCyte, Seattle, WA) was used for image capturing. Ashlar (https://github.com/labsyspharm/ashlar) was used to stitch or merge up to 165 images in one round of CyCIF for a total of 990 images from 6 rounds of CyCIF per sample. This combined image is then viewable using Omero (https://www.openmicroscopy.org/omero/) due to the computational size of the combined image. Single-cell segmentation of the stitched image used the watershed algorithm based on nuclear staining of Hoechst 33342 to generate a nuclear mask image, which defines the single-cell regions extended by 3 pixels to define a cell boundary62. Within the single cell ROIs, gating a ‘positive’ or ‘negative’ status for each marker is conducted based on the local minimum implemented in a custom ImageJ/Matlab script.
Code repository of ongoing improvements for Ashlar (https://github.com/labsyspharm/ashlar), segmentation, and analysis (https://github.com/sorgerlab/cycif). Static copy of analysis version is stored at https://github.com/breasttumorimmunologylab/TAM-PARP-2019. To view all tumors analyzed in this study please visit: https://www.cycif.org/data/mehta-2020/.
In vivo studies
For mouse experiments utilizing the K14-Cre-Brca1f/fTp53f/f mouse model of TNBC, female FVB/N mice (Jackson laboratory #001800) were bred with 129P2/OlaHSD (Envigo) males and their F1 generation females (FVB/129P2) were used for experiments. Female FVB/129P2 mice that were approximately 6–8 weeks old were orthotopically implanted in the 4th mammary fat pad with tumor chunks from K14-Cre-Brca1f/f Tp53f/f mice. Tumors that relapsed on Olaparib treatment (Olaparib-resistant tumors) were collected and viably frozen in Bambanker (Thermo Fisher Scientific #50999554). NU/J (Jackson Laboratory #002019) were inoculated with 1E6 MDA-MB-436 WT cells or MDA-MB-436 with reconstituted human BRCA1. BALB/c mice (Jackson Laboratory #00651) were inoculated with 2E5 EMT6 cells in PBS or 5E4 4T1 cells in 1:1 of Matrigel and PBS in the 4th mammary fat pad. When 4T1 tumors reached 20–70 mm3 mice were randomized based on the tumor volume and enrolled in experiments. For all other mouse experiments, when tumors reached 80–200 mm3 (about 3 weeks post-transplantation) mice were randomized based on the tumor volume and enrolled in experiments. Caliper measurements were used to calculate the tumor volume ((length × width2)/2). Mice were weighed 2 times per week to monitor drug-induced toxicity.
Six-week-old 129S1/Svlmj (Jackson laboratory #002448) and 129S-Parp1tm1Zqw/J (Jackson laboratory #002779) mice were used for the parp1−/− bone marrow studies. parp2−/− mice were of C57BL/6J background (a kind gift from Dr José Yélamos López, described previously63), and sting−/− mice were purchased from Jackson Labs (#025805) and C57BL/6J and were 6 weeks old. All mice were maintained within the Dana-Farber Cancer Center (DCFI) animal facility and all experiments were conducted in accordance with DCFI Policy on the Welfare, Care and Treatment of Laboratory Animals and were approved by the DFCI Institutional Animal Care and Use Committee. According to the animal welfare policy at DFCI, mice are euthanized when tumors reach 2 cm size in any direction. Only mice meeting the endpoint criteria were included in survival graphs, mice who died for unrelated reasons were excluded.
Animal dosing and depletion experiments
Mice were treated with daily with intraperitoneal (IP) injections of the vehicle dimethyl sulfoxide (DMSO) or Olaparib (Selleckchem AZD2281# S1060) dissolved in DMSO at a final concentration of 50 mg kg−1 daily. For anti-CSF-1R treatment, mice were IP injected either with IgG2a or IgG2b isotype control to match the CSF-1R antibody used in each experiment (BioXCell #BE0089, clone 2A3; BioXCell #BE0090, clone LTF-2), or anti-CSF-1R Ab (0.525 mg/mouse, or 1.2 mg/mouse BioXCell #BE0213; clone AFS98; IgG2a) or anti-CSF-1R Ab (1.2 mg/mouse IP; a kind gift from Eli-Lilly; IgG2b) as a monotherapy or in combination with Olaparib twice a week. For CD8 depletion experiments; mice were treated twice a week either with IgG2b isotype control (0.2mg/mouse BioXCell #BE0090; clone LTF-2,) or anti-CD8 depletion antibodies (0.2mg/mouse; BioXCell #BE0117; clone YTS 169.4). In the fatostatin experiment, mice were treated with 1.2 mg/mouse anti-CSF-1R twice a week for 14 weeks then treated with 0.6 mg/mouse twice a week until endpoint. Fatostatin (SelleckChem #S8284) treatment was performed as previously described64 with the following modifications: mice were treated daily for 14 days with 15 mg/kg of fatostatin, followed by a 18 day break and then treated once a week until the mice reached the study endpoint.
Tumor isolation/digestion and flow cytometry
At the indicated time points, animals were euthanized in a CO2 chamber and cardiac perfusion was performed with normal saline. Tumors were then collected, a small chunk was snap frozen for RNA analysis by NanoString, another piece was fixed in 10% buffered formalin for paraffin embedding and subsequent IHC. The remaining tumor was used for flow cytometry: Tumors were finely minced and digested with MACS Miltenyi Tumor Dissociation Kit for mouse (Miltenyi Biotech # 130–096-730) according to manufacturer’s instructions. Afterwards the dissociated tumor cells were washed with RPMI Medium 1640 (Life Technologies # 11875–093) and lysed with RBC Lysis Solution (Qiagen # 158904). Cells were counted and resuspended in FACS buffer (PBS Life technology, with 0.5% BSA and 2mM EDTA from Sigma-Aldrich). For TNFα stimulation, cells were seeded into 96-well (Greiner bio-one #650901, U-bottom, clear non-binding plates), incubated with Cell Activation Cocktail (BioLegend: 426603) and maintained in GolgiStop (BD Biosciences: 554724) plus GolgiPlug (BD Biosciences: 555029) for 4 hours at 37°C/5%CO2 according to manufacturer’s recommended concentrations. For other surface markers and intracellular staining without stimulation, cells were blocked with Fcγ receptor II/III (anti-mouse CD16/CD32) blocking antibody (Affymetrix #14–0161-85) in combination with Zombie Aqua fixable viability kit (Bio Legend # 423102) for 20 minutes at room temperature protected from light. Cells were then stained with the primary antibodies for 1 hour at 4oC protected from light. All antibodies are detailed in Table 1. For intracellular staining of cells, cells were permeabilized using the FOXP3/Transcription factor staining buffer kit (Affymetrix #00–5523-00) according to manufacturer’s instructions. The cells were incubated with intracellular antibodies overnight at 4oC protected from light. After overnight incubation, the cells were washed with 1x permeabilization buffer (according to manufacturer’s instructions), resuspended in FACS buffer and analyzed using a BD LSR-Fortessa at the DFCI flow core. Data analysis and compensation were performed on BD FACS Diva and FlowJo software.
In vivo glucose uptake assay
Female FVB/129P2 mice were orthotopically implanted with K14-Cre-Brca1f/f Tp53f/f tumors and were treated daily with Olaparib (50 mg/kg IP) for 4–7 days and twice with anti-CSF-1R (1.2 mg/mouse). Mice were IP injected with 100ug of fluorescent glucose analog 2-NBDG and tumors were harvested 15 minutes post injection as described previously.65 Tumors were digested into single cells and analyzed using the flow cytometry protocol as described here.
Differentiation assay
Monocytes were differentiated with 40ng/ml IL-4 (Human: R&D Systems #204-IL; Murine: PeproTech #214–14-50UG) plus 200ng/ml GM-CSF (PeproTech #315–03-50UG) or M-CSF (30ng/ml) in IMDM with GlutaMAX (Gibco #31980–030), 1mM HEPES (Life Technologies #15630080), 100 U/ml Penicillin/Streptomycin (Life Technologies #15140122), 100 mM Na-Pyruvate (Life Technologies #11360070), MEM-NEAA (Life Technologies #11140050), and 10% Heat-inactivated FBS (Thermo Fisher #10438026) for 5 days. Monocytes were differentiated in the presence of 5 μM Olaparib (Selleckchem AZD2281 #S1060), 5 μM of the STING inhibitor (H151; Invivogen #inh-h151), 5 μM Fatostatin (Selleckchem #S8284), 100 nM Niraparib (Selleckchem MK-4827 #S7625), or 10 nM Talazoparib (Selleckchem BMN 673 #S7048) during the entire 5 day differentiation. The STING agonist (Chemitek #CT-ADUS100) was used at 5uM and was added for 24 hours before collection of cells. Cells were washed and collected using ice-cold dPBS with 2mM EDTA (Ca2+/Mg2+-free) and analyzed with flow cytometry.
Murine ex vivo glucose uptake assay
Mice were euthanized in a CO2 chamber and bone marrow was isolated from the hind legs. Bone marrow was differentiated for 5 days in the presence or absence of 5uM of Olaparib. Cells were washed and collected using ice-cold dPBS with 2mM EDTA (Ca2+/Mg2+-free). Cells were resuspended in glucose free media (Life Technologies #11879020) for 30 minutes at 37°C and washed in media. Cells were treated with 100uM of the fluorescent glucose analog 2-NBDG (Fisher Scientific #NC0292035) for 1 hour at 37°C. Cells were then collected for immunophenotyping by flow cytometry.
Immunohistochemistry (IHC) analysis of murine tumors
Tumors fixed in 10% formalin overnight and embedded in paraffin and sectioned at the Rodent Pathology Core at Harvard Medical School. IHC was performed as previously described (CD11b (Abcam, ab133357, 1:50), Mac-2 (BioLegend, 125403, 1:200)).66 Images were viewed with an Olympus BX43 Trinocular Microscope. For all IHC quantitation, ten randomly selected fields from at least four different tumors in each treatment group were used to quantitate the percentage of tissue positive for each marker using ImageJ software.66 Images were converted to a greyscale red-green-blue (RGB) stack. Positive stain in the ‘blue’ greyscale image was quantified at the appropriate threshold as percentage of total image area positive for stain.
RNA isolation and Quantitative PCR
RNA was extracted by RNAeasy mini kit (Qiagen# 74104) according to manufacturer’s instructions and sample concentrations were determined by Nanodrop. RNA was reverse transcribed by using the high capacity cDNA reverse transcription kit (Applied Biosystems), according to manufacturer’s instructions. qPCR was performed using Power SYBR Green master mix (Applied Biosystems). All primer sequences are detailed in Table 2.
Nano-String immune gene expression analysis
150ng RNA was loaded into the Mouse Myeloid_V2 panel on the NanoString instrument at the Brigham and Women’s Hospital, Center for Advanced Molecular Diagnostics NanoString core facility. Data was analyzed using the Advanced Analysis Module of the nSolver™ software (NanoString Technologies). Geometric mean was used for selecting housekeeping genes and samples were normalized against positive controls. Raw counts below the negative controls were discarded from further analysis.
Isolation of human CD14+ cells from peripheral blood
Blood was collected from de-identified, healthy donors at the Brigham and Women’s Hospital blood bank under an IRB-approved informed consent protocol. Human monocytes (CD14+) were isolated via positive selection from buffy coat preparations using the EasySep CD14+ isolation kit as per the manufacturer’s instructions (StemCell Technologies #18058).
Human myeloid cell RNA sequencing and data analysis
Human myeloid cells were obtained, cultured and harvested as described above. RNA extraction was performed using Qiagen RNAeasy extraction kit as per the manufacturer’s instructions. RNA was eluted in RNAase free water. Sample concentrations were determined by Nanodrop and RNA quality was assessed on a subset of samples by Bioanalyzer (Agilent); all samples scored RINs of > 9.0. RNA sequencing library preparation was performed with the High Throughput TruSeq Stranded mRNA Library Prep Kit (Illumina) following the manufacturer’s protocol at half reaction volume. Input for each sample consisted of 500ng of RNA and 10ul of 1:1000 diluted ERCC spike-in mix 1 (Ambion). Libraries were amplified for 11 cycles during the final amplification step and quantified using the Qubit dsDNA HS assay (Thermo Fisher Scientific). Library size and quality were spot checked for a subset of samples by Bioanalyzer (Agilent). The average size of cDNA fragments in the libraries was 350 base pairs. Libraries were pooled at equimolar concentrations then the pool was quantitated using the KAPA library quantification kit (KAPA Biosystems). Libraries were sequenced with single end 75 base pairs using NextSeq500 (Illumina) at the Bauer Core Facility (Harvard University).
RNA-Seq Analysis
Using the bcbio-nextgen framework (https://github.com/bcbio/bcbio-nextgen), data was analyzed using a standard RNA-Seq pipeline67 using Ensembl68 version 96. Specifically, we used kallisto69 to pseudo-align and quantify with 100-fold bootstrapping then sleuth70 for differential analysis using default parameters. Computational framework made use of the O2 High Performance Compute Cluster, supported by the Research Computing Group, at Harvard Medical School (http://rc.hms.harvard.edu). All data supporting the findings of this study are available upon reasonable request from the corresponding author. With controlled use the RNA sequencing data has been deposited on synapse (syn23018992). Static copy of analysis version is stored at https://github.com/breasttumorimmunologylab/TAM-PARP-2019.
Gene Set Enrichment Analysis (GSEA)
Data for GSEA was organized using XGene. Set enrichment was conducted using the R package fGSEA v1.871 with default parameters. The Molecular Signatures Database (MigSig v6.2) was used for the collection of annotated functions associated with genes. In particular, collections for hallmark, GO, oncogenic, and immunologic gene sets were used.
Seahorse assay
Monocytes differentiated with GM-CSF + IL-4 or M-CSF were resuspended in assay medium (Seahorse XF medium without phenol red supplemented with 10 mM glucose, 2 mM glutamine, 1 mM pyruvate, and 5 mM HEPES, pH 7.4) and seeded at 100,000 or 300,000 cells per well, respectively, in Matrigel-coated V7 microplates. After basal measurements, sequential injections of oligomycin (1 μM), FCCP (1 μM), and antimycin A plus rotenone (0.5 μM each; final concentrations noted) were performed. OCR is measured as picomoles of O2 per minute of cells treated with the sequential administration of oligomycin, FCCP and Rotenone + Antimycin A. Metabolic parameters obtained from the OCR profiling. Basal OCR is the oxygen consumption rate in the absence of effectors, ATP production is the oligomycin-sensitive OCR, and maximal respiration is the OCR value in the presence of the electron transport chain uncoupler FCCP. Glycolytic ATP production rate is equivalent to Glyco PER at baseline while mitochondrial ATP production rate is calculated from the ATP production OCR. Proton efflux rate (PER) was determined from the extracellular acidification rate using the buffer capacity of the medium. PER from glycolysis was determined by subtracting the contribution of oxidative phosphorylation to total PER using the empirically measured CO2 correction factor of 0.6. ATP from glycolysis was assumed to be equal to basal glycolytic PER. Basal Glyco PER is the rate of glycolysis in the absence of effectors and glycolytic capacity is the Glyco PER value after the inhibition of mitochondrial ATP synthesis with oligomycin. ATP from oxidative phosphorylation was assumed to be 2 × 2.75 x oligomycin-sensitive OCR. Analysis was performed as previously described.72
Whole cell proteomics, cell lysis, protein digest and TMT labeling mass spectrometry analysis
Cells were lysed by homogenization (QIAshredder cartriges, Qiagen) in lysis buffer (2% SDS, 150 mM NaCl, 50 mM Tris pH 7.4). Lysates were reduced with 5 mM DTT, alkylated with 15 mM iodoacetamide for 30 minutes in the dark, alkylation reactions quenched with freshly prepared DTT added to a concentration of 50 mM and proteins precipitated by methanol/chloroform precipitation. Digests were carried out in 1 M urea freshly prepared in 200 mM EPPS pH 8.5 in presence of 2% acetonitrile (v/v) with LysC (Wako, 2mg/ml, used 1:75 w/w protease:substrates during digest) overnight at 37°C temperature and after subsequent addition of trypsin (Promega #V5111, stock 1:100 w/w protease:substrates) overnight at 37°C. Missed cleavage rate was assayed from a small aliquot by mass spectrometry. For whole proteome analysis, digests containing approximately 60 μg of peptide material were directly labeled with TMT reagents (Thermo Fisher Scientific). Labeling efficiency and TMT ratios were assayed by mass spectrometry, while labeling reactions were stored at −80°C. After quenching of TMT labeling reactions with hydroxylamine, TMT labeling reactions were mixed, solvent evaporated to near completion and TMT labeled peptides purified and desalted by acidic reversed phase C18 chromatography. Peptides were then fractionated by alkaline reversed phase chromatography into 96 fractions and combined into 24 samples. For mass spectrometry analysis data collection followed a MultiNotch MS3 TMT method 73 using an Orbitrap Lumos mass spectrometer coupled to a Proxeon EASY-nLC 1200 liquid chromatography (LC) system (both Thermo Fisher Scientific). The capillary column used was packed with C18 resin (35 cm length, 75 μm inner diameter, matrix 2.6 μm Accucore (Thermo Fisher Scientific)).
Peptides of each fraction were separated for 4 hours over acidic acetonitrile gradients by LC prior to mass spectrometry (MS) analysis. The scan sequence started with an MS1 scan (Orbitrap analysis; resolution 120,000; mass range 400−1400 Th). MS2 analysis followed collision-induced dissociation (CID, CE=35) with a maximum ion injection time of 250 ms and an isolation window of 0.4 m/z. In order to obtain quantitative information, MS3 precursors were fragmented by high-energy collision-induced dissociation (HCD) and analyzed in the Orbitrap at a resolution of 50,000 at 200 Th with a maximum injection time of 350 ms. Further details on LC and MS parameters and settings used were described recently.74 Peptides were searched with a SEQUEST (v.28, rev. 12) based software suite against a size-sorted forward and reverse database of the h. sapiens proteome with added common contaminant proteins. Searches were performed using a mass tolerance of 20 ppm for precursors and a fragment ion tolerance of 0.9 Da. For the searches maximally 2 missed cleavages per peptide were allowed. We searched dynamically for oxidized methionine residues (+15.9949 Da). We applied a target decoy database strategy and a false discovery rate (FDR) of 1% was set for peptide-spectrum matches following filtering by linear discriminant analysis (LDA) 75. The FDR for final collapsed proteins was 1%. MS1 data were calibrated post-search and searches performed again. Quantitative information on peptides was derived from MS3 scans. Quantification tables were generated requiring an MS2 isolation specificity of >70% for each peptide and a sum of TMT signal-to-noise (s/n) of >200 over all channels for any given peptide and exported to Excel and further processed therein. Details of the TMT intensity quantification method and further search parameters applied were described previously 76.
The relative summed TMT s/n for proteins between two experimental conditions (PARPi vs. DMSO) was calculated from the sum of TMT s/n for all peptides quantified of a given protein. For gene ontology (GO) term enrichment, the BINGO package in Cytoscape was used77. Scaled quantification data were subjected to two-way clustering (JMP software package) and fold change was analyzed using Graphpad Prism 8 (Graphpad Software). For Volcano plots, statistical significance was determined by multiple t-tests with data for each protein individually without multiple comparison correction and alpha=0.05. Number of t-tests equals number of quantified proteins. FDR corrected p-values were used for volcano plots with a cutoff of p <0.05 are reported. GO full terms were obtained by utilizing the Cytoscape with the BINGO plugin and 100 most highly upregulated proteins or 100 most significantly upregulated proteins with FDR<0.05 were used. The data that support the findings of this study are available from the corresponding author upon reasonable request. The mass spectrometry proteomics data have been deposited to the ProteomeXchange Consortium via the PRIDE partner repository with the dataset identifier PXD015804. Data are available via ProteomeXchange with identifier PXD015804.
Killing assay
Human monocytes (CD14+) were isolated via positive selection and differentiated in GM-CSF + IL-4 or M-CSF alone in the presence or absence of Olaparib as described here. At the end of the incubation, the media was collected, centrifuged and added directly to BT20 or MCF7 cells or to an empty well for 24 hours as indicated. CellTitre-Glo (Promega) was used to measure ATP as a surrogate for cell viability.
T-cell assays
Spleens of OT-1 mice were harvested to single cell suspension and whole splenocytes were activated and expanded with OVA peptide (1μg/mL) for 3 days in complete T cell media supplemented with 200U rh IL-2. T cells were seeded for 48 hours in secretions collected from human macrophages supplemented with 200U rhIL-2. The metabolism assay was performed as: XF96 Real-Time ATP Rate assay in Seahorse XF medium (Agilent) supplemented with 100nM insulin, 1mM sodium pyruvate, 5.6mM glucose, 4mM glutamine, 1% FCS under basal conditions and in response to 1μM oligomycin, and 2μM rotenone + 1μM Antimycin A using the XFe96 Extracellular Flux Analyzer (Seahorse Bioscience). Cell-Tak (Corning) was used for adherence of 4×10⁵ T cells per 96 well. FACs staining was performed to detect T-cell cytokines. T cells were collected and first treated with PMA/Ionomycin cocktail (eBioscience) supplemented with Brefeldin A for 4–6 hours. Extracellular stains were performed in FACS buffer. IFN-γ staining was performed using Intracellular Fixation & Permeabilization Buffer Set (eBioscience). Cells were fixed then stained with IFN-γ-PE (cupk43k, Thermo Fisher) in permeabilization buffer. For Annexin staining, cells were washed and stained for using Annexin V-FITC Apoptosis Detection Kit (Thermo Fisher, Waltham, MA, USA) according to manufacturers’ protocol. Samples were run on a BD Accuri C6 flow cytometer (San Jose, CA, USA).
Cell lines and maintenance of cultured cells
Cells were obtained from the American Type Culture Collection. Before use, cell line authentication was performed by either short tandem repeat profiling at Dana-Farber Cancer Institute or by Fluidigm-based fingerprinting with a panel of single-nucleotide polymorphisms at The Broad Institute. Cell lines were tested for mycoplasma with the MycoAlert PLUS Mycoplasma Detection Kit (Lonza LT07) according to manufacturer’s instructions. MDA-MB-436 cells with reconstituted human BRCA1 have been previously described.78 K14-Cre-Brca1f/fTp53f/f with restored BRCA1 were generated and maintained as previously described.79 Cells were treated with DMSO, 2 or 5uM of Olaparib for 72 hours. EMT6 cells (American Type Culture Collection #CRL-2755) and 4T1 cells (American Type Culture Collection CRL-2539) were cultured in RPMI (Life Technologies #11875119), 10% FBS, 1% GlutaMAX (Life Technologies #31980030), 1% HEPES, 1% Sodium Pyruvate, and 1% Penicillin/Streptomycin.
Statistical analysis
Statistical methods were used to predetermine sample size for tumor growth inhibition of 50% with 90% power. Otherwise no statistical methods were used to predetermine sample size. Appropriate statistical analyses were performed depending on the comparisons made and referenced in the text, figure legends and methods. Unless otherwise described, statistical analysis was performed using an unpaired t-test in Prism version 7 (Graphpad, Inc.) and all error bars represent standard error of the mean (±SEM), *P < 0.05, **P < 0.01, ***P < 0.001, ****P < 0.0001.
Extended Data
Extended Figure 1.
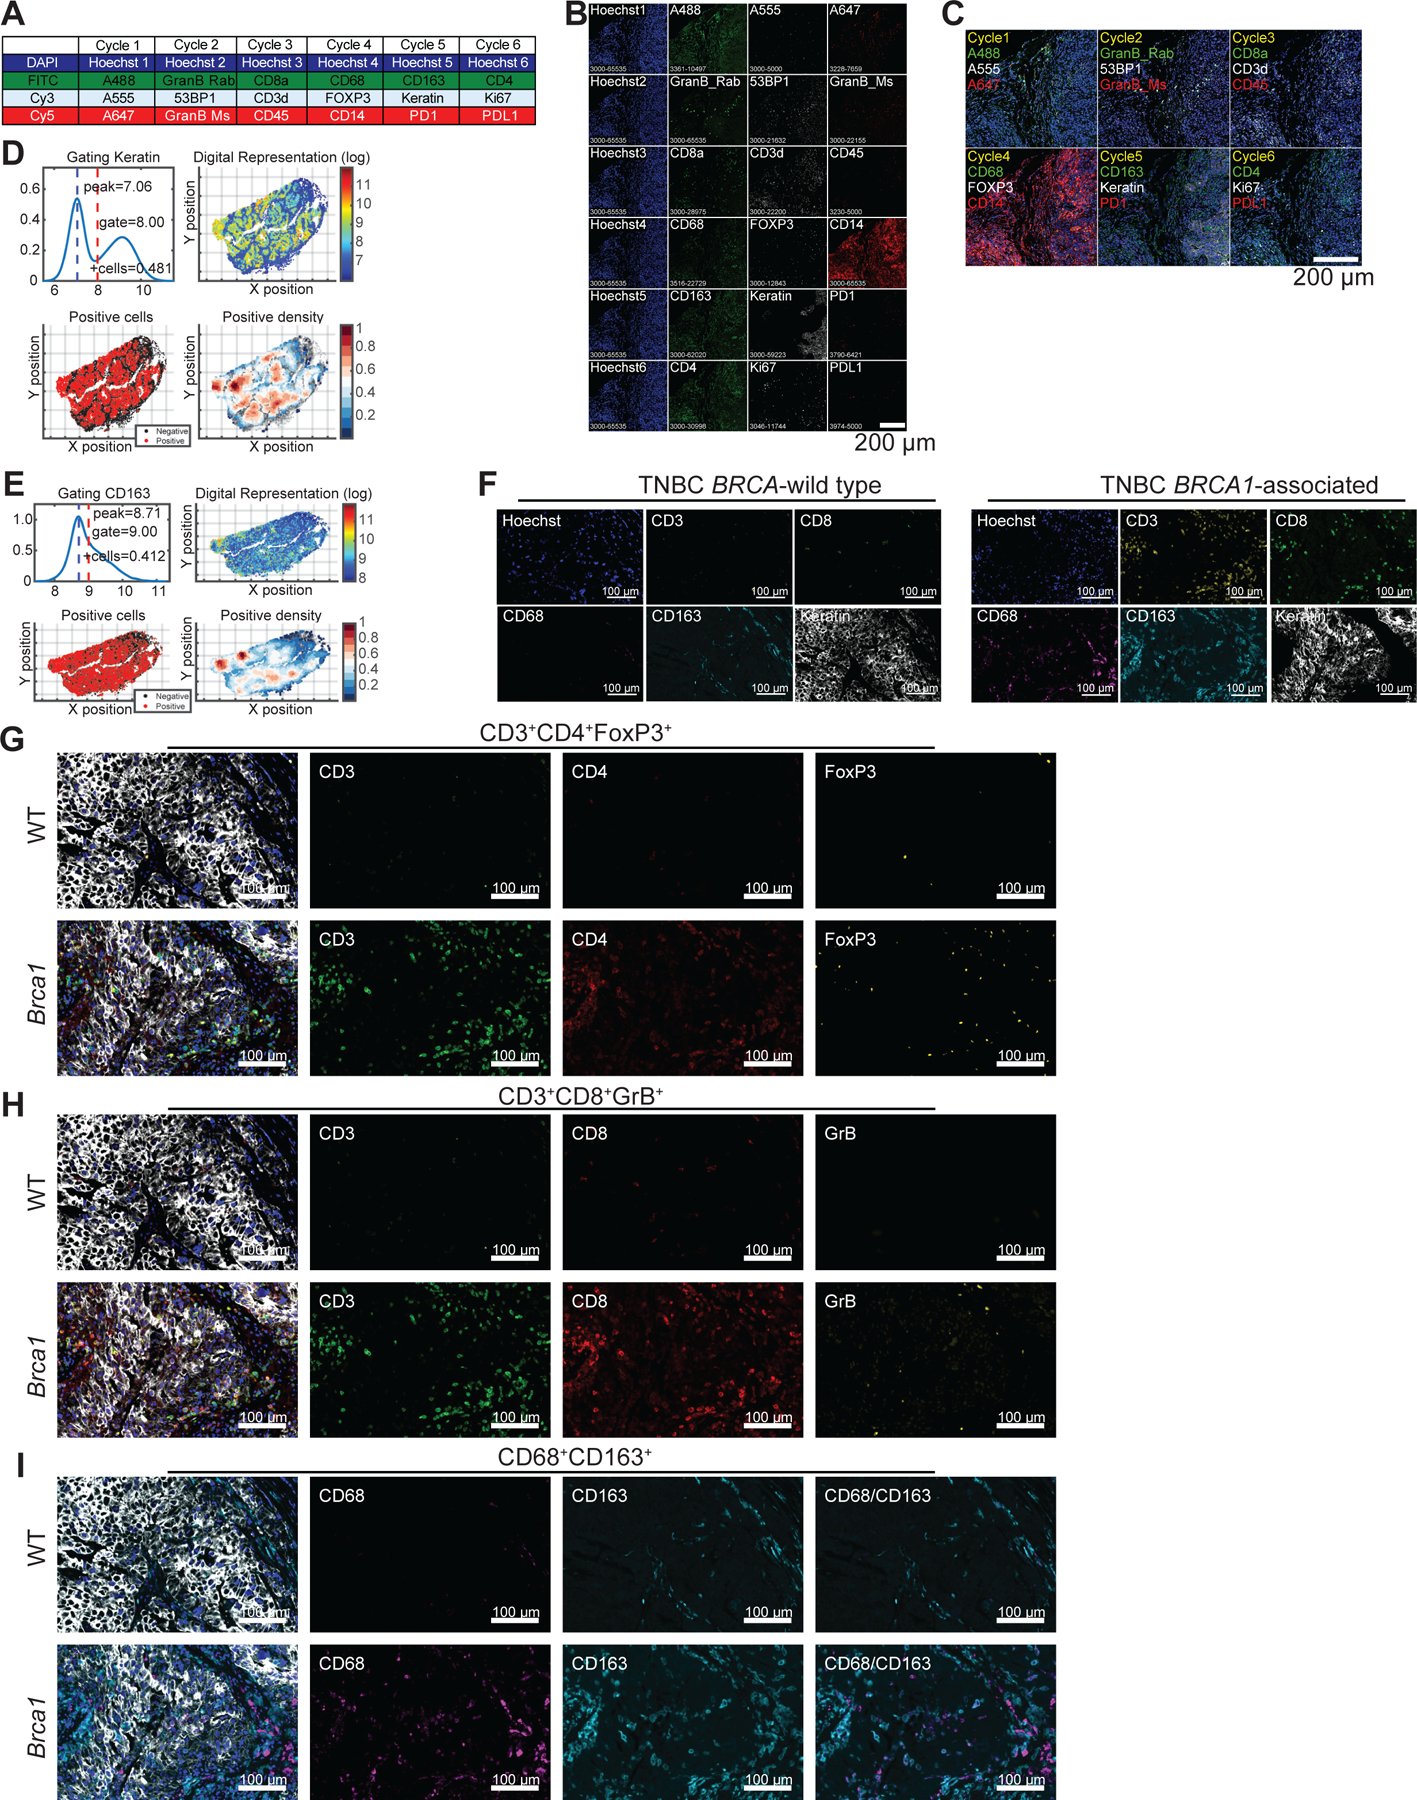
BRCA1-associated TNBC are highly infiltrated with T-cells and macrophages
Extended Figure 2.
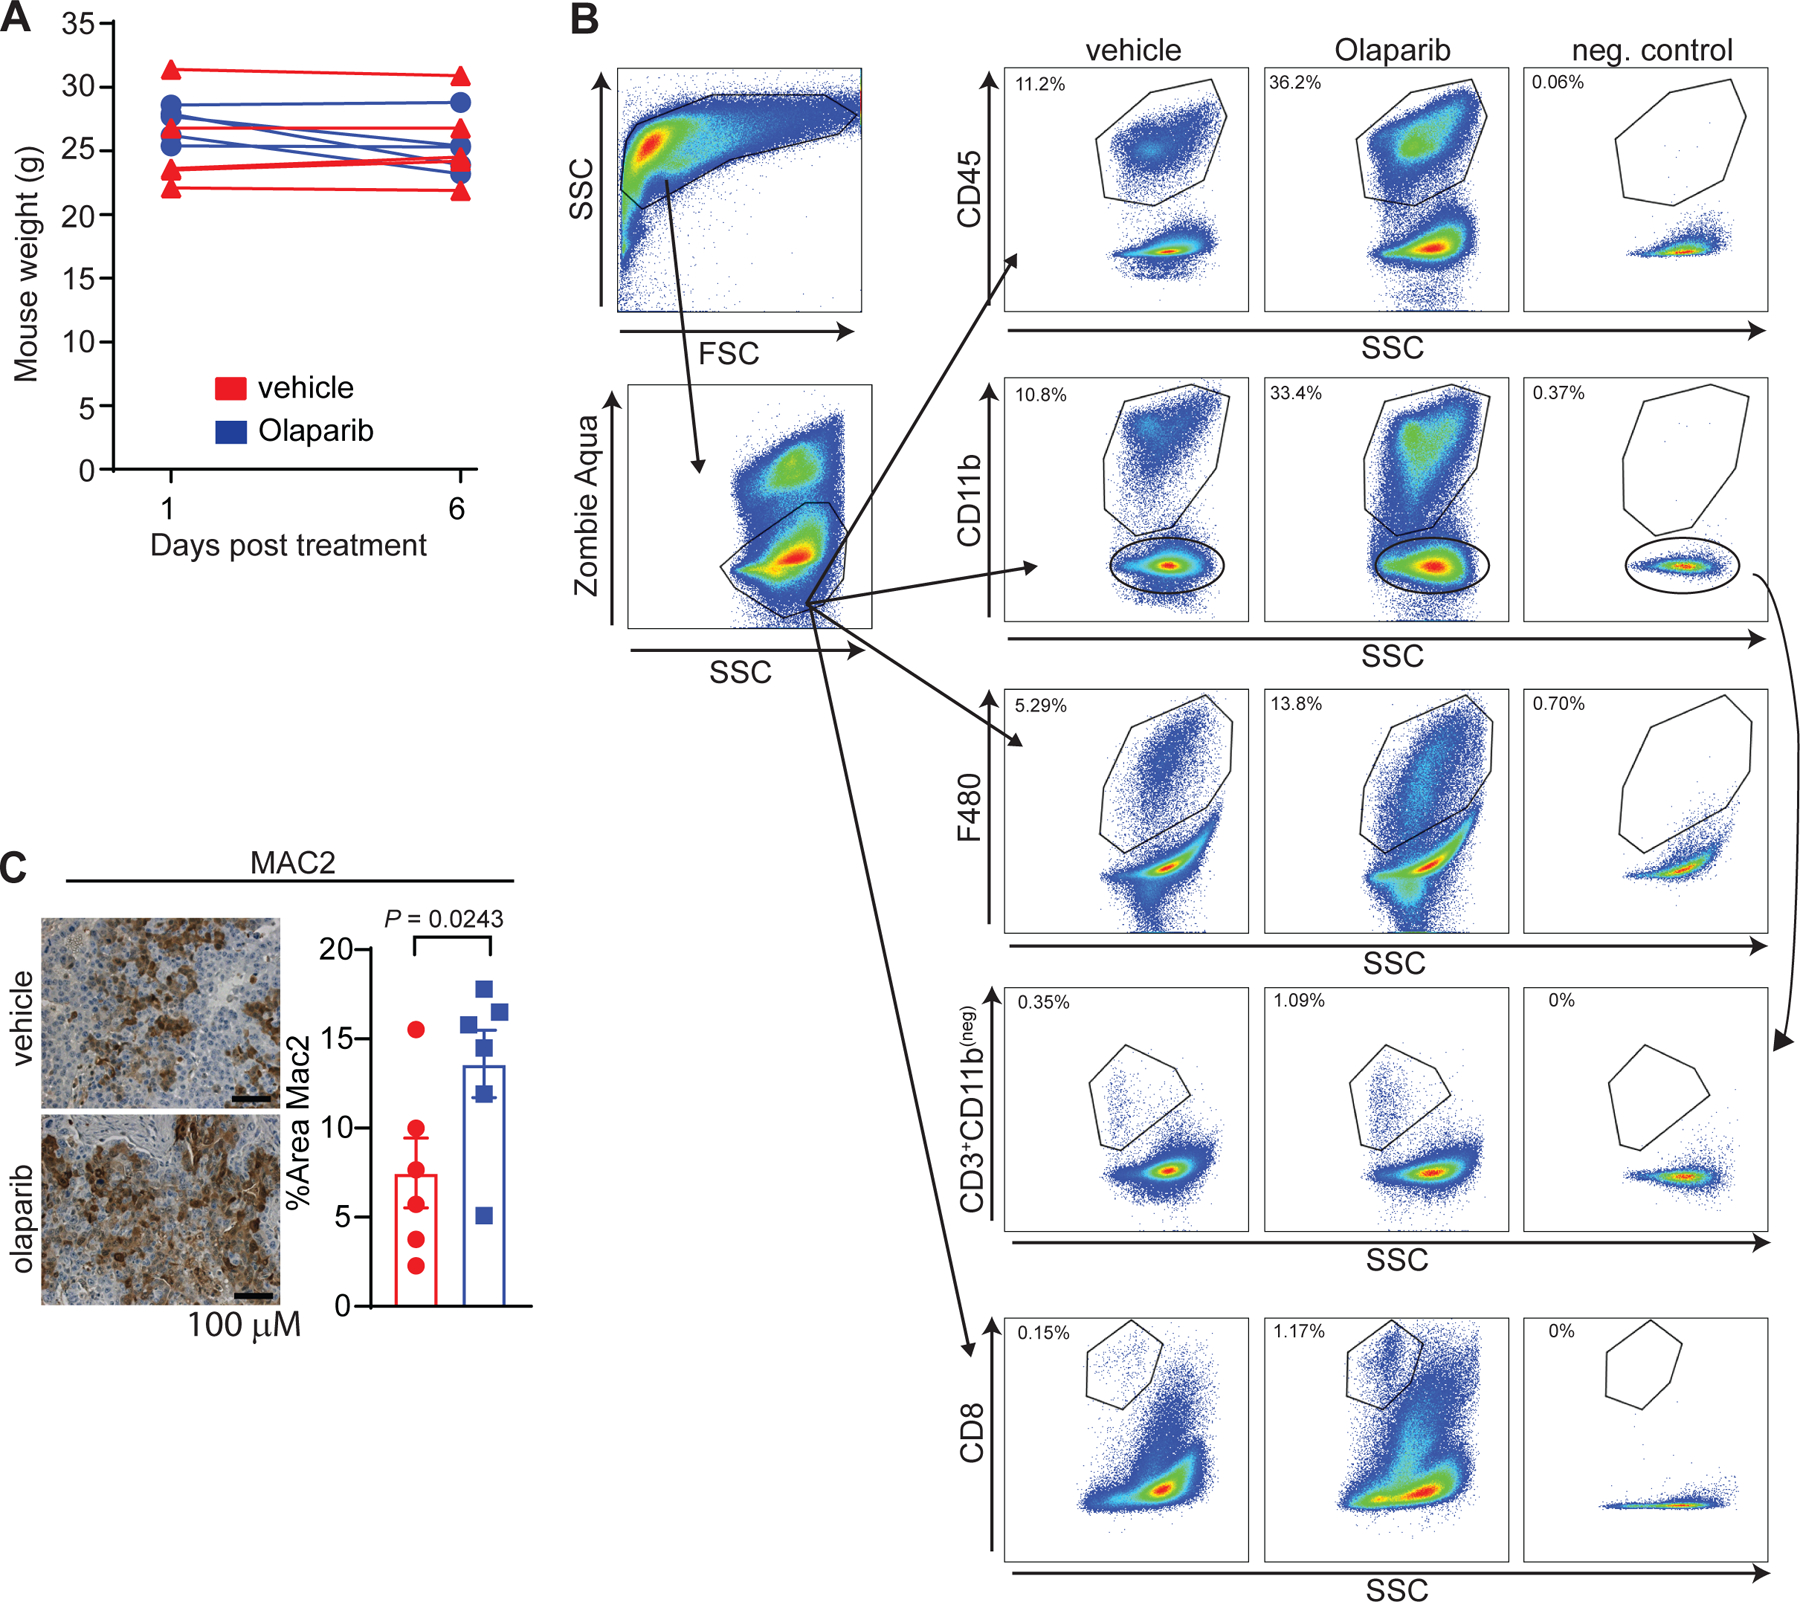
PARP inhibition modulates the tumor microenvironment and increases intratumoral macrophages in BRCA1-deficient TNBC
Extended Figure 3.

PARP inhibition modulates the tumor microenvironment and increases intratumoral macrophages in BRCA1-deficient TNBC.
Extended Figure 4.

PARP inhibition modulates the phenotype of differentiating macrophages.
Extended Figure 5.
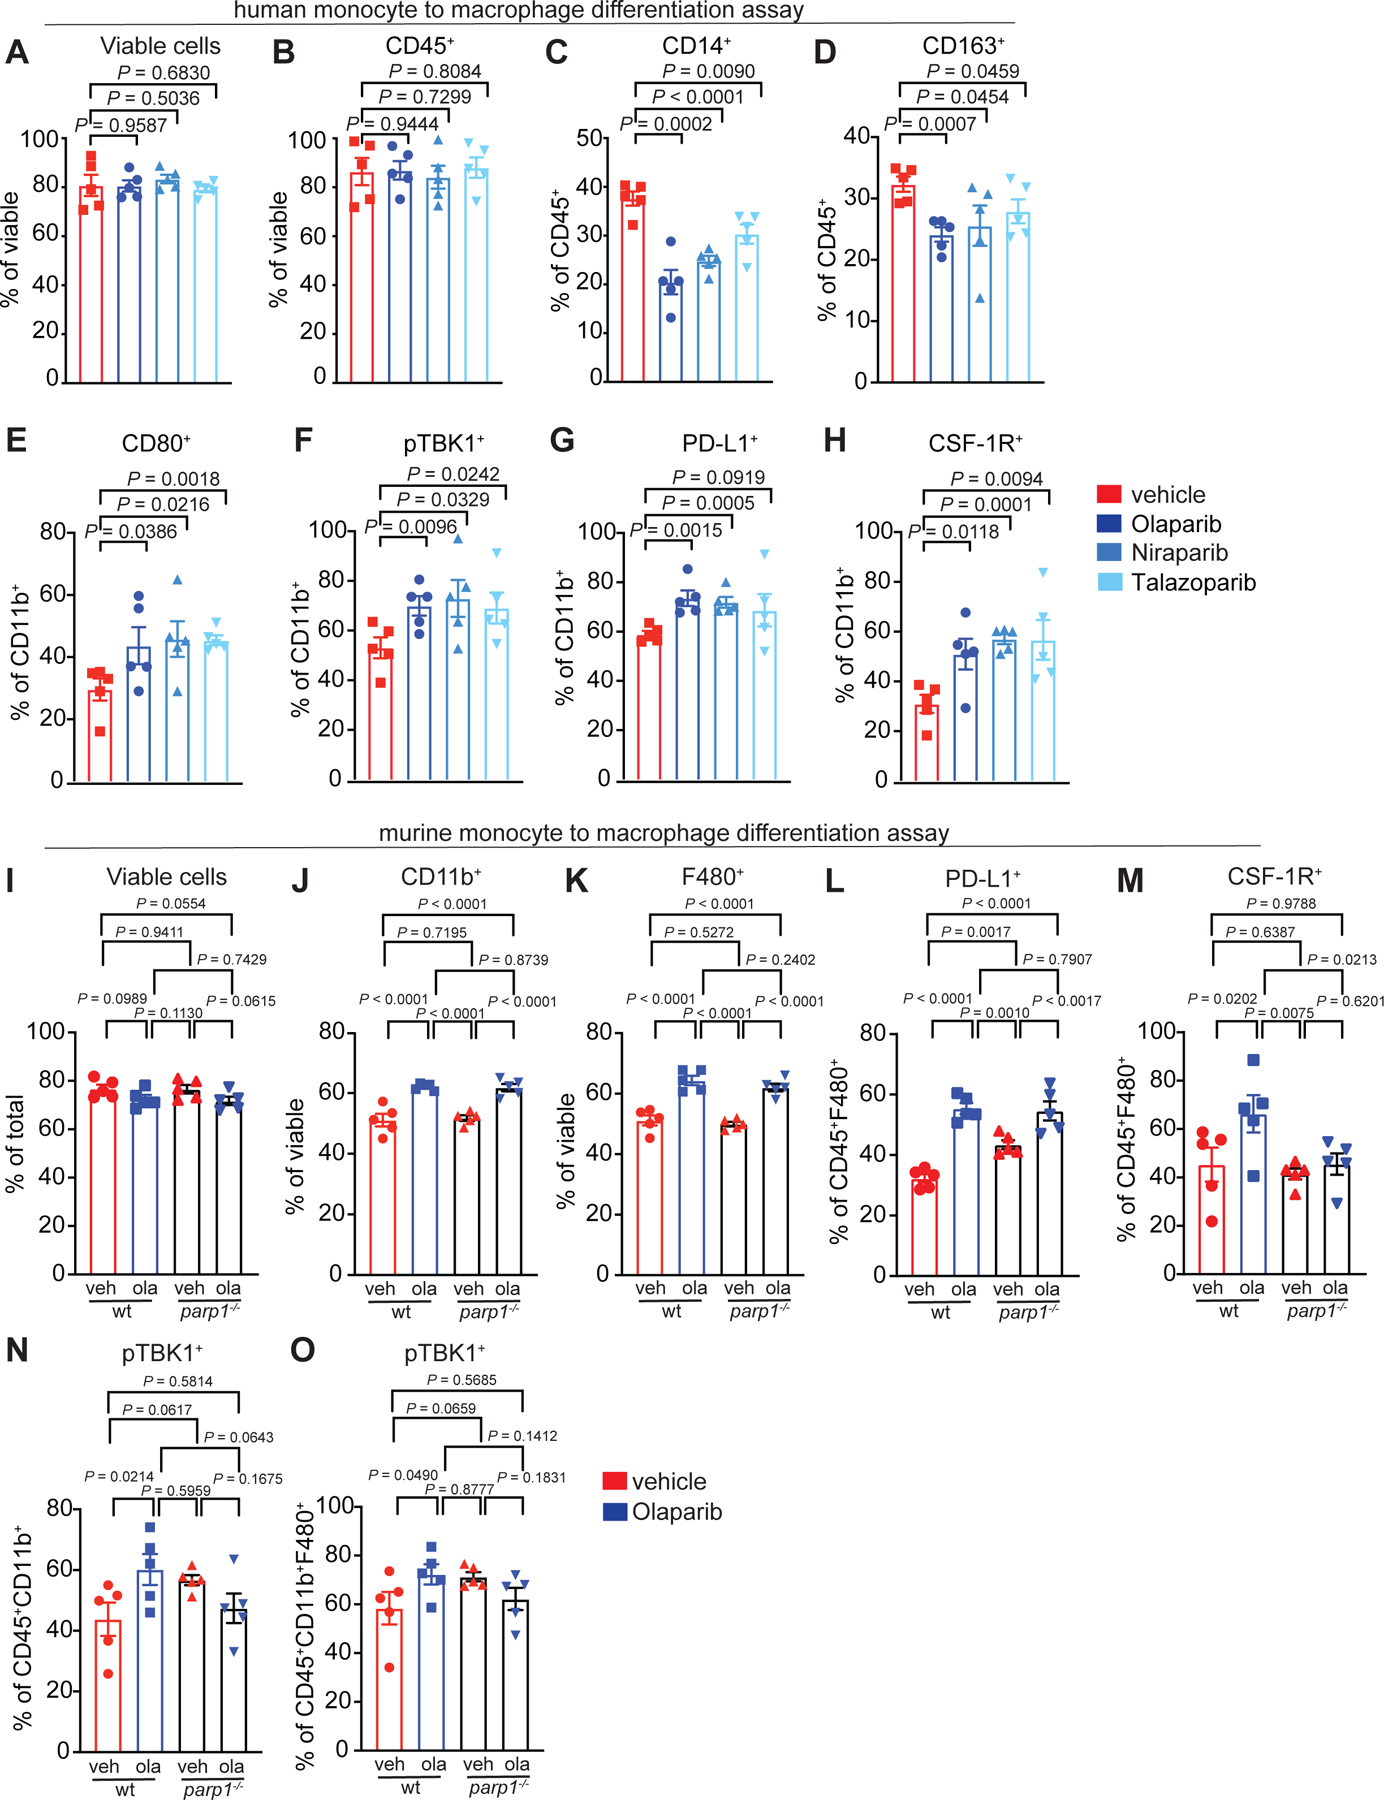
Role of PARP1 in differentiating macrophages.
Extended Figure 6:
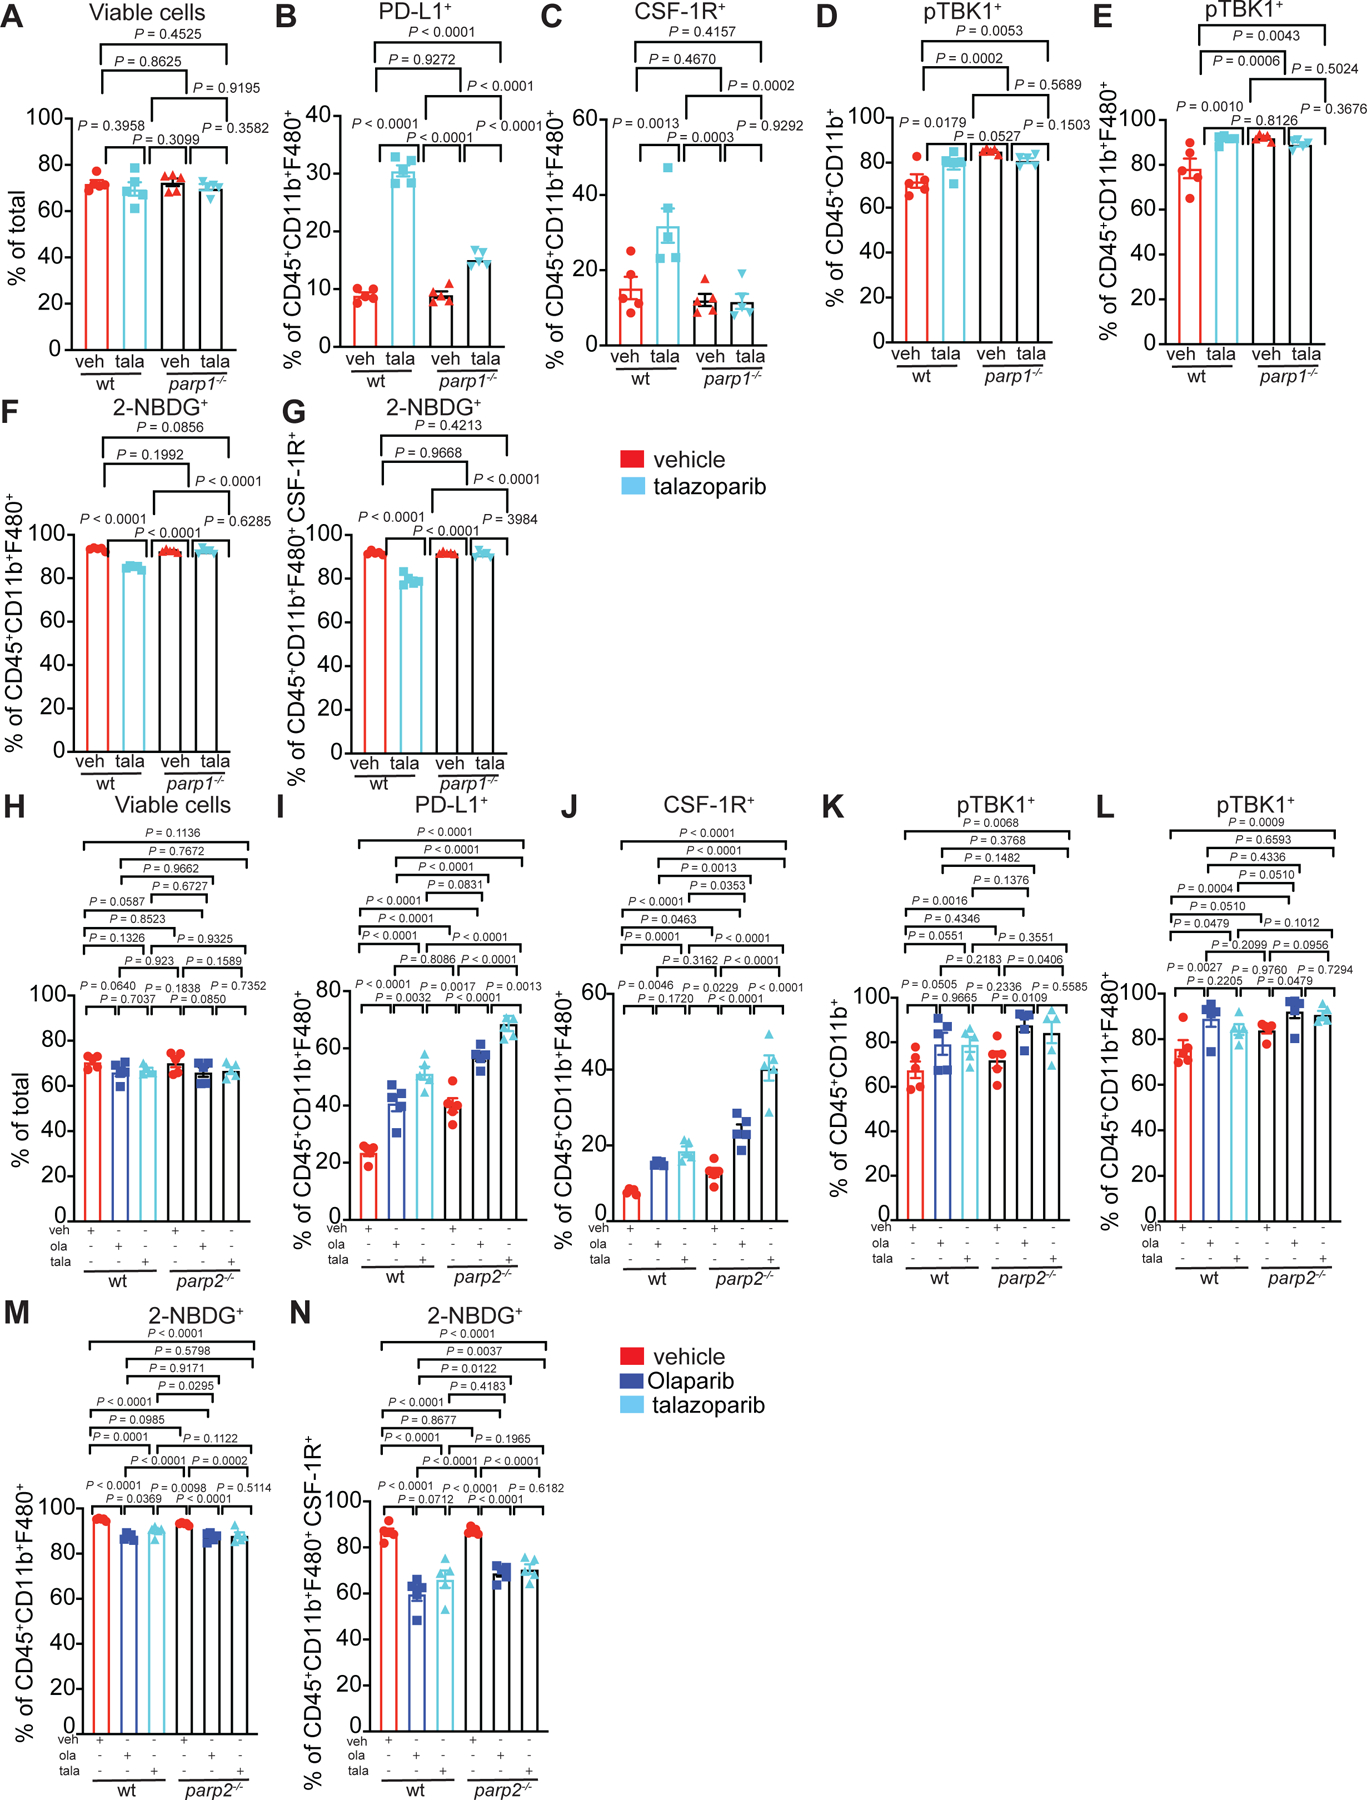
The role of PARP1 and PARP2 in PARP inhibitor treated differentiating macrophages.
Extended Figure 7.
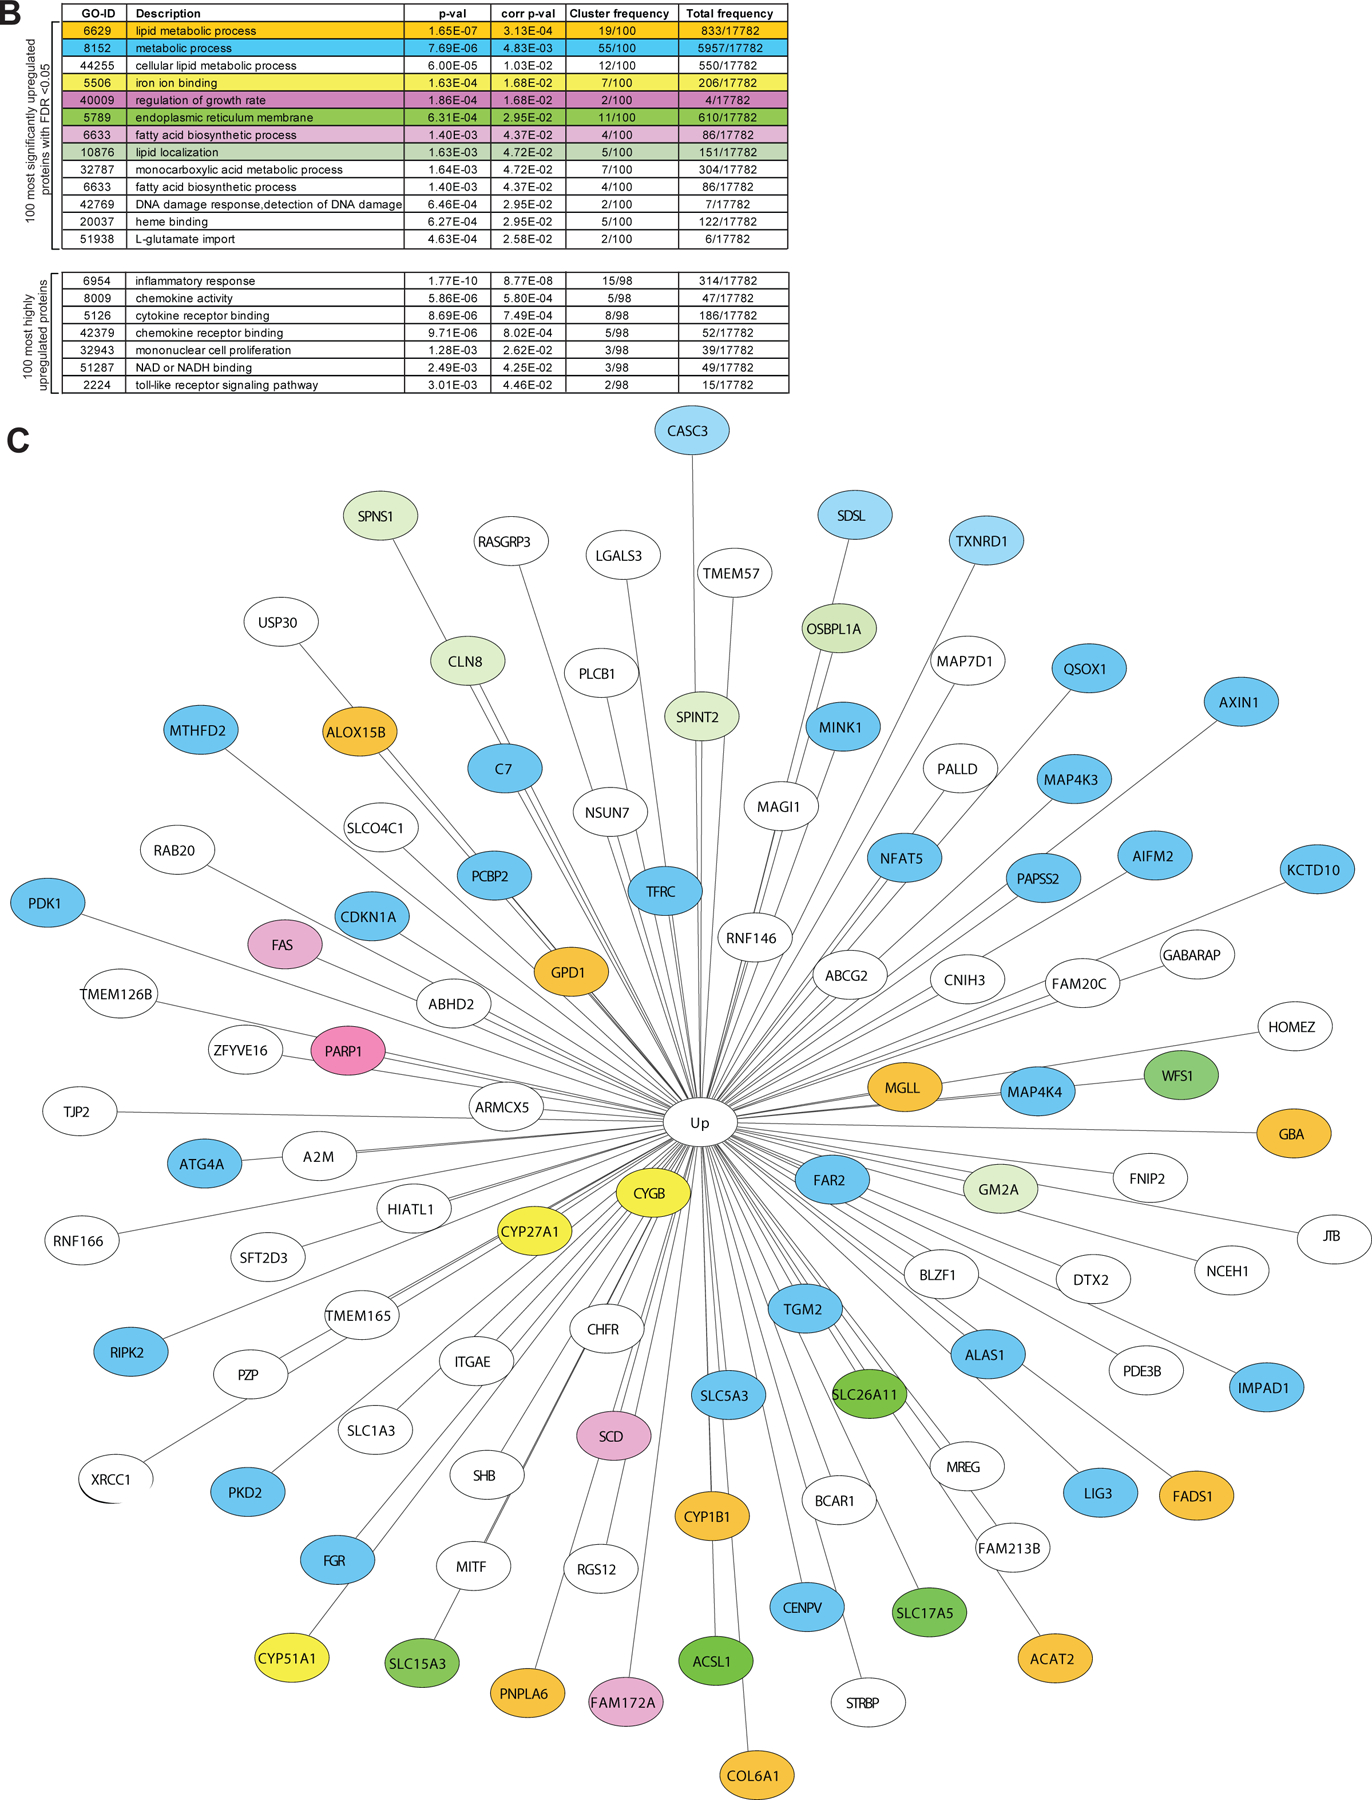
PARP inhibition modulates the metabolic phenotype of differentiating macrophages
Extended Figure 8.
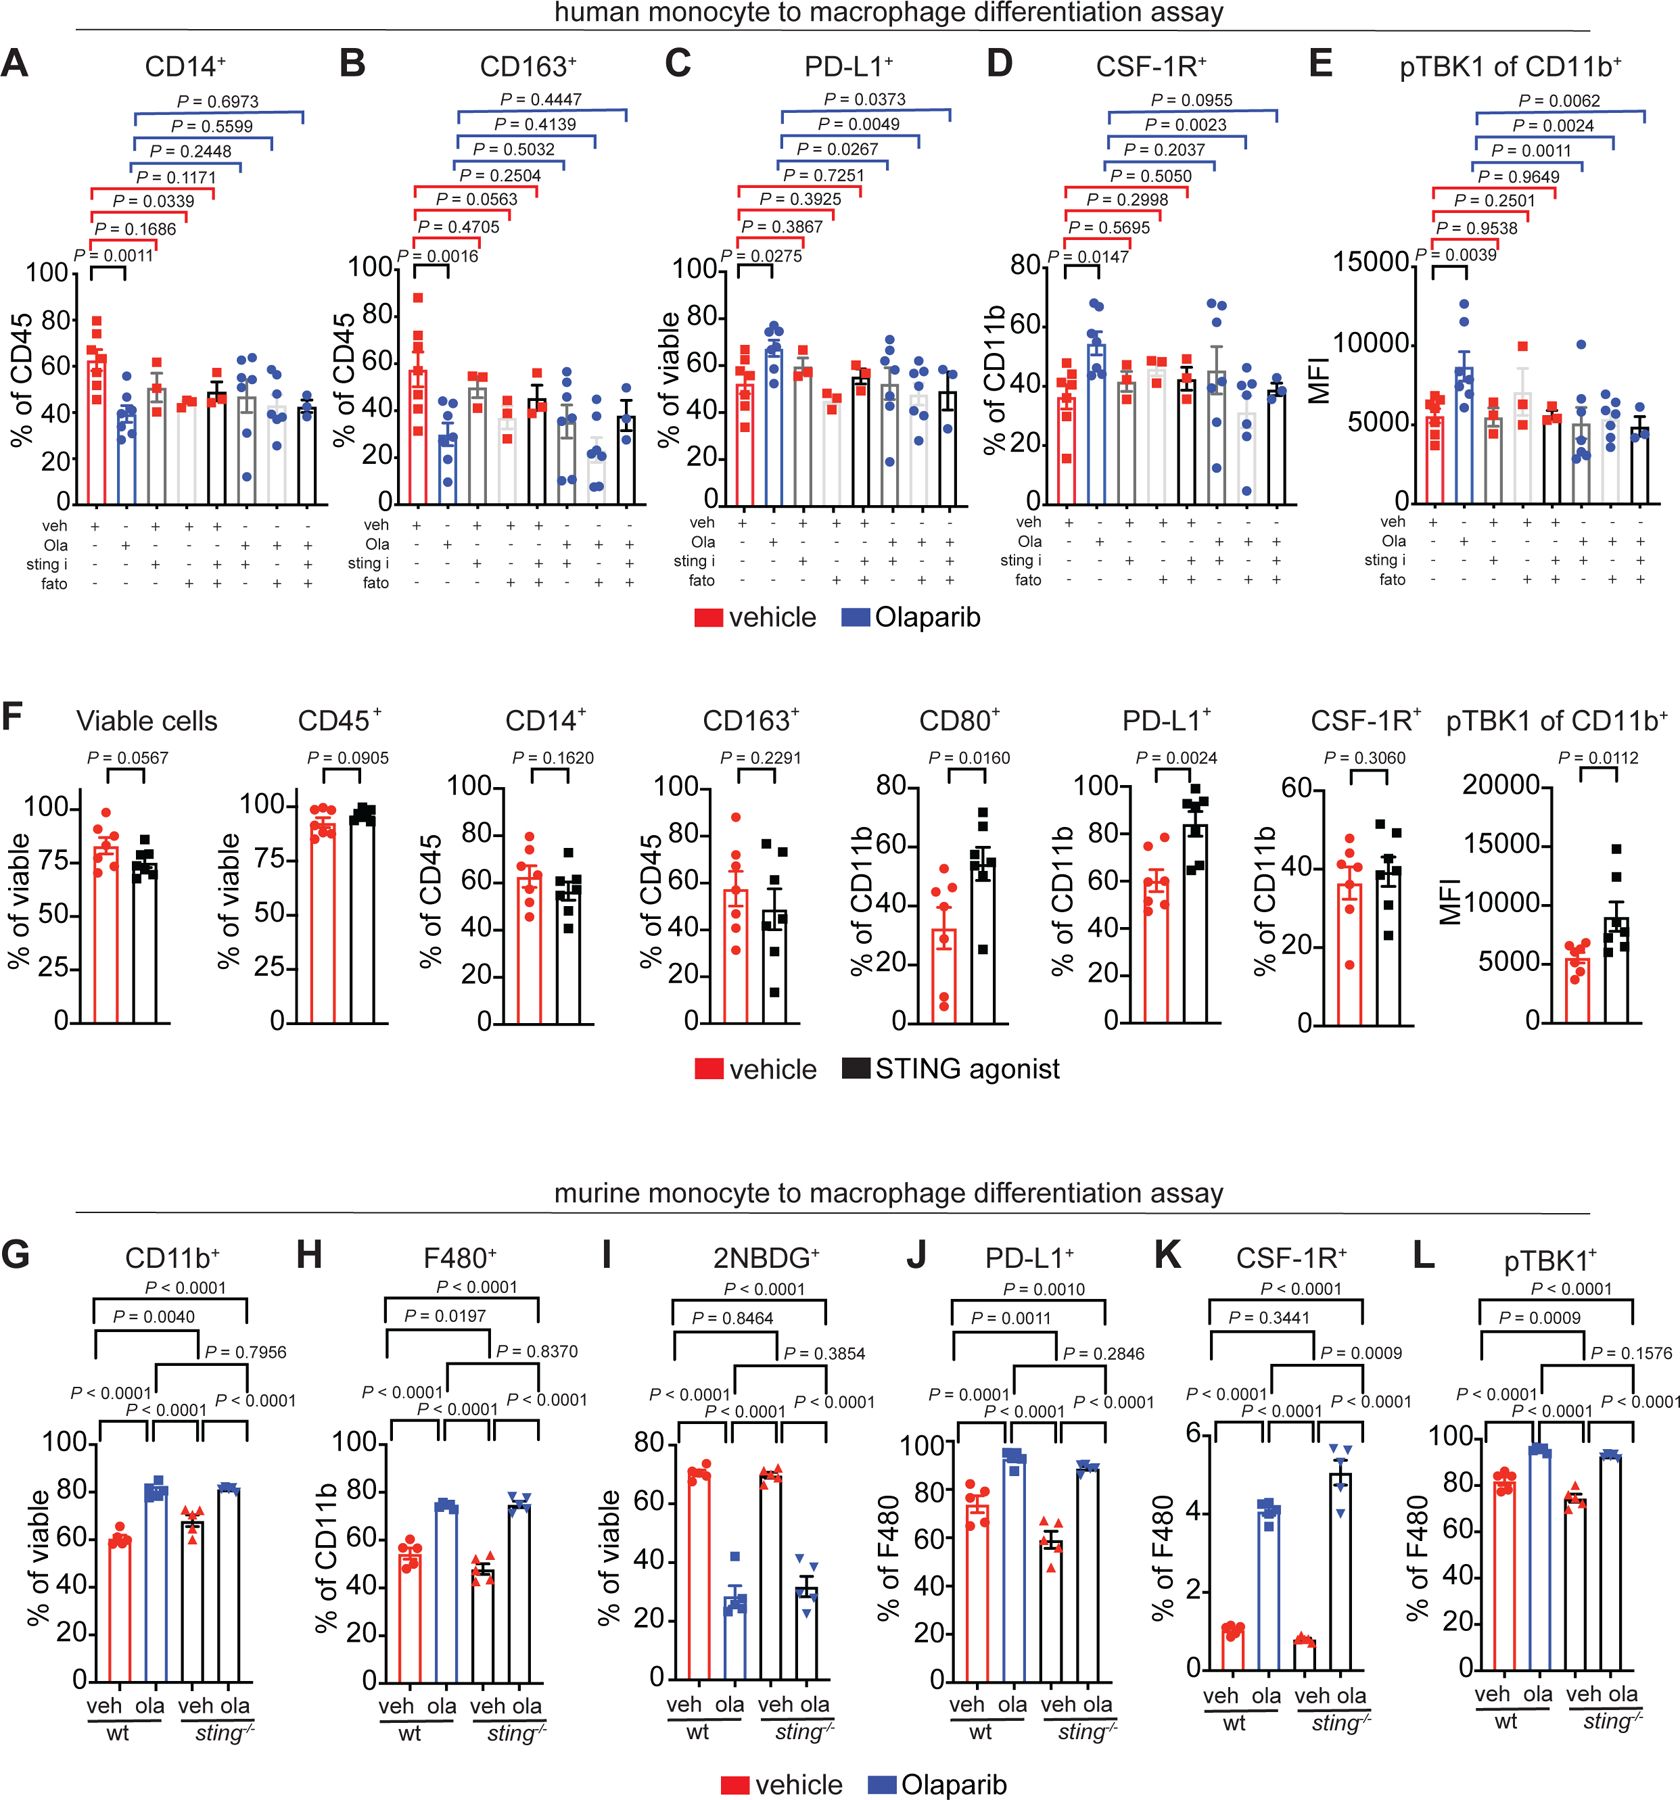
Role of the STING and SREBP1 pathways on the Olaparib-induced macrophage phenotype.
Extended Figure 9.
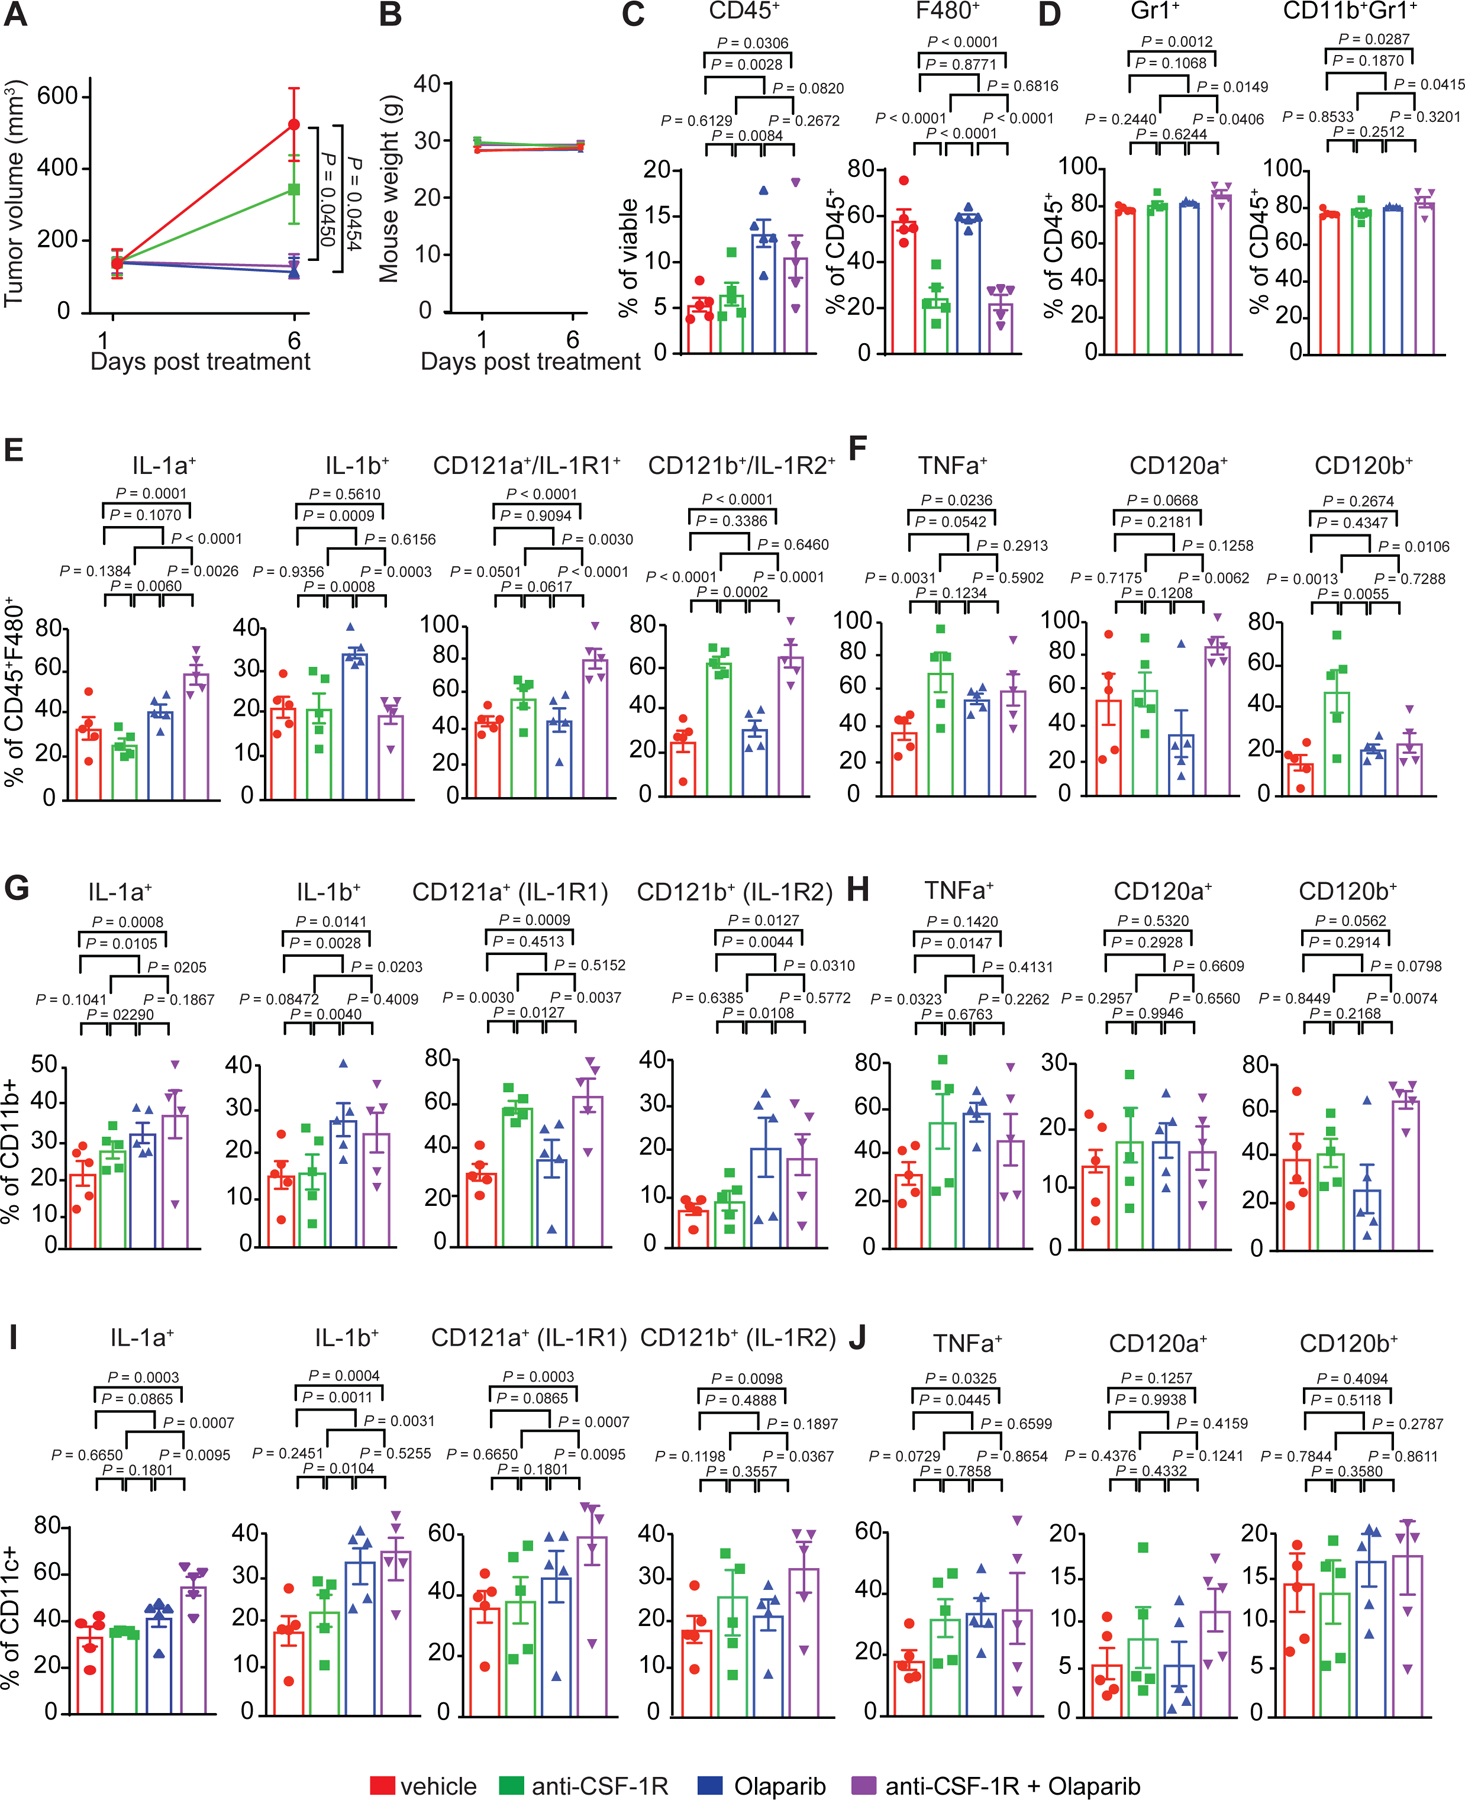
Nanostring validation by flow cytometry
Extended Figure 10.

Olaparib-treated macrophages suppress T-cell function, which is overcome with anti-CSF-1R therapy in BRCA1-deficient TNBC.
Acknowledgements
This work was supported the Dana-Farber Cancer Institute/Eli Lilly & Co. Research Collaboration, the Dana-Farber/Harvard Cancer Center (DF/HCC) Specialized Program of Research Excellence (SPORE) in Breast Cancer P50 CA1685404 Career Enhancement Award (J.L.G.). The Susan G. Komen Foundation Career Catalyst Award CCR18547597 (J.L.G.), The Terri Brodeur Breast Cancer Foundation (J.L.G.), The Breast Cancer Research Foundation (N.T), The Ludwig Center at Harvard (J.L.G., S.S., P.K.S., and G.I.S.), The Center for Cancer Systems Pharmacology NCI U54-CA225088 (J-R.L., P.K.S., S.S., M.K., S.A.B., and J.L.G), Eli Lilly (J.L.G), NIH/NHLBI K08 HL128802 (W.M.O). S.J. was the recipient of R01 CA090687 and P50 CA1685404 Diversity Supplements. EAM acknowledges the Rob and Karen Hale Distinguished Chair in Surgical Oncology for support. J.Y. acknowledges funding from the Spanish Ministerio de Economia, Industria y Competitividad (grant SAF2017–83565-R) and The Fundación Cientifica de la Asociacion Española Contra el Cancer (AECC) (grant PROYEI6018YELA). We thank A. Letai for his guidance and input in early experiments and J. Agudo for support and discussions in the preparation of this manuscript. We thank G. Wulf and J. Jonkers for providing reagents for animal experiments, S. Mei with technical assistance with CyCIF, and S. Lazo for technical help setting up flow cytometry panels. The authors are grateful for the expertise and help from the following core facilities: The Dana-Farber Animal Research Facility, The Dana-Farber Flow Cytometry Core, Brigham and Women’s Seahorse Core, The Brigham and Women’s Center for Advance Molecular Diagnostics Research Core Lab, The Harvard Medical School Rodent Pathology Core and The Proteomics Platform, Sequencing Platform and Multiplex Imaging Platform of the Laboratory of Systems Pharmacology (LSP) at Harvard Medical School. We thank Katharin Shaw for their assistance in drawing summary cartoons.
Footnotes
Competing Interests Statement
J.L.G. is a consultant for Glaxo-Smith Kline (GSK), Codagenix, Verseau, Kymera and Array BioPharma and receives sponsored research support from GSK, Array BioPharma and Eli Lilly. G.I.S. has served on advisory boards for Pfizer, Eli Lilly, G1 Therapeutics, Roche, Merck KGaA/EMD-Serono, Sierra Oncology, Bicycle Therapeutics, Fusion Pharmaceuticals, Cybrexa Therapeutics, Astex, Almac, Ipsen, Bayer, Angiex, Daiichi Sankyo, Seattle Genetics, Boehringer Ingelheim, ImmunoMet, Asana, Artios, Atrin, Concarlo Holdings, Syros and Zentalis, and has received sponsored research support from Merck, Eli Lilly, Merck/EMD Serono and Sierra Oncology. Clinical trial support from Pfizer and Array Biopharma has been provided to Dana-Farber Cancer Institute for the conduct of investigator-initiated studies led by G.I.S. He holds a patent entitled, “Dosage regimen for sapacitabine and seliciclib,” also issued to Cyclacel Pharmaceuticals, and a pending patent, entitled, “Compositions and Methods for Predicting Response and Resistance to CDK4/6 Inhibition,” together with Liam Cornell. E.A.M is on the SAB for Astra-Zeneca/Medimmune, Celgene, Genentech, Genomic Health, Merck, Peregrine Pharmaceuticals, SELLAS Lifescience, and Tapimmune and has clinical trial support to her former institution (MDACC) from Astra-Zeneca/Medimmune, EMD-Serono, Galena Biopharma and Genentech as well as Genentech support to a SU2C grant, as well as sponsored Research Support to the laboratory from GSK and Eli Lilly. S.R. receives research funding from Merck, Bristol-Myers Squibb, Gilead and Affimed, and on the scientific advisory board for Immunitas. S.S is a consultant for Rarecyte, Inc. N.T. receives research support from Astra-Zeneca. PKS serves on the SAB or BOD of Glencoe Software, Applied Biomath and RareCyte Inc. and has equity in these companies; he is a member of the NanoString SAB and is also co-founder of Glencoe Software, which contributes to and supports the open-source OME/OMERO image informatics software used in this paper. D.D. consults for Novartis and is on the advisory board for Oncology Analytics, Inc. S.J. receives consulting fees from Venn Therapeutics.
Code availability statement:
Static copy of analysis versions are available in methods and here:
CyCIF: Code repository of ongoing improvements for Ashlar (https://github.com/labsyspharm/ashlar), segmentation, and analysis (https://github.com/sorgerlab/cycif). Static copy of analysis version is stored at https://github.com/breasttumorimmunologylab/TAM-PARP-2019. To view all tumors analyzed in this study please visit: https://www.cycif.org/data/mehta-2020/.
RNAseq: https://github.com/breasttumorimmunologylab/TAM-PARP-2019
Data availability statement:
The data that support the findings of this study are available upon reasonable request from the corresponding author [J.L.G.]. The data are not publicly available due to IRB restrictions due to the data containing information that could compromise research participant privacy/consent. With controlled use the mass spectrometry proteomics data have been deposited to the ProteomeXchange Consortium via the PRIDE partner repository with the dataset identifier PXD015804. Data are available via ProteomeXchange with identifier PXD015804. With controlled use the RNA sequencing data has been deposited on synapse (syn23018992). All CyCIF images are available at: https://www.cycif.org/data/mehta-2020/.
References
- 1.Robson ME, Tung N, Conte P, Im SA, Senkus E, Xu B, Masuda N, Delaloge S, Li W, Armstrong A, Wu W, Goessl C, Runswick S & Domchek SM OlympiAD final overall survival and tolerability results: Olaparib versus chemotherapy treatment of physician’s choice in patients with a germline BRCA mutation and HER2-negative metastatic breast cancer. Ann Oncol 30, 558–566, doi: 10.1093/annonc/mdz012 (2019). [DOI] [PMC free article] [PubMed] [Google Scholar]
- 2.O’Donovan PJ & Livingston DM BRCA1 and BRCA2: breast/ovarian cancer susceptibility gene products and participants in DNA double-strand break repair. Carcinogenesis 31, 961–967, doi: 10.1093/carcin/bgq069 (2010). [DOI] [PubMed] [Google Scholar]
- 3.Tung N, Lin NU, Kidd J, Allen BA, Singh N, Wenstrup RJ, Hartman AR, Winer EP & Garber JE Frequency of Germline Mutations in 25 Cancer Susceptibility Genes in a Sequential Series of Patients With Breast Cancer. J Clin Oncol 34, 1460–1468, doi: 10.1200/jco.2015.65.0747 (2016). [DOI] [PMC free article] [PubMed] [Google Scholar]
- 4.Litton JK, Rugo HS, Ettl J, Hurvitz SA, Goncalves A, Lee KH, Fehrenbacher L, Yerushalmi R, Mina LA, Martin M, Roche H, Im YH, Quek RGW, Markova D, Tudor IC, Hannah AL, Eiermann W & Blum JL Talazoparib in Patients with Advanced Breast Cancer and a Germline BRCA Mutation. N Engl J Med 379, 753–763, doi: 10.1056/NEJMoa1802905 (2018). [DOI] [PMC free article] [PubMed] [Google Scholar]
- 5.Robson M, Im SA, Senkus E, Xu B, Domchek SM, Masuda N, Delaloge S, Li W, Tung N, Armstrong A, Wu W, Goessl C, Runswick S & Conte P Olaparib for Metastatic Breast Cancer in Patients with a Germline BRCA Mutation. N Engl J Med 377, 523–533, doi: 10.1056/NEJMoa1706450 (2017). [DOI] [PubMed] [Google Scholar]
- 6.Kaufman B, Shapira-Frommer R, Schmutzler RK, Audeh MW, Friedlander M, Balmana J, Mitchell G, Fried G, Stemmer SM, Hubert A, Rosengarten O, Steiner M, Loman N, Bowen K, Fielding A & Domchek SM Olaparib monotherapy in patients with advanced cancer and a germline BRCA1/2 mutation. J Clin Oncol 33, 244–250, doi: 10.1200/JCO.2014.56.2728 (2015). [DOI] [PMC free article] [PubMed] [Google Scholar]
- 7.Tutt A, Robson M, Garber JE, Domchek SM, Audeh MW, Weitzel JN, Friedlander M, Arun B, Loman N, Schmutzler RK, Wardley A, Mitchell G, Earl H, Wickens M & Carmichael J Oral poly(ADP-ribose) polymerase inhibitor olaparib in patients with BRCA1 or BRCA2 mutations and advanced breast cancer: a proof-of-concept trial. Lancet 376, 235–244, doi: 10.1016/S0140-6736(10)60892-6 (2010). [DOI] [PubMed] [Google Scholar]
- 8.Schmid P, Adams S, Rugo HS, Schneeweiss A, Barrios CH, Iwata H, Dieras V, Hegg R, Im SA, Shaw Wright G, Henschel V, Molinero L, Chui SY, Funke R, Husain A, Winer EP, Loi S & Emens LA Atezolizumab and Nab-Paclitaxel in Advanced Triple-Negative Breast Cancer. N Engl J Med 379, 2108–2121, doi: 10.1056/NEJMoa1809615 (2018). [DOI] [PubMed] [Google Scholar]
- 9.Emens LA, Braiteh FS, Cassier F, Delord J-P, Eder JP, Fasso M, Xiao Y, Wang Y, Molinero L, Chen DS & Krop I in AACR 106th Annual Meeting. [Google Scholar]
- 10.DeNardo DG & Coussens LM Inflammation and breast cancer. Balancing immune response: crosstalk between adaptive and innate immune cells during breast cancer progression. Breast Cancer Res 9, 212, doi: 10.1186/bcr1746 (2007). [DOI] [PMC free article] [PubMed] [Google Scholar]
- 11.Gil Del Alcazar CR, Huh SJ, Ekram MB, Trinh A, Liu LL, Beca F, Zi X, Kwak M, Bergholtz H, Su Y, Ding L, Russnes HG, Richardson AL, Babski K, Min Hui Kim E, McDonnell CH 3rd, Wagner J, Rowberry R, Freeman GJ, Dillon D, Sorlie T, Coussens LM, Garber JE, Fan R, Bobolis K, Allred DC, Jeong J, Park SY, Michor F & Polyak K Immune Escape in Breast Cancer During In Situ to Invasive Carcinoma Transition. Cancer Discov 7, 1098–1115, doi: 10.1158/2159-8290.Cd-17-0222 (2017). [DOI] [PMC free article] [PubMed] [Google Scholar]
- 12.DeNardo DG, Brennan DJ, Rexhepaj E, Ruffell B, Shiao SL, Madden SF, Gallagher WM, Wadhwani N, Keil SD, Junaid SA, Rugo HS, Hwang ES, Jirstrom K, West BL & Coussens LM Leukocyte complexity predicts breast cancer survival and functionally regulates response to chemotherapy. Cancer Discov 1, 54–67, doi: 10.1158/2159-8274.CD-10-0028 (2011). [DOI] [PMC free article] [PubMed] [Google Scholar]
- 13.Ruffell B, Au A, Rugo HS, Esserman LJ, Hwang ES & Coussens LM Leukocyte composition of human breast cancer. Proc Natl Acad Sci U S A 109, 2796–2801, doi: 10.1073/pnas.1104303108 (2012). [DOI] [PMC free article] [PubMed] [Google Scholar]
- 14.Gonda K, Shibata M, Ohtake T, Matsumoto Y, Tachibana K, Abe N, Ohto H, Sakurai K & Takenoshita S Myeloid-derived suppressor cells are increased and correlated with type 2 immune responses, malnutrition, inflammation, and poor prognosis in patients with breast cancer. Oncol Lett 14, 1766–1774, doi: 10.3892/ol.2017.6305 (2017). [DOI] [PMC free article] [PubMed] [Google Scholar]
- 15.Yuan Z-Y, Luo R-Z, Peng R-J, Wang S-S & Xue C High infiltration of tumor-associated macrophages in triple-negative breast cancer is associated with a higher risk of distant metastasis. OncoTargets and therapy 7, 1475–1480, doi: 10.2147/OTT.S61838 (2014). [DOI] [PMC free article] [PubMed] [Google Scholar]
- 16.Tymoszuk P, Charoentong P, Hackl H, Spilka R, Muller-Holzner E, Trajanoski Z, Obrist P, Revillion F, Peyrat JP, Fiegl H & Doppler W High STAT1 mRNA levels but not its tyrosine phosphorylation are associated with macrophage infiltration and bad prognosis in breast cancer. BMC Cancer 14, 257, doi: 10.1186/1471-2407-14-257 (2014). [DOI] [PMC free article] [PubMed] [Google Scholar]
- 17.Allavena P, Sica A, Solinas G, Porta C & Mantovani A The inflammatory micro-environment in tumor progression: the role of tumor-associated macrophages. Crit Rev Oncol Hematol 66, 1–9, doi: 10.1016/j.critrevonc.2007.07.004 (2008). [DOI] [PubMed] [Google Scholar]
- 18.Pollard JW Macrophages define the invasive microenvironment in breast cancer. J Leukoc Biol 84, 623–630, doi: 10.1189/jlb.1107762 (2008). [DOI] [PMC free article] [PubMed] [Google Scholar]
- 19.Solinas G, Germano G, Mantovani A & Allavena P Tumor-associated macrophages (TAM) as major players of the cancer-related inflammation. J Leukoc Biol 86, 1065–1073, doi: 10.1189/jlb.0609385 (2009). [DOI] [PubMed] [Google Scholar]
- 20.Qian BZ & Pollard JW Macrophage diversity enhances tumor progression and metastasis. Cell 141, 39–51, doi: 10.1016/j.cell.2010.03.014 (2010). [DOI] [PMC free article] [PubMed] [Google Scholar]
- 21.Lin EY, Li JF, Gnatovskiy L, Deng Y, Zhu L, Grzesik DA, Qian H, Xue XN & Pollard JW Macrophages regulate the angiogenic switch in a mouse model of breast cancer. Cancer Res 66, 11238–11246, doi: 10.1158/0008-5472.CAN-06-1278 (2006). [DOI] [PubMed] [Google Scholar]
- 22.Guerriero JL Macrophages: The Road Less Traveled, Changing Anticancer Therapy. Trends Mol Med 24, 472–489, doi: 10.1016/j.molmed.2018.03.006 (2018). [DOI] [PMC free article] [PubMed] [Google Scholar]
- 23.Engblom C, Pfirschke C & Pittet MJ The role of myeloid cells in cancer therapies. Nat Rev Cancer 16, 447–462, doi: 10.1038/nrc.2016.54 (2016). [DOI] [PubMed] [Google Scholar]
- 24.Yang L & Zhang Y Tumor-associated macrophages, potential targets for cancer treatment. Biomark Res 5, doi: 10.1186/s40364-017-0106-7 (2017). [DOI] [PMC free article] [PubMed] [Google Scholar]
- 25.Qian B, Deng Y, Im JH, Muschel RJ, Zou Y, Li J, Lang RA & Pollard JW A distinct macrophage population mediates metastatic breast cancer cell extravasation, establishment and growth. PLoS One 4, e6562, doi: 10.1371/journal.pone.0006562 (2009). [DOI] [PMC free article] [PubMed] [Google Scholar]
- 26.Marks SC Jr. & Lane PW Osteopetrosis, a new recessive skeletal mutation on chromosome 12 of the mouse. J Hered 67, 11–18, doi: 10.1093/oxfordjournals.jhered.a108657 (1976). [DOI] [PubMed] [Google Scholar]
- 27.Wiktor-Jedrzejczak WW, Ahmed A, Szczylik C & Skelly RR Hematological characterization of congenital osteopetrosis in op/op mouse. Possible mechanism for abnormal macrophage differentiation. J Exp Med 156, 1516–1527, doi: 10.1084/jem.156.5.1516 (1982). [DOI] [PMC free article] [PubMed] [Google Scholar]
- 28.Wesolowski R, Sharma N, Reebel L, Rodal MB, Peck A, West BL, Marimuthu A, Severson P, Karlin DA & Dowlati A Phase Ib study of the combination of pexidartinib (PLX3397), a CSF-1R inhibitor, and paclitaxel in patients with advanced solid tumors. Therapeutic Advances in Medical Oncology 11, 1758835919854238 (2019). [DOI] [PMC free article] [PubMed] [Google Scholar]
- 29.Quail DF, Bowman RL, Akkari L, Quick ML, Schuhmacher AJ, Huse JT, Holland EC, Sutton JC & Joyce JA The tumor microenvironment underlies acquired resistance to CSF-1R inhibition in gliomas. Science (New York, N.Y.) 352, aad3018–aad3018, doi: 10.1126/science.aad3018 (2016). [DOI] [PMC free article] [PubMed] [Google Scholar]
- 30.Cannarile MA, Ries CH, Hoves S & Ruttinger D Targeting tumor-associated macrophages in cancer therapy and understanding their complexity. Oncoimmunology 3, e955356, doi: 10.4161/21624011.2014.955356 (2014). [DOI] [PMC free article] [PubMed] [Google Scholar]
- 31.Lin JR, Izar B, Wang S, Yapp C, Mei S, Shah PM, Santagata S & Sorger PK Highly multiplexed immunofluorescence imaging of human tissues and tumors using t-CyCIF and conventional optical microscopes. Elife 7, doi: 10.7554/eLife.31657 (2018). [DOI] [PMC free article] [PubMed] [Google Scholar]
- 32.Lin JR, Fallahi-Sichani M, Chen JY & Sorger PK Cyclic Immunofluorescence (CycIF), A Highly Multiplexed Method for Single-cell Imaging. Curr Protoc Chem Biol 8, 251–264, doi: 10.1002/cpch.14 (2016). [DOI] [PMC free article] [PubMed] [Google Scholar]
- 33.Lin JR, Fallahi-Sichani M & Sorger PK Highly multiplexed imaging of single cells using a high-throughput cyclic immunofluorescence method. Nat Commun 6, 8390, doi: 10.1038/ncomms9390 (2015). [DOI] [PMC free article] [PubMed] [Google Scholar]
- 34.Nolan E, Savas P, Policheni AN, Darcy PK, Vaillant F, Mintoff CP, Dushyanthen S, Mansour M, Pang J-MB, Fox SB, Perou CM, Visvader JE, Gray DHD, Loi S & Lindeman GJ Combined immune checkpoint blockade as a therapeutic strategy for BRCA1-mutated breast cancer. Science Translational Medicine 9, eaal4922, doi: 10.1126/scitranslmed.aal4922 (2017). [DOI] [PMC free article] [PubMed] [Google Scholar]
- 35.Barros MH, Hauck F, Dreyer JH, Kempkes B & Niedobitek G Macrophage polarisation: an immunohistochemical approach for identifying M1 and M2 macrophages. PLoS One 8, e80908, doi: 10.1371/journal.pone.0080908 (2013). [DOI] [PMC free article] [PubMed] [Google Scholar]
- 36.Liu X, Holstege H, van der Gulden H, Treur-Mulder M, Zevenhoven J, Velds A, Kerkhoven RM, van Vliet MH, Wessels LF, Peterse JL, Berns A & Jonkers J Somatic loss of BRCA1 and p53 in mice induces mammary tumors with features of human BRCA1-mutated basal-like breast cancer. Proc Natl Acad Sci U S A 104, 12111–12116, doi: 10.1073/pnas.0702969104 (2007). [DOI] [PMC free article] [PubMed] [Google Scholar]
- 37.Rottenberg S, Jaspers JE, Kersbergen A, van der Burg E, Nygren AO, Zander SA, Derksen PW, de Bruin M, Zevenhoven J, Lau A, Boulter R, Cranston A, O’Connor MJ, Martin NM, Borst P & Jonkers J High sensitivity of BRCA1-deficient mammary tumors to the PARP inhibitor AZD2281 alone and in combination with platinum drugs. Proc Natl Acad Sci U S A 105, 17079–17084, doi: 10.1073/pnas.0806092105 (2008). [DOI] [PMC free article] [PubMed] [Google Scholar]
- 38.Pantelidou C, Sonzogni O, de Oliveira Taveira M, Mehta AK, Kothari A, Wang D, Visal T, Li MK, Pinto J, Castrillon JA, Cheney EM, Bouwman P, Jonkers J, Rottenberg S, Guerriero JL, Wulf GM & Shapiro GI PARP inhibitor efficacy depends on CD8+ T cell recruitment via intratumoral STING pathway activation in BRCA-deficient models of triple-negative breast cancer. Cancer Discovery, CD-18–1218, doi: 10.1158/2159-8290.Cd-18-1218 (2019). [DOI] [PMC free article] [PubMed] [Google Scholar]
- 39.Danaher P, Warren S, Dennis L, D’Amico L, White A, Disis ML, Geller MA, Odunsi K, Beechem J & Fling SP Gene expression markers of Tumor Infiltrating Leukocytes. J Immunother Cancer 5, 18, doi: 10.1186/s40425-017-0215-8 (2017). [DOI] [PMC free article] [PubMed] [Google Scholar]
- 40.Jablonski KA, Amici SA, Webb LM, Ruiz-Rosado J. d. D., Popovich PG, Partida-Sanchez S & Guerau-de-Arellano M Novel Markers to Delineate Murine M1 and M2 Macrophages. PLOS ONE 10, e0145342, doi: 10.1371/journal.pone.0145342 (2015). [DOI] [PMC free article] [PubMed] [Google Scholar]
- 41.Jiao S, Xia W, Yamaguchi H, Wei Y, Chen MK, Hsu JM, Hsu JL, Yu WH, Du Y, Lee HH, Li CW, Chou CK, Lim SO, Chang SS, Litton J, Arun B, Hortobagyi GN & Hung MC PARP Inhibitor Upregulates PD-L1 Expression and Enhances Cancer-Associated Immunosuppression. Clin Cancer Res 23, 3711–3720, doi: 10.1158/1078-0432.CCR-16-3215 (2017). [DOI] [PMC free article] [PubMed] [Google Scholar]
- 42.Helft J, Bottcher J, Chakravarty P, Zelenay S, Huotari J, Schraml BU, Goubau D & Reis e Sousa C GM-CSF Mouse Bone Marrow Cultures Comprise a Heterogeneous Population of CD11c(+)MHCII(+) Macrophages and Dendritic Cells. Immunity 42, 1197–1211, doi: 10.1016/j.immuni.2015.05.018 (2015). [DOI] [PubMed] [Google Scholar]
- 43.Akagawa KS, Komuro I, Kanazawa H, Yamazaki T, Mochida K & Kishi F Functional heterogeneity of colony-stimulating factor-induced human monocyte-derived macrophages. Respirology 11Suppl, S32–36, doi: 10.1111/j.1440-1843.2006.00805.x (2006). [DOI] [PubMed] [Google Scholar]
- 44.Murai J, Huang SY, Das BB, Renaud A, Zhang Y, Doroshow JH, Ji J, Takeda S & Pommier Y Trapping of PARP1 and PARP2 by Clinical PARP Inhibitors. Cancer Res 72, 5588–5599, doi: 10.1158/0008-5472.Can-12-2753 (2012). [DOI] [PMC free article] [PubMed] [Google Scholar]
- 45.Pettitt SJ, Krastev DB, Brandsma I, Dréan A, Song F, Aleksandrov R, Harrell MI, Menon M, Brough R, Campbell J, Frankum J, Ranes M, Pemberton HN, Rafiq R, Fenwick K, Swain A, Guettler S, Lee JM, Swisher EM, Stoynov S, Yusa K, Ashworth A & Lord CJ Genome-wide and high-density CRISPR-Cas9 screens identify point mutations in PARP1 causing PARP inhibitor resistance. Nat Commun 9, 1849, doi: 10.1038/s41467-018-03917-2 (2018). [DOI] [PMC free article] [PubMed] [Google Scholar]
- 46.Cai H, Zhu XD, Ao JY, Ye BG, Zhang YY, Chai ZT, Wang CH, Shi WK, Cao MQ, Li XL & Sun HC Colony-stimulating factor-1-induced AIF1 expression in tumor-associated macrophages enhances the progression of hepatocellular carcinoma. Oncoimmunology 6, e1333213, doi: 10.1080/2162402X.2017.1333213 (2017). [DOI] [PMC free article] [PubMed] [Google Scholar]
- 47.Berger NA, Besson VC, Boulares AH, Burkle A, Chiarugi A, Clark RS, Curtin NJ, Cuzzocrea S, Dawson TM, Dawson VL, Hasko G, Liaudet L, Moroni F, Pacher P, Radermacher P, Salzman AL, Snyder SH, Soriano FG, Strosznajder RP, Sumegi B, Swanson RA & Szabo C Opportunities for the repurposing of PARP inhibitors for the therapy of non-oncological diseases. Br J Pharmacol 175, 192–222, doi: 10.1111/bph.13748 (2018). [DOI] [PMC free article] [PubMed] [Google Scholar]
- 48.Liu C, Chikina M, Deshpande R, Menk AV, Wang T, Tabib T, Brunazzi EA, Vignali KM, Sun M, Stolz DB, Lafyatis RA, Chen W, Delgoffe GM, Workman CJ, Wendell SG & Vignali DAA Treg Cells Promote the SREBP1-Dependent Metabolic Fitness of Tumor-Promoting Macrophages via Repression of CD8(+) T Cell-Derived Interferon-gamma. Immunity 51, 381–397.e386, doi: 10.1016/j.immuni.2019.06.017 (2019). [DOI] [PMC free article] [PubMed] [Google Scholar]
- 49.Ries CH, Cannarile MA, Hoves S, Benz J, Wartha K, Runza V, Rey-Giraud F, Pradel LP, Feuerhake F, Klaman I, Jones T, Jucknischke U, Scheiblich S, Kaluza K, Gorr IH, Walz A, Abiraj K, Cassier PA, Sica A, Gomez-Roca C, de Visser KE, Italiano A, Le Tourneau C, Delord JP, Levitsky H, Blay JY & Ruttinger D Targeting tumor-associated macrophages with anti-CSF-1R antibody reveals a strategy for cancer therapy. Cancer Cell 25, 846–859, doi: 10.1016/j.ccr.2014.05.016 (2014). [DOI] [PubMed] [Google Scholar]
- 50.Castano Z, San Juan BP, Spiegel A, Pant A, DeCristo MJ, Laszewski T, Ubellacker JM, Janssen SR, Dongre A, Reinhardt F, Henderson A, Del Rio AG, Gifford AM, Herbert ZT, Hutchinson JN, Weinberg RA, Chaffer CL & McAllister SS IL-1beta inflammatory response driven by primary breast cancer prevents metastasis-initiating cell colonization. Nat Cell Biol 20, 1084–1097, doi: 10.1038/s41556-018-0173-5 (2018). [DOI] [PMC free article] [PubMed] [Google Scholar]
- 51.Ray Chaudhuri A & Nussenzweig A The multifaceted roles of PARP1 in DNA repair and chromatin remodelling. Nature reviews. Molecular cell biology 18, 610–621, doi: 10.1038/nrm.2017.53 (2017). [DOI] [PMC free article] [PubMed] [Google Scholar]
- 52.Ame JC, Rolli V, Schreiber V, Niedergang C, Apiou F, Decker P, Muller S, Hoger T, Menissier-de Murcia J & de Murcia G PARP-2, A novel mammalian DNA damage-dependent poly(ADP-ribose) polymerase. J Biol Chem 274, 17860–17868, doi: 10.1074/jbc.274.25.17860 (1999). [DOI] [PubMed] [Google Scholar]
- 53.Feingold KR, Shigenaga JK, Kazemi MR, McDonald CM, Patzek SM, Cross AS, Moser A & Grunfeld C Mechanisms of triglyceride accumulation in activated macrophages. J Leukoc Biol 92, 829–839, doi: 10.1189/jlb.1111537 (2012). [DOI] [PMC free article] [PubMed] [Google Scholar]
- 54.Modis K, Gero D, Erdelyi K, Szoleczky P, DeWitt D & Szabo C Cellular bioenergetics is regulated by PARP1 under resting conditions and during oxidative stress. Biochem Pharmacol 83, 633–643, doi: 10.1016/j.bcp.2011.12.014 (2012). [DOI] [PMC free article] [PubMed] [Google Scholar]
- 55.Ying W, Garnier P & Swanson RA NAD+ repletion prevents PARP-1-induced glycolytic blockade and cell death in cultured mouse astrocytes. Biochem Biophys Res Commun 308, 809–813, doi: 10.1016/s0006-291x(03)01483-9 (2003). [DOI] [PubMed] [Google Scholar]
- 56.Shrestha E, Hussein MA, Savas JN, Ouimet M, Barrett TJ, Leone S, Yates JR 3rd, Moore KJ, Fisher EA & Garabedian MJ Poly(ADP-ribose) Polymerase 1 Represses Liver X Receptor-mediated ABCA1 Expression and Cholesterol Efflux in Macrophages. J Biol Chem 291, 11172–11184, doi: 10.1074/jbc.M116.726729 (2016). [DOI] [PMC free article] [PubMed] [Google Scholar]
- 57.Pang J, Cui J, Xi C, Shen T, Gong H, Dou L, Lin Y & Zhang T Inhibition of Poly(ADP-Ribose) Polymerase Increased Lipid Accumulation Through SREBP1 Modulation. Cell Physiol Biochem 49, 645–652, doi: 10.1159/000493028 (2018). [DOI] [PubMed] [Google Scholar]
- 58.Poggio F, Bruzzone M, Ceppi M, Conte B, Martel S, Maurer C, Tagliamento M, Viglietti G, Del Mastro L, de Azambuja E & Lambertini M Single-agent PARP inhibitors for the treatment of patients with BRCA-mutated HER2-negative metastatic breast cancer: a systematic review and meta-analysis. ESMO Open 3, e000361, doi: 10.1136/esmoopen-2018-000361 (2018). [DOI] [PMC free article] [PubMed] [Google Scholar]
- 59.Cassier PA, Italiano A, Gomez-Roca CA, Le Tourneau C, Toulmonde M, Cannarile MA, Ries C, Brillouet A, Muller C, Jegg AM, Broske AM, Dembowski M, Bray-French K, Freilinger C, Meneses-Lorente G, Baehner M, Harding R, Ratnayake J, Abiraj K, Gass N, Noh K, Christen RD, Ukarma L, Bompas E, Delord JP, Blay JY & Ruttinger D CSF1R inhibition with emactuzumab in locally advanced diffuse-type tenosynovial giant cell tumours of the soft tissue: a dose-escalation and dose-expansion phase 1 study. Lancet Oncol 16, 949–956, doi: 10.1016/S1470-2045(15)00132-1 (2015). [DOI] [PubMed] [Google Scholar]
- 60.Gelderblom H & de Sande MV Pexidartinib: first approved systemic therapy for patients with tenosynovial giant cell tumor. Future Oncol, doi: 10.2217/fon-2020-0542 (2020). [DOI] [PubMed] [Google Scholar]
- 61.Lin JR, Izar B, Wang S, Yapp C, Mei S, Shah PM, Santagata S & Sorger PK Highly multiplexed immunofluorescence imaging of human tissues and tumors using t-CyCIF and conventional optical microscopes. Elife 7, doi: 10.7554/eLife.31657 (2018). [DOI] [PMC free article] [PubMed] [Google Scholar]
- 62.Lin JR, Fallahi-Sichani M & Sorger PK Highly multiplexed imaging of single cells using a high-throughput cyclic immunofluorescence method. Nat Commun 6, 8390, doi: 10.1038/ncomms9390 (2015). [DOI] [PMC free article] [PubMed] [Google Scholar]
- 63.Navarro J, Gozalbo-López B, Méndez AC, Dantzer F, Schreiber V, Martínez C, Arana DM, Farrés J, Revilla-Nuin B, Bueno MF, Ampurdanés C, Galindo-Campos MA, Knobel PA, Segura-Bayona S, Martin-Caballero J, Stracker TH, Aparicio P, Del Val M & Yélamos J PARP-1/PARP-2 double deficiency in mouse T cells results in faulty immune responses and T lymphomas. Scientific reports 7, 41962–41962, doi: 10.1038/srep41962 (2017). [DOI] [PMC free article] [PubMed] [Google Scholar]
- 64.Liu C, Chikina M, Deshpande R, Menk AV, Wang T, Tabib T, Brunazzi EA, Vignali KM, Sun M, Stolz DB, Lafyatis RA, Chen W, Delgoffe GM, Workman CJ, Wendell SG & Vignali DAA Treg Cells Promote the SREBP1-Dependent Metabolic Fitness of Tumor-Promoting Macrophages via Repression of CD8(+) T Cell-Derived Interferon-gamma. Immunity 51, 381–397.e386, doi: 10.1016/j.immuni.2019.06.017 (2019). [DOI] [PMC free article] [PubMed] [Google Scholar]
- 65.Pacella I, Procaccini C, Focaccetti C, Miacci S, Timperi E, Faicchia D, Severa M, Rizzo F, Coccia EM, Bonacina F, Mitro N, Norata GD, Rossetti G, Ranzani V, Pagani M, Giorda E, Wei Y, Matarese G, Barnaba V & Piconese S Fatty acid metabolism complements glycolysis in the selective regulatory T cell expansion during tumor growth. Proc Natl Acad Sci U S A 115, E6546–e6555, doi: 10.1073/pnas.1720113115 (2018). [DOI] [PMC free article] [PubMed] [Google Scholar]
- 66.Guerriero JL, Sotayo A, Ponichtera HE, Castrillon JA, Pourzia AL, Schad S, Johnson SF, Carrasco RD, Lazo S, Bronson RT, Davis SP, Lobera M, Nolan MA & Letai A Class IIa HDAC inhibition reduces breast tumours and metastases through anti-tumour macrophages. Nature 543, 428–432, doi: 10.1038/nature21409 (2017). [DOI] [PMC free article] [PubMed] [Google Scholar]
- 67.Conesa A, Madrigal P, Tarazona S, Gomez-Cabrero D, Cervera A, McPherson A, Szczesniak MW, Gaffney DJ, Elo LL, Zhang X & Mortazavi A A survey of best practices for RNA-seq data analysis. Genome Biol 17, 13, doi: 10.1186/s13059-016-0881-8 (2016). [DOI] [PMC free article] [PubMed] [Google Scholar]
- 68.Zerbino DR, Achuthan P, Akanni W, Amode MR, Barrell D, Bhai J, Billis K, Cummins C, Gall A, Giron CG, Gil L, Gordon L, Haggerty L, Haskell E, Hourlier T, Izuogu OG, Janacek SH, Juettemann T, To JK, Laird MR, Lavidas I, Liu Z, Loveland JE, Maurel T, McLaren W, Moore B, Mudge J, Murphy DN, Newman V, Nuhn M, Ogeh D, Ong CK, Parker A, Patricio M, Riat HS, Schuilenburg H, Sheppard D, Sparrow H, Taylor K, Thormann A, Vullo A, Walts B, Zadissa A, Frankish A, Hunt SE, Kostadima M, Langridge N, Martin FJ, Muffato M, Perry E, Ruffier M, Staines DM, Trevanion SJ, Aken BL, Cunningham F, Yates A & Flicek P Ensembl 2018. Nucleic Acids Res 46, D754–D761, doi: 10.1093/nar/gkx1098 (2018). [DOI] [PMC free article] [PubMed] [Google Scholar]
- 69.Bray NL, Pimentel H, Melsted P & Pachter L Near-optimal probabilistic RNA-seq quantification. Nature biotechnology 34, 525 (2016). [DOI] [PubMed] [Google Scholar]
- 70.Pimentel H, Bray NL, Puente S, Melsted P & Pachter L Differential analysis of RNA-seq incorporating quantification uncertainty. Nat Methods 14, 687–690, doi: 10.1038/nmeth.4324 (2017). [DOI] [PubMed] [Google Scholar]
- 71.Sergushichev A An algorithm for fast preranked gene set enrichment analysis using cumulative statistic calculation. BioRxiv, 060012 (2016).
- 72.Mookerjee SA, Gerencser AA, Nicholls DG & Brand MD Quantifying intracellular rates of glycolytic and oxidative ATP production and consumption using extracellular flux measurements. The Journal of biological chemistry 292, 7189–7207, doi: 10.1074/jbc.M116.774471 (2017). [DOI] [PMC free article] [PubMed] [Google Scholar]
- 73.McAlister GC, Nusinow DP, Jedrychowski MP, Wuhr M, Huttlin EL, Erickson BK, Rad R, Haas W & Gygi SP MultiNotch MS3 enables accurate, sensitive, and multiplexed detection of differential expression across cancer cell line proteomes. Anal Chem 86, 7150–7158, doi: 10.1021/ac502040v (2014). [DOI] [PMC free article] [PubMed] [Google Scholar]
- 74.Gygi JP, Yu Q, Navarrete-Perea J, Rad R, Gygi SP & Paulo JA Web-Based Search Tool for Visualizing Instrument Performance Using the Triple Knockout (TKO) Proteome Standard. J Proteome Res 18, 687–693, doi: 10.1021/acs.jproteome.8b00737 (2019). [DOI] [PMC free article] [PubMed] [Google Scholar]
- 75.Huttlin EL, Jedrychowski MP, Elias JE, Goswami T, Rad R, Beausoleil SA, Villen J, Haas W, Sowa ME & Gygi SP A tissue-specific atlas of mouse protein phosphorylation and expression. Cell 143, 1174–1189, doi: 10.1016/j.cell.2010.12.001 (2010). [DOI] [PMC free article] [PubMed] [Google Scholar]
- 76.Paulo JA, O’Connell JD, Everley RA, O’Brien J, Gygi MA & Gygi SP Quantitative mass spectrometry-based multiplexing compares the abundance of 5000 S. cerevisiae proteins across 10 carbon sources. J Proteomics 148, 85–93, doi: 10.1016/j.jprot.2016.07.005 (2016). [DOI] [PMC free article] [PubMed] [Google Scholar]
- 77.Maere S, Heymans K & Kuiper M BiNGO: a Cytoscape plugin to assess overrepresentation of gene ontology categories in biological networks. Bioinformatics 21, 3448–3449, doi: 10.1093/bioinformatics/bti551 (2005). [DOI] [PubMed] [Google Scholar]
- 78.Johnson N, Johnson SF, Yao W, Li YC, Choi YE, Bernhardy AJ, Wang Y, Capelletti M, Sarosiek KA, Moreau LA, Chowdhury D, Wickramanayake A, Harrell MI, Liu JF, D’Andrea AD, Miron A, Swisher EM & Shapiro GI Stabilization of mutant BRCA1 protein confers PARP inhibitor and platinum resistance. Proc Natl Acad Sci U S A 110, 17041–17046, doi: 10.1073/pnas.1305170110 (2013). [DOI] [PMC free article] [PubMed] [Google Scholar]
- 79.Barazas M, Gasparini A, Huang Y, Kucukosmanoglu A, Annunziato S, Bouwman P, Sol W, Kersbergen A, Proost N, de Korte-Grimmerink R, van de Ven M, Jonkers J, Borst GR & Rottenberg S Radiosensitivity Is an Acquired Vulnerability of PARPi-Resistant BRCA1-Deficient Tumors. Cancer Res 79, 452–460, doi: 10.1158/0008-5472.CAN-18-2077 (2019). [DOI] [PMC free article] [PubMed] [Google Scholar]
Associated Data
This section collects any data citations, data availability statements, or supplementary materials included in this article.
Data Availability Statement
The data that support the findings of this study are available upon reasonable request from the corresponding author [J.L.G.]. The data are not publicly available due to IRB restrictions due to the data containing information that could compromise research participant privacy/consent. With controlled use the mass spectrometry proteomics data have been deposited to the ProteomeXchange Consortium via the PRIDE partner repository with the dataset identifier PXD015804. Data are available via ProteomeXchange with identifier PXD015804. With controlled use the RNA sequencing data has been deposited on synapse (syn23018992). All CyCIF images are available at: https://www.cycif.org/data/mehta-2020/.