

Abstract
Staff dose management is a continuing concern in fluoroscopically-guided interventional (FGI) procedures. Being unaware of radiation scatter levels can lead to unnecessarily high stochastic and deterministic risks due to the effects of absorbed dose by staff members. Our group has developed a scattered-radiation display system (SDS) capable of monitoring system parameters in real-time using a controller-area network (CAN) bus interface and displaying a color-coded mapping of the Compton-scatter distribution. This system additionally uses a time-of-flight depth sensing camera to track staff member positional information for dose rate updates. The current work capitalizes on our body tracking methodology to facilitate individualized dose recording via human recognition using 16-bit grayscale depth maps acquired using a Microsoft Kinect V2. Background features are removed from the images using a depth threshold technique and connected component analysis, which results in a body silhouette binary mask. The masks are then fed into a convolutional neural network (CNN) for identification of unique body shape features. The CNN was trained using 144 binary masks for each of four individuals (total of 576 images). Initial results indicate high-fidelity prediction (97.3% testing accuracy) from the CNN irrespective of obstructing objects (face masks and lead aprons). Body tracking is still maintained when protective attire is introduced, albeit with a slight increase in positional data error. Dose reports are then able to be produced which contain cumulative dose to each staff member at the eye lens level, waist level, and collar level. Individualized cumulative dose reporting through the use of a CNN in addition to real-time feedback in the clinic will lead to improved radiation dose management.
1. INTRODUCTION
Minimally invasive fluoroscopic procedures may lead to long exposure times on the order of ten minutes, and, in extreme cases, thirty minutes or more.1 Such procedures require focused care by the interventional staff members so as to avoid deterministic thresholds for latent skin effects for the patient while also maintaining sufficient image quality and care. Additionally, ICRP Report 118 has recently proposed a lower threshold for cataractogenesis of 500 mGy, further underscoring the importance of dose monitoring and protocol selection. To mitigate risks to the patient, our group has developed the Dose Tracking System (DTS), which acquires digitized machine parameters in real-time via access to a fluoroscopic machine’s application programming interface (API).2 The DTS is currently a product licensed to Canon Medical Systems Inc., and distributed with various clinical systems.
In addition to patient dose monitoring during such procedures, various sources imply a need for minimization of staff member doses in accordance with the as low as reasonably achievable (ALARA) paradigm. Several organizations, such as the NCRP and American College of Radiology, have begun establishing standards for educating fluoroscopic operators and staff, but none efficiently educate on optimal locations in the room with regards to scatter dose.1,3 Further, studies have indicated that interventionalists may overuse high dose-rate techniques, such as digital subtraction angiography (DSA), and may neglect the use of protective apparatus such as leaded eyewear and ceiling-mounted shields.4
A paradigm shift has thus begun to emerge where several groups are developing safety training systems using augmented reality (AR) and virtual reality (VR) to assist staff members and residents in their understanding of dose received, and potential changes in practice to avoid high-dose regions in the spatial distribution of scatter as well as high dose-rate techniques when available. One such system is XAware-Live, which was designed and developed by a group at the University of Strasbourg.5 This particular system makes use of a high-end graphics processing unit (GPU), and approximately 1 million photon histories, to accomplish pseudo-real-time AR training with on-the-fly Monte Carlo (MC) simulations. It is unique in that it integrates MC-based patient skin and organ dose tracking alongside staff dose monitoring. To yield feedback post-procedure, for improved training, they have paired their system with real-time dosimeter feedback. This feedback allows for monitoring dose over time for each staff member, and matching times of high dose with the scatter distribution at the same time in the procedure.
Other groups have taken similar approaches using VR as the basis for training: one based in the University of Science and Technology of China, and one based in Flensburg University in Germany. The former’s system is rather simple in that it involves the use of a Microsoft Hololens for viewing and interacting with the training system.6 This particular system allows for the user to input changes to geometric and exposure parameters, but does not offer a way for trainees to re-approach procedures they were once involved with. The second system developed at Flensburg University is more detailed, allowing for the trainee to view 3D scatter distributions, utilize a virtual dose probe, and sample different planes of scatter.7 However, like the formerly discussed system, there is no clear method available for trainees to re-approach procedures. Both of these groups rely upon high-end GPUs for on-the-fly MC calculations.
Due to positive feedback in a survey from interventionalists, our group has primarily focused on the development of a real-time staff dose monitoring software, called the Scattered Radiation Display System (SDS).8 This system is designed to supplement the DTS by providing intraprocedural feedback of spatial distributions of scatter as well as dose-rate values.9 As opposed to other groups’ approaches, we have dedicated much time to considerations for staff localization during procedures in order to provide an intuitive, and meaningful dose feedback model.10,11 The group at the University of Strasbourg did, in fact, consider staff dose localization in one approach, but does not implement this for dose rate tracking. As stated earlier, they rely upon an expensive, real-time dosimeter system for acquiring this information. Our group has proposed two methods: 1) overlay of position indicators in the software system which match ones placed in the interventional suite and 2) use of a depth-sensing camera for acquiring body location.8 We have chosen the second approach due to its compactness in the room, as well as the more intuitive visual feedback in the system through the use of staff member position indicators.9 To maintain real-time feedback, our group has avoided expensive GPUs via the development of a room scatter dose matrix library, which is pre-loaded. EGSnrc MC simulations are used for generating these matrices with a large number of photon histories (1 billion) that facilitates sub-10% error, pending our choice of interpolation coarseness. Given that the SDS may be interfaced with any system which utilizes some sort of API, or controller area network (CAN), it is rather convenient for acquiring log files of every exposure event during a procedure. As such, post-procedure we have a system which can function on a wide variety of computers at a low cost while still providing high fidelity and accuracy.
The focus of the work in this manuscript is a natural extension of the work we have done with body tracking. As stated previously, we currently make use of a depth sensing camera for monitoring staff positions. To assist with post-procedural analysis in the SDS, as well as in a VR training system we have developed, human recognition would allow for individualized feedback for doses at various heights. Our work utilizes a technique based on body shape, rather than facial features, due to its greater conspicuity in the context of fluoroscopic procedures. We account for protective attire, body orientation and variation, while still demonstrating the efficacy of such an approach.
2. MATERIALS AND METHODS
1.1. Real-Time Scattered Radiation Display System
The SDS has been designed to provide a virtual top-down perspective of the scatter distribution and interventional suite. While the SDS stores 3D pre-calculated scatter distribution matrices (computed using EGSnrc Monte Carlo), the top-down view of one plane offers a quick, intuitive visual feedback of high-dose regions to avoid (note: the interventionalist typically remains behind a tableside shield, thus dose monitoring in this context is mainly applicable to the ancillary staff members). Currently, we maintain a height of 1 m above the floor for the dose map since this corresponds, approximately, to the vertical location of gantry isocenter and a typical individual’s waist height. Figure 1 provides an example image frame from the SDS. In this image, the virtual background is presented which consists of a supine patient graphic (matching the size and sex of the patient undergoing the procedure), patient table, and C-Arm gantry. The black circular region in the image is an example of a staff member position indicator, which contains a dose rate label. In previous work, we have developed a linear transformation algorithm which converts staff member coordinates computed in a robot operating system (ROS) wrapper to on-screen positions in the SDS.
Fig. 1:
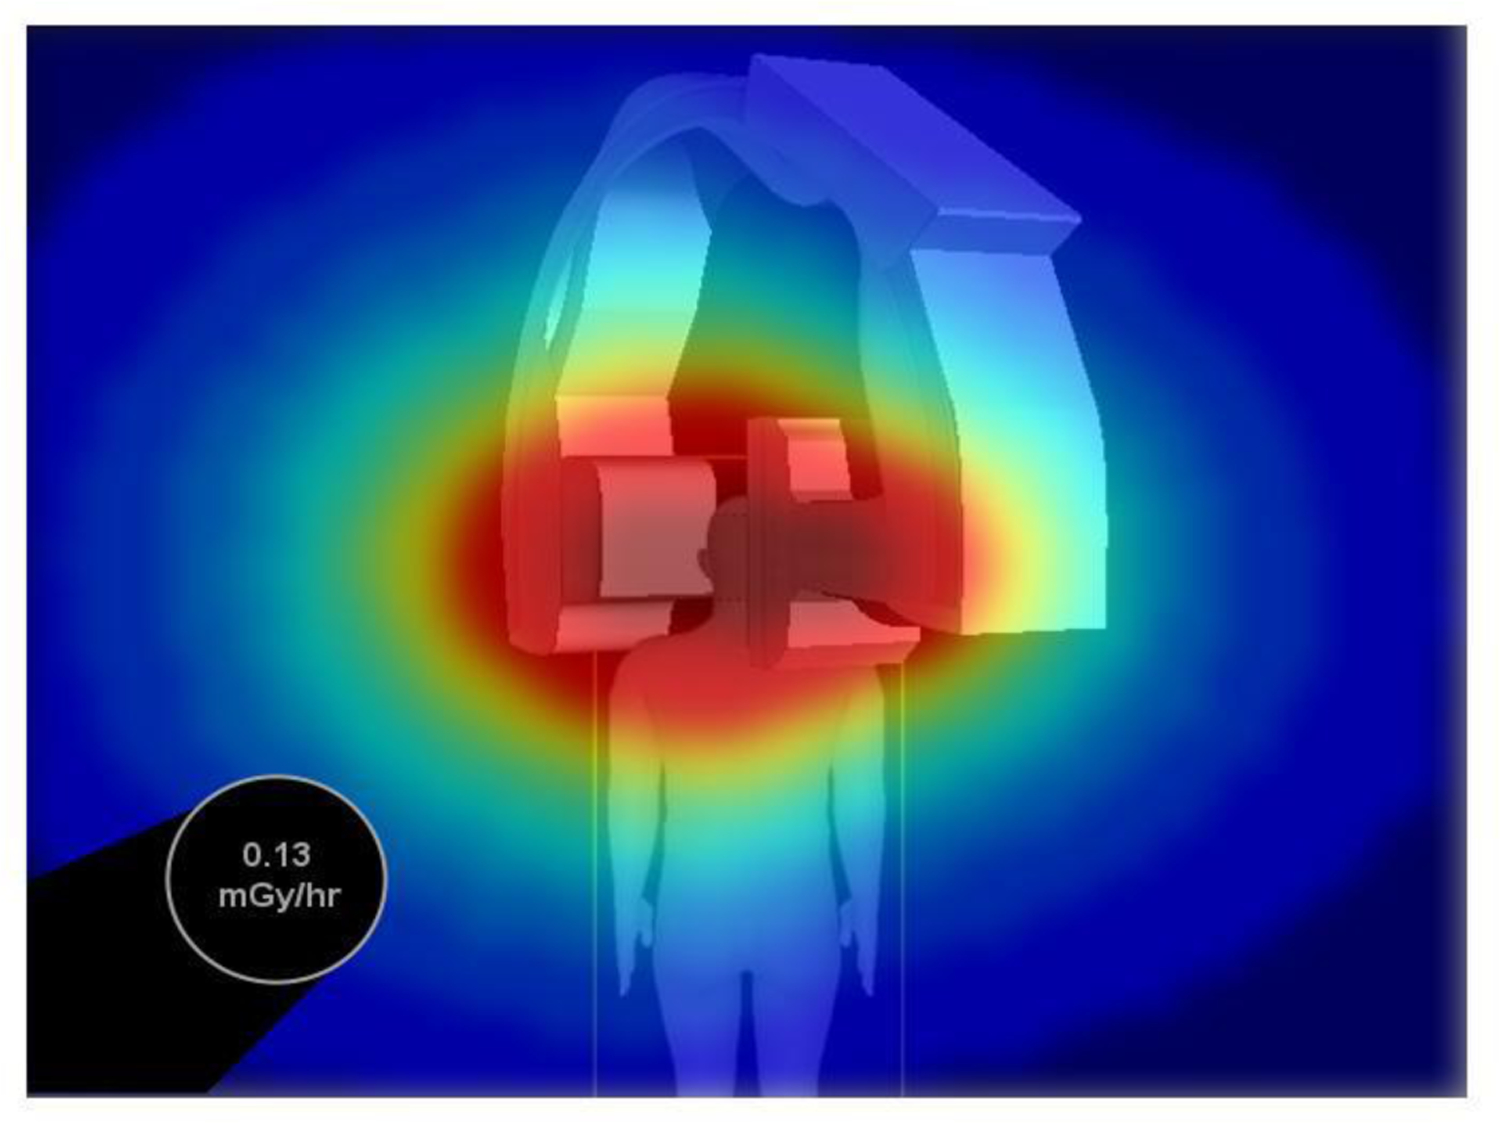
An example SDS image frame displaying a top-down, virtual representation of the interventional room. Scatter distributions are color-coded and overlayed on the virtual background while dose is presented at a staff member’s location using a black, circular position/dose rate indicator. [Note: the ceiling perspective shown looks down on the patient who is lying on a table; the gantry is at 30 degrees LAO]
1.2. Human Recognition and Convolutional Neural Network Development
Human recognition is accomplished using a method based off of a depth image threshold technique developed by Xu and Fujimura.12 Their technique takes advantage of a time-of-flight depth camera’s range in order to generate a dividing region between a foreground containing people of interest and a background, which is of no interest. One sets the maximum depth threshold depending on the given application. In our work, we placed a Microsoft Kinect V2 on a support structure to emulate its fixation to the ceiling of the interventional room (see Figure 2). The Kinect V2 was tilted at an angle of approximately 30 degrees to properly capture the entirety of the body for each of four individuals (this number was selected since four individuals are typically involved with a procedure: the interventionalist, anesthesiologist, nurse, and technician). A depth image of the background (interventional room with no individuals in frame) was acquired for analysis of the depth threshold requirements.
Fig. 2:
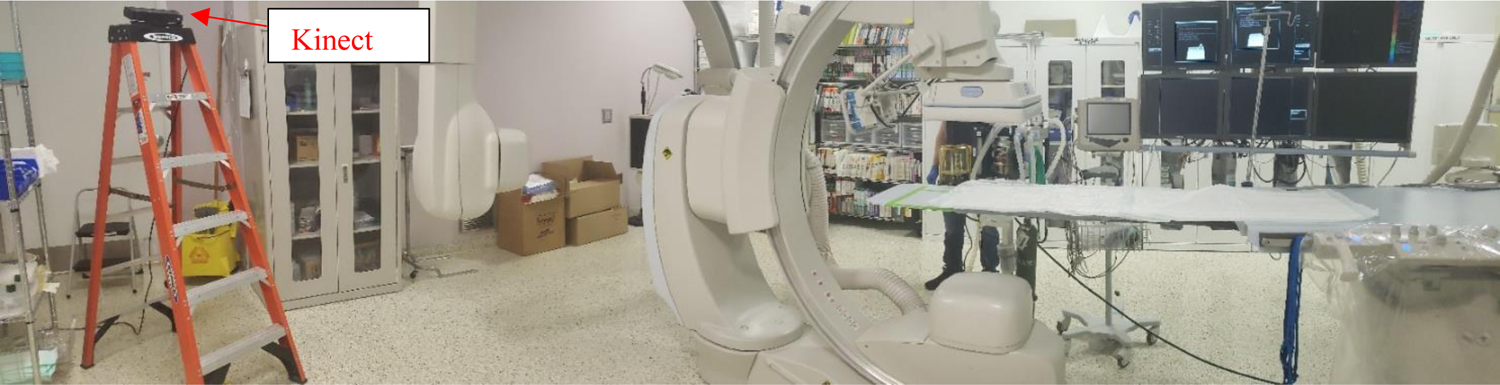
Our setup for raw depth-image acquisition for CNN training. The Kinect V2 camera shown in the image was placed on a ladder to emulate fixation to the ceiling, which would be the case for installation in the interventional room. The camera was tilted downward by 30 degrees to facilitate full-body capture at the two locations mentioned in the Figure 3 caption.
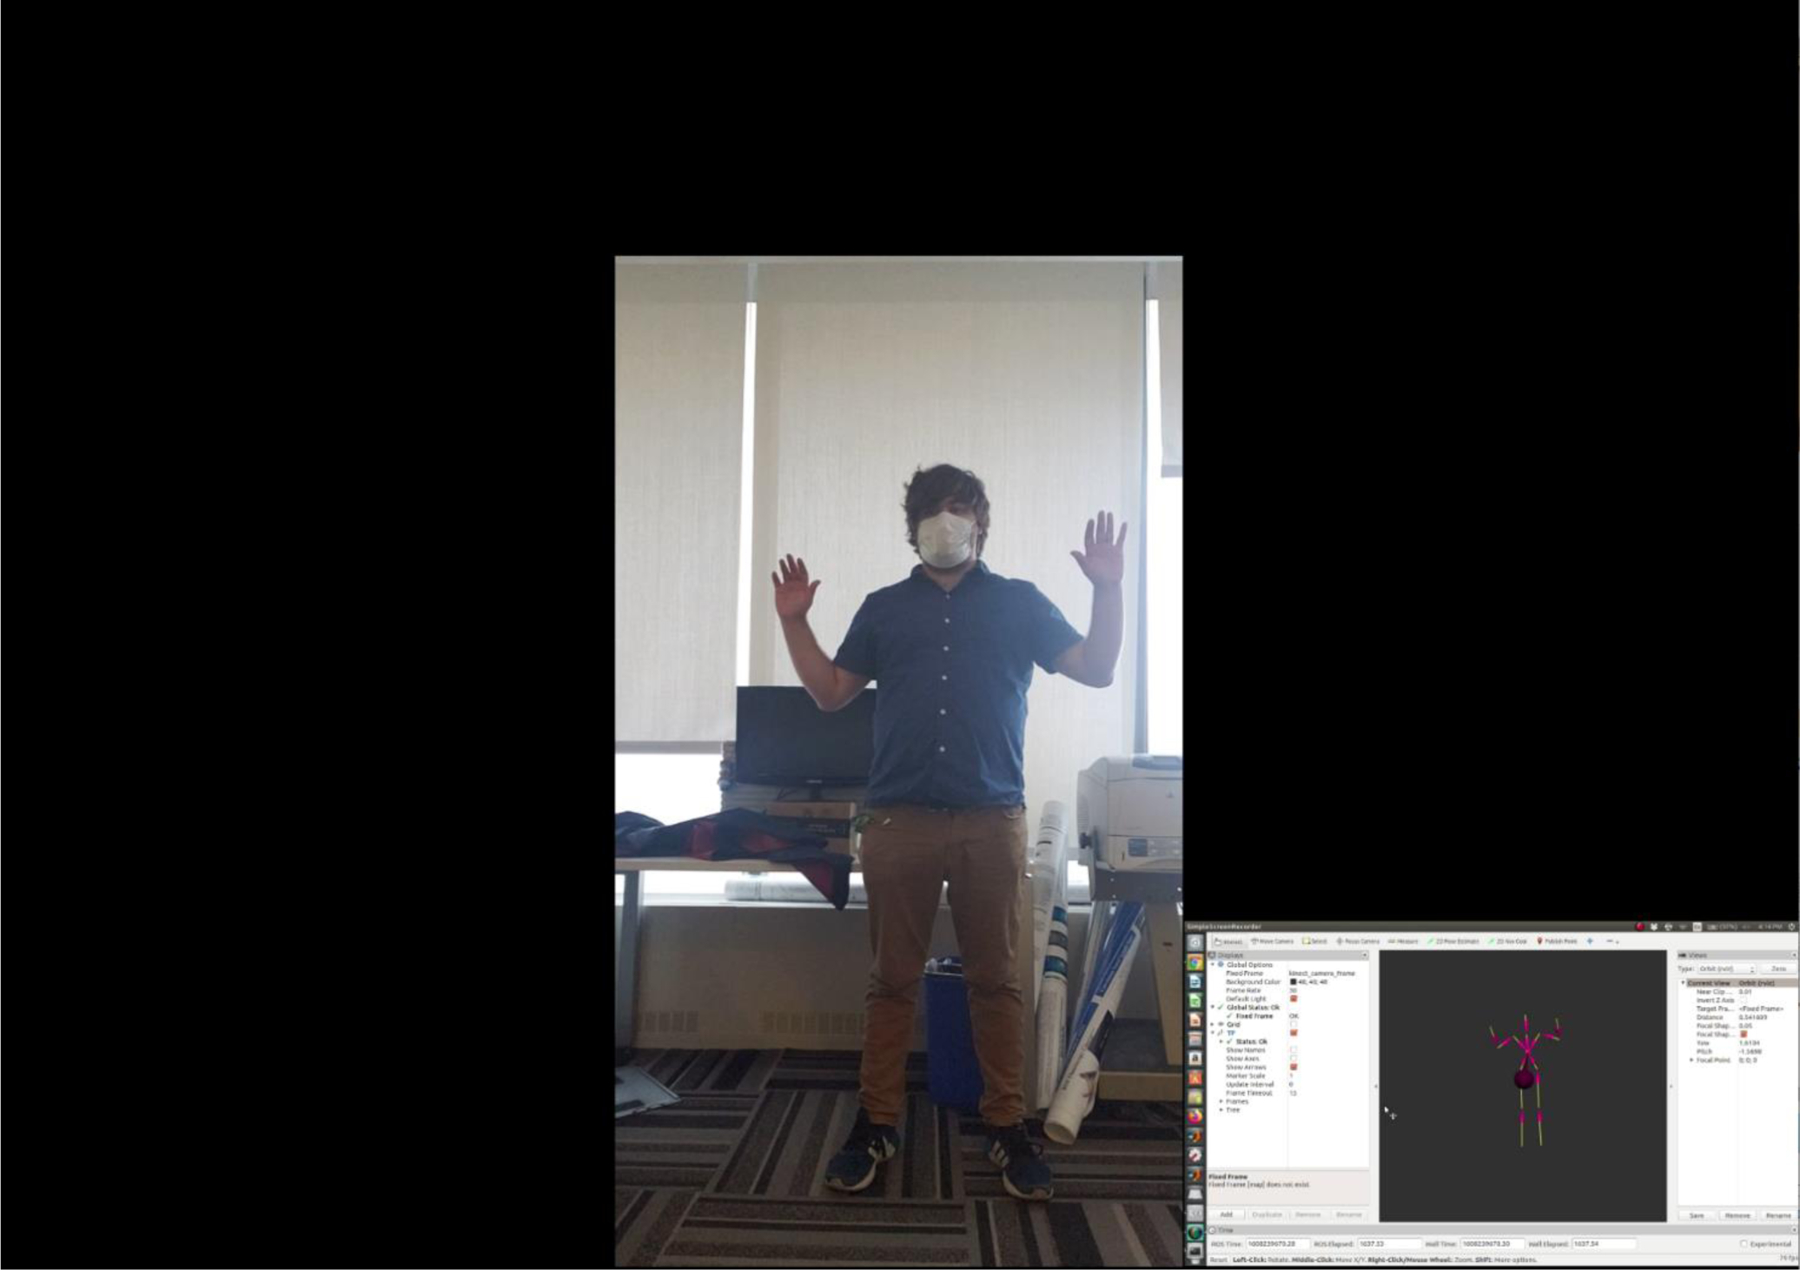
Two positions (151 cm and 283 cm) were marked from the camera for acquisition of raw depth images of the four individuals. At each of the two locations, additional markers were placed to guide the individuals through a 360 degree rotation at 10 degree intervals. For each of the individuals and each position, raw depth images were acquired at each 10 degree orientation (see Figure 3). This process was then repeated for each individual after donning a lead-equivalent apron and thyroid shield. Therefore, for each individual 144 raw depth images were recorded. It should be noted that for all images the individuals were wearing face masks.
Fig. 3:
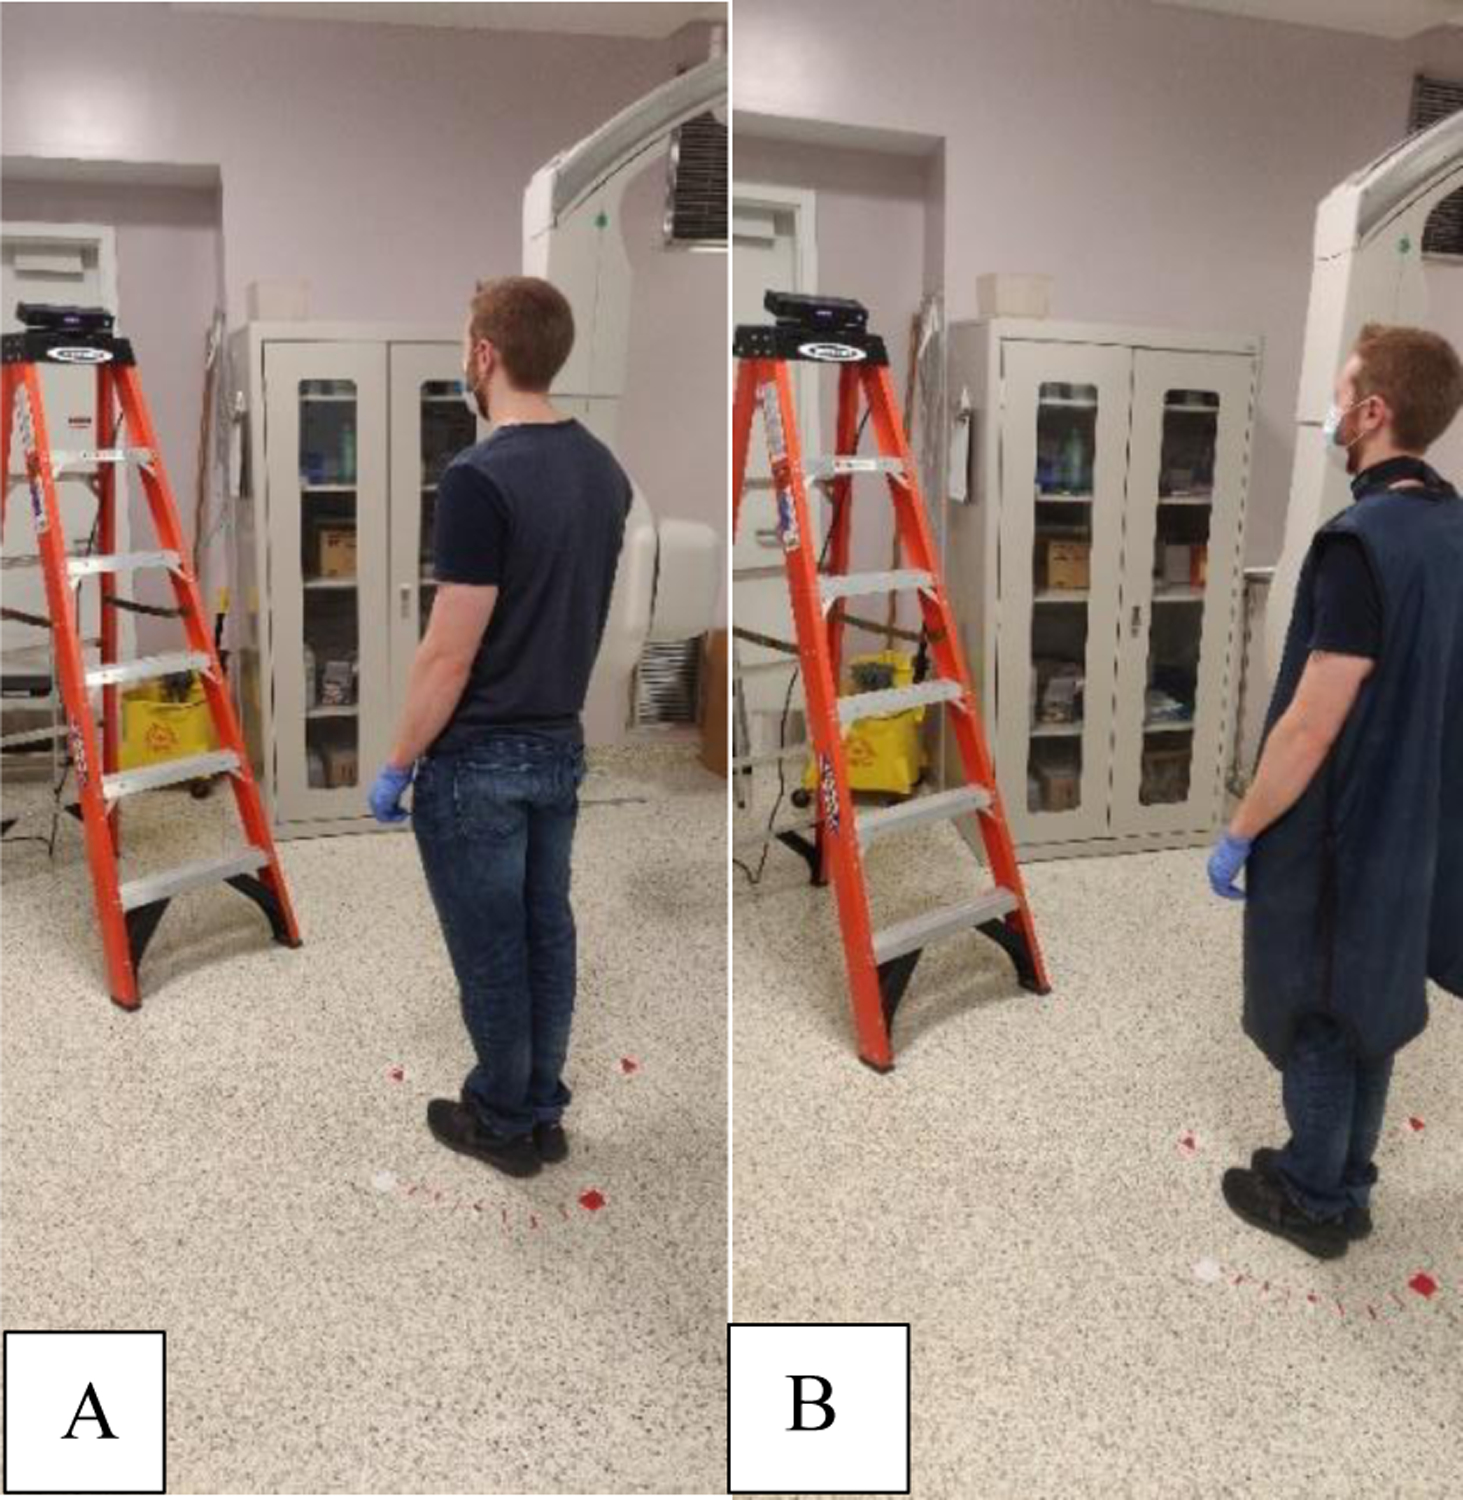
(A) Depth image acquisition at 151 cm from the camera along its line-of-sight for an individual not wearing a lead-equivalent apron. (B) Depth image acquisition for the same individual while wearing an apron. The red markers on the ground denote approximate 10 degree intervals for reference. Training images were then acquired with the individual rotated at each of the 10 degree locations. This process was repeated for the 283 cm distance along the camera’s line-of-sight. [Note: this entire process is done for all four individuals]
The raw depth images were then processed using a Matlab script which applied the aforementioned depth threshold according to the background image analysis. To improve upon Xu and Fujimura’s technique, we employed a median filter to remove specular interference still present in the image as well as connected component analysis to intuitively remove the body silhouettes. An additional image processing step was employed, which robustly removes the floor from the image via a priori knowledge of the proportion between the number of pixels containing floor features and no features in any given image matrix row, as compared to the rows containing human features. Figure 4 highlights the workflow for raw depth frame processing.
Fig. 4:
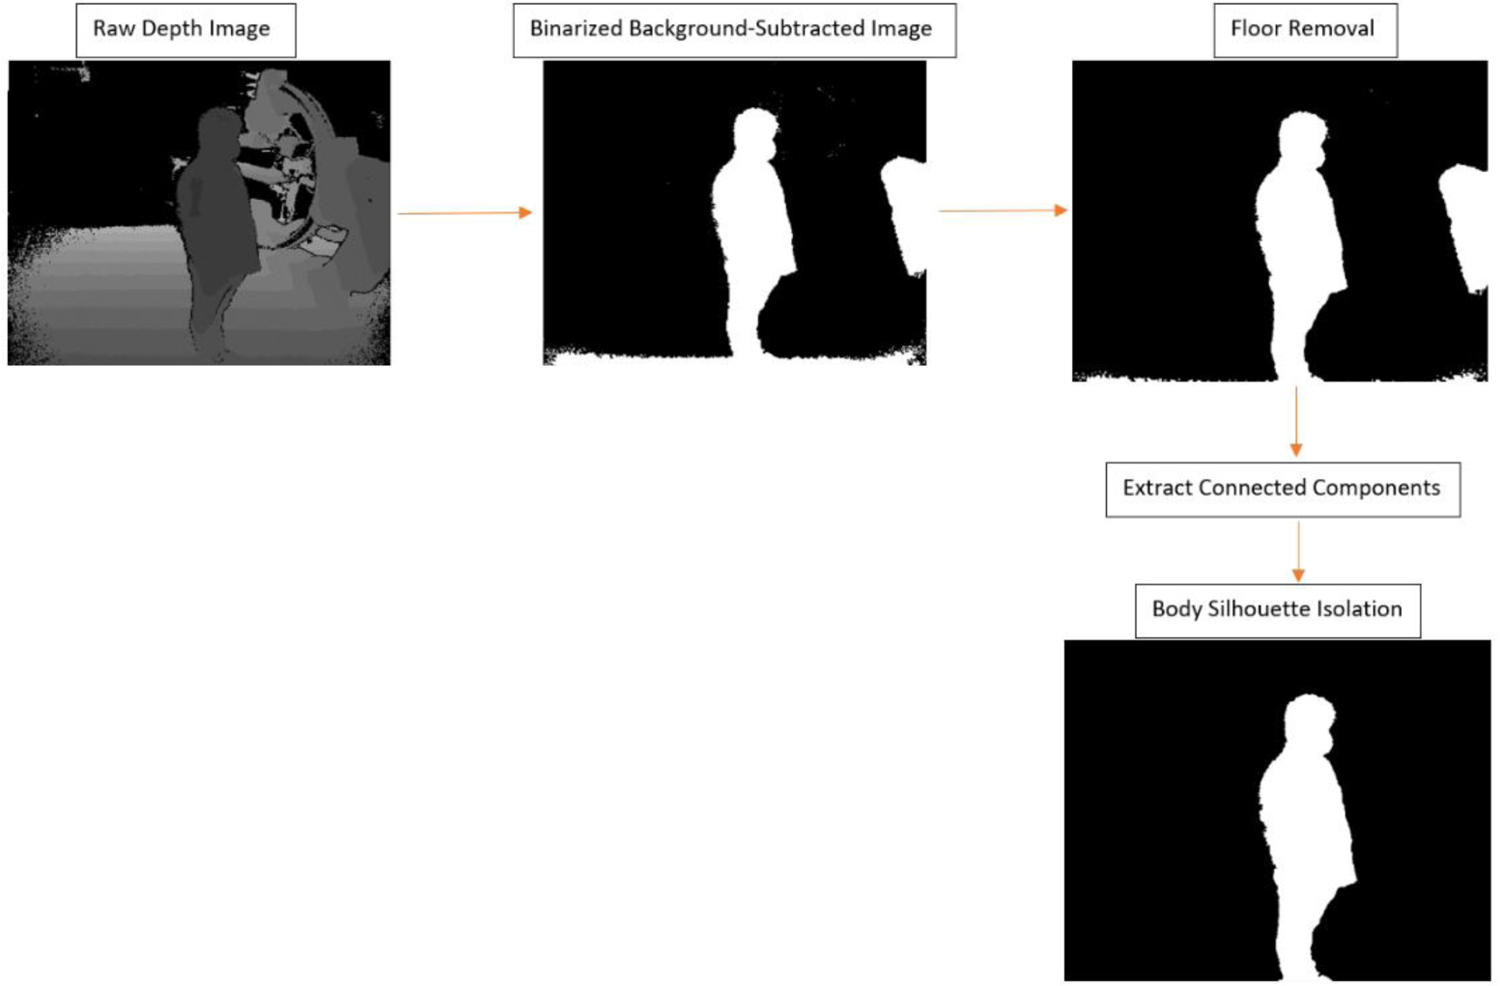
Workflow for depth image processing. Firstly, the raw 16-bit grayscale depth image for each individual is acquired and a threshold is chosen for the grayscale which represents distance in order to remove background. This threshold was selected manually such that C-Arm features were minimized, but so that sufficient human features were present. Secondly, the thresholded image is binarized where black indicates the maximum (threshold) and white indicates any closer distances. Thirdly, the floor features are removed via a second threshold specifying a-priori knowledge of the ratio between floor features and non-floor features in any given image matrix row (we selected 0.5 for our work). Next, the floor-removed image is processed using Matlab’s built-in connected component analysis functions (bwlabel and bwconncomp) to extract distinct “blobs” existent in the image. The final image is a binary mask consisting of only the individual’s body silhouette.
The final images stored after depth image processing are binary maps such that the white region outlines the individual’s body silhouette. The binary images for each individual were configured in a database with corresponding image classifiers (numerical index ranging from 0 to 4 representing each individual’s identity). 60% of this database was then utilized for training in a CNN using an architecture which was designed for multi-class classification (softmax activation and categorical cross-entropy loss function). Figure 5 presents the CNN architecture. For testing and validation, 20% splits were utilized.
Fig. 5:
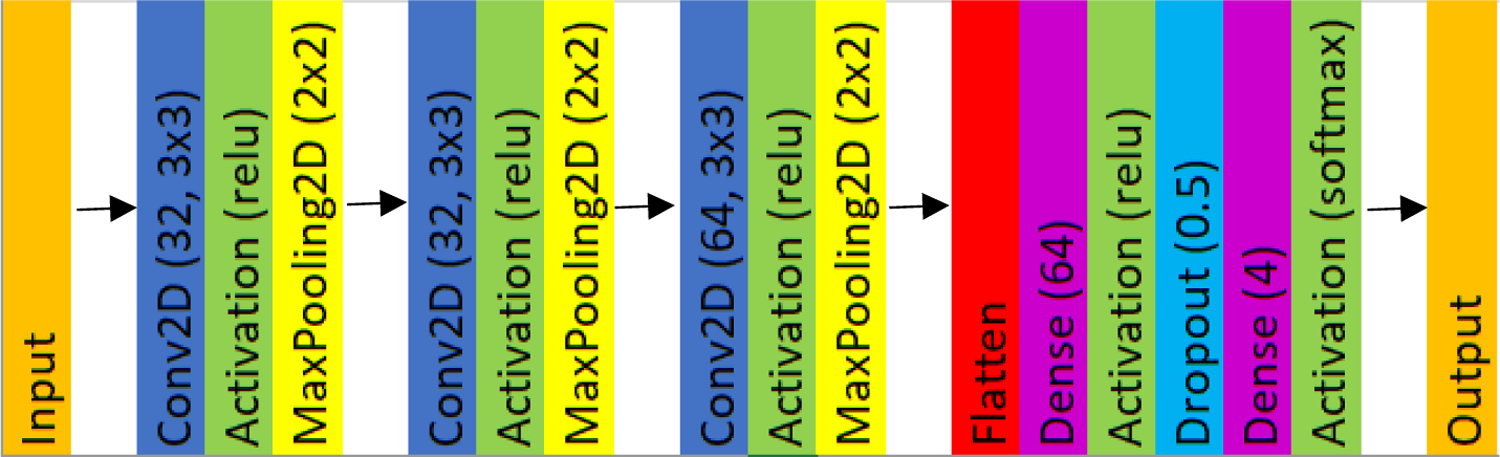
The CNN architecture we developed consists of an input layer, which is the binary mask of a given individual, and an output which is the label (person ID) corresponding to the image. A softmax activation function was chosen between the final dense layer and output layer to satisfy our multi-class problem.
After training, our CNN was integrated into an ROS wrapper used for body tracking in the SDS. Once an individual is identified, the CNN code only runs to re-identify that individual when one of the following, or a combination of the following, situations occurs: 1) a staff member leaves and re-enters the depth camera’s field-of-view (FOV), 2) an object in the room obscures the staff member, 3) a staff member passes in front of another staff member, occluding the latter one. When each of the aforementioned scenarios occurs, the CNN is run again. In the event that multiple cameras are installed in the interventional room, the algorithm would rely upon other imaging chains to maintain identity using a weighting scheme. Thus, as long as an initial identification succeeds, the ID is attached to the corresponding staff member’s body frame via comparison of the binary mask centroid position and body frame coordinates.
3. RESULTS
3.1. CNN Model Performance
CNN model performance was first evaluated through plotting the CNN-predicted classification labels against the ground truth labels, as seen in Figure 6. The four integral labels (0, 1, 2, and 3) represent the IDs for the four individuals we seek to identify. Our results indicate very good predictability from the model (97.3% testing accuracy). However, one may observe two datapoint clusters which divert from the line of unity at the ground truth labels of 1 and 2. These clusters correspond to two images which were incorrectly labeled as 0 for the ground-truth label of 2, while one was incorrectly labeled as 0 for a ground-truth label of 1. We believe this failure is due to depth disparity at the 283 cm distance from the camera when noise was more pronounced, leading to a disruption of detectable features on the head (see Figure 7).
Fig. 6:
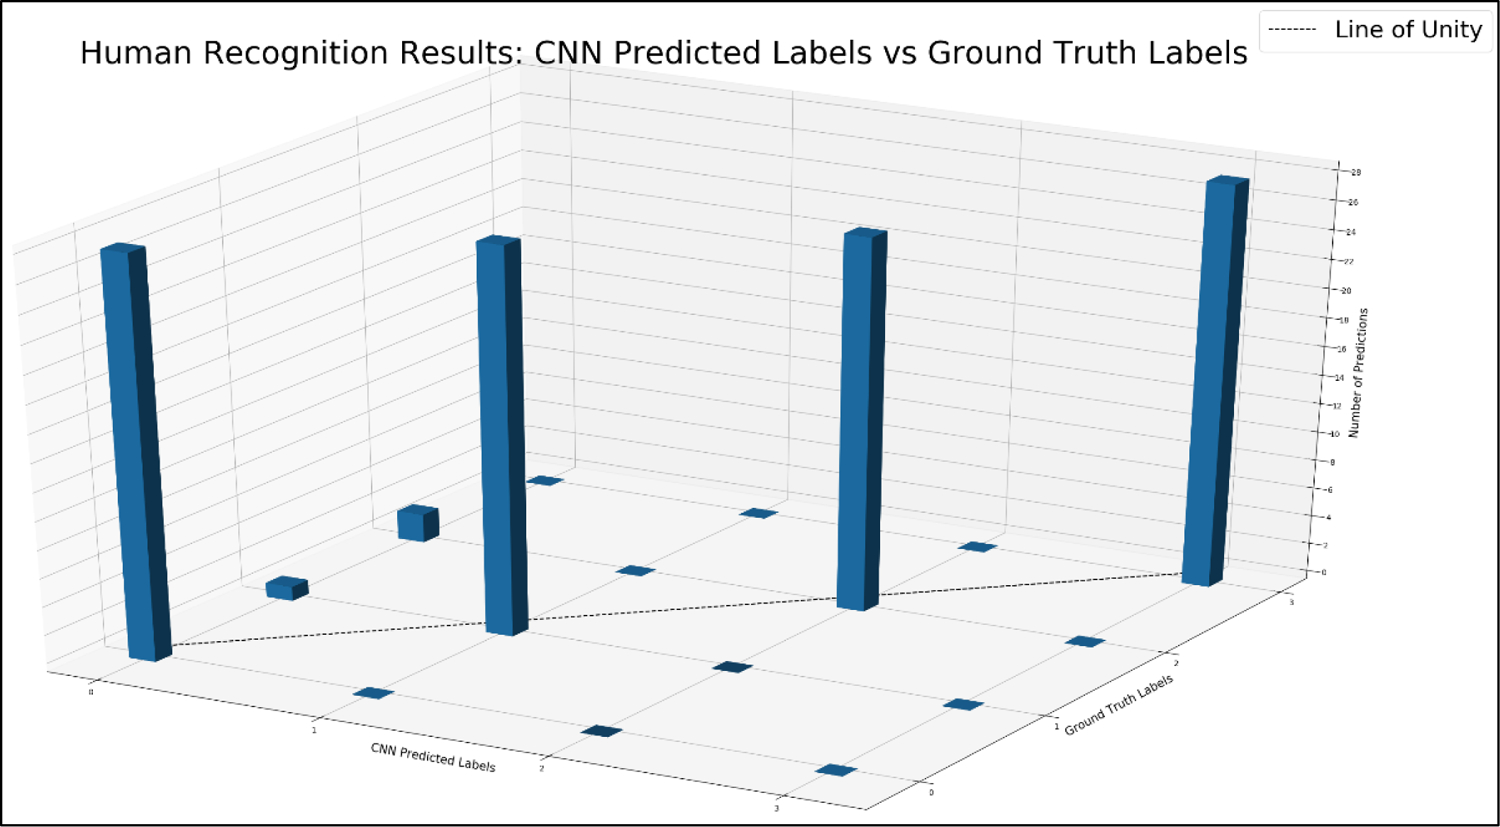
The histogram presented in this figure compares all 112 predicted labels for body silhouette masks in the testing dataset to the corresponding ground truth label. The line of unity indicates perfect agreement, and as can be observed there is a 97.3% accuracy. Two clusters are present in the histogram at ground truth labels of 1 and 2, which represents three cases where the body silhouettes were improperly classified. Figure 7 presents these cases in more detail.
Fig. 7:
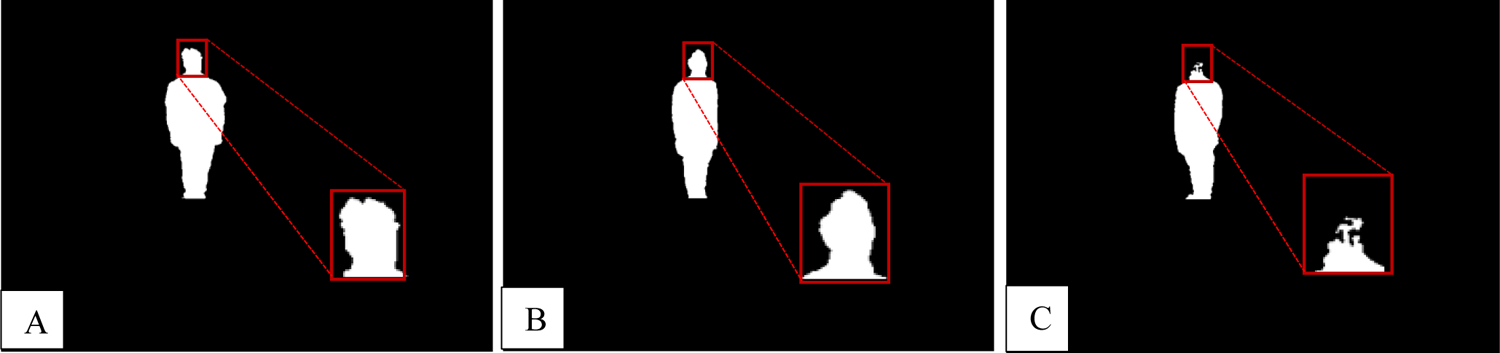
All of the images in the failed cases are presented here. These images were all acquired at 283 cm from the depth camera. Due to increased image noise at distances further from the camera, there is more disparity in the silhouette, particularly at the head location. (A) Individual with ID 1 incorrectly labeled as 0; a notch is present in the head, which skewed the network’s performance. (B) Individual with ID 2 improperly labeled as 0; the back portion of the head appears to have been cut off and blurred. (C) Individual with ID 2 improperly labeled as 0; the head was cut off completely.
3.2. SDS Post-Procedural Report
Figure 8 presents an SDS dose report template which lists the staff members’ names, cumulative dose at waist level, cumulative dose at collarbone level (corresponds to typical personal dosimeter height), and cumulative dose at eye level (representing eye lens location). The height information is extracted using a body tracking method, which our group has previously integrated into the SDS.11 Using this information, it is possible to supplement dosimetry reports by providing information which wouldn’t be readily available.
Fig. 8:
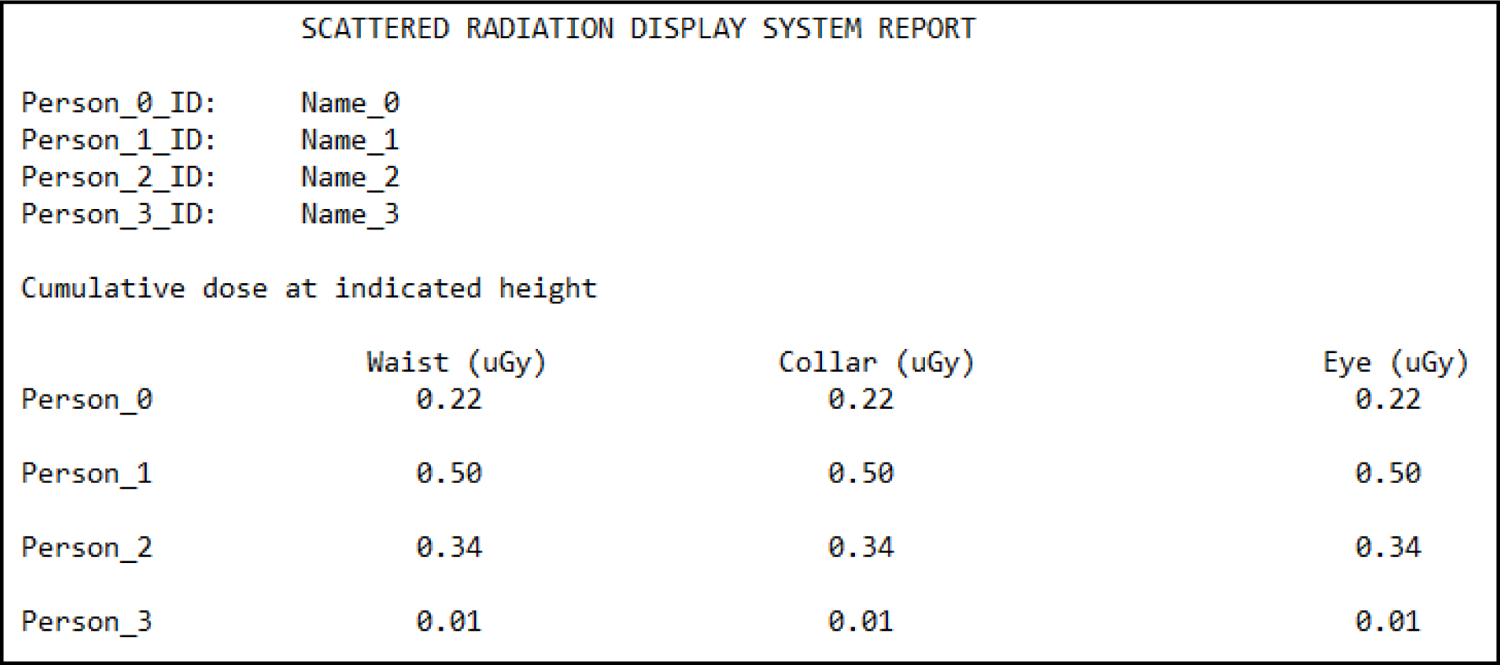
Shown here is an example SDS report template. For each of the individuals (four in this case) involved with a procedure, the names will be listed as person IDs. Further, a number of rows equal to the number of individuals lists absorbed doses at the four locations mentioned in the text (waist, collar, left eye lens, and right eye lens). [Note: the values listed are placeholders and don’t represent those from an actual procedure]
3.3. Impact of Protective Attire on Body Tracking Performance
Human recognition based off of body shape would not be practical in a clinical setting if body tracking was to fail due to occlusion of important features by protective attire such as lead-equivalent aprons, thyroid shields, as well as surgical masks. Our group has previously demonstrated that the occlusion of facial features does not impact body tracking performance, however we did not evaluate the impact on performance due to the lead apron and thyroid shield.13 In videos 1 and 2 we demonstrate body tracking using a Microsoft Kinect V2 depth camera interfaced to a Robotic Operating System (ROS) wrapper, where RViz is used to visualize the body frames shown at the bottom right of the video clips. We did not seek to evaluate the performance quantitatively given that, qualitatively, it is rather clear that there is a minor impact on tracking, as seen in video 2. These minor errors occur in leg tracking due to occlusion of landmark features. However, we can see that tracking does not fail such that the waist, collar, and head locations are updated smoothly.
Video 1:
A look at body tracking performance when protective attire is not introduced. The smaller video insert is the output from RViz, which helps visualize the individual’s body frame using an ROS wrapper for tracking. As can be seen, body tracking performance is virtually flawless with the exception of minor errors during leg tracking.
Video 2:
A look at body tracking performance when a lead-equivalent apron and thyroid shield are introduced. The smaller video insert is the output from RViz, which helps visualize the individual’s body frame using an ROS wrapper for tracking. As can be seen, body tracking performance is sufficient for monitoring waist, collar, and head locations, although leg tracking doesn’t perform as well due to the larger occlusion of features as compared to the previous example where the protective attire was not introduced.
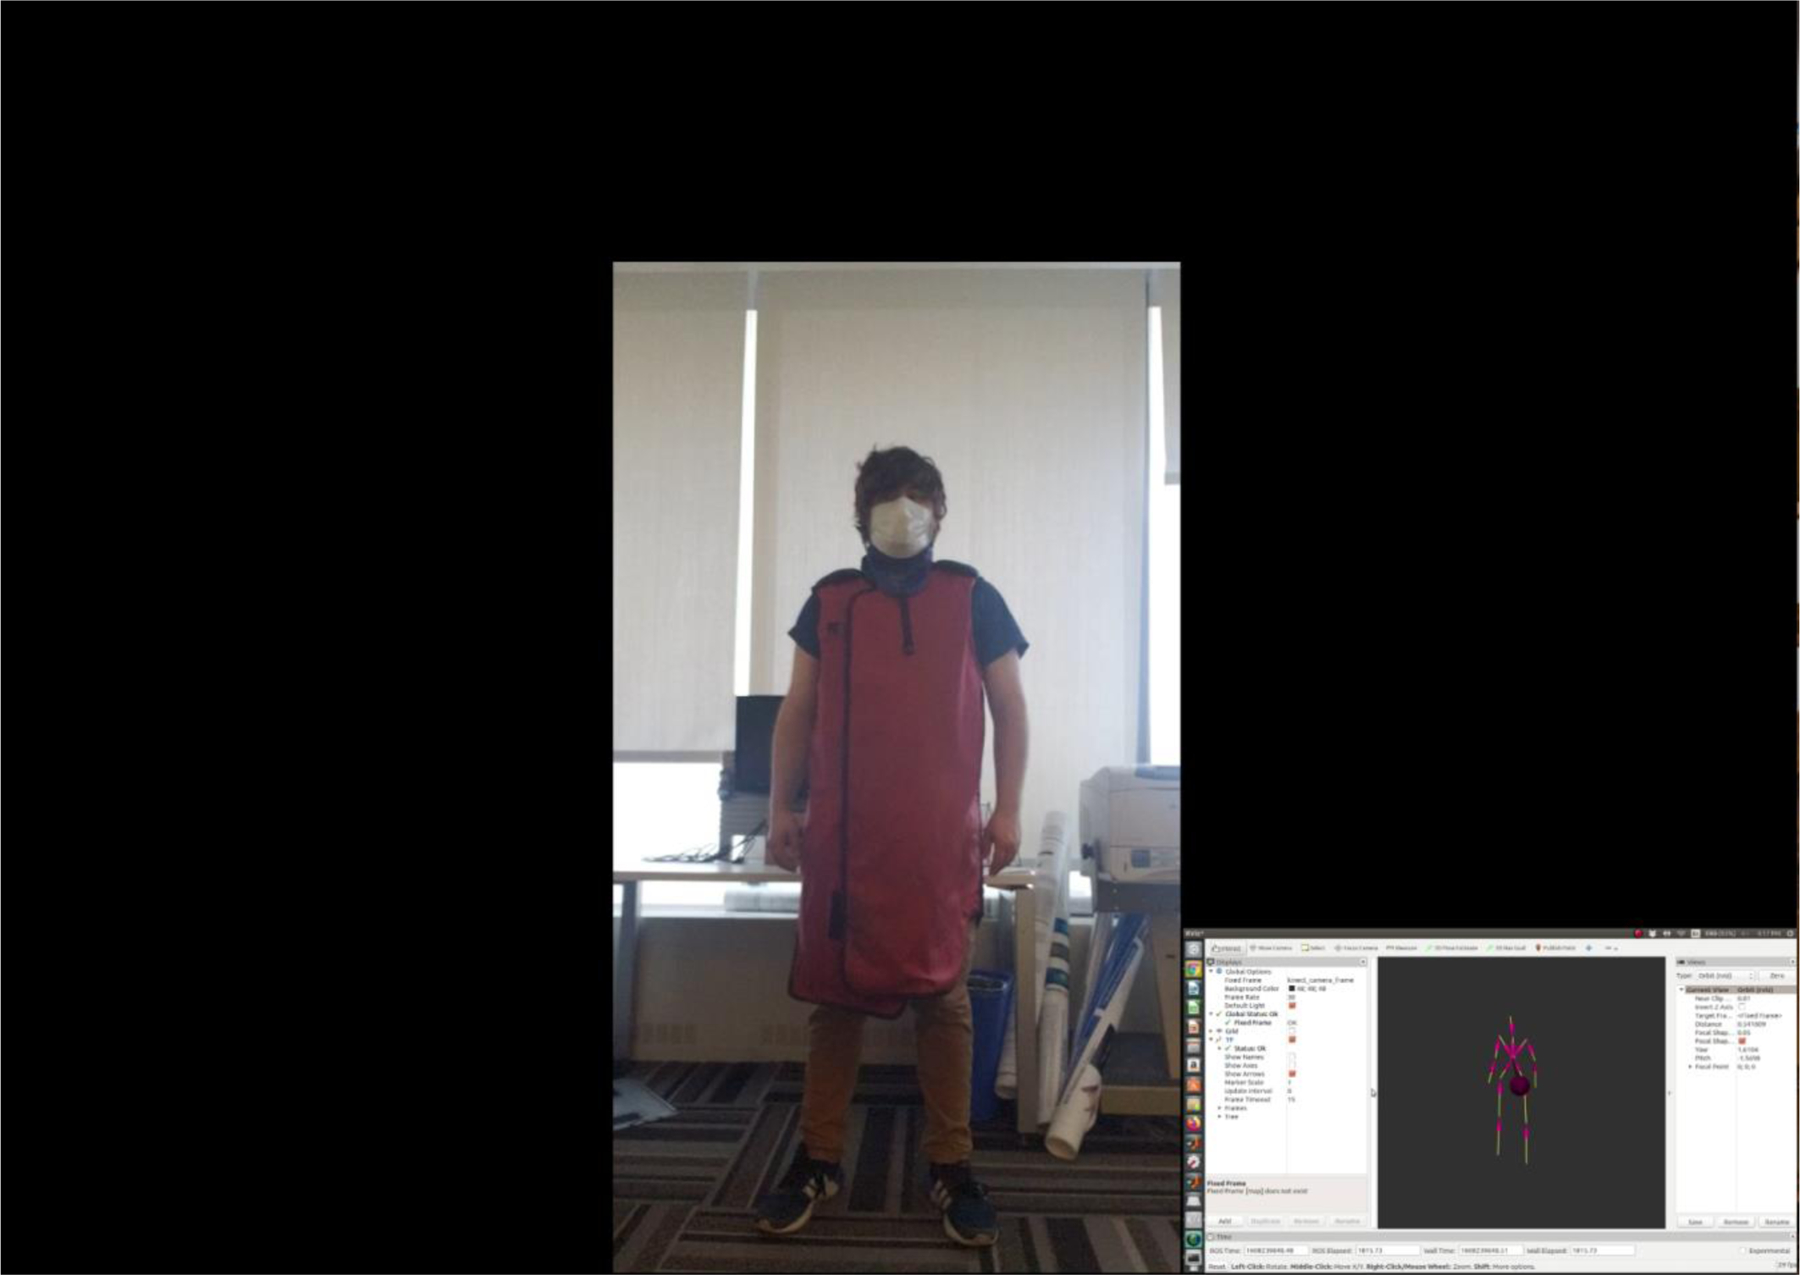
Given the level of ambiguity associated with determining waist position when an apron is introduced, additional error is involved when computing individualized dose; however, the waist position is not that well defined on an individual and some positional error should be acceptable. To evaluate this error, we utilized two lead-equivalent aprons, one being short (90 cm in length) and the other being long (111 cm in length). Figure 9 presents the two aprons used.
Fig. 9:
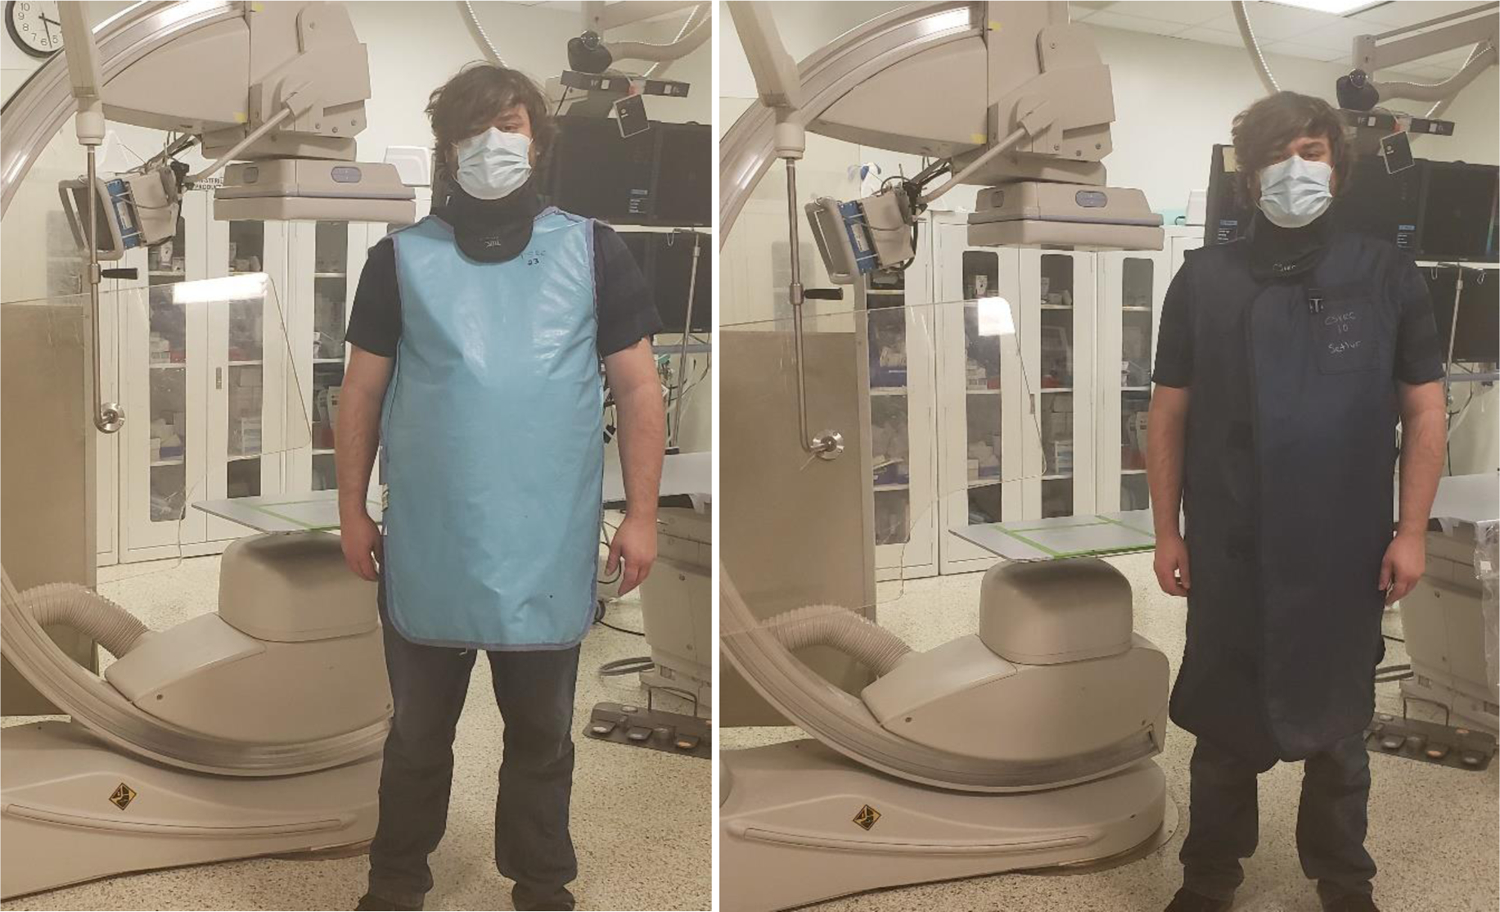
Imaged here are the two lead-equivalent aprons used for assessing body tracking error. (Left) short (90 cm) apron. (Right) long (111 cm) apron.
An individual whose height was 180 cm stood 152 cm (measured to the tip of the individual’s shoes) from a Kinect V2 camera’s front face while torso position measurements were acquired using a Robot Operating System (ROS) wrapper for body tracking. The torso is defined as one of the landmark features in the ROS wrapper for recognizing and tracking a body. More specifically, PrimeSense’s OpenNI 2 and NiTE 2 are employed within this wrapper to accomplish tracking. Body part labels used in similar algorithms directly localize well-defined features, such as skeletal joints, whereas other labels are utilized for filling in the gaps; the torso’s position is defined using 4 regions and the intersection of these regions then specifies the location used for tracking purposes.14 This location corresponds very closely to waist level, and, thus, we refer to “torso” using “waist” for the remainder of this manuscript.
A reference marker was placed on the ground to improve consistency in the individual’s placement and data acquisition. Three trials were conducted for gathering measurements where the individual didn’t wear an apron, the individual wore the short apron, and the individual wore the long apron; 50 measurements were acquired in each trial with the individual being “stationary” between measurements. Figure 10 shows the setup used for acquiring measurements. In Figure 11 are box plots of the results comparing waist position measurements with and without the inclusion of protective attire. In these plots we analyzed the components of a 3D position vector for the waist.
Fig. 10:
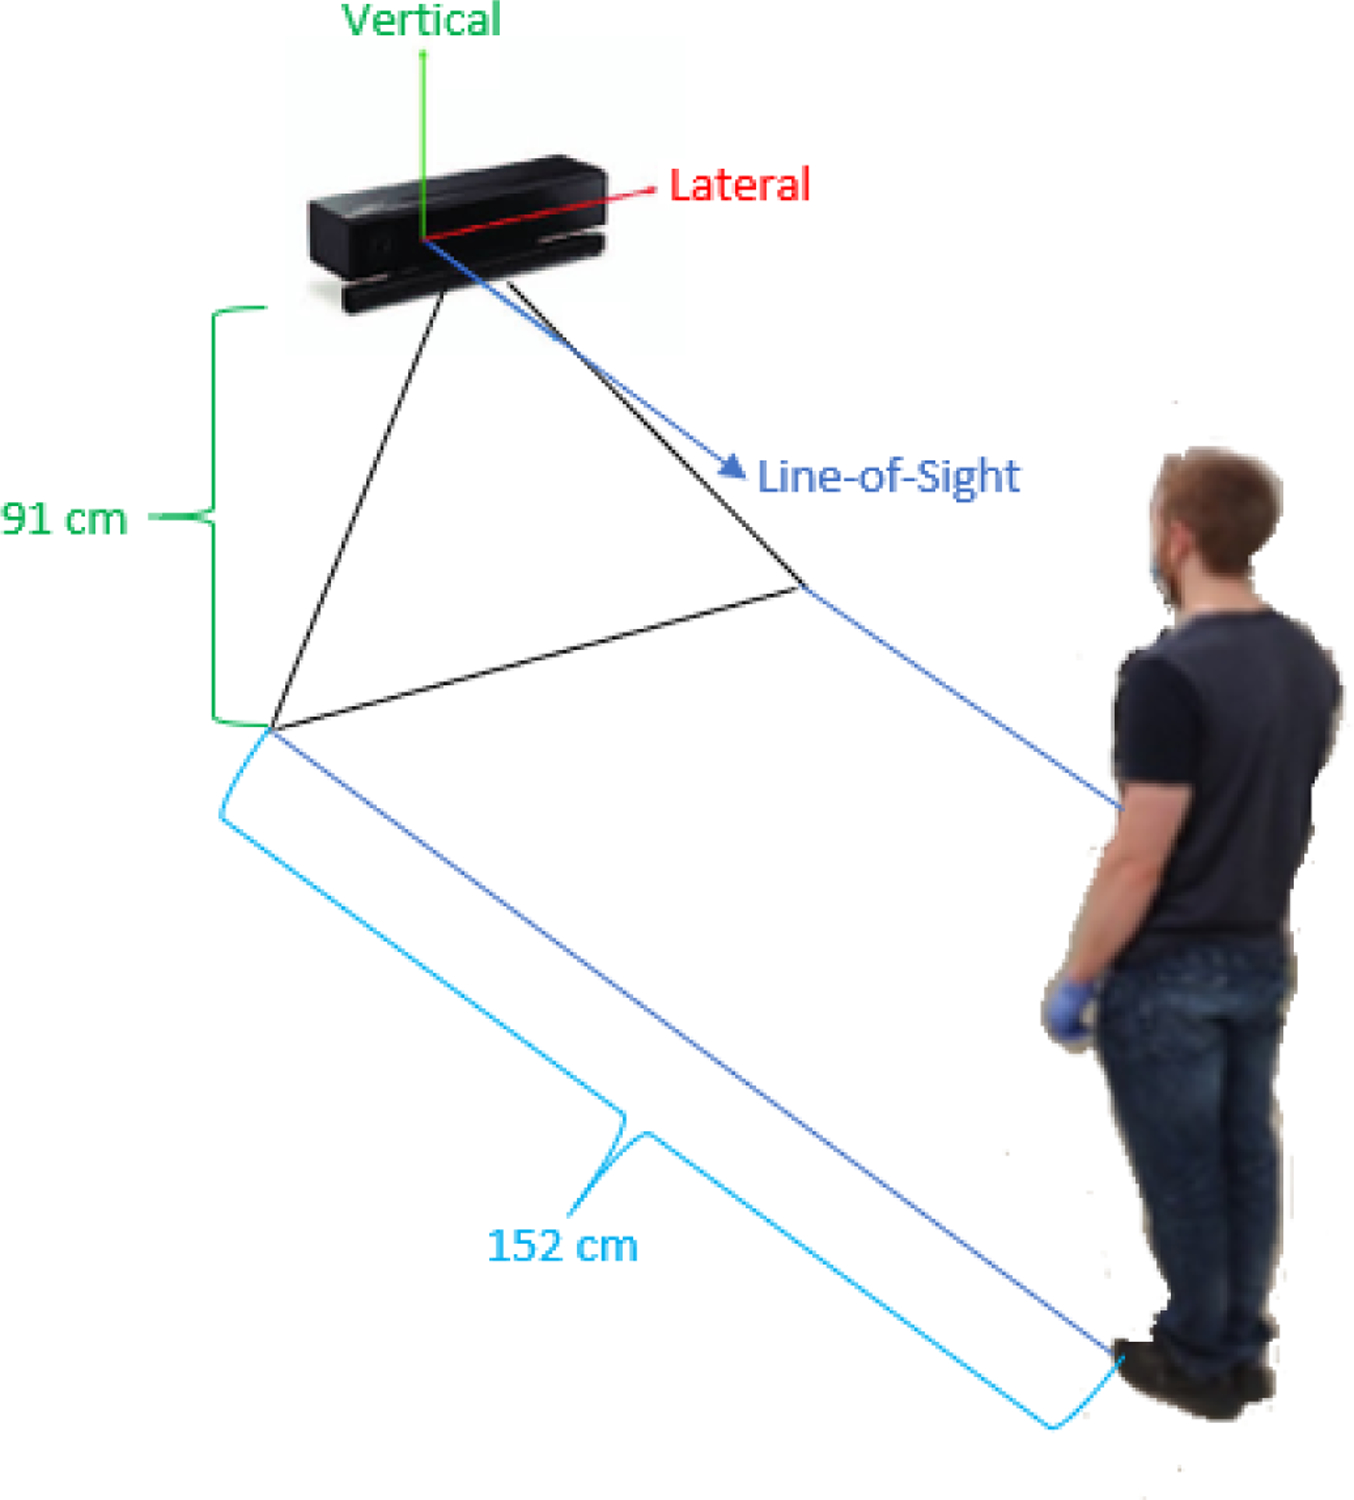
Imaged here is the set up used for obtaining waist position measurements. The Kinect V2 was situated at an elevated position, and the individual stood approximately 152 cm (measured to the tip of the individual’s shoes) from the camera’s front face using a reference marker on the ground to assist with consistent placement and acquisition.
Fig. 11:
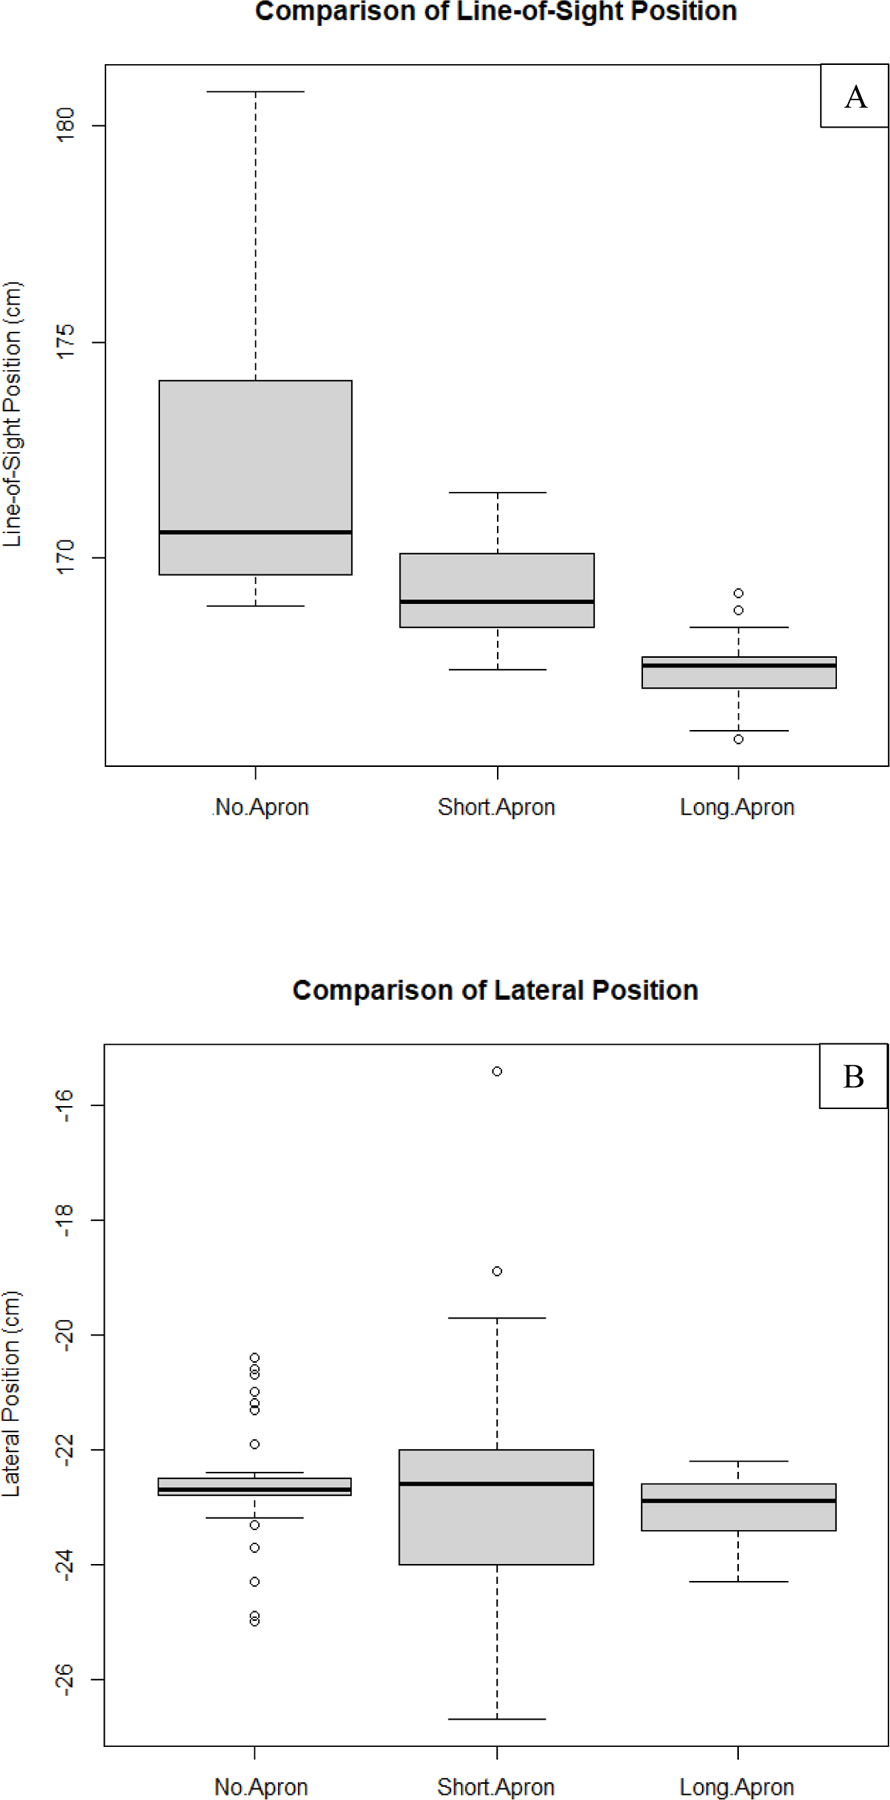
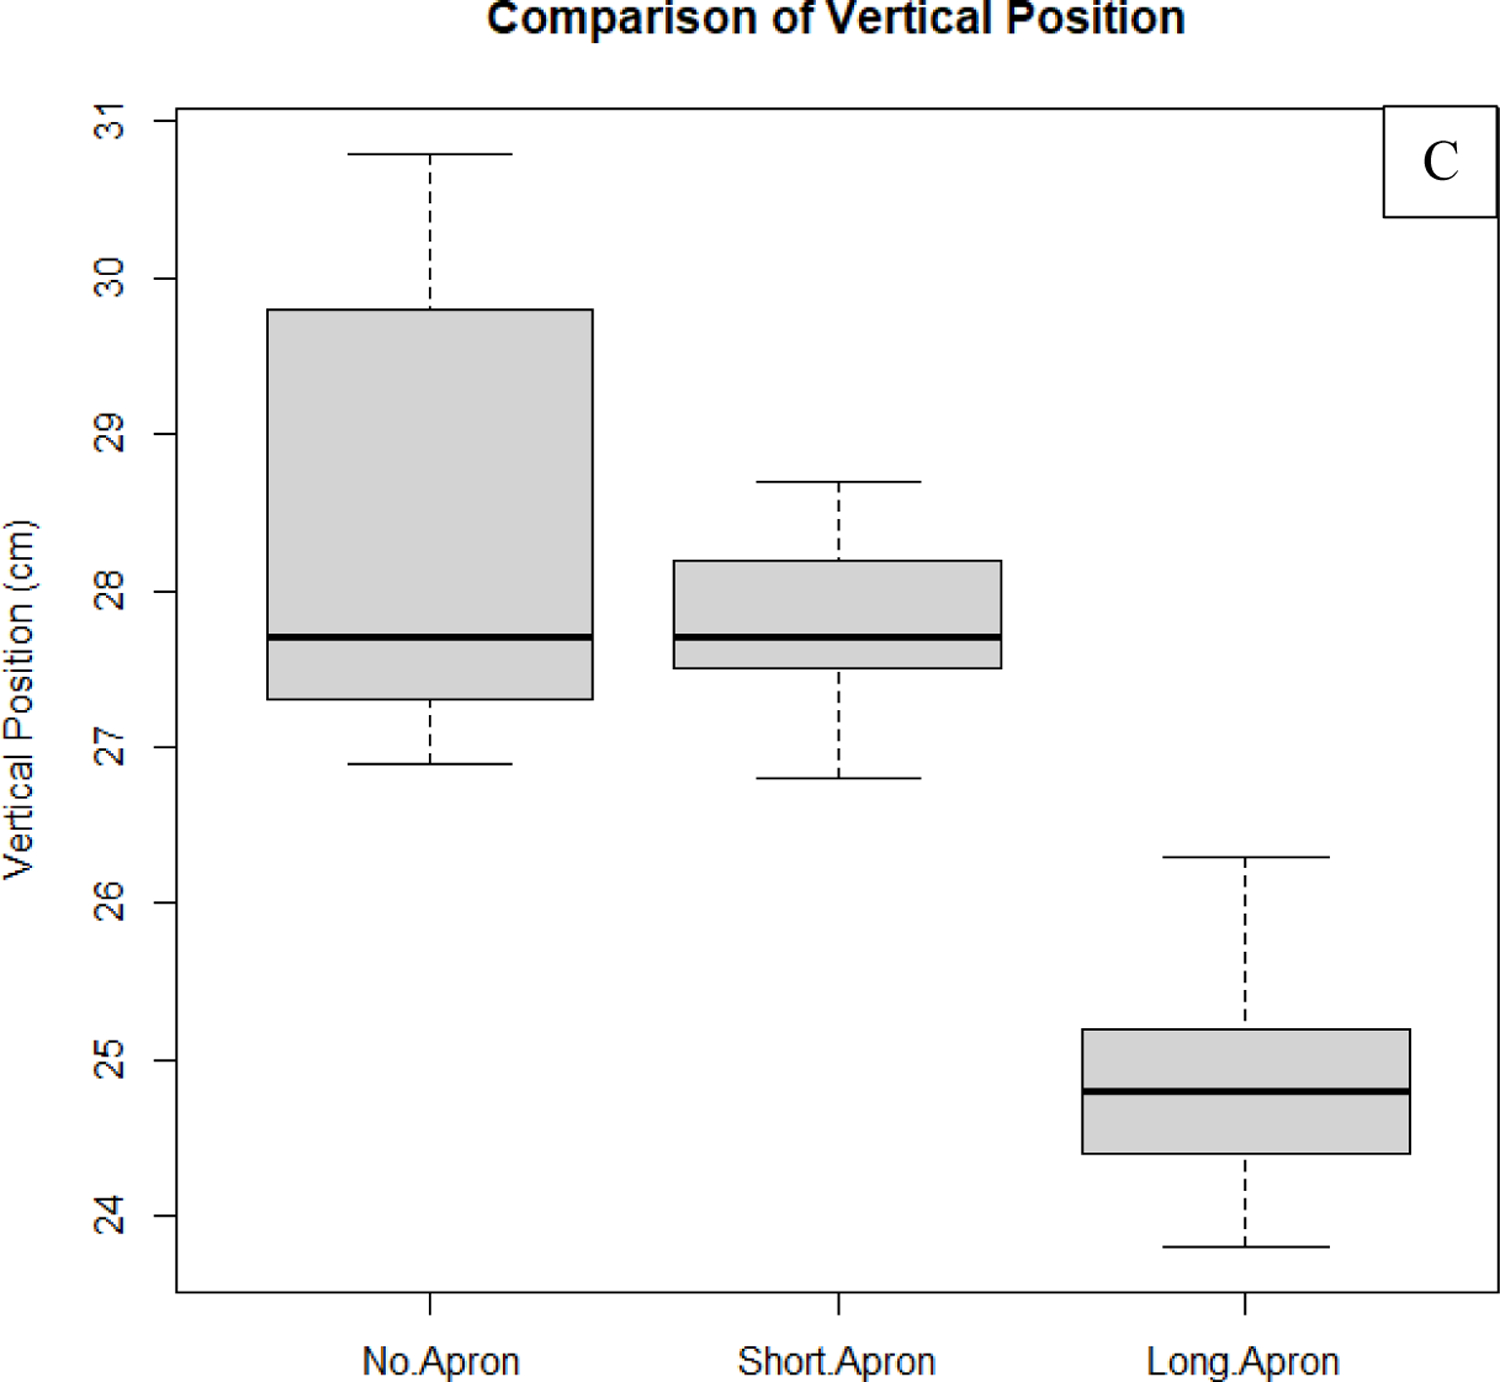
Shown in this figure are results comparing waist position measurements taken with the Kinect V2 depth camera as determined by the body tracking algorithm of the ROS wrapper. On the vertical axis are the values associated with one of the 3 position vector components as shown in Fig.10 (50 measurements belong to each of the datasets used in the comparisons). (A) Comparison of line-of-sight component of the waist’s position. (B) Comparison of the lateral component of the waist’s position. (C) Comparison of the vertical component of the waist’s position. As can be seen from these results, measurements taken while the individual was wearing the long apron deviate from the non-apron results more on average than the short apron for both the line-of-sight component and vertical component. The null hypothesis (results are equal with apron compared to without the apron) was rejected for all comparisons with P > 0.05 using a single-tail paired T-Test, except for the lateral component comparison between the long apron and no apron cases. Non-apron data is more sensitive to fluctuations due to breathing. Some of this motion is damped when the aprons are worn, generating smaller fluctuations. The trends in this analysis are expected, since, qualitatively, the aprons are observed to add ambiguity to the vertical position. Since the aprons add an additional barrier, we should also expect an under-approximation of the waist location along the line-of-sight of the camera as compared to when the use of aprons is neglected.
From these results we can gather that both the short apron and long apron provide additional error when tracking the waist; in almost all cases, the null hypothesis stating that the means are equal fails (P > 0.05) when comparing to the non-apron measurements. However, it can also be observed that the difference between means is the smallest for lateral position comparisons, as one would expect. The reason for this is because the apron adds an additional barrier which leads to under-approximations of the actual waist position along the camera’s line-of-sight. In addition, the length of the apron with respect to the height of the individual plays an important role, where the vertical position error may be less pronounced for taller individuals, or those who have longer trunks. It is also important to mention that, in some cases, the non-apron data appeared to be more sensitive to variations in waist position due to breathing and back-and-forth swaying (side-to-side swaying is less pronounced). Thus, while the precision of values may be lower than for the apron data, we can conclude that, on average, the short and long apron data are more susceptible to errors associated with statistically significant deviations from the non-apron data (underestimating the non-apron data for the individual tracked).
We can generate such a conclusion for two reasons. Firstly, the Kinect’s depth values are highly accurate when calibrated (~3% difference from the truth), with precision on the order of 1 mm.11 Many of the larger fluctuations fall within margin of error, although some of them are significantly detectable above electronic and quantum noise. We associate such movements with back-and-forth swaying or breathing since it is impossible for a person to remain perfectly stationary. This implies that the lower variances of values measured when the aprons were donned is indicative of higher error because they also imply a lower sensitivity when detecting motion. Since the aprons are not form fitting, it is intuitive that breathing and balance correction while attempting to remain stationary are less detectable. The waist’s position is being approximated to lie on the surface of each apron facing the camera. Given the non-body contour conforming fit of the aprons, it is clear that the front surface’s position will not perfectly mirror the actual waist’s position. This leads to the observed variance damping and higher error associated with comparing means, which leads into the second reason. Comparing means accounts for any outliers in the data. Differences in large-scale fluctuations can thus be accounted for as they would be in a clinical setting. This comparison yields an idea of the true differences in the datasets when natural variation is accounted for.
4. CONCLUSIONS
The training dataset consisted of both apron and non-apron data, while the four individuals were wearing facemasks. Thus, it is apparent from these preliminary results that our model is unaffected by the occlusion of landmark features due to typical PPE and radiological protective equipment. Still, there are a few caveats, which need to be discussed with regard to future promise.
Firstly, the testing data was acquired from intermediate rotations in the training set using a pseudo-random selection. That is, complex body movements (e.g. bending) may alter the appearance of features. If for any reason another object in the room occludes an individual’s body frame during such movement, there may be an increased failure rate. Additionally, only one apron was used for training, albeit a very large one. It is feasible that different aprons may alter predictability; however, the structure of our dataset with non-apron data and large apron data should be sufficient since we account for best and worst case scenarios with regard to body feature occlusion. It needs to be noted that the placement of the Kinect V2 camera on a ladder is not a perfect emulation of ceiling fixation. Due to added rotation of the camera, it is possible that body shape features may be less pronounced (consider the apparent distance between landmark features from the camera’s perspective). We plan to expand the testing set for future work to evaluate the network on more complex data. However, in the clinic there would be multiple cameras placed around the room. One method for alleviating this issue would be to generate weights for each camera chain and select the prediction with the highest weight. The logistics of such an approach are currently in development.
Secondly, the current work does not yet account for the effects of attenuation due to protective radiological equipment, such as the lead aprons, thyroid shields, and eyewear. We are working on the incorporation of equipment registration into the SDS as well as analyzing the impact on accuracy. Still, the focus of this work is to develop a method which will facilitate individualized dose reporting both during and after procedures. Without human recognition, there wouldn’t be an effective and pragmatic feedback for staff on-screen in the SDS. That is, the staff member position/dose indicators would only be labeled with the dose rate metric, but not with an identifier for reference. This means that it would otherwise be left up to the staff to keep track of their relative position.
It is apparent from our results that waist position accuracy is significantly affected when lead-equivalent aprons are introduced, although body tracking is maintained. More specifically, given the added barrier, lead aprons shift the point of measurement along the line-of-sight of the camera. This detail is particularly important if entrance air kerma is to be used as a surrogate dose metric. In the event that dose to tissue at waist level is computed, the exposure can be corrected by the lead apron attenuation, as mentioned previously. The more dramatic differences in vertical position are due to ambiguity since the apron is longer than the tracked individual’s trunk. This implies that additional dose error could be introduced, which is important to take caution of. While there is additional error, positions can be obtained within a reasonable accuracy, depending on the height of the individual; although, some uncertainty is acceptable since the waist line is not well defined.
While there are updates which need to be made to improve the quality of our work, our results give confidence that this method will reasonably lead to high-fidelity human recognition during procedures. This method generalizes quite readily, but more importantly could be adapted for clinical use during which multi-modal approaches (methods which combine multiple human recognition algorithms such as those for facial identification, pose detection, body shape identification, etc.) are not as practical. Our CNN model does not currently appear to be dependent on a large dataset (order of 10,000 images), however this would need to be tested on a large scale when there is a higher chance of multiple individuals with similar features in the same cohort. The integration of recognition into our body tracking algorithm will facilitate staff member specific scatter dose tracking. The 3D Monte Carlo distributions provide dose at various heights along the body contour, such as the eye lens, waist, and collar locations. The SDS report in addition to the real-time feedback in-room during a procedure will improve radiation awareness and safety during fluoroscopic interventional procedures.
Acknowledgments
This work was supported in part by Canon Medical Systems and NIH Grant No. 1R01EB030092. The Monte Carlo results were obtained using the resources of the Center for Computational Research (CCR) of the University at Buffalo.
Footnotes
Disclosure The authors receive research support from Canon (Toshiba) Medical Systems, Inc. The dose tracking system (DTS) software is licensed to Canon Medical Systems by the Office of Science, Technology Transfer and Economic Outreach of the University at Buffalo.
References
- 1.Mahesh M (2001, July 1). The AAPM/RSNA Physics Tutorial for Residents: Fluoroscopy: Patient Radiation Exposure Issues. Radiographics (vol. 21, num. 4). [DOI] [PubMed] [Google Scholar]
- 2.Bednarek DR, Barbarits J, Rana VK, Nagaraja SP, Josan MS, & Rudin S (2011, March). Verification of the performance accuracy of a real-time skin-dose tracking system for interventional fluoroscopic procedures. In Medical Imaging 2011: Physics of Medical Imaging (Vol. 7961, p. 796127). International Society for Optics and Photonics. [DOI] [PMC free article] [PubMed] [Google Scholar]
- 3.Rutler P (2019, February 26). Fluoroscopy Training, Credentialing, and Privileging. Retrieved from: https://www.imagewisely.org/Imaging-Modalities/Fluoroscopy/Training-Credentialing-and-Privileging
- 4.Sanchez RM, Vano E, Fernandez JM, Rosales F, Sotil J, Carrera F, … & Verdu JF (2012). Staff doses in interventional radiology: a national survey. J Vasc Interv Radiol, 2012 Nov; 23(11):1496–501 [DOI] [PubMed] [Google Scholar]
- 5.Rodas NL, & Padoy N (2015). Seeing is believing: increasing intraoperative awareness to scattered radiation in interventional procedures by combining augmented reality, Monte Carlo simulations and wireless dosimeters. International journal of computer assisted radiology and surgery, 10(8), 1181–1191 [DOI] [PubMed] [Google Scholar]
- 6.Guo Y, Mao L, Zhang G, Chen Z, Pei X, & Xu XG (2020). Conceptual Design and Preliminary Results of a VR-based Radiation Safety Training System for Interventional Radiologists. arXiv preprint arXiv:2001.04839 [DOI] [PubMed]
- 7.Bott OJ, Dresing K, Wagner M, Raab BW, & Teistler M (2011). Informatics in radiology: use of a C-arm fluoroscopy simulator to support training in intraoperative radiography. Radiographics, 31(3), E65–E75. [DOI] [PubMed] [Google Scholar]
- 8.Kilian-Meneghin J, Xiong Z, Guo C, Rudin S, & Bednarek DR (2018, March). Evaluation of methods of displaying the real-time scattered radiation distribution during fluoroscopically guided interventions for staff dose reduction. In Medical Imaging 2018: Physics of Medical Imaging (Vol. 10573, p. 1057366). International Society for Optics and Photonics. [DOI] [PMC free article] [PubMed] [Google Scholar]
- 9.Troville J, Kilian-Meneghin J, Guo C, Rudin S, & Bednarek DR (2019, March). Development of a real-time scattered radiation display for staff dose reduction during fluoroscopic interventional procedures. In Medical Imaging 2019: Physics of Medical Imaging (Vol. 10948, p. 109482H). International Society for Optics and Photonics. [Google Scholar]
- 10.Troville J, Guo C, Rudin S, & Bednarek DR (2020, March). Methods for object tracking and shadowing in a top-down view virtual reality scattered radiation display system (SDS) for fluoroscopically-guided procedures. In Medical Imaging 2020: Physics of Medical Imaging (Vol. 11312, p. 113123C). International Society for Optics and Photonics. [Google Scholar]
- 11.Troville J, Guo C, Rudin S, & Bednarek DR (2020, March). Considerations for accurate inclusion of staff member body tracking in a top-down view virtual reality display of a scattered radiation dose map during fluoroscopic interventional procedures. In Medical Imaging 2020: Physics of Medical Imaging (Vol. 11312, p. 113123D). International Society for Optics and Photonics. [Google Scholar]
- 12.Xu F, & Fujimura K (2003, July). Human detection using depth and gray images. In Proceedings of the IEEE Conference on Advanced Video and Signal Based Surveillance, 2003. (pp. 115–121). IEEE. [Google Scholar]
- 13.Troville J, Kilian-Meneghin J, Rudin S, & Bednarek DR Analysis of Microsoft Kinect V2 performance for interventional fluoroscopic procedure staff tracking. Medical Physics 45, 6, MO-I345-GePD-F1–1. [Google Scholar]
- 14.Shotton J, Fitzgibbon A, Cook M, Sharp T, Finocchio M, Moore R, … & Blake A (2011, June). Real-time human pose recognition in parts from single depth images. In CVPR 2011 (pp. 1297–1304). Ieee. [Google Scholar]