

Abstract
Objective
CNS damage can increase the susceptibility of the blood-brain barrier (BBB) to changes induced by systemic inflammation. The aim of this study is to better understand BBB permeability in patients with MS and to examine whether compromised BBB integrity in some of these patients is associated with CNS damage and systemic inflammation.
Methods
Routine CSF measurements of 121 patients with MS were analyzed including number and type of infiltrating cells, total protein, lactate, and oligoclonal bands, as well as intrathecal production of immunoglobulins and CSF/serum quotients for albumin, immunoglobulins, and glucose. In addition, in a subcohort of these patients, we performed ex vivo immunophenotyping of CSF-infiltrating and paired circulating lymphocytes using a panel of 13 monoclonal antibodies, we quantified intrathecal neurofilament light chain (NF-L) and chitinase 3-like 1 (CHI3L1), and we performed intrathecal lipidomic analysis.
Results
Patients with MS with abnormal high levels of albumin in the CSF showed a distinct CSF cell infiltrate and markers of CNS damage such as increased intrathecal levels of NF-L and CHI3L1 as well as a distinct CSF lipidomic profile. In addition, these patients showed higher numbers of circulating proinflammatory Th1 and Th1* cells compatible with systemic inflammation. Of interest, the abnormally high levels of albumin in the CSF of those patients were preserved over time.
Conclusions
Our results support the hypothesis that CNS damage may increase BBB vulnerability to systemic inflammation in a subset of patients and thus contribute to disease heterogeneity.
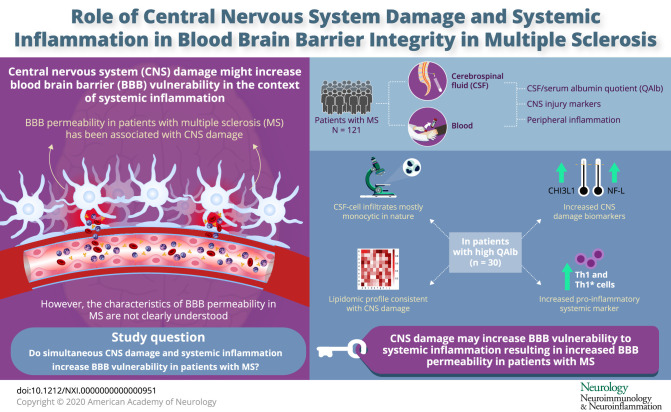
Systemic inflammation can influence blood-brain barrier (BBB) permeability and increase vesicular trafficking of albumin from serum to the CNS.1 In animal models of Alzheimer disease,2 ischemic stroke,3 and MS,4,5 it has been observed that the effect of systemic inflammation on BBB permeability was higher in animals with these CNS pathologies, suggesting that brain damage could increase the susceptibility of the BBB to changes induced by systemic inflammation. Consistent with these findings, a human study demonstrated a link between markers of systemic inflammation and markers of increased BBB permeability, in particular high CSF/serum albumin quotient (QAlb) in individuals with abnormal CSF measures but not in those without. Because abnormal CSF measures most likely reflect CNS alterations, these results support a role of CNS damage in increasing BBB susceptibility to systemic inflammation.6
MS is a heterogeneous immune-mediated neurologic disease that damages the CNS. This damage might increase the susceptibility of the BBB to changes induced by a systemic inflammation in some patients and contribute to MS heterogeneity. Supporting such an association between CNS damage and changes in BBB permeability, it has been observed that high QAlb and other CSF markers of compromised BBB integrity in patients with MS are accompanied by brain atrophy and faster increase in disability.7,8
To better understand BBB permeability in MS and its putative association with CNS damage and systemic inflammation, we performed a detailed characterization of CSF and paired blood samples that included immunophenotyping and lipidomics.
Methods
Patient Material
Paired CSF and blood samples were collected from 121 untreated patients with MS (20 patients with radiologically or clinically isolated syndrome, 91 with relapsing-remitting MS, and 10 with progressive MS), 40 controls with other noninflammatory neurologic diseases (ONIND), and 21 with other inflammatory neurologic diseases (OIND). All CSF samples were obtained for diagnostic purposes. Demographic and clinical characteristics are summarized in table 1. Patients were recruited from the Neuroimmunology and MS Research Section, Neurology Clinic, University Hospital Zurich. MS diagnosis was based on the revised McDonald criteria.9 Patients who had not received steroids at least 4 weeks before enrollment or any immunomodulatory or immunosuppressive agent during the last 3 months were considered untreated and included in the study. In particular, 97 patients were never treated, 16 patients were previously treated only with steroids, 4 patients received steroids and an immunomodulatory or immunosuppressive agent (1 patient, interferon [IFN] β-1a; 1 patient, glatiramer acetate; and 2 patients, dimethyl fumarate), and 4 patients received only an immunomodulatory or immunosuppressive agent (1 patient, IFNβ-1a; 2 patients, glatiramer acetate; and 1 patient, dimethyl fumarate).
Table 1.
Demographic and Clinical Features of Patients With MS and Controls

Standard Protocol Approvals, Registrations, and Patient Consents
The Cantonal Ethics Committee of Zurich approved the study procedures (EC-No. 2013-0001). Informed consent was obtained from all patients or relatives.
Routine CSF and Serum Measures
CSF-infiltrating cells were counted with a Fuchs Rosenthal counting chamber under the microscope within 1 hour after lumbar puncture. CSF total protein as well as CSF and serum albumin, immunoglobulin (Ig) G, IgM, and IgA were determined by immunonephelometry. Quotients (Q) were defined as Q = (concentration in CSF [mg/L]/concentration in serum [g/L]). Because QAlb increases with age, we calculated a maximum normal QAlb (QNorm) for each patient that takes into account the age at lumbar puncture (QNorm = [age/15] + 4 × 10⁻³).10 Intrathecal Ig synthesis (Ig(loc)) was calculated using hyperbolic functions according to Reiber and expressed as percentage (%).11 Identification of CSF-restricted oligoclonal bands was performed by isoelectric focusing.
HLA Typing
Patients were typed for human leukocyte antigen (HLA) class I (A* and B*) and II (DRB1*, DRB3*, DRB4*, DRB5*, DQA1* and DQB1*) molecules using high-resolution HLA sequence-based typing at Histogenetics LLC, Ossining, NY. Isolation of DNA from whole blood with a final concentration of 15 ng/μL was performed with a standard DNA isolation protocol using a Triton lysis buffer and proteinase K treatment.
Flow Cytometric Immunophenotyping
Flow cytometric immunophenotyping of CSF-infiltrating and paired circulating lymphocytes was performed as previously reported.12 Briefly, a minimum of 10,000 CSF-infiltrating cells were concentrated by centrifugation and processed in the first hour after collection. Blood circulating cells were obtained from 800 μL of peripheral blood after lysis of red blood cells (RBCs) using RBC Lysis buffer (BioLegend, San Diego, CA). Cells were stained with a cocktail of 13 monoclonal antibodies.12
SPHERO AccuCount Particles (Sperotech, Inc., Lake Forest, IL) were added to determine absolute counts following manufacturer's instructions. Sample acquisition was performed in an LSR Fortessa cytometer (BD Biosciences, Franklin Lakes, NJ), and data were analyzed using FACSDiva (BD) and FlowJO (TreeStar Inc., Ashland, OR) software. The gating strategy is summarized in figure e-1 (links.lww.com/NXI/A413).
Legend Plex and ELISAs
Cytokines directly in the CSF were measured using the Human T Helper Cytokine Panel LEGENDplex bead-based immunoassay (BioLegend) according to the manufacturer's instructions.
Intrathecal neurofilament light chain (NF-L) and chitinase 3-like 1 (CHI3L1) proteins were quantified in CSF samples by ELISA (Human Diagnostics, Umea, Sweden, and MicroVue, Athens, OH, respectively) according to the manufacturer's instructions.
Lipid Extraction and Lipidomics
Lipid extraction was performed as previously described13 with some modifications. The MMC solvent (methanol: methyl tert-butyl ether: chloroform, 4:3:3, vol:vol:vol) was supplemented with the SPLASH mix internal standard and additional internal standards (all from Avanti Polar Lipids): d7-sphinganine (SPH d18:0), d7-sphingosine (SPH d18:1), dihydroceramide (Cer d18:0/12:0), ceramide (Cer d18:1/12:0), glucosylceramide (GluCer d18:1/8:0), sphingomyelin (SM d18:1/12:0), and d7-sphingosine-1-phosphate (S1P d18:1). Liquid chromatography was performed according to Ref. 14 with some modifications. Lipids were separated using a C30 Accucore LC column (150 × 2.1 mm, 2.6 µm particle size) and a Transcend UHPLC pump (Thermo Fisher Scientific). Mass spectrometry analysis was performed on a hybrid quadrupole-orbitrap mass spectrometer (Q-Exactive; Thermo Fisher Scientific). Lipid identification criteria were (1) resolution with an accuracy of 5 ppm from the predicted mass at a resolving power of 70,000 at 200 m/z, (2) isotopic distribution, (3) expected retention time, and (4) fragmentation pattern.
Data analysis was performed using TraceFinder 4.1 (Thermo Fisher Scientific) for peak picking, annotation, and matching to an in-house lipid database.
Statistics
For comparison of 2 groups of patients, we used the unpaired t test for normally distributed variables and the U test (Mann-Whitney) for non-normally distributed variables. Linear correlation between variables was tested using Pearson for normally distributed and Spearman r for non-normally distributed variables. The significance level was set at p < 0.05.
Data Availability
Any data not published within the article because of space limitations will be shared as anonymized data by request from any qualified investigator for purposes of replicating procedures and results.
Results
Patients With MS With Increased QAlb
We determined the QAlb in our cohort of 121 patients with MS, and, assuming that this parameter increases with age, we marked a maximum QNorm for each patient as explained in M&M. We defined patients with increased QAlb as patients having a QAlb > QNorm. We used increased QAlb as indicator of BBB permeability although we are aware that it is not a perfect measurement because other factors such as altered CSF flow due to meningeal inflammation might influence it.15 Based on this definition of increased QAlb, 30 (24.8%) of patients with MS had an increased QAlb and 91 (75.2%) not (figure 1A). Demographic and clinical features of these patients are summarized in table 1. None of these parameters showed significant differences between patients with MS with and without increased QAlb. HLA typing of these patients demonstrated that the expression of the MS-associated DR15 haplotype was also comparable in both groups of patients (table 1). We did not find any HLA class I or class II molecule over- or under-represented in patients with increased QAlb (data not shown).
Figure 1. Characterization of CSF From Patients With MS With and Without Increased QAlb.

(A) Graph shows QAlb minus QNorm. Patients in which this difference is positive are showed in red and those in which is negative in black. Comparison between patients with and without increased QAlb of: (B) quotients and Igs(loc) expressed as percentage (%) for IgA, IgG, and IgM and (C) CSF-infiltrating cells (number of cells/μL) and frequency (%) of lymphocytes and monocytes analyzed under the microscope. (D) Correlation between number of CSF-infiltrating cells and IgG(loc) expressed as percentage (%). Graphs (A–D) represent the main cohort of 121 patients with MS. Each dot in the graphs corresponds to 1 patient, and bars show the mean. A t test for normally distributed variables and U test (Mann-Whitney) for non-normally distributed variables was used to compared patients. Linear correlation was tested using Pearson for normally distributed and Spearman r for non-normally distributed variables. Statistical significance (* p < 0.05, ** p < 0.01, and **** p < 0.0001) is shown. Ig = immunoglobulin; QAlb = serum albumin quotient; QNorm = normal QAlb.
CSF Measures in Patients With MS With Increased QAlb
IgA quotients were much higher in patients with MS with increased QAlb, IgG quotients were also significantly higher in these patients although to a lesser extent, and minimal differences were found for IgM quotients (figure 1B). In contrast, the indices for these 3 Igs corrected for albumin concentration (see M&M) were comparable in both groups of patients suggesting a strong association between the traffic of albumin and IgA and to a lesser extent IgG (table 1). Regarding the Igs(loc), only IgG(loc) was significantly lower in patients with increased QAlb (table 1 and figure 1B). Total CSF protein was significantly higher in patients with MS with increased QAlb, whereas serum albumin, intrathecal lactate, and glucose quotient were comparable in patients with and without increased QAlb (table 1).
CSF-Infiltrating Cells in Patients With MS With Increased QAlb
CSF analysis under the microscope showed comparable numbers of CSF-infiltrating cells in patients with and without increased QAlb, but different composition. CSF from patients with increased QAlb contains less lymphocytes but significantly more monocytes (figure 1C). This different cell composition of the CSF might underlie the lower correlation between IgG(loc) and number of CSF-infiltrating cells in patients with increased QAlb (figure 1D). Flow cytometry immunophenotyping of CSF and paired blood from a subcohort of 79 patients with MS (table 1, subcohort 1)12 allowed a detailed characterization of CSF-infiltrating and circulating lymphocytes (table e-1, links.lww.com/NXI/A413). Although most of the CSF-infiltrating cells in patients with and without increased QAlb showed similar frequencies, we found that CD4+ T cells with a Th2-A functional phenotype, based on the combination of chemokine receptors (CCR6− CCR4+ CRTh2−), and the following different maturation states: (1) CM and EM CD28+ CD27− CD4+ T cells, that have downregulated CD27 most likely following repetitive stimulation with antigen,16 (2) EM CD28−and (3) TEMRA CD28+ CD27+, were all significantly reduced in patients with increased QAlb (table e-1, figure e-2A, and figure 2A). Patients with MS with increased QAlb showed lower levels of these Th2 CD4+ T cells than patients without increased QAlb independently of disease activity and most likely clinical form of the disease (data not shown). Th2 cells are required for humoral immunity, and accordingly, we found a significant association between the frequencies of EM CD28+ CD27− CD4+ Th2-A cells and IgG(loc) (%) (figure 2B). Patients with increased QAlb also showed significantly higher frequencies of EM CD28− TH1 cells as well as significantly higher amounts of IFNγ in the CSF that correlated with QAlb (figure 2C). None of the other 12 cytokines showed differences between patients with and without increased QAlb (figure e-2B). The frequencies of these cell types in peripheral blood were comparable between patients with and without increased QAlb (table e-1 and figure e-2C).
Figure 2. Characterization of CSF-Infiltrating Cells and Markers of CNS Damage in Patients With MS With and Without Increased QAlb.

(A) Comparison between patients with and without increased QAlb of frequencies of Th2-A (CCR6- CCR4+ CRTH2−) in CM CD28+ CD27-, EM CD28+ CD27-, EM CD28-, and TEMRA CD28+ CD27+ CD4+ CSF-infiltrating T cells. (B) Comparison between patients with IgG(loc) (>10%) and without IgG(loc) (<10%) of frequencies of EM CD28+ CD27- CD4+ CSF-infiltrating cells with a Th2-A (CCR6- CCR4+ CRTH2−) functional phenotype. Correlation between these frequencies and IgG(loc) expressed as %. (C) Comparison between patients with and without increased QAlb of frequencies of Th1 (CCR6- CCR4- CRTH2−) cells in EM CD28- CD4+ CSF-infiltrating T cells and amount of IFNγ expressed as pg/mL present in the CSF of 30 patients as well as correlation between the amount of IFNγ and QAlb. (D) Comparison of NF-L and CHI3L1 intrathecal concentration between patients with and without increased QAlb. (E) Correlation between the intrathecal concentration of these 2 biomarkers and QAlb and also between themselves. Graphs (A–C) represent subcohort 1 of 79 patients with MS, and frequencies have been obtained by ex vivo immunophenotyping, and (E–D) represent the main cohort of 121 patients with MS. Each dot in the graphs corresponds to 1 patient, and bars show the mean. Patients with increased QAlb are shown in red. T test t test for normally distributed variables and U test (Mann-Whitney) for non-normally distributed variables was used to compared patients. Linear correlation was tested using Pearson for normally distributed and Spearman r for non-normally distributed variables. Statistical significance (*p < 0.05, **p < 0.01) is shown.
Markers of CNS Damage in Patients With MS With Increased QAlb
Because previous studies associated increased QAlb with higher disability in patients with MS,7,8 we explored indicators of CNS damage in our cohort of 121 patients with MS using 2 promising biomarkers: NF-L, a cytoskeletal component of neurons that is very abundant in axons,17 and it has been associated with BBB integrity,18 and CHI3L1, a glycoprotein secreted by activated glia.19 Our results demonstrated that the intrathecal quantity of both biomarkers was statistically higher in the CSF of patients with increased QAlb (figure 2D), and their amount correlated with QAlb and with each other as already reported20 (figure 2E). The higher amount of NF-L and CHI3L1 in patients with MS with increased QAlb does not seem to be related to disease activity or clinical form of the disease (data not shown), although the low number of patients with radiologically isolated syndrome/clinically isolated syndrome and progressive MS forms limits conclusions.
Next, we used liquid chromatography/mass spectrometry to analyze the lipidomic profile in a subcohort of 36 patients with MS (table 1, subcohort 2). Because the brain has the second highest lipid content after adipose tissue, lipids are the main components of myelin sheaths and changes in lipid metabolism have been observed in damaged cells, we used lipidomics to explore CNS damage. The total lipid content in CSF reflected about 0.1%–0.5% of the plasma levels. In total, we identified 510 different lipid species in CSF of which 105 passed the QC criteria (R2 >0.9 + CV <20%). The intrathecal concentrations of 10 species were significantly higher in the CSF of patients with increased QAlb (figure 3A). The majority of these species showed a significant correlation with QAlb, whereas the strongest association was seen for the phosphatidylcholines (PCs) PC (38:3) and PC (40:5) and the sphingomyelins (SMs) SM (d40:3), SM (d41:2), SM (d42:2), and SM (d42:3) (figure 3B). Comparing the lipid profile in the CSF from patients with MS with the plasma levels from an independent reference cohort (n = 32) showed a distinct CSF/plasma ratio for the individual species indicating that this increased in the intrathecal lipids was selective and not simply caused by diffusion from plasma (figure 3C).
Figure 3. Lipidomic Profile in Patients With MS With and Without Increased QAlb.

(A) Heat map of the 10 statistically most significant altered lipid species between patients with MS with and without increased QAlb. The abundance of the lipid species is qualitatively represented by color intensity for each of the 36 patients with MS (subcohort 2). Mean, SD, and p values of the group comparisons are shown. (B) Correlations between QAlb and the intrathecal concentration for 6 of the identified lipid species. Linear correlation between variables was tested using Pearson correlation, and p values are shown. (C) Ratios between mean CSF concentration of lipid species in patients with MS and the concentration in plasma from a reference control cohort with 24 healthy controls. Marked in red are the 4 SM and 5 PC species that were significantly more abundant in patients with MS with increased QAlb. Ig = immunoglobulin; QAlb = serum albumin quotient.
Peripheral Inflammation in Patients With MS With Increased QAlb
Because previous studies associated increased QAlb with systemic inflammation in patients with abnormal CSF measures,6 we quantified peripheral blood lymphocytes in MS subcohort 1 (table 1) using flow cytometry immunophenotyping and counting beads. Although the frequencies of the lymphocyte subtypes did not show significant differences between patients with and without increased QAlb, the real counts of several of these cells did (table e-1, links.lww.com/NXI/A413). Patients with increased QAlb had significantly higher counts of circulating CD3+ T cells, CD8+, and in particular CD4+ cells (table e-1). For each T-cell type, particularly CM and EM cells were increased (table e-1). Regarding the functional phenotype of these T cells, CM CD28+ CD8+ T cells and CM, EM, as well as TEMRA CD28+ CD27+ CD4+ T cells, all with Th1 (CCR6− CCR4− CRTh2−) and Th1* (CCR6+ CCR4− CRTh2−) functional phenotypes were significantly increased in the blood of patients with increased QAlb (figure 4). In addition, a statistically significant correlation between the number of these T-cell subtypes in blood and the QAlb was observed (figure 4).
Figure 4. Immunophenotyping of Peripheral Circulating Lymphocytes in Patients With MS With and Without Increased QAlb.

Comparison, between patients with (red) and without (black) increased QAlb, of number of CD8+ CM CD28+ Th1 (CCR6- CCR4- CRTH2-) and Th1* (CCR6+ CCR4- CRTH2-), CD4+ CM CD28+ CD27+ Th1 (CCR6- CCR4- CRTH2-) and Th1* (CCR6+ CCR4- CRTH2-), CD4+ EM CD28+ CD27+ Th1 (CCR6- CCR4- CRTH2-) and Th1* (CCR6+ CCR4- CRTH2-), and CD4+ TEMRA CD28+ Th1 (CCR6- CCR4- CRTH2-) and Th1* (CCR6+ CCR4- CRTH2-) in patients with and without increased QAlb, as well as the correlation between these cell counts and QAlb. All graphs represent subcohort 1 consisting of 79 patients with MS. Each dot in the graph corresponds to a single patient, and bars show the mean. T test t test for normally distributed variables and U test (Mann-Whitney) for non-normally distributed variables was used to compared patients. Linear correlation was tested using Pearson for normally distributed and Spearman r for non-normally distributed variables. Statistical significance (*p < 0.05, **p < 0.01, ***p < 0.001, and ****p < 0.0001) is shown. Statistical significance (*p < 0.05, **p < 0.01, ***p < 0.001, and ****p < 0.0001) is shown. QAlb = serum albumin quotient.
Disease activity and the clinical form of the disease does not seem to influence the higher frequency of these cells in patients with MS with increased QAlb (data not shown).
Increased Albumin Quotient Is Preserved Over Time
CSFs from 33 patients with MS were analyzed at different time points. All patients were untreated at the first time point. Eleven patients (33.3%) had increased QAlb at the first time point and 10 of these patients (83.3%) maintained increased QAlb over time, in 2 patients for even more than 40 months (figure 5A). Six of these patients received treatment between lumbar punctures (1 dimethyl fumarate, 3 fingolimod, and 2 natalizumab), whereas 4 patients remained untreated. The increased QAlb disappeared only in 1 patient after 58 months without treatment. Of the 22 patients without increased QAlb at the first time point, only 2 showed increased QAlb in subsequent analyses (figure 5A). Although some treatments can have an effect on BBB permeability and reduced QAlb values, our results suggest that in patients with increased QAlb the reduction to normal QAlb values is not easy and, if possible, it might take time.
Figure 5. QAlb Analysis Over Time.

(A and B) Linear representations of QAlb minus QNorm values (B) and number of CSF-infiltrating cells per μL (C) over time in a cohort of 33 patients with MS from which CSF samples at different time points were available. X-axis represents time in months, and Y-axis represents QAlb-QNorm and number of CSF-infiltrating cells per μL. The number of patients in each graph is indicated. The dotted line represents the limit for normal values (0 for QAlb-QNorm and 4 for number of CSF-infiltrating cells). Patients who maintain high levels over time are shown in red, those who maintain low levels in black, and those who change the levels in gray. Fine lines and circles correspond to untreated patients. Patients treated between lumbar punctures are shown with bold lines and squares (dimethyl fumarate), triangles (natalizumab), and diamonds (fingolimod). QAlb = serum albumin quotient; QNorm = normal QAlb.
We analyzed the number of CSF-infiltrating cells in the same samples. Fifteen patients (45.45%) had more than 4 CSF-infiltrating cells per μL at the first time point, but only 6 of these patients (40%) maintained elevated CSF cell counts over time and no patient for more than 20 months (figure 5B).
Regarding the 16 patients with low CSF cell counts at the first time point, only 2 patients showed increased numbers over time (figure 5B).
Increased QAlb in ONIND and OIND
Finally, we examined whether the differences in CSF-infiltrating and circulating lymphocytes between patients with MS with and without increased QAlb were also present in controls (table 1). Using the definition of increased QAlb as QAlb > QNorm, we identified 9 (22.5%) ONIND and 10 (47.6%) OIND patients with increased QAlb and 31 (77.5%) ONIND and 11 (52.4%) OIND patients without (figure 6, A and B). As observed in patients with MS, all controls with increased QAlb showed significantly higher intrathecal IgA and IgG (figure 6, A and B). The number of CSF-infiltrating cells was comparable between ONIND controls with and without increased QAlb, whereas it was significantly higher in OIND controls with increased QAlb (figure 6, A and B). The differences in CSF-infiltrating and peripheral blood lymphocytes that we observed in patients with MS with and without increased QAlb were not found in controls (figure 7, A and B).
Figure 6. Characterization of CSF-infiltrating Cells in Controls With and Without Increased QAlb.

(A and B) QAlb minus QNorm has been used like in patients with MS to differentiate controls with (in red) and without (in black) increased QAlb. Comparison between controls (ONIND [n = 40] (A) and OIND [n = 21] (B)) with and without increased QAlb of IgA and IgG quotient, CSF-infiltrating cells, and frequency of TH2-A (CCR6- CCR4+ CRTH2-) and TH2-B (CCR6- CCR4+ CRTH2+) in CD4+ CM CD28+ CD27- and in CD4+ EM CD28+ CD27- CSF-infiltrating cells. In all graphs, each dot corresponds to 1 patient, and bars show the mean. T test t test for normally distributed variables and U test (Mann-Whitney) for non-normally distributed variables was used to compared patients. Statistical significance (*p < 0.05, **p < 0.01, ***p < 0.001, and ****p < 0.0001) is shown. Statistical significance (*p < 0.05, **p < 0.01, and ****p < 0.0001) is shown. QAlb = serum albumin quotient; QNorm = normal QAlb.
Figure 7. Characterization of Peripheral Circulating Cells in Controls With and Without Increased QAlb.

(A and B) Comparison between controls (ONIND [n = 40] (A) and OIND (n = 21) (B)) with and without increased QAlb of number of: CD8+ CM CD28+ Th1 (CCR6- CCR4- CRTH2-) and Th1* (CCR6+ CCR4- CRTH2-), CD4+ CM CD28+ CD27+ Th1 (CCR6- CCR4- CRTH2-) and Th1* (CCR6+ CCR4- CRTH2-), CD4+ EM CD28+ CD27+ Th1 (CCR6- CCR4- CRTH2-) and Th1* (CCR6+ CCR4- CRTH2-), and CD4+ TEMRA CD28+ Th1 (CCR6- CCR4- CRTH2-) and Th1* (CCR6+ CCR4- CRTH2-) circulating cells. Cell counts have been determined using SPHEROTM AccuCount Particles. In all graphs, each dot corresponds to 1 patient, and bars show the mean. T test t test for normally distributed variables and U test (Mann-Whitney) for non-normally distributed variables was used to compared patients.
Discussion
Different studies2–6 have suggested that CNS damage may increase the susceptibility of the BBB to changes induced by systemic inflammation such as increased vesicular trafficking of albumin. MS is a complex immune-mediated disease that affects the CNS and BBB permeability.21 In some patients with MS, CNS damage and systemic inflammation may coexist and influence BBB function. With the aim to better understand BBB permeability in MS and to investigate a putative role of CNS damage and systemic inflammation on BBB dysfunction, we identified patients with MS with increased QAlb and characterized them in detail. The comparison of demographic and clinical features between patients with MS with and without increased QAlb did not reveal any statistically significant difference, although the limited clinical data did not allow a definitive statement. Unfortunately, neither longitudinal MRI data nor longitudinal disability measures were available from our cohort to confirm the previously reported association between increased QAlb and greater deterioration in patients with MS.7,8
However, the detailed analysis of CSF revealed interesting differences between patients with and without increased QAlb. Patients with MS with increased QAlb showed significantly higher intrathecal levels of IgA and IgG and to a lesser extent of IgM. Because the indices of IgA and IgG, in which the values are corrected for the traffic of albumin, were comparable between patients, our results suggest that the passage of IgA and IgG across the BBB is most likely associated with the passage of albumin. IgM with its pentameric nature, much larger size, and molecular weight may not use vesicular trafficking. Patients with MS with increased QAlb also showed reduced IgG(loc). Regarding the CSF infiltrate, although the number of infiltrating cells was comparable in patients with and without increased QAlb, the cellular composition was different. Patients with MS with increased QAlb contained significantly more monocytes.
Because monocytes are not involved in antibody production, the correlation between CSF-infiltrating cells and IgG(loc) was significantly lower in patients with increased QAlb. Of interest, mediators involved in BBB dysfunction such as reactive oxygens species22 and matrix metalloproteinase 923 are produced by monocytes. Our ex vivo immunophenotyping of CSF-infiltrating lymphocytes demonstrated that patients with MS with increased QAlb and reduced IgG(loc) also showed significantly lower frequencies of CD4+ T cells with a Th2 functional phenotype. In particular, the following CD4+ T cell subsets: CM and EM CD28+ CD27− CD4+ T cells, which may be relevant due to their downregulation of CD27 after repetitive stimulation with antigen,16 EM CD28− and TEMRA CD28+ CD27+ CD4+ T cells. Th2 cells are relevant for humoral immunity, and accordingly, we demonstrated an association between these cells and intrathecal IgG synthesis. Th2 cells, in addition to their role in humoral immunity, may also have a protective anti-inflammatory role as has been assumed in some MS clinical trials aimed to deviate immune responses from Th1 toward Th2.24 Their reduction in patients with MS with increased QAlb might thus have harmful consequences. We also found that EM CD28− CD4+ T cells with a Th1 functional phenotype were significantly higher in patients with increased QAlb as well as the amount of IFNγ in the CSF. Long-term memory CD4+ CD28− T cells can produce high amounts of IFNγ in the absence of costimulation and showed increased survival and proliferation capacity after activation.25 Their putative role in MS is supported by their expansion in a subgroup of patients with MS and their myelin basic protein specificity.26 Immunophenotyping of paired blood samples did not show the same differences that have been observed between patients by CSF analyses. It is therefore unlikely that mere bystander traffic is responsible for the changes in the CSF. The higher concentration of IgG and IgA observed in patients with MS with increased QAlb, as well as the higher frequency of monocytes, the higher amount of IFNg and the lower frequency of potentially protective Th2 CD4+ T cells might facilitate CNS damage in these patients. Accordingly, our results demonstrate that patients with MS with increased QAlb show significantly higher levels of biomarkers of CNS damage and inflammation such as NF-L and CHI3L1 and support previous studies, in which increased QAlb in patients with MS was found to be associated with atrophy and greater deterioration7,8 as well as higher levels of serum NF-L.18 In addition, we identified 10 intrathecal lipid species that are more abundant in patients with MS with increased QAlb.
Although we do not know the underlying mechanisms, the increase of these lipids may be involved in CNS damage. Two of the 4 identified SM species contained a Sphingadienine (SAdienine) long chain base, which is formed as a downstream product of sphingosine via fatty acid desaturase 3 (FADS3).27 The increase in SAdienine-based SM suggests a possible role of FADS3 in this process. Of interest, a previous study linked changes in the same SAdienine-based SM species to an increased activity of acid sphingomyelinase, which converts SM to ceramide.28 The activation of the acid sphingomyelinase/ceramide system has been demonstrated to be a central step for the development of EAE.29
Regarding a putative association between systemic inflammation and BBB permeability in patients with MS, our results demonstrate that several lymphocyte populations, in particular T cells with a Th1 and Th1* functional phenotype, were significantly more abundant in patients with MS with increased QAlb and cell counts correlated with QAlb. Of interest, this association was not observed in controls patients with ONIND and OIND diseases, suggesting that the type of systemic inflammation that might influence BBB permeability most likely differs between pathologies. Unfortunately, the usual and easy-to-determine markers of systemic inflammation such as C-reactive protein or neutrophil counts were not available from the blood taken at the time of lumbar puncture.
The coexistence of markers of CNS damage and systemic inflammation in patients with MS with increased QAlb supports a putative role of CNS damage in increasing BBB vulnerability to systemic inflammation in these patients. Because the capacity of remyelination is limited and neuroregenerative treatments are missing, we can assume that CNS damage might persist over time. Accordingly, increased QAlb in patients with MS was also preserved over time even after initiating immunomodulatory treatments. It will be interesting to see in the future if treatments or treatment combinations with neuroregenerative potential have an effect on QAlb. Finally, given that CNS damage and systemic inflammation vary among patients with MS and influence BBB permeability, also it will be of interest to examine their impact on MS heterogeneity and its value in patient classification. Patients with increased QAlb might especially profit from a better control of systemic inflammation as well as from neuroprotective/neuroregenerating treatment approaches.
Glossary
- BBB
blood-brain barrier
- CHI3L1
chitinase 3-like 1
- FADS3
fatty acid desaturase 3
- HLA
human leukocyte antigen
- IFN
interferon
- Ig
immunoglobulin
- NF-L
neurofilament light chain
- OIND
other inflammatory neurologic diseases
- ONIND
other noninflammatory neurologic diseases
- PC
phosphatidylcholine
- QAlb
serum albumin quotient
- QNorm
normal QAlb
- RBC
red blood cell
- SAdienine
sphingadienine
- SM
sphingomyelin
Appendix. Authors
Contributor Information
Marco Puthenparampil, Email: marco_puthen@hotmail.it.
Paula Tomas-Ojer, Email: paulatomasojer@gmail.com.
Thorsten Hornemann, Email: thorsten.hornemann@usz.ch.
Andreas Lutterotti, Email: andreas.lutterotti@usz.ch.
Ilijas Jelcic, Email: ilijas.jelcic@usz.ch.
Mario Ziegler, Email: mario.ziegler@usz.ch.
Carolina Cruciani, Email: carolina.cruciani@usz.ch.
Wolfgang Faigle, Email: wolfgang.faigle@usz.ch.
Roland Martin, Email: roland.martin@usz.ch.
Study Funding
European Research Council Advanced Grant (340733) (R.M.), Clinical Research Priority Program MS (CRPPMS) and (CRPP) PrecisionMS of the University Zurich (R.M., M.S., and A.L.), Clinical, Swiss National Science Foundation (Sinergia UnmetMS) (R.M. and M.S.), and the Swiss MS Society (R.M.).
Disclosure
The authors declare that they have no competing financial interests in the context of this work. Go to Neurology.org/NN for full disclosures.
References
- 1.Varatharaj A, Galea I. The blood-brain barrier in systemic inflammation. Brain Behav Immun 2017;60:1–12. [DOI] [PubMed] [Google Scholar]
- 2.Takeda S, Sato N, Ikimura K, Nishino H, Rakugi H, Morishita R. Increased blood-brain barrier vulnerability to systemic inflammation in an Alzheimer disease mouse model. Neurobiol Aging 2013;34:2064–2070. [DOI] [PubMed] [Google Scholar]
- 3.Denes A, Ferenczi S, Kovacs KJ. Systemic inflammatory challenges compromise survival after experimental stroke via augmenting brain inflammation, blood- brain barrier damage and brain oedema independently of infarct size. J Neuroinflammation 2011;8:164. [DOI] [PMC free article] [PubMed] [Google Scholar]
- 4.Serres S, Anthony DC, Jiang Y, et al. Systemic inflammatory response reactivates immune-mediated lesions in rat brain. J Neurosci 2009;29:4820–4828. [DOI] [PMC free article] [PubMed] [Google Scholar]
- 5.Lopez-Ramirez MA, Wu D, Pryce G, et al. MicroRNA-155 negatively affects blood-brain barrier function during neuroinflammation. FASEB J 2014;28:2551–2565. [DOI] [PubMed] [Google Scholar]
- 6.Elwood E, Lim Z, Naveed H, Galea I. The effect of systemic inflammation on human brain barrier function. Brain Behav Immun 2017;62:35–40. [DOI] [PMC free article] [PubMed] [Google Scholar]
- 7.Uher T, Horakova D, Tyblova M, et al. Increased albumin quotient (QAlb) in patients after first clinical event suggestive of multiple sclerosis is associated with development of brain atrophy and greater disability 48 months later. Mult Scler 2016;22:770–781. [DOI] [PubMed] [Google Scholar]
- 8.Kroth J, Ciolac D, Fleischer V, et al. Increased cerebrospinal fluid albumin and immunoglobulin A fractions forecast cortical atrophy and longitudinal functional deterioration in relapsing-remitting multiple sclerosis. Mult Scler 2019;25:338–343. [DOI] [PubMed] [Google Scholar]
- 9.Polman CH, Reingold SC, Banwell B, et al. Diagnostic criteria for multiple sclerosis: 2010 revisions to the McDonald criteria. Ann Neurol 2011;69:292–302. [DOI] [PMC free article] [PubMed] [Google Scholar]
- 10.Reiber H, Peter JB. Cerebrospinal fluid analysis: disease-related data patterns and evaluation programs. J Neurol Sci 2001;184:101–122. [DOI] [PubMed] [Google Scholar]
- 11.Reiber H, Teut M, Pohl D, Rostasy KM, Hanefeld F. Paediatric and adult multiple sclerosis: age- related differences and time course of the neuroimmunological response in cerebrospinal fluid. Mult Scler 2009;15:1466–1480. [DOI] [PubMed] [Google Scholar]
- 12.Brodie T, Rothaeusler K, Sospedra M. OMIP-033: a comprehensive single step staining protocol for human T- and B-cell subsets. Cytometry A 2016;89:629–632. [DOI] [PubMed] [Google Scholar]
- 13.Pellegrino RM, Di Veroli A, Valeri A, Goracci L, Cruciani G. LC/MS lipid profiling from human serum: a new method for global lipid extraction. Anal Bioanal Chem 2014;406:7937–7948. [DOI] [PubMed] [Google Scholar]
- 14.Narvaez-Rivas M, Zhang Q. Comprehensive untargeted lipidomic analysis using core-shell C30 particle column and high field orbitrap mass spectrometer. J Chromatogr A 2016;1440:123–134. [DOI] [PMC free article] [PubMed] [Google Scholar]
- 15.Reiber H. Proteins in cerebrospinal fluid and blood: barriers, CSF flow rate and source-related dynamics. Restor Neurol Neurosci 2003;21:79–96. [PubMed] [Google Scholar]
- 16.Watts TH. TNF/TNFR family members in costimulation of T cell responses. Annu Rev Immunol 2005;23:23–68. [DOI] [PubMed] [Google Scholar]
- 17.Bergman J, Dring A, Zetterberg H, et al. Neurofilament light in CSF and serum is a sensitive marker for axonal white matter injury in MS. Neurol Neuroimmunol Neuroinflamm 2016;3:e271. [DOI] [PMC free article] [PubMed] [Google Scholar]
- 18.Uher T, McComb M, Galkin S, et al. Neurofilament levels are associated with blood-brain barrier integrity, lymphocyte extravasation, and risk factors following the first demyelinating event in multiple sclerosis. Mult Scler 2020:1352458520912379. [DOI] [PubMed] [Google Scholar]
- 19.Bonneh-Barkay D, Bissel SJ, Kofler J, Starkey A, Wang G, Wiley CA. Astrocyte and macrophage regulation of YKL-40 expression and cellular response in neuroinflammation. Brain Pathol 2012;22:530–546. [DOI] [PMC free article] [PubMed] [Google Scholar]
- 20.Gil-Perotin S, Castillo-Villalba J, Cubas-Nunez L, et al. Combined cerebrospinal fluid neurofilament light chain protein and chitinase-3 like-1 levels in defining disease course and prognosis in multiple sclerosis. Front Neurol 2019;10:1008. [DOI] [PMC free article] [PubMed] [Google Scholar]
- 21.Sospedra M, Martin R. Immunology of multiple sclerosis. Annu Rev Immunol 2005;23:683–747. [DOI] [PubMed] [Google Scholar]
- 22.Haorah J, Ramirez SH, Schall K, Smith D, Pandya R, Persidsky Y. Oxidative stress activates protein tyrosine kinase and matrix metalloproteinases leading to blood-brain barrier dysfunction. J Neurochem 2007;101:566–576. [DOI] [PubMed] [Google Scholar]
- 23.Turner RJ, Sharp FR. Implications of MMP9 for blood brain barrier disruption and hemorrhagic transformation following ischemic stroke. Front Cell Neurosci 2016;10:56. [DOI] [PMC free article] [PubMed] [Google Scholar]
- 24.Oreja-Guevara C, Ramos-Cejudo J, Aroeira LS, Chamorro B, Diez-Tejedor E. TH1/TH2 cytokine profile in relapsing-remitting multiple sclerosis patients treated with glatiramer acetate or natalizumab. BMC Neurol 2012;12:95. [DOI] [PMC free article] [PubMed] [Google Scholar]
- 25.Bluestone JA. New perspectives of CD28-B7-mediated T cell costimulation. Immunity 1995;2:555–559. [DOI] [PubMed] [Google Scholar]
- 26.Markovic-Plese S, Cortese I, Wandinger KP, McFarland HF, Martin R. CD4+CD28- costimulation- independent T cells in multiple sclerosis. J Clin Invest 2001;108:1185–1194. [DOI] [PMC free article] [PubMed] [Google Scholar]
- 27.Karsai G, Lone M, Kutalik Z, et al. FADS3 is a delta14z sphingoid base desaturase that contributes to gender differences in the human plasma sphingolipidome. J Biol Chem 2020;295:1889–1897. [DOI] [PMC free article] [PubMed] [Google Scholar]
- 28.Pieragostino D, Cicalini I, Lanuti P, et al. Enhanced release of acid sphingomyelinase-enriched exosomes generates a lipidomics signature in CSF of Multiple Sclerosis patients. Sci Rep 2018;8:3071. [DOI] [PMC free article] [PubMed] [Google Scholar]
- 29.Becker KA, Halmer R, Davies L, et al. Blockade of experimental multiple sclerosis by inhibition of the acid sphingomyelinase/ceramide system. Neurosignals 2017;25:88–97. [DOI] [PubMed] [Google Scholar]
Associated Data
This section collects any data citations, data availability statements, or supplementary materials included in this article.
Data Availability Statement
Any data not published within the article because of space limitations will be shared as anonymized data by request from any qualified investigator for purposes of replicating procedures and results.