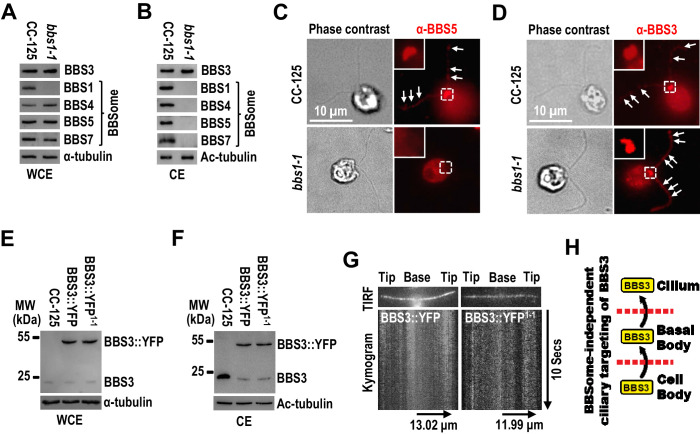
Figure 2. BBS3 enters cilia without relying on the BBSome.
(A and B) Immunoblots of whole-cell extracts (WCE) (A) and ciliary extracts (CE) (B) of CC-125 and bbs1-1 cells probed for BBS3 and the BBSome subunits BBS1, BBS4, BBS5, and BBS7. (C and D) CC-125 and bbs1-1 cells stained with α-BBS5 (red) (C) and α-BBS3 (red) (D). The corresponding phase contrast images are present. Inset shows the basal bodies. White arrows show ciliary staining. Scale bar 10 µm. (E and F) Immunoblots of WCE (E) and CE (F) of CC-125, BBS3::YFP (BBS3::YFP-expressing CC-125 cells), and BBS3::YFP1-1 (BBS3::YFP-expressing bbs1-1 cells) cells probed with α-BBS3. (G) Total internal reflection fluorescence images and corresponding kymograms of BBS3::YFP and BBS3::YFP1-1 cells (Figure 2—videos 1 and 2, 15 fps). The time and transport lengths are indicated on the right and on the bottom, respectively. (H) Schematic presentation showing that BBS3 can traffic from the cell body to the basal body for entering cilia in a BBSome-independent manner. For panels A, B, E, and F, α-tubulin and Ac-tubulin were used to adjust the loading of WCE and CE, respectively.
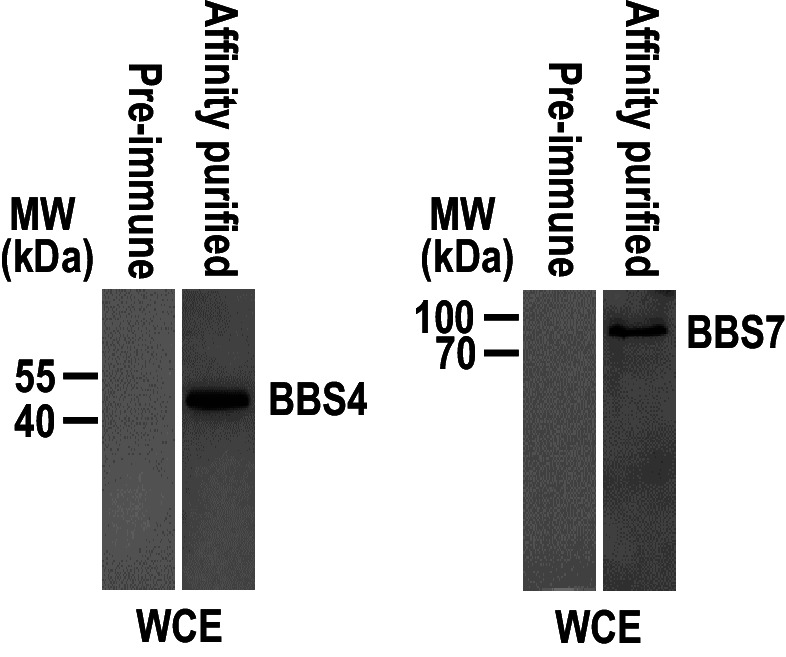
Figure 2—figure supplement 1. Affinity-purified polyclonal antisera against BBS4 and BBS7 can recognize their target proteins specifically.


