Abstract
BACKGROUND AND PURPOSE:
The double inversion recovery sequence is known to be very sensitive and specific for MS-related lesions. Our aim was to compare the sensitivity of pre- and postcontrast images of 3D double inversion recovery and conventional 3D T1-weighted images for the detection of contrast-enhancing MS-related lesions in the brain to analyze whether double inversion recovery could be as effective as T1WI.
MATERIALS AND METHODS:
A postcontrast 3D double inversion recovery sequence was acquired in addition to the standard MR imaging protocol at 3T, including pre- and postcontrast 3D T1WI sequences as well as precontrast double inversion recovery of 45 consecutive patients with MS or clinically isolated syndrome between June and December 2013. Two neuroradiologists independently assessed precontrast, postcontrast, and subtraction images of double inversion recovery as well as T1WI to count the number of contrast-enhancing lesions. Afterward, a consensus reading was performed. Lin concordance was calculated between both radiologists, and differences in lesion detectability were assessed with the Student t test. Additionally, the contrast-to-noise ratio was calculated.
RESULTS:
Significantly more contrast-enhancing lesions could be detected with double inversion recovery compared with T1WI (16%, 214 versus 185, P = .007). The concordance between both radiologists was almost perfect (ρc = 0.94 for T1WI and ρc = 0.98 for double inversion recovery, respectively). The contrast-to-noise ratio was significantly higher in double inversion recovery subtraction images compared with T1-weighted subtraction images (double inversion recovery, 14.3 ± 5.5; T1WI, 6.3 ± 7.1; P < .001).
CONCLUSIONS:
Pre- and postcontrast double inversion recovery enables better detection of contrast-enhancing lesions in MS in the brain compared with T1WI and may be considered an alternative to the standard MR imaging protocol.
Since the introduction of the double inversion recovery (DIR) sequence in 1994 by Redpath and Smith,1,2 many studies have investigated the usefulness of DIR for the detection of inflammatory lesions in the brain in multiple sclerosis. In this sequence, the signals from both the CSF and normal white matter are suppressed simultaneously; thus, differentiation between gray matter and white matter is facilitated. Additionally, inflammatory lesions remain unsuppressed and appear hyperintense. The studies concluded that DIR is very sensitive and specific for MS lesions in the brain,3–5 especially for intracortical lesions.6–8 One group could also show that DIR provides the highest sensitivity in the detection of MS lesions in the infratentorial region compared with FLAIR and T2WI.4 A similar benefit was found for an adapted DIR sequence in the spinal cord.9 Due to the high sensitivity and specificity as well as the increasing availability of the DIR sequence, it is more often included in routine MR imaging protocols.
The standard MR imaging protocol for the examination of patients with MS commonly includes the intravenous administration of gadolinium-based contrast agents (GBCAs). The presence of contrast-enhancing lesions is important for the diagnosis and therapeutic strategies of MS and is listed in the revised McDonald criteria from 201010 and the magnetic resonance imaging in multiple sclerosis consensus guidelines11 for the criteria of dissemination in time. Because the best sensitivity for enhancing lesions is achieved about 5–10 minutes after injection of a GBCA,12 further sequences, usually T2WI, are performed for bridging the waiting time. However, these sequences should be carefully selected because the signal of contrast-enhancing lesions might be changed in modified T2WI sequences such as FLAIR13,14 or DIR.15,16
One group found that contrast-enhancing parts of tumors appear hypointense in postcontrast DIR.15 Furthermore, it has been shown recently that there is an altered signal intensity of active enhancing inflammatory MS lesions in postcontrast DIR of the brain.16 This observation led to the recommendation to acquire DIR sequences before GBCA administration.
Here, we test the hypothesis that the signal loss on DIR images after GBCA administration can be used to detect active enhancing lesions. In particular, the aim was to compare the sensitivity of pre- and postcontrast images of 3D double inversion recovery and conventional 3D T1WI for the detection of contrast-enhancing MS-related lesions in the brain to analyze whether DIR could be as effective as T1WI.
Materials and Methods
Patients
Patients were enrolled in a prospective study design, and data were analyzed retrospectively. In 45 consecutive patients between June and December 2013 (24 women, mean age, 38 ± 11 years; range, 19–62 years) with MS (n = 38; 37 relapsing-remitting, 1 secondary-progressive; median Expanded Disability Status Scale score, 1.7 ± 1.7, range, 0–6.5) or clinically isolated syndrome (n = 7), a DIR sequence was acquired after IV injection of a GBCA in addition to the standard in-house MR imaging protocol. The study was Health Insurance Portability and Accountability Act–compliant. The study protocol was approved by the local ethics committee, and written informed consent was obtained from all participants. All patients were examined due to a new clinical attack or for routine follow-up.
MR Imaging Acquisition
Scans were obtained on a 3T scanner (Achieva; Philips Healthcare, Best, the Netherlands) with a 16-channel array head coil. Our standard MR imaging protocol for patients with or suspicious for MS has a precontrast 3D DIR sequence and 3D T1WI sequences pre- and postcontrast (6 minutes after IV injection). For this study, an additional 3D DIR sequence was acquired following the postcontrast T1WI sequence, 12 minutes after GBCA injection. A GBCA (0.5 mmol/mL, gadoterate meglumine; Dotarem; Guerbet, Aulnay-sous-Bois, France) was injected intravenously at a concentration of 0.1 mmol/kg. MR imaging acquisition parameters of the 3D DIR sequence were as follows: acquired voxel size, 1.2 × 1.2 × 1.3 mm3; acquisition matrix, 208 × 208; FOV, 250; TR, 5500 ms; TE, 328 ms; TI, 2550 ms; TSE factor, 173; number of sections, 300; acquisition time, 6 minutes; plane, sagittal. The parameters for the 3D T1WI sequence were the following: acquired voxel size, 1 × 1 × 1 mm3; acquisition matrix, 240 × 240; FOV, 240 mm; TR, 9 ms; TE, 4 ms; number of sections, 170; acquisition time, 5 minutes and 55 seconds; plane, sagittal. Additionally, T2WI and FLAIR sequences were acquired routinely. The T2WI sequence had a spatial resolution of 1.0 × 1.0 × 1.5 mm3, TR of 4000 ms, and a TE of 35 ms; the 3D FLAIR sequence had a spatial resolution of 1.0 × 1.0 × 1.5 mm3, a TR of 10,000 ms, a TE of 140 ms, and a TI of 2750 ms.
MR Imaging Analysis
Data were analyzed retrospectively. DIR and T1WI scans were resliced and coregistered with SPM12 (http://www.fil.ion.ucl.ac.uk/spm/software/spm12) and subtracted by using a custom script written in Matlab (MathWorks, Natick, Massachusetts; R2015a, Version 8.5.0 197631). This script used the built-in registration in SPM and reslice-algorithms to perform a rigid body coregistration of the images with the precontrast image as the reference file and the postcontrast image as the source file. The coregistered images were subtracted (“precontrast-postcontrast” for DIR and “postcontrast-precontrast” for T1WI) and analyzed without further processing steps.
The sequences were reformatted with ITK-SNAP (www.itksnap.org)17 in 1-mm axial sections. First, 2 neuroradiologists with 2 and 5 years' experience, respectively, assessed the images regarding the appearance of contrast-enhancing lesions. In a second step, both readers, blinded to diagnoses and clinical symptoms, independently assessed the images regarding the number of enhancing lesions by consulting precontrast, postcontrast, and subtraction images of DIR and T1WI in pseudorandom order by using ITK-SNAP. A contrast-enhancing lesion was defined as a 2-mm focal signal alteration in the brain tissue. A definite lesion count was derived from an additional consensus reading by both neuroradiologists by supplementary use of T2WI and FLAIR images. Additionally, lesions that were missed were classified with regard to localization (cortical/juxtacortical, periventricular, deep white matter, supra- or infratentorial).
Furthermore, the contrast-to-noise ratio (CNR) was calculated according to following formula:
where Slesion and Snonaffected surrounding tissue represent the mean signal in an ROI in the lesion and normal-appearing surrounding brain tissue, respectively. SDnonaffected surrounding tissue is the SD of the normal-appearing surrounding brain tissue. Calculation and measurement of the mean values were performed with standard tools of ITK-SNAP.17 The CNR was calculated in the largest lesion of each patient that was visible in all sequences.
Statistical Analysis
Differences in lesion number were calculated with the Wilcoxon signed rank test, and differences in the contrast-to-noise ratio were analyzed with a 2-sided Student t test for paired samples. The interobserver agreement was calculated with the Lin concordance (concordance correlation coefficient) by using the service of National Institute of Water and Atmospheric Research (http://services.niwa.co.nz/services/statistical/concordance). Significant differences were defined by P < .05 for the whole study.
Results
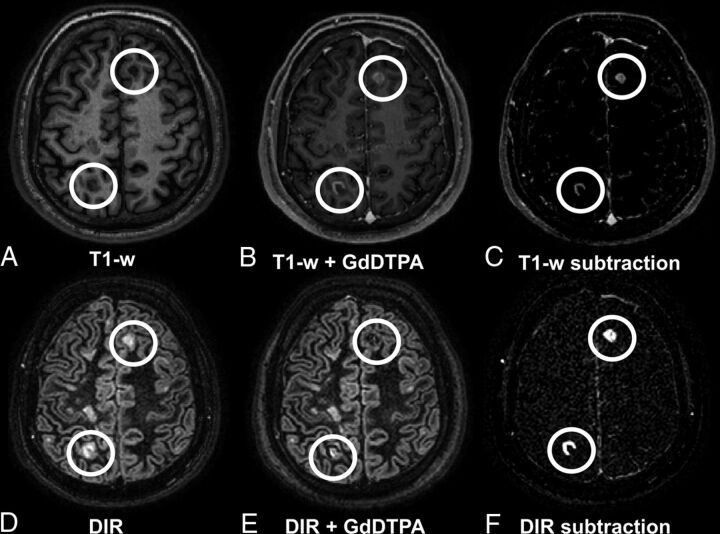
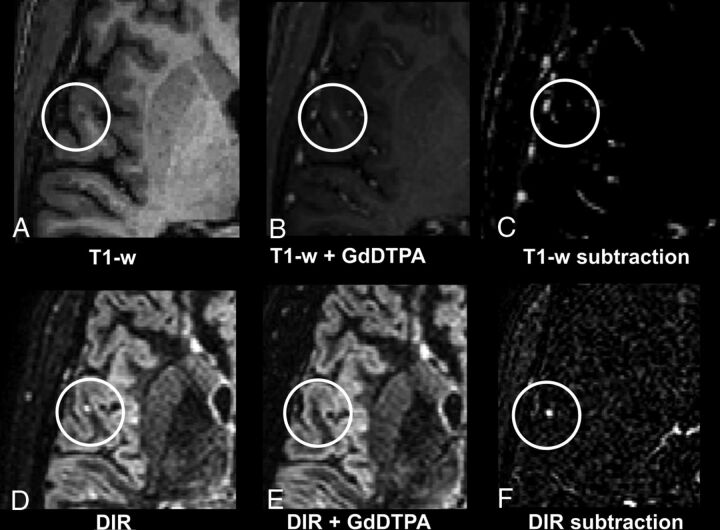
In conformity with previous studies, active contrast-enhancing lesions appeared hypointense on postcontrast DIR,15,16 and, consequently, hyperintense in subtraction images (precontrast minus postcontrast, Fig 1). Contrary to T1-weighted subtraction images, DIR subtraction images demonstrate only little or no contrast enhancement of blood vessels; thus, differentiation between a contrast-enhancing lesion and surrounding enhancing vessels is more difficult in T1WI, and lesion-to-background contrast appears higher in DIR subtraction images (Fig 2).
Fig 1.
A 32-year-old male patient with relapsing-remitting MS with several lesions, including 2 contrast-enhancing juxta-/intracortical lesions in the left frontal and right parietal areas. Upper row (A–C): T1WI; lower row (D–F): DIR images with A and D being precontrast; B and E, postcontrast; and C and F, subtraction images. Enhancing lesions appear hypointense on postcontrast DIR and are visible in subtraction images. Note the high contrast of the lesions in the DIR subtraction image (F) compared with T1WI subtraction image (C).
Fig 2.
A 32-year-old male patient with relapsing-remitting MS. Upper row (A–C): T1WI; lower row (D–F): DIR images with A and D being precontrast; B and E, postcontrast; and C and F, subtraction images. Note the small juxtacortical lesion that is substantially more detectable in the DIR subtraction image (F) compared with the T1WI subtraction image (C). Contrary to DIR subtraction (F), in T1WI subtraction images (C), some contrast-enhancing vessels are visible near the lesion; thus, differentiation between an active contrast-enhancing lesion and surrounding enhancing vessels is difficult.
Lesion Count
Altogether, 16% more contrast-enhancing lesions could be detected in DIR images compared with T1WI (214 versus 185, P = .007). On average, 5 contrast-enhancing lesions per patient were detectable in DIR compared with 4 lesions per patient on conventional T1WI (range: 0–42 [DIR], 0–34 [T1WI]; mean: 4.8 ± 9.9 [DIR], 4.1 ± 8.9 [T1WI]). No lesion detected on T1WI was missed on DIR.
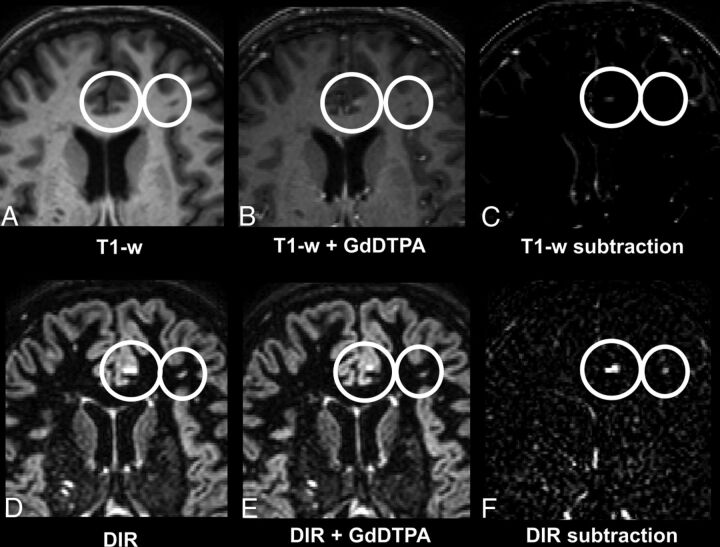
Of the 29 lesions missed on T1WI, 15 lesions were located juxtacortically; 5, periventricularly; 4, in the deep white matter supratentorially; and 5, infratentorially (2 cortically and 3 in the white matter). In Figs 2 and 3, examples of small juxtacortical lesions that can easily be missed in T1WI are shown.
Fig 3.
A 46-year-old female patient with relapsing-remitting MS. Upper row (A–C): T1WI; lower row (D–F): DIR images with A and D being precontrast; B and E, postcontrast; and C and F, subtraction images. Note that the small juxtacortical lesion is more detectable on the DIR subtraction image (F) compared with the T1-weighted subtraction image (C).
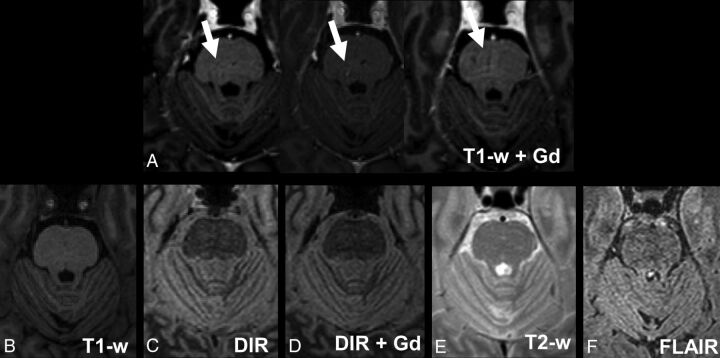
In T1WI, 4 hyperintense signals in the brain tissue had been counted as lesions, though they had been classified as pulse artifacts after consulting the other available sequences in the context of the consensus reading (Fig 4). None of the hyperintense signal alterations in the DIR images were misdiagnosed.
Fig 4.
Pulsation artifacts detected in T1WI postcontrast. Images of a 52-year-old male patient with relapsing-remitting MS. Upper row: A, 3 consecutive postcontrast T1-weighted images; lower row: B, T1-weighted precontrast image. C, DIR precontrast image. D, DIR postcontrast image; E, T2WI; F, FLAIR. Note the small hyperintense signal alterations in the middle of the pons that are only visible on 3 consecutive T1-weighted postcontrast images and not on the other images.
The concordance between both radiologists was almost perfect, with slightly higher concordance for the DIR images (concordance correlation coefficient, ρc = 0.94 for T1WI and ρc = 0.98 for DIR).
Contrast-to-Noise Ratio
The contrast-to-noise ratio was significantly higher for DIR subtraction images (14.3 ± 5.5) compared with T1-weighted subtraction images (6.3 ± 7.1), postcontrast T1WI (1.7 ± 0.9), and postcontrast DIR (0.2 ± 0.5), respectively (P < .001).
Discussion
In our study, we could show that pre- and postcontrast 3D DIR enables the detection of contrast-enhancing lesions in MS in the brain with higher sensitivity compared with pre- and postcontrast 3D T1WI. The total number of contrast-enhancing lesions found on DIR was significantly higher than those found on conventional T1WI, especially for small lesions in juxtacortical/intracortical localizations. Hence, our results suggest that DIR is not only superior to conventional T2-weighted sequences with regard to detection of cortical and WM lesions but may also constitute an alternative for T1-weighted contrast-enhanced sequences.
Several studies could show that the postcontrast fluid-attenuated inversion recovery sequence was useful for the detection of subtle enhancement due to blood-brain barrier dysfunction.13,14,18 Because FLAIR and DIR differ only in an additional inversion recovery pulse in DIR—for the suppression of normal white matter—it is supposed that DIR is useful for the detection of contrast enhancement of MS lesions as well.
In fact, because it was discussed in a previous study that a single DIR sequence may be considered appropriate for MS monitoring,19 the approach presented in this study could contribute to a minimally time-consuming MR imaging protocol, including the acquisition of postgadolinium images, with only DIR pre- and postcontrast (approximately a 12-minute protocol). On the other hand, such short protocols could have limited sensitivity for treatment-associated complications such as progressive multifocal leukoencephalopathy; therefore, further studies are necessary to analyze the sensitivity of DIR regarding opportunistic diseases. Furthermore, the T1WI sequence enables the quantification of brain atrophy that might occur in advanced stages of MS; however, this is actually not recommended in clinical routine because small changes might contribute to strong errors with a sensitivity of 67% and a specificity of 80%.20 Still, because DIR sequences are more often included in routine MR imaging protocols for the assessment of MS, adding another DIR sequence after administration of a GBCA would be a notable time benefit if one decides to omit pre- and postcontrast T1WI.
We acknowledge limitations of our study. Most important, postcontrast DIR was always acquired after the acquisition of the T1WI sequence and thus delayed (6 minutes). It is well-known that the sensitivity of postcontrast images increases with the length of delay after administration of GBCAs.12 Therefore, this increase might contribute to a bias toward a higher lesion count and contrast in DIR. However, the study of Uysal et al12 concluded that a delay of >5 minutes leads to only a minor additional benefit; they found no significant difference in lesion numbers with T1WI after 5 or 10 minutes, comparable with the timing of our study (6 and 12 minutes). A second limitation is that subtraction images have motion artifacts; thus, interpretation could be difficult if not impossible, in particular with the standard software of the main MR imaging vendors.
Conclusions
This study demonstrates that the DIR sequence, which has been shown to improve the visibility of MS-typical lesions in the brain compared with T2WI or FLAIR sequences, also enables detectability and visibility of MS-typical contrast-enhancing lesions in pre- and postcontrast DIR images at least equal to the detection with standard 3D T1WI in the brain. Further studies are necessary to evaluate whether subtraction DIR could be an alternative to T1WI or even reduce the protocol to only pre- and postcontrast DIR.
ABBREVIATIONS:
- DIR
double inversion recovery
- GBCA
gadolinium-based contrast agent
- CNR
contrast-to-noise ratio
Footnotes
Disclosures: Jan S. Kirschke—UNRELATED: Grants/Grants Pending: European Research Council, Deutsche Forschungsgemeinschaft*; Payment for Lectures Including Service on Speakers Bureaus: Philips Healthcare. Muna-Miriam Hoshi—UNRELATED: Travel/Accommodations/Meeting Expenses Unrelated to Activities Listed: Bayer HealthCare, Comments: travel support for the annual meeting of the German Neurologic Society 2016. Claus Zimmer—UNRELATED: Other: C. Zimmer has served on scientific advisory boards for Philips Healthcare and Bayer Schering Pharma, serves as coeditor on the Advisory Board of Clinical Neuroradiology, has received speaker honoraria from Bayer Schering Pharma and Philips Healthcare, and has received research support and investigator fees for clinical studies from Biogen Idec, Quintiles, Merck Sharp & Dohme, Boehringer Ingelheim, Inventiv Health Clinical UK Ltd, Advance Corporation, BrainsGate, Pfizer, Bayer Schering Pharma, Novartis, Roche, Servier, Penumbra, WCT GmbH, Syngis, SSS International Clinical Research, PPD Germany GmbH, Worldwide Clinical Trials Ltd, phenox, Covidien, Actelion, Medivation, Medtronic, Harrison Clinical Research, Concentric, Penumbra, PHARMTRACE, Reverse Medical Corp, Premier Research Germany Ltd, Surpass Medical Ltd, and GlaxoSmithKline.* *Money paid to the institution.
References
- 1. Redpath TW, Smith FW. Imaging gray brain matter with a double-inversion pulse sequence to suppress CSF and white matter signals. MAGMA 1994;2:451–55 10.1007/BF01705296 [DOI] [Google Scholar]
- 2. Redpath TW, Smith FW. Technical note: use of a double inversion recovery pulse sequence to image selectively grey or white brain matter. Br J Radiol 1994;67:1258–63 10.1259/0007-1285-67-804-1258 [DOI] [PubMed] [Google Scholar]
- 3. Vural G, Keklikoğlu HD, Temel Ş, et al. Comparison of double inversion recovery and conventional magnetic resonance brain imaging in patients with multiple sclerosis and relations with disease disability. Neuroradiol J 2013;26:133–42 10.1177/197140091302600201 [DOI] [PMC free article] [PubMed] [Google Scholar]
- 4. Wattjes MP, Lutterbey GG, Gieseke J, et al. Double inversion recovery brain imaging at 3T: diagnostic value in the detection of multiple sclerosis lesions. AJNR Am J Neuroradiol 2007;28:54–59 [PMC free article] [PubMed] [Google Scholar]
- 5. Seewann A, Kooi EJ, Roosendaal SD, et al. Postmortem verification of MS cortical lesion detection with 3D DIR. Neurology 2012;78:302–08 10.1212/WNL.0b013e31824528a0 [DOI] [PubMed] [Google Scholar]
- 6. Geurts JJ, Pouwels PJ, Uitdehaag BM, et al. Intracortical lesions in multiple sclerosis: improved detection with 3D double inversion-recovery MR imaging. Radiology 2005;236:254–60 10.1148/radiol.2361040450 [DOI] [PubMed] [Google Scholar]
- 7. Calabrese M, De Stefano N, Atzori M, et al. Detection of cortical inflammatory lesions by double inversion recovery magnetic resonance imaging in patients with multiple sclerosis. Arch Neurol 2007;64:1416–22 10.1001/archneur.64.10.1416 [DOI] [PubMed] [Google Scholar]
- 8. Simon B, Schmidt S, Lukas C, et al. Improved in vivo detection of cortical lesions in multiple sclerosis using double inversion recovery MR imaging at 3 Tesla. Eur Radiol 2010;20:1675–83 10.1007/s00330-009-1705-y [DOI] [PMC free article] [PubMed] [Google Scholar]
- 9. Riederer I, Karampinos DC, Settles M, et al. Double inversion recovery sequence of the cervical spinal cord in multiple sclerosis and related inflammatory diseases. AJNR Am J Neuroradiol 2015;36:219–25 10.3174/ajnr.A4093 [DOI] [PMC free article] [PubMed] [Google Scholar]
- 10. Polman CH, Reingold SC, Banwell B, et al. Diagnostic criteria for multiple sclerosis: 2010 revisions to the McDonald criteria. Ann Neurol 2011;69:292–302 10.1002/ana.22366 [DOI] [PMC free article] [PubMed] [Google Scholar]
- 11. Filippi M, Rocca MA, Ciccarelli O, et al. ; MAGNIMS Study Group. MRI criteria for the diagnosis of multiple sclerosis: MAGNIMS consensus guidelines. Lancet Neurol 2016;15:292–303 10.1016/S1474-4422(15)00393-2 [DOI] [PMC free article] [PubMed] [Google Scholar]
- 12. Uysal E, Erturk SM, Yildirim H, et al. Sensitivity of immediate and delayed gadolinium-enhanced MRI after injection of 0.5 M and 1.0 M gadolinium chelates for detecting multiple sclerosis lesions. AJR Am J Roentgenol 2007;188:697–702 10.2214/AJR.05.2212 [DOI] [PubMed] [Google Scholar]
- 13. Bonzano L, Roccatagliata L, Levrero F, et al. In vitro investigation of poor cerebrospinal fluid suppression on fluid-attenuated inversion recovery images in the presence of a gadolinium-based contrast agent. Magn Reson Med 2008;60:220–23 10.1002/mrm.21619 [DOI] [PubMed] [Google Scholar]
- 14. Mathews VP, Caldemeyer KS, Lowe MJ, et al. Brain: gadolinium-enhanced fast fluid-attenuated inversion-recovery MR imaging. Radiology 1999;211:257–63 10.1148/radiology.211.1.r99mr25257 [DOI] [PubMed] [Google Scholar]
- 15. Harris RJ, Cloughesy TF, Pope WB, et al. Pre- and post-contrast three-dimensional double inversion-recovery MRI in human glioblastoma. J Neurooncol 2013;112:257–66 10.1007/s11060-013-1057-y [DOI] [PMC free article] [PubMed] [Google Scholar]
- 16. Hodel J, Badr S, Outteryck O, et al. Altered signal intensity of active enhancing inflammatory lesions using post-contrast double inversion recovery MR sequence. Eur Radiol 2017;27:637–41 10.1007/s00330-016-4416-1 [DOI] [PubMed] [Google Scholar]
- 17. Yushkevich PA, Piven J, Hazlett HC, et al. User-guided 3D active contour segmentation of anatomical structures: significantly improved efficiency and reliability. Neuroimage 2006;31:1116–28 10.1016/j.neuroimage.2006.01.015 [DOI] [PubMed] [Google Scholar]
- 18. Eisele P, Griebe M, Szabo K, et al. Investigation of leptomeningeal enhancement in MS: a postcontrast FLAIR MRI study. Neurology 2015;84:770–75 10.1212/WNL.0000000000001286 [DOI] [PubMed] [Google Scholar]
- 19. Khangure SR, Khangure MS. MR imaging in multiple sclerosis: the accuracy of 3D double inversion recovery at 3 Tesla and the potential for single sequence imaging. Neuroradiol J 2011;24:92–99 10.1177/197140091102400114 [DOI] [PubMed] [Google Scholar]
- 20. De Stefano N, Stromillo ML, Giorgio A, et al. Establishing pathological cut-offs of brain atrophy rates in multiple sclerosis. J Neurol Neurosurg Psychiatry 2016;87:93–99 10.1136/jnnp-2014-309903 [DOI] [PMC free article] [PubMed] [Google Scholar]


