Abstract
BACKGROUND AND PURPOSE:
Synthetic MR imaging is a new technique to create absolute R1 relaxivity (1/T1), R2 relaxivity (1/T2), and proton-density maps using a single multiple-spin-echo saturation recovery sequence. These relaxivity maps allow rapid automated intracranial segmentation of tissue types. To assess its utility in children, we created a normative data base of intracranial volume and brain parenchymal, GM, WM, CSF, and myelin volumes in a pediatric population with normal brain MRI findings using synthetic MR imaging.
MATERIALS AND METHODS:
All multiple-spin-echo saturation recovery sequences containing brain MR imaging examinations performed during 34 months were retrospectively reviewed. Abnormal examination findings were excluded following a detailed radiographic and clinical chart review. The remaining normal examination findings were then quantitatively analyzed with synthetic MR imaging. Intracranial, brain parenchymal, GM, WM, CSF, and myelin volumes were plotted versus age. Qualitative assessment of segmentation accuracy was performed. Selected abnormal examination findings were compared with these normative curves.
RESULTS:
One hundred twenty-two MRI examinations with normal findings were included of individuals ranging from 0.1 to 21.5 years of age (median, 11.8 years). Resulting normative data plots compared favorably with previously published data obtained using more onerous techniques. Differentiation from pathologic states was possible using quantitative values in select cases.
CONCLUSIONS:
A pediatric data base of normal intracranial tissue volumes using a single sequence and rapid software analysis has been compiled and correlates with previously published data. This provides a framework for clinical interpretation of quantitative synthetic MR images during development. Improved age-based segmentation algorithms in young children are needed.
Many complex subjective assessments are made when radiologists interpret imaging of the pediatric brain, including evaluation of brain parenchymal volume (BPV), morphology, CSF volume, and myelination extent, all in the context of the patient's age.1 There is clinical interest in automated quantitative methods of segmenting intracranial tissues that allow longitudinal tracking and comparison against normative standards. Many segmentation methods have been described,2 and multiple software packages are available, including FSL (http://www.fmrib.ox.ac.uk/fsl),3 FreeSurfer (http://surfer.nmr.mgh.harvard.edu),4 NeuroQuant (CorTech Labs, San Diego, California),5 and NeuroReader (https://brainreader.net/),6 but to date, there has been relatively limited impact on the clinical interpretation of pediatric neuroimaging studies.
Synthetic MRI is a quantitative MR imaging method in which a multiple-spin-echo saturation recovery sequence (QMAP sequence) is used with 4 saturation delays and 5 echoes to measure absolute R1 relaxivity (1/T1), R2 relaxivity (1/T2), and proton-density (PD) values.7 Fully automated synthetic MR imaging visualization software loads the raw DICOM data, performs relaxivity curve fitting to the Bloch equations, and calculates whole-brain R1, R2, and PD maps used to synthesize MR images with standard contrast.7–9 Additionally, the R1, R2, and PD maps are used as input to calculate an intracranial mask that determines the intracranial volume (ICV). A look-up table is used to convert R1, R2, and PD values of each voxel into tissue volume fractions with no atlas, manual tracing, or a priori assumptions of tissue distribution or anatomy.10 Whole intracranial volumes of CSF, GM, WM, nonassignable tissues, and myelin (MY) are calculated by summing the partial volume fraction of each voxel within the ICV.10,11 The partial volume method accounts for voxels containing multiple tissue types and decreases dependence on the acquired resolution of the dataset.12 A key advantage of this segmentation method is that unlike voxel intensity in standard MR images, R1, R2, and PD values are inherent physical properties of a given tissue/voxel at a given field strength and are otherwise independent of the acquisition strategy or hardware.10
To date, synthetic MR imaging–based segmentation has been primarily performed in adults.10 There are a few published case reports demonstrating the value of synthetic MR imaging in pediatric brain imaging,8,9,13,14 but widespread clinical utility of volumetrics requires the documentation of normative segmentation volumes during development. To address this need, we have created a normative data base of ICV, BPV, brain parenchymal fraction (BPF), GM, WM, CSF, MY, and myelin fraction (MYF) in a pediatric population with normal brain MRI findings using this methodology.
Materials and Methods
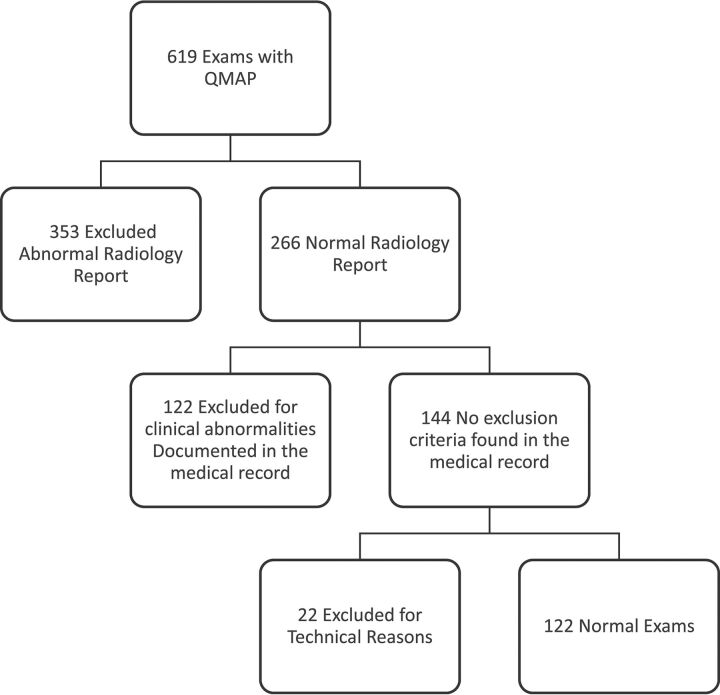
An institutional review board–approved retrospective review was performed of all brain MR imaging examinations during a 34-month period in which the QMAP sequence was performed (619 examinations). The axial QMAP sequence (4-mm section thickness, 1-mm gap, matrix size of 320 × 256, acquisition time of 6 minutes) was included as an optional sequence (when time allowed) and has been described previously.7–9 The algorithm for subject inclusion is shown in Fig 1. Studies with abnormal findings on clinical radiology reports were excluded. A systematic medical chart review was performed on the remaining 266 examinations to exclude those with clinical diagnoses or medications potentially affecting intracranial tissue volumes (Table 1). The remaining MR imaging examinations were reviewed by 1 of 3 board-certified pediatric neuroradiologists to identify any abnormalities not described on the clinical report.
Fig 1.
Examination evaluation path/exclusion diagram.
Table 1:
Clinical and radiographic exclusion criteria
| Exclusion Criteria |
|---|
| Identified pathology in the brain |
| Prior intracranial operation |
| Motion or susceptibility artifacts causing image distortion of SyMRI |
| Known developmental delay in language or motor domains requiring therapy |
| Autism spectrum disorder |
| Fixed neurologic deficit related to intracranial disease |
| Spasticity with cerebral cause requiring therapy |
| Chronic epilepsy |
| Significant prematurity (younger than 34 weeks' GA at delivery) |
| Significant macrocephaly (head circumference >97th percentile) |
| Significant microcephaly (head circumference <3rd percentile) |
| Hydrocephalus |
| Head trauma with extra-axial hemorrhage |
| Genetic disorder known to involve brain development |
| Systemic steroid therapy within 1 mo of examination |
Note:—GA indicates gestational age.
The QMAP sequences on the remaining 144 studies were analyzed with SyMRI, Version 8 (Synthetic MR AB, Linköping, Sweden) with output of ICV, GM, WM, CSF, and MY. Descriptions of the segmentation method have been published previously.10,11 BPV is calculated as the sum of GM, WM, and nonassignable tissues. BPF is BPV/ICV and MYF is MY/BPV.10,11
Resultant segmentation maps were assessed for image quality, artifacts, errors in intracranial volume segmentation, and appropriate anatomic coverage. Twenty-two examinations were excluded from analysis because of image degradation caused by motion artifacts or insufficient coverage of the intracranial compartment. In a small number of cases (16), minor manual adjustments were made to the segmented intracranial contour. In 14 cases, extracranial tissues were included in the ICV (primarily the diploic space). Following adjustment, the average ICV decreased by only 6 mL (0.4%). The effect was largest on myelin volume, which decreased by 0.6%, and CSF, which decreased by 0.9%. In 2 cases, small portions of the occipital lobes were incorrectly excluded from the ICV. Following adjustment, the ICV increased by 15 mL (1%), with corresponding increases in GM and WM of 1%.
The adequacy of segmentation was assessed in all subjects (n = 26) younger than 4 years of age (relative to that expected by visual assessment of the anatomic images) with the following scoring system for GM/WM segmentation: 1, all WM was labeled as GM; 2, marked mislabeling of WM as GM though correct in the central WM tracts; 3, clear extension of GM labeling into the WM; 4, overall correctly labeled, with mislabeling of subcortical WM in the frontal and/or temporal lobes; and 5, correctly labeled. The fractional assignment of brain to the CSF compartment was assessed as follows: 1, large confluent areas of parenchyma incorrectly classified as CSF; 2, small noncontiguous areas of parenchyma incorrectly classified as CSF; and 3, no parenchyma incorrectly classified as CSF.
Of the 122 final examinations, 60 were performed at 3T and 62 were performed at 1.5T. All 3T examinations were performed on a Discovery MR750w scanner (GE Healthcare, Milwaukee, Wisconsin). Of those performed at 1.5T, 51 were performed on an Optima MR450w (GE Healthcare) and 11 were performed on an Ingenia scanner (Philips Healthcare, Best, the Netherlands). All examinations on children younger than 6 years of age were performed at 3T. Data plotting, curve fitting, and confidence interval calculation was performed with SAS, Version 9.4 (SAS Institute, Cary, North Caroline) and Matlab 2016b (MathWorks, Natick, Massachusetts) using the cftool function in Matlab. For each tissue type, data were plotted versus patient age. Curve fits and 95% confidence intervals were calculated and superimposed on the respective scatterplots. For BPV, BPF, ICV, WM, CSF, MY, and MYF, the data were fit to a double exponential curve y = a × exp(b × x) + c × exp(d × x). GM data were fit to a double exponential equation modified with a linear term y = a × exp(b × x) + c × exp(d × x) + f × x + g. Additional plots for MY and MYF were made with a subset of data limited to subjects 0–18 months of age, the period of most rapid myelination. Curve fits were performed to the equation y = m × x + b.
Results
The included 122 subjects ranged in age from 0.1 to 21.5 years (median, 11.8 years), with 49 males and 73 females. Clinical indications for the examinations are given in Table 2.
Table 2:
Clinical indications for included MRI examinations
| Indication for Brain MRI | No. |
|---|---|
| Headaches | 69 |
| Seizure (suspected or first-time seizure) | 10 |
| Suspected brain lesion | 8 |
| Dizziness, vertigo, or vomiting | 7 |
| Neurologic findings | 7 |
| Concussion | 4 |
| Other | 17 |
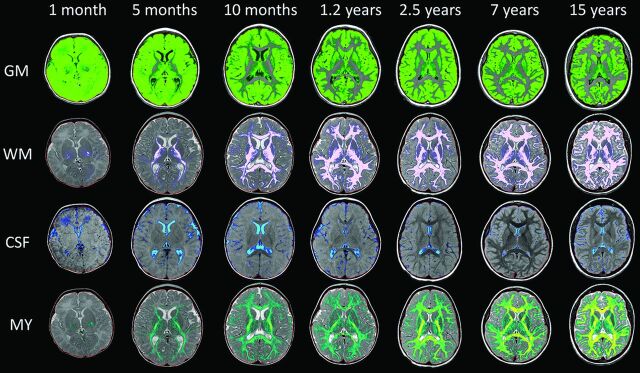
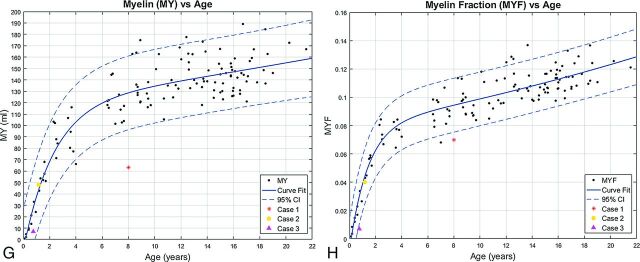
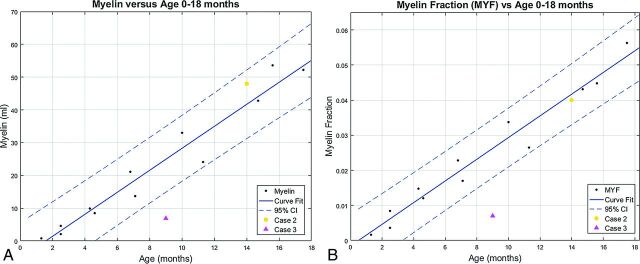
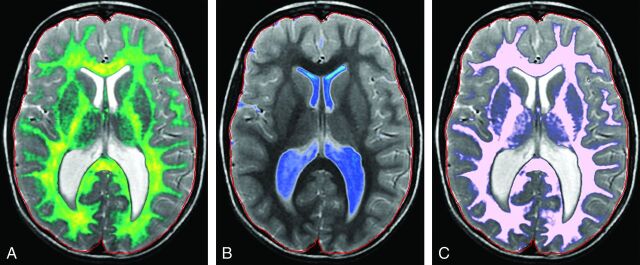
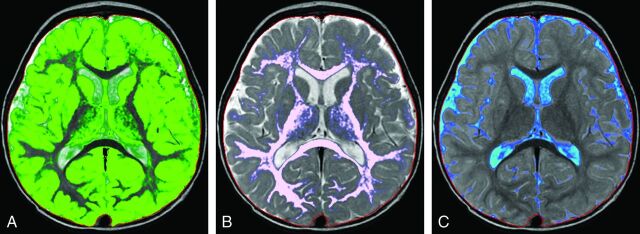
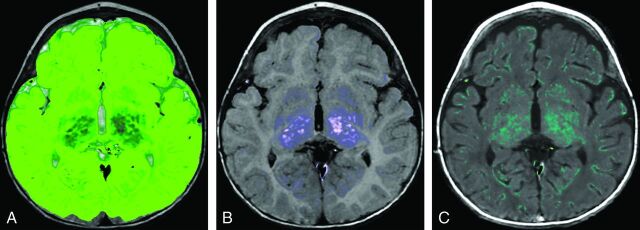
Representative automated segmentation images for patients 0.1, 0.4, 0.8, 1.2, 2.5, 7, and 15 years of age are shown in Fig 2. Resultant normative curves for ICV, BPV, GM, WM, CSF, MY, and MYF are given in Fig 3. MY and MYF for subjects 0–18 months of age are given in Fig 4.
Fig 2.
Representative segmentation images. Age is organized in columns increasing from left to right: 1 month, 5 months, 10 months, 1.2 years, 2.5 years, 7 years, and 15 years of age. Tissue types are arranged in upper-to-lower rows: GM, WM, CSF, and MY. The faint red line denotes the boundary of the intracranial mask. Note the suboptimal GM/WM segmentation in young children (upper 2 rows). At 0.1 year, there is complete assignment of WM as GM (upper left image); at 0.4 year, there is mislabeling with correct assignment of the internal capsule and centrum semiovale (not shown). At 0.8 year, some peripheral WM is assigned as GM. At 1.2 years, there is overall good segmentation with areas of mislabeling in the frontal and temporal lobes. By 2.5 years and beyond, GM and WM are correctly segmented. Note the assignment of parenchymal voxels as CSF in the youngest children (first column, third row).
Fig 3.
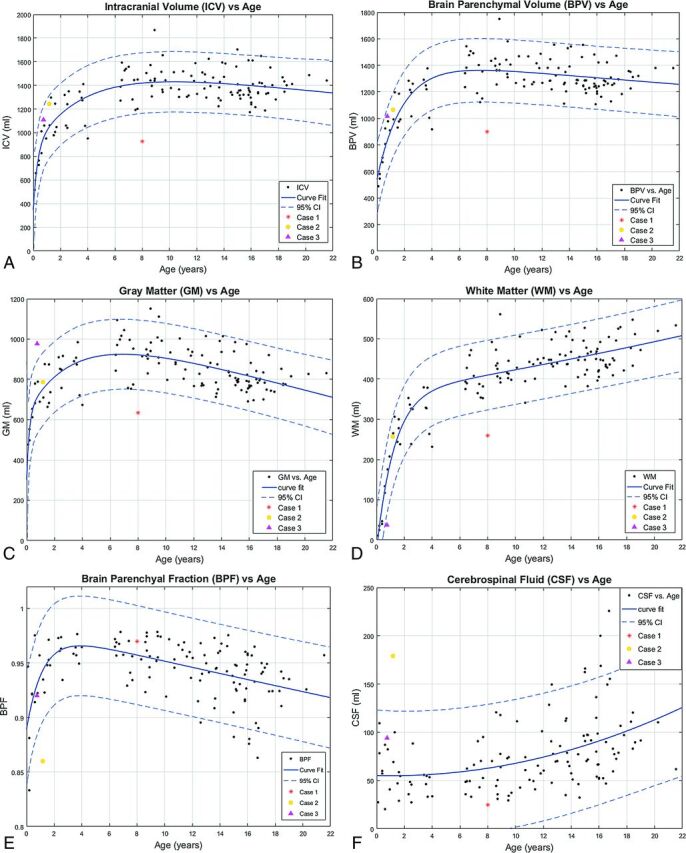
Segmentation volume plots versus patient age. A, ICV. B, BPV. C, GM. D, WM. E, BPF. F, CSF. G, MY. H, MYF. Solid lines denote curve fit functions. Dashed lines denote 95% confidence intervals. Data points for the 122 healthy patients are denoted by black dots. Three illustrative cases with abnormal exams are superimposed on the normal plots. Case 1 is a purple triangle, Case 2 is an orange circle, and unhealthy Case 3 is a red asterisk. (Normal plots without the superimposed cases can be found in the On-line Figs 1 and 2).
Fig 4.
Segmentation volume plots versus patient age from 0 to 18 months. A, Myelin volume versus age. B, Myelin fraction versus age. Data points for the 12 healthy patients 0–18 months of age are denoted by black dots. Two illustrative cases with abnormal exams are superimposed on the normal plots. Case 1 is a purple triangle, and Case 2 is an orange circle. (Normal plots without the superimposed cases can be found in the On-line Figs 1 and 2). Solid lines denote curve fit functions. Dashed lines denote 95% confidence intervals.
ICV increased rapidly from 0 to 18 months, with progressive slowing, reaching a plateau in early adolescence with an ICV of approximately 1400 mL. A similar rapid growth and plateau are seen with BPV, reaching a plateau of 1300 mL in early adolescence. BPF rises rapidly in infancy and early childhood to a peak of 0.96 at 45 months, followed by a gradual linear decline in late childhood and adolescence, reaching a value of 0.92 at 18 years of age.
Values of intracranial CSF volume demonstrated a gradual increase throughout childhood and adolescence from a value of approximately 50 mL in neonates and infants to a mean value of approximately 100 mL, with a range of 50–150 mL in the late teenage and young adult period.
GM volume increases rapidly during the first 18 months of life, with subsequent slowing of the growth rate. A maximum GM volume of 920 mL was reached at 6–7 years of age, followed by a gradual decline throughout the teenage years to a value of 790 at 18 years of age.
WM demonstrates rapid linear growth during the first 18 months with subsequent slowing of the growth rate through childhood and adolescence, with continued increases throughout the age range of the study population. No maximum was reached.
MY and MYF demonstrate rapid linear growth during the first 18 months of age, with a gradually decreasing rate of growth throughout childhood and further decreased-but-persistent growth through adolescence. To better assess the rapid early growth phase, we plotted a subset of the data limited to subjects 0–18 months of age demonstrating rapid linear growth (Fig 4). As expected, the limited dataset has narrower confidence intervals for the 0- to 18-month age range than the full dataset.
Qualitative assessment of the accuracy of segmentation demonstrated improved segmentation of CSF, GM, and WM with increasing subject age up to 18 months of age (Fig 5).
Fig 5.
Adequacy of segmentation. Qualitative segmentation scores versus patient age. GM/WM segmentation (left) and CSF/WM segmentation (right). In subjects younger than 3 months of age, most anatomic WM was labeled as GM with a qualitative score of 1. In subjects between 3 and 7 months of age, there was moderate mislabeling of WM as GM, but WM tracts in the centrum semiovale and internal capsule were correctly labeled with a qualitative score of 2. From 8 to 11 months, there was less prominent-but-definite extension of GM labeling into WM with a score of 3. From 12 to 18 months of age, there was minor mislabeling of subcortical WM in the frontal and/or temporal lobes with otherwise excellent segmentation, with a qualitative score of 4. The WM was correctly labeled in children older than 18 months of age with a qualitative score of 5. Subjects younger than 5 months of age had large confluent areas of parenchyma and unmyelinated WM, which were labeled fractionally as CSF (score of 1). Subjects between 5 and 10 months of age had small noncontiguous areas, primarily in the subcortical white matter, which were fractionally labeled as CSF (score of 2). No parenchyma was designated as CSF in subjects older than 10 months of age (score of 3).
To provide an initial assessment of the potential clinical applications of the automated segmentation process and normative curves, we evaluated selected studies with abnormal findings and compared segmentation volumes with the normative values (Figs 6–8).
Fig 6.
Case 1. A, Myelin. B, CSF. C, WM. An 8-year-old girl with a history of trisomy 21 and microcephaly. Volumetric data are superimposed on the normal plots such as the red asterisk on Fig 3. The ICV (925 mL), BPV (900 mL), GM (634 mL), WM (259 mL), myelin (63 mL), and MYF (0.07) are abnormal and plot below the 95% CI. The CSF (25 mL) and BPF (0.97) are normal. Consistent with microcephaly, the ICV and BPV are small. The BPF is normal; this finding indicates that the brain is proportional to the intracranial compartment. A low myelin volume would be expected with a small BPV; however, the MYF is also low. This finding indicates abnormal myelination, which has been described in patients with Down syndrome.32–34
Fig 7.
Case 2. A 14-month-old boy with a history of increased head circumference and developmental delay. A, GM. B, WM. C, CSF. Volumetric data are superimposed on the normal plots such as the orange circle Fig 3 and on the 0- to 18-month curves in Fig 4. The ICV (1244 mL), BPV (1065 mL), GM (787 mL), WM (257 mL), MY (48 mL), and MYF (0.04) are normal for age; however, the CSF (179 mL) is above the 95% CI for age. The BPF (0.86) is below the 95% CI for age. Despite the enlarged head circumference, the ICV is at the upper range of normal. The normal BPV, GM, WM, and MY are reassuring. The CSF volume is higher than that of age-matched peers, seen with benign macrocrania, but the developmental delay is concerning and this patient will be followed.
Fig 8.
Case 3. A 9-month-old boy with a known history of Pelizaeus-Merzbacher disease. A, GM. B, WM. C, Myelin. Volumetric data are superimposed on the normal plots like the purple triangle Fig 3 and on the 0- to 18-month-old curves in Fig 4. The ICV (1109 mL), BPV (1016 mL), BPF (0.92), and CSF (94 mL) are normal. The brain parenchyma was almost exclusively segmented as GM (971 mL), higher than the 95% CI, with only a small component of WM (37 mL) lower than the 95% CI. The myelin volume (7 mL) and MYF (0.007) are both below the 95% CI for age as expected for a patient with Pelizaeus-Merzbacher disease, a primary hypomyelination disease.35
Discussion
To the best of our knowledge, this is the first study to evaluate normative quantitative segmentation of intracranial tissue types in children using the SyMRI technique. Understanding the normal developmental trajectories and limitations of these analyses is critical for eventual clinical use. Assessment of intracranial tissue volumes is a key component of interpretation of brain imaging studies, but currently, this is almost exclusively subjective and qualitative in clinical practice. Readily obtained linear measurements of complex volumes like the ventricular system have been shown to be representative of absolute volumes,15 but the degree of correlation is limited. Moreover, such subjective analyses do not lend themselves to accurate assessment of changes with time or to meaningful population comparisons. The ability to quantify the volumes of intracranial CSF and parenchyma in a patient during multiple time points or in comparison with a healthy population will increase the accuracy and value of the imaging analysis and will likely lead to greater insight into the evolution of multiple pathologic processes.
Obtaining quantitative data in our subjects with synthetic MR imaging was rapid and easily translatable to clinical practice. The QMAP sequence requires <6 minutes to acquire, and the segmentation with synthetic MR imaging is automated and provides quantitative maps, volumetric segmentation, and anatomic datasets with standard MR imaging contrasts (T1, T2, FLAIR, and so forth) in <1 minute on a standard workstation and a timeframe and format optimized for clinical use, allowing concurrent analysis of quantitative and anatomic data.7–9
Useful as they are, the descriptive terms “gray matter” and “white matter” can be misleading when used to describe the brain parenchyma. These descriptions of the various compartments of the brain, based on gross anatomic observation, imply that there is little or no contamination of either tissue type by the other, but we know that axons and myelin exist within gray matter structures, and neurons are present in white matter. Additionally, in the immature brain, the absence of myelin on many of the axons requires recognition of unmyelinated axons and those acquiring myelin.
The R1, R2, and PD characteristics of WM change considerably as myelination progresses. In young children, the WM has low R1 and R2 values secondary to the large water content, but as the tissue myelinates, the water is expressed and myelin is deposited, lengthening R1 and R2. The SyMRI technique segments WM and myelin and calculates myelin fraction.11 WM reflects the total volume of myelinated axons, myelin represents the total volume of myelin (excluding axons, extracellular water, and other material that is not myelin), and myelin fraction represents the fraction of the brain that is myelin.11 The MY and MYF curves are similar to those produced by Dean et al16 using different techniques, supporting the validity of the SyMRI myelin segmentation in children. A relative reduction in myelin or myelin fraction may provide the earliest indication of disruption of the myelination process. In cases of parenchymal volume loss, though the volumes of both WM and myelin will be lower than normal, myelin fraction can inform whether the parenchyma that is present is normally myelinated.
The present methodology is sensitive to the presence of myelinated axons and those in the early stages of acquiring myelination, but it has difficulty in accurately segregating unmyelinated axons from GM (Fig 5). In R1–R2 space, the unmyelinated and myelinated WM flank GM on opposite sides. As unmyelinated WM myelinates, it passes immediately adjacent to GM with overlap, making separation difficult. Similar WM/GM segmentation difficulties in children using other techniques have been reported previously.2,17,18 Therefore, visual review of the segmentation in subjects younger than 18 months of age shows that the GM compartment contains large areas of what we know to be unmyelinated axons (Fig 2). GM is therefore overestimated in subjects younger than 18 months of age, while WM is underestimated. This error in estimation results in an artificially shallow growth rate of GM through the first 18 months of life and an artificially steep growth rate of WM. An article limited to neonates up to 2 months of age demonstrated substantially lower GM volumes than in our youngest patients.19 However, despite this overestimation, the curves of GM volume across time parallel those generated by previously published pediatric studies, even in the 0- to 5-year age range.17,20–24 This similarity suggests that either these other techniques have a similar error, young subjects were underrepresented in the samples, or the inclusion of unmyelinated axons during the first 18 months of development does not substantially skew the pattern of GM growth. Our data demonstrated the maximum GM volume occurring at 6 years of age, which is later than the 4 years reported in prior articles.22,23 The GM/WM segmentation error does not render the data clinically useless. If the algorithm is consistent and the clinical case is compared with healthy cases segmented with the same algorithm, the patient's location on the nomogram and growth trajectory can provide useful clinical information.
The readily available quantification of the CSF compartment and the ability to generate ratios of CSF to BPV may allow a more accurate and translatable assessment of hydrocephalus and other pathologies of CSF homeostasis. Tracking these volumes across time in individual patients may allow a more sensitive and meaningful understanding of the effectiveness of CSF diversion strategies, as will comparison of values with a healthy population data base, such as that presently done with head circumference measurements. It is reasonable to think that such ready quantification may increase the sensitivity and accuracy of the diagnosis of more pervasive disorders of CSF volume and intracranial pressure. One could assume that future software iterations will segment intraventricular CSF as a separate compartment, an additional valuable data source in these patients.
In our youngest subjects, we identified regions of the parenchyma partially assigned to the CSF compartment (Fig 2). This misclassification is most evident in subjects younger than 5 months of age and is secondary to the fractional volume assignment of each pixel and the relative high water content of the infant brain. The degree to which this misclassification alters the assessment in an individual case is unclear, given the wide range of normal CSF volumes, but it does suggest that intracranial CSF is mildly overestimated in very young children.
Many diseases result in focal parenchymal abnormalities and would not be detected by whole-brain volumetric analysis. This technique will be most advantageous in the assessment of diffuse disease processes. Current tools for clinically assessing brain size are crude, consisting of head circumference and cranial facial ratios. These do not distinguish a large/thick calvaria and scalp from a large ICV and a large CSF volume from a large BPV. Comparison of tissue volumes using synthetic MR imaging can easily and rapidly make these distinctions. Furthermore, quantitative longitudinal tracking is also readily accomplished.
During our secondary review, in 16 subjects, the radiologist thought that the intracranial contour should be adjusted to accurately reflect the ICV. The normative curves were created by using manually corrected data for these subjects. Correcting the intracranial contour is easy to accomplish, but it is a nuisance when interpreting examinations clinically. The resulting changes in the observed volumes were <1%, which we think is clinically insignificant and within the range of variability reported by other segmentation algorithms25 and small in comparison with the width of the current confidence bands. Therefore, adjustment during clinical practice will rarely be necessary and only in borderline cases.
Synthetic MR imaging is a relatively new method of image acquisition and analysis and will continue to undergo modification as the technique matures. Segmentation algorithms and tissue look-up tables may be improved with future releases, with slightly different volumetric results for a given dataset. Therefore, the subject being clinically assessed should be analyzed with the same software version used to create the nomograms.
There are some limitations to the present study. As opposed to categoric voxel assignment, synthetic MR imaging segmentation uses a partial volume tissue model, which reduces the partial volume errors introduced by low-resolution images and accounts for the complex anatomy and heterogeneity of intracranial tissues.10,26,27 As a result, although our resolution is lower than that in other segmentation techniques, the resultant volumetric nomogram curves are very like those that have been published previously.22
This data base was compiled from a retrospective review of clinical examinations. The patients in this data base had symptoms warranting neuroimaging, and in that context, they were not completely healthy; however, the exclusion process was extensive. We understand the advantages of developing nomograms using clinically healthy subjects; however, there are challenges. Most notably, the required sedation of healthy pediatric subjects is ethically dubious; subsequently, few articles have data in the 1- to 4-year age group.28 Several articles included patients in the perinatal period,19,29 a time when subjects do not require sedation, while others have used a mixed subject pool with 3-month to 2-year-old patients and healthy volunteers for the older age groups.22
Although respectable, our sample size of 122 subjects is small in comparison with the sample sizes that number in the thousands used for the development of the CDC growth charts.30 Larger sample sizes are desirable to define percentiles with appropriate precision for each age group, most important for the outlying percentiles.31 Larger sample sizes will also allow detailed sex-specific nomograms.
The use of SyMRI segmentation is promising for routine clinical use; however, there is need for further study. Improved segmentation algorithms are needed for patients younger than 18 months of age. The sensitivity and specificity to identify abnormalities using this method need to be determined, and a larger dataset of healthy patients would be of benefit.
Conclusions
We present the implementation of rapid segmentation of intracranial content using synthetic MR imaging in children. The compiled pediatric data base of normal intracranial tissue volumes using this technique correlates with previously published data and may provide a framework for more quantitative clinical interpretation of MR images during development. Improved age-based segmentation algorithms in young children are needed.
Supplementary Material
ABBREVIATIONS:
- BPF
brain parenchymal fraction
- BPV
brain parenchymal volume
- ICV
intracranial volume
- MY
myelin
- MYF
myelin fraction
- PD
proton density
- QMAP
quantitative map
- R1
1/T1
- R2
1/T2
Footnotes
Disclosures: Blaise Jones—RELATED: Support for Travel to Meetings for the Study or Other Purposes: SyMRI, Comments: They reimbursed me for travel expenses to Maryland to describe my experience with the software to the FDA.
References
- 1. Barkovich AJ, Kjos BO, Jackson DE Jr, et al. Normal maturation of the neonatal and infant brain: MR imaging at 1.5 T. Radiology 1988;166:173–80 10.1148/radiology.166.1.3336675 [DOI] [PubMed] [Google Scholar]
- 2. Despotović I, Goossens B, Philips W. MRI segmentation of the human brain: challenges, methods, and applications. Comput Math Methods Med 2015;2015:450341 10.1155/2015/450341 [DOI] [PMC free article] [PubMed] [Google Scholar]
- 3. Jenkinson M, Beckmann CF, Behrens TE, et al. FSL. Neuroimage 2012;62:782–90 10.1016/j.neuroimage.2011.09.015 [DOI] [PubMed] [Google Scholar]
- 4. Fischl B. FreeSurfer. Neuroimage 2012;62:774–81 10.1016/j.neuroimage.2012.01.021 [DOI] [PMC free article] [PubMed] [Google Scholar]
- 5. Brewer JB. Fully-automated volumetric MRI with normative ranges: translation to clinical practice. Behav Neurol 2009;21:21–28 10.1155/2009/616581 [DOI] [PMC free article] [PubMed] [Google Scholar]
- 6. Ahdidan J, Raji CA, DeYoe EA, et al. Quantitative neuroimaging software for clinical assessment of hippocampal volumes on MR imaging. J Alzheimers Dis 2016;49:723–32 10.3233/JAD-150559 [DOI] [PMC free article] [PubMed] [Google Scholar]
- 7. Warntjes JB, Leinhard OD, West J, et al. Rapid magnetic resonance quantification on the brain: optimization for clinical usage. Magn Reson Med 2008;60:320–29 10.1002/mrm.21635 [DOI] [PubMed] [Google Scholar]
- 8. Betts AM, Leach JL, Jones BV, et al. Brain imaging with synthetic MR in children: clinical quality assessment. Neuroradiology 2016;58:1017–26 10.1007/s00234-016-1723-9 [DOI] [PubMed] [Google Scholar]
- 9. West H, Leach JL, Jones BV, et al. Clinical validation of synthetic brain MRI in children: initial experience. Neuroradiology 2017;59:43–50 10.1007/s00234-016-1765-z [DOI] [PubMed] [Google Scholar]
- 10. West J, Warntjes JB, Lundberg P. Novel whole brain segmentation and volume estimation using quantitative MRI. Eur Radiol 2012;22:998–1007 10.1007/s00330-011-2336-7 [DOI] [PubMed] [Google Scholar]
- 11. Warntjes M, Engström M, Tisell A, et al. Modeling the presence of myelin and edema in the brain based on multi-parametric quantitative MRI. Front Neurol 2016;7:16 10.3389/fneur.2016.00016/ [DOI] [PMC free article] [PubMed] [Google Scholar]
- 12. Van Leemput K, Maes F, Vandermeulen D, et al. A unifying framework for partial volume segmentation of brain MR images. IEEE Trans Med Imaging 2003;22:105–19 10.1109/TMI.2002.806587 [DOI] [PubMed] [Google Scholar]
- 13. Andica C, Hagiwara A, Nakazawa M, et al. The advantage of synthetic MRI for the visualization of early white matter change in an infant with Sturge-Weber syndrome. Magn Reson Med Sci 2016;15:347–48 10.2463/mrms.ci.2015-0164 [DOI] [PMC free article] [PubMed] [Google Scholar]
- 14. Andica C, Hagiwara A, Nakazawa M, et al. Synthetic MR imaging in the diagnosis of bacterial meningitis. Magn Reson Med Sci 2017;16:91–92 10.2463/mrms.ci.2016-0082 [DOI] [PMC free article] [PubMed] [Google Scholar]
- 15. Ragan DK, Cerqua J, Nash T, et al. The accuracy of linear indices of ventricular volume in pediatric hydrocephalus: technical note. J Neurosurg Pediatr 2015;15:547–51 10.3171/2014.10.PEDS14209 [DOI] [PMC free article] [PubMed] [Google Scholar]
- 16. Dean DC 3rd, O'Muircheartaigh J, Dirks H, et al. Characterizing longitudinal white matter development during early childhood. Brain Struct Funct 2015;220:1921–33 10.1007/s00429-014-0763-3 [DOI] [PMC free article] [PubMed] [Google Scholar]
- 17. Wilke M, Krägeloh-Mann I, Holland SK. Global and local development of gray and white matter volume in normal children and adolescents. Exp Brain Res 2007;178:296–307 10.1007/s00221-006-0732-z [DOI] [PMC free article] [PubMed] [Google Scholar]
- 18. Wilke M, Schmithorst VJ, Holland SK. Normative pediatric brain data for spatial normalization and segmentation differs from standard adult data. Magn Reson Med 2003;50:749–57 10.1002/mrm.10606 [DOI] [PubMed] [Google Scholar]
- 19. Gilmore JH, Lin W, Prastawa MW, et al. Regional gray matter growth, sexual dimorphism, and cerebral asymmetry in the neonatal brain. J Neurosci 2007;27:1255–60 10.1523/JNEUROSCI.3339-06.2007 [DOI] [PMC free article] [PubMed] [Google Scholar]
- 20. Jernigan TL, Tallal P. Late childhood changes in brain morphology observable with MRI. Dev Med Child Neurol 1990;32:379–85 [DOI] [PubMed] [Google Scholar]
- 21. Jernigan TL, Trauner DA, Hesselink JR, et al. Maturation of human cerebrum observed in vivo during adolescence. Brain 1991;114(pt 5):2037–49 10.1093/brain/114.5.2037 [DOI] [PubMed] [Google Scholar]
- 22. Groeschel S, Vollmer B, King MD, et al. Developmental changes in cerebral grey and white matter volume from infancy to adulthood. Int J Dev Neurosci 2010;28:481–89 10.1016/j.ijdevneu.2010.06.004 [DOI] [PubMed] [Google Scholar]
- 23. Pfefferbaum A, Mathalon DH, Sullivan EV, et al. A quantitative magnetic resonance imaging study of changes in brain morphology from infancy to late adulthood. Arch Neurol 1994;51:874–87 10.1001/archneur.1994.00540210046012 [DOI] [PubMed] [Google Scholar]
- 24. Reiss AL, Abrams MT, Singer HS, et al. Brain development, gender and IQ in children: a volumetric imaging study. Brain 1996;119(pt 5):1763–74 10.1093/brain/119.5.1763 [DOI] [PubMed] [Google Scholar]
- 25. Courchesne E, Chisum HJ, Townsend J, et al. Normal brain development and aging: quantitative analysis at in vivo MR imaging in healthy volunteers. Radiology 2000;216:672–82 10.1148/radiology.216.3.r00au37672 [DOI] [PubMed] [Google Scholar]
- 26. Shattuck DW, Sandor-Leahy SR, Schaper KA, et al. Magnetic resonance image tissue classification using a partial volume model. Neuroimage 2001;13:856–76 [DOI] [PubMed] [Google Scholar]
- 27. Bonar DC, Schaper KA, Anderson JR, et al. Graphical analysis of MR feature space for measurement of CSF, gray-matter, and white-matter volumes. J Comput Assist Tomogr 1993;17:461–70 10.1097/00004728-199305000-00024 [DOI] [PubMed] [Google Scholar]
- 28. Zhang L, Thomas KM, Davidson MC, et al. MR quantitation of volume and diffusion changes in the developing brain. AJNR Am J Neuroradiol 2005;26:45–49 [PMC free article] [PubMed] [Google Scholar]
- 29. Hüppi PS, Warfield S, Kikinis R, et al. Quantitative magnetic resonance imaging of brain development in premature and mature newborns. Ann Neurol 1998;43:224–35 10.1002/ana.410430213 [DOI] [PubMed] [Google Scholar]
- 30. Kuczmarski RJ, Ogden CL, Guo SS, et al. CDC Growth Charts for the United States: methods and development. Vital Health Stat 1 2002:1–190 [PubMed] [Google Scholar]
- 31. Guo SS, Roche AF, Chumlea WC, et al. Statistical effects of varying sample sizes on the precision of percentile estimates. Am J Hum Biol 2000;12:64–74 [DOI] [PubMed] [Google Scholar]
- 32. Olmos-Serrano JL, Kang HJ, Tyler WA, et al. Down syndrome developmental brain transcriptome reveals defective oligodendrocyte differentiation and myelination. Neuron 2016;89:1208–22 10.1016/j.neuron.2016.01.042 [DOI] [PMC free article] [PubMed] [Google Scholar]
- 33. Becker L, Mito T, Takashima S, et al. Growth and development of the brain in Down syndrome. Prog Clin Biol Res 1991;373:133–52 [PubMed] [Google Scholar]
- 34. Wisniewski KE, Schmidt-Sidor B. Postnatal delay of myelin formation in brains from Down syndrome infants and children. Clin Neuropathol 1989;8:55–62 [PubMed] [Google Scholar]
- 35. Boespflug-Tanguy O. Inborn errors of brain myelin formation. Handb Clin Neurol 2013;113:1581–92 10.1016/B978-0-444-59565-2.00027-7 [DOI] [PubMed] [Google Scholar]
Associated Data
This section collects any data citations, data availability statements, or supplementary materials included in this article.


