Abstract
BACKGROUND AND PURPOSE:
A comprehensive parameter model was developed to investigate correlations between cerebral hemodynamics and alterations in the extracranial venous circulation due to posture changes and/or extracranial venous obstruction (stenosis). The purpose of this work was to validate the simulation results by using MR imaging and echo-color Doppler experimental blood flow data in humans.
MATERIALS AND METHODS:
To validate the model outcomes, we used supine average arterial and venous extracerebral blood flow, obtained by using phase-contrast MR imaging from 49 individuals with stenosis in the acquisition plane at the level of the disc between the second and third vertebrae of the left internal jugular vein, 20 with stenosis in the acquisition plane at the level of the disc between the fifth and sixth vertebrae of the right internal jugular vein, and 38 healthy controls without stenosis. Average data from a second group of 10 healthy volunteers screened with an echo-color Doppler technique were used to evaluate flow variations due to posture change.
RESULTS:
There was excellent agreement between experimental and simulated supine flows. Every simulated CBF fell inside the standard error from the corresponding average experimental value, as well as most of the simulated extracerebral arterial flow (extracranial blood flow from the head and face, measured at the level of the disc between second and third vertebrae) and venous flows. Simulations of average jugular and vertebral blood flow variations due to a change of posture from supine to upright also matched the experimental data.
CONCLUSIONS:
The good agreement between simulated and experimental results means that the model can correctly reproduce the main factors affecting the extracranial circulation and could be used to study other types of stenotic conditions not represented by the experimental data.
Cerebral hemodynamics plays a key role in brain physiology.1 The interest in understanding the hemodynamics of the brain arises from human brain function being critically dependent on the proper values of cerebral blood inflow and outflow.2 Unfortunately, experimental access to cerebral circulation dynamics is limited.
Within the complex problem of cerebral hemodynamics, the cerebral venous system plays an important role. Indeed, cranial and extracranial veins form an intricate network of vessels, stressed by complex phenomena involving postural changes and the gravity field, which affect the dynamics of circulating blood.2 In particular, the internal jugular vein (IJV), which is the dominant outflow vein from the brain,3 is a collapsible vessel characterized by marked changes in its cross-sectional area, depending on transmural pressure on the vessel wall.4,5 Section changes, in turn, affect its conductance. The overall phenomenon is influenced by the hydrostatic pressure gradient during the transition from the supine to sitting position.6,7
Due to the plethora of biophysical factors affecting brain circulation, it is difficult to gain an accurate quantitative understanding of its behavior and of the clinical implications of its alteration.
Recently, we developed a comprehensive lumped parameter model that links intracranial hemodynamics and the cerebral venous outflow system.8 Its aim is to simulate the cranial and extracranial vessel pathway behavior and the mechanisms involved in the drainage process and to link them with the intracranial circulation and the action of cerebrovascular regulation mechanisms. The model represents a new tool for improving our understanding of this complex system.
The aim of this work was to provide a validation of the model, by using in vivo measurements performed in both healthy subjects and individuals with venous obstruction. We illustrate how the model parameters can be tuned to reproduce MR imaging and echo-color Doppler (ECD) data of average blood flow. With this model, we can simulate some important phenomena affecting the extracranial venous system, such as the posture change or the presence of jugular obstructions (stenosis).9,10 We took advantage of the availability of both MR imaging and ECD experimental data of blood flow to exploit the different advantages they provide. MR imaging includes phase-contrast imaging for flow quantification, along with 2D (TOF) MRV for anatomic assessment.11–13 MR imaging–based techniques allow the inclusion of information about minor vessels besides the common carotid, internal carotid, and vertebral arteries; IJVs; and vertebral veins. The ECD technique,14 even if not useful for detecting minor routes, is a cheaper and faster methodology, suitable for measurement of blood flow in both the supine and upright conditions. We used ECD to obtain information about the percentage variation of average flows due to a change of posture.
Materials and Methods
Model Description
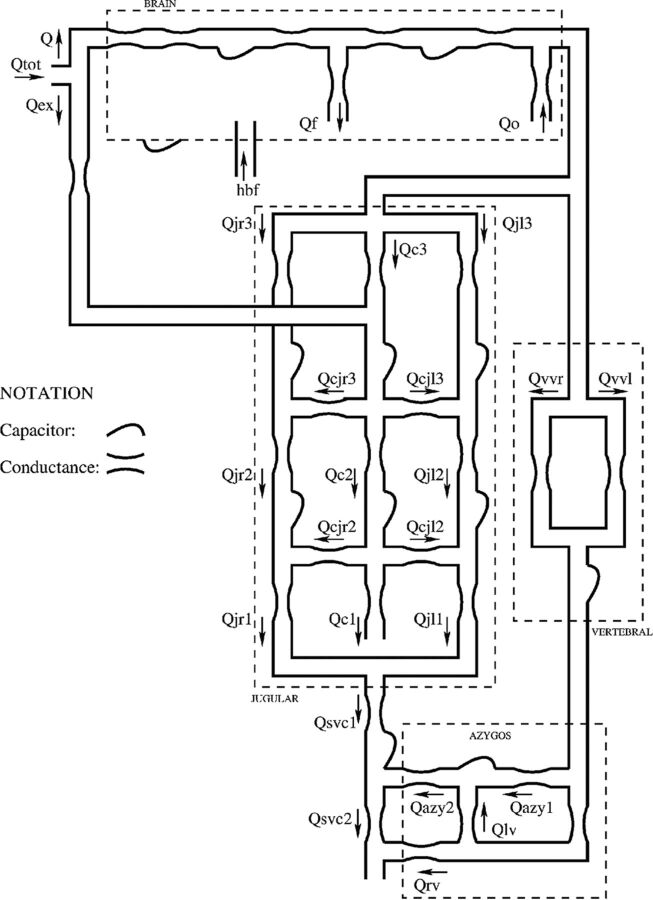
The mathematic model has been presented in a previous article.8 Briefly, it is composed of 2 submodels built by using a compartmental method, a technique that simplifies distributed physical systems into a topology of discrete entities (ie, lumped parameters).15 This approximation entails an important advantage because it allows complex systems to be represented with a relatively small number of parameters, each able to account for an entire physiologic or clinical characteristic in a concise way. The hemodynamic model for the study of cerebral venous outflow is represented in Fig 1, in which every segment is a vessel or part of it.
Fig 1.
Scheme of the hemodynamic parameter model for the study of cerebral venous outflow.8
The intracranial part of the model, developed by Ursino and Lodi,16 is enclosed in the brain box. The extracranial part, developed starting from the work of Zamboni et al17 and Gadda et al,8 is outside it. Every segment x of Fig 1 consists of a hydraulic capacity (capacity of the generic segment x of the circulatory system) and a conductance (conductance of the generic segment x of the circulatory system); capacities simulate the property to accommodate volume,18 while conductances simulate the property to drain blood.15 All these parameters are included in the differential equations that compose the model.8 Differential equations link together simulated blood flows, pressures, and time, accounting for mass preservation, energy losses, and effects due to posture changes.4–7 The system of equations is managed by the software package Berkeley Madonna (http://www.berkeleymadonna.com).19,20
The mathematic submodel of the cerebral circulation simulates the hemodynamics of the arteriovenous cerebrovascular bed and the related mechanisms (regulation activity of cerebral arterioles, CSF production and reabsorption processes, the Starling resistor mechanism for the cerebral veins2).
The extracranial outflow submodel is composed of left and right IJVs, the vertebral system (VV), and the lumboazygos system. The biomechanical properties of the IJVs change along their lengths, because in the upright position, they act like collapsible tubes interacting with the hydrostatic pressure gradient.4–7 Thus, the IJVs are modeled by dividing them into 3 segments (J3, J2, and J1, starting from the upper segment)21 with different capacitive values and conductances switching from low to high values following a nonlinear relation of the transmural pressure.8
The segmentation of IJVs also makes the model a good tool to easily simulate how different stenotic patterns affect blood redistribution on the left and right sides of the jugular system.9 We know that blood flow is not the same in the right and left IJVs and that both of these flows increase from J3 to J1 in normal conditions (physiologic pressure, absence of stenosis), because a quota of the head inflow is conveyed into the IJVs more caudally with respect to the brain vascular junctions.17,22 To account for this behavior, we developed the model so that the IJVs are linked by a network of segments, each with constant capacitance and conductance, which simulates the presence of anastomotic connections between the IJVs, and by a connection segment with extracranial venous pathways (ie, with that part of the blood coming from the external arteries to serve the tissues outside the brain).
MR Imaging Data for Flow Quantification
One hundred seven subjects were imaged with 3T MR imaging scanners at 4 imaging sites by using a 3T Signa HDxt scanner (GE Healthcare, Milwaukee, Wisconsin) with a 12-channel head/neck coil arrangement (site 1 [Newport Diagnostic Center, Newport Beach, California]), a 3T Trio scanner (Siemens, Erlangen, Germany) (sites 2 [Applied fMRI Institute, San Diego, California] and 3 [Synergy Health Concepts, Newport Beach, California]), and a 3T Verio scanner (Siemens) (site 4 [Wayne State University, Detroit Michigan]) with a 16-channel head/neck coil arrangement, after institutional review board approval. 2D (TOF) MRV was used to recognize vessels and stenosis, while phase-contrast imaging was used to quantify blood flow.11–13 The whole population was divided into 3 different subgroups: 38 subjects classified as nonstenotic (NST), 20 subjects with stenosis at the lower level of the right IJV (LL-R ST), and 49 subjects with stenosis at the upper level of the left IJV (UL-L ST). We identified a vessel as stenotic when its cross-sectional area was <25 mm2 at or caudal to the C3 level and <12.5 mm2 cranial to the C3 level.13 Venous vessel flows were measured through acquisition of phase-contrast images perpendicular to the IJVs at 2 levels: the upper level (C2/C3, at the disc between second and third vertebrae), and the lower level (C5/C6, at the disc between the fifth and sixth vertebrae). A maximum velocity encoding of 50 cm/s was used, and phase unwrapping was performed when the flow velocity exceeded this value. Vessel boundaries were delineated automatically by using a full width at half maximum region-growing threshold method23,24 with manual modification applied when appropriate. Signal Processing In NMR software (SPIN; MR Imaging Institute for Biomedical Research, Detroit, Michigan)25 was used to quantify blood flows and to evaluate the presence and dimensions of IJV stenosis. Data were processed by analysts trained in MR signal processing with several years' experience each.
For all the subjects, we calculated the cerebral blood flow (Q) (the total blood volume entering the cranial cavity per unit time, defined as the sum of flows in the internal carotid and vertebral arteries at the C2/C3 level). The amount of flow drained by the right and left IJV is measured at both the C2/C3 and C5/C6 levels (here referred to as blood flow drained by the upper segment of the right internal jugular vein [Qjr3], blood flow drained by the upper segment of the left internal jugular vein [Qjl3], blood flow drained by the middle segment of the right internal jugular vein [Qjr2], and blood flow drained by the middle segment of the left internal jugular vein [Qjl2], respectively). The fraction of cerebral blood flow exiting the skull from the vertebral system measured at the level of the disc between the second and third vertebrae (Qvv) is the fraction of Q exiting the skull from the vertebral system, measured at the C2/C3 level. Finally, we took into account the flow in the external carotid arteries (Qex, the amount of extracranial blood to the head and face, measured at the C2/C3 level). We chose to calibrate the model so that it reproduced these experimental flows.
ECD Data for Supine and Upright Flow Comparison
ECD data of 10 healthy volunteers from a recent work17 were used as a reference for the average blood flow variation from the supine condition to the upright one. We used those experimental data to assess the average percentage flow variation in the upright jugular and vertebral ducts with respect to the supine condition. Unlike other datasets available in the literature, these data allowed us to assess the supine/sitting variation for all 3 different segments for both left and right IJVs (J3, J2, and J1, respectively), recently established by a recent scientific consensus.21 We chose to calibrate the model so that it reproduced upright-to-supine percentage variation of total jugular (blood flow drained by the upper segment of the internal jugular veins [Qj3] = Qjr3 + Qjl3, blood flow drained by the middle segment of the internal jugular veins [Qj2] = Qjr2 + Qjl2, blood flow drained by the lower segment of the internal jugular veins [Qj1] = blood flow drained by the lower segment of the right internal jugular vein [Qjr1] + blood flow drained by the lower segment of the left internal jugular vein [Qjl1]) and vertebral (Qvv) flow.
Assignment of Model Parameters
All parameters of the intracranial circulation have been taken from previous articles, where an accurate description can be found.8,16 Parameters of the extracranial venous circulation were calculated to reproduce the average blood flow values measured with MR imaging only in the supine position. In particular, as described in Gadda et al,8 the tuning was made by assuming a progressive pressure reduction from the venous sinuses (6 mm Hg) to the right atrium (5 mm Hg). Then, we properly tuned the model conductances (Table 1) to reproduce the supine average flows in each portion of the model (Table 2). Finally, the supine/upright percentage variations detected with the ECD technique (Table 3) were used to assign conductance to the anastomoses not directly involved in supine conditions.
Table 1:
List of the conductance values to reproduce the average flow data reported in Table 2 and the flow percentage variation reported in Table 3
| G (mL/s × mm Hg) | NST | LL-R ST | UL-L ST |
|---|---|---|---|
| A) | |||
| Gvv1 | 0.60 | 3.9 | 7.7 |
| kjl3 | 6.00 | 6.00 | 0.86 |
| kjr2 | 16.00 | 2.30 | 16.00 |
| B) | |||
| Gc2 | 11.00 | ||
| Gc3 | 21.43 | ||
| Gcjl2 | 6.67 | ||
| Gcjl3 | 16.00 | ||
| Gazy1 | 1.33 | ||
| Gazy2 | 1.78 | ||
| Gc1 | 1.18 | ||
| Gcjr2 | 6.67 | ||
| Gcjr3 | 21.00 | ||
| Gex | 0.03 | ||
| Glv | 0.89 | ||
| Grv | 0.41 | ||
| Gsvc1 | 78.50 | ||
| Gsvc2 | 81.17 | ||
| Gvv2 | 0.83 | ||
| kjl1 | 7.27 | ||
| Kjl2 | 8.00 | ||
| kjr1 | 7.27 | ||
| Kjr3 | 13.00 |
Note:—G indicates conductance; Gvvl, conductance of the vertebral system (upper part); kjl3, parameter for the basal conductance of the upper segment of the left jugular vein; Gazy1, conductance of the distal azygos vein; Gazy2, conductance of the proximal azygos vein; Gc1, conductance of the lower segment of the collateral network; Gc2, conductance of the middle segment of the collateral network; Gc3, conductance of the upper segment of the collateral network; Gcjl2, conductance of the lower anastomotic connection (left side); Gcjl3, conductance of the upper anastomotic connection (left side); Gcjr2, conductance of the lower anastomotic connection (right side); Gcjr3, conductance of the upper anastomotic connection (right side); Gex, conductance of the external carotid arteries; Glv, conductance of the lumbar vein; Grv, conductance of the renal vein; Gsvc1, conductance of the upper segment of the superior vena cava (jugular confluence); Gsvc2, conductance of the lower segment of the superior vena cava; Gvv2, conductance of the vertebral system (lower part); kjl1, parameter for the basal conductance of the lower segment of the left jugular vein; kjl2, parameter for the basal conductance of the middle segment of the left jugular vein; kjr1, parameter for the basal conductance of the lower segment of the right jugular vein; kjr3, parameter for the basal conductance of the upper segment of the right jugular vein; kjr2, middle segment of the right jugular vein.
Table 2:
MRI average data of flows related to cerebral, external, jugular, and vertebral circuits in the supine conditiona
| MRI | n | Q | Qex | Qjr3 | Qjl3 | Qjr2 | Qjl2 | Qvv |
|---|---|---|---|---|---|---|---|---|
| NST | 38 | 10.6 ± 1.6 | 2.8 ± 1.2 | 5.6 ± 2.1 | 3.1 ± 1.8 | 7.1 ± 2.4 | 4.4 ± 1.9 | 0.5 ± 0.6 |
| LL-R ST | 20 | 10.7 ± 1.8 | 3.0 ± 1.1 | 3.5 ± 2.5 | 4.0 ± 2.1 | 3.6 ± 2.7 | 4.7 ± 2.6 | 1.8 ± 1.6 |
| UL-L ST | 49 | 10.6 ± 1.8 | 3.2 ± 1.2 | 6.1 ± 2.5 | 0.8 ± 0.9 | 7.5 ± 2.1 | 2.1 ± 1.7 | 2.0 ± 1.6 |
Flow values are reported in milliliters/second with SDs.
Table 3:
ECD average data of flow related to cerebral, jugular, and vertebral circuits in the supine NST conditiona
| ECD | Q | Qj3 | Qj2 | Qj1 | Qvv |
|---|---|---|---|---|---|
| Supine | 10.6 ± 1.9 | 6.0 ± 2.6 | 8.9 ± 3.4 | 22.0 ± 10.3 | 1.1 ± 0.7 |
| Upright | 10.6 ± 1.9 | 4.1 ± 2.0 | 5.2 ± 3.3 | 20.4 ± 12.5 | 2.3 ± 1.2 |
| Variation (%) | 0 | −32 | −42 | −7 | +109 |
Flow values are reported in milliliters/second with SDs.
To simulate patients with stenosis at the lower level of the right internal jugular vein (LL-R ST) and stenosis at the upper level of the left internal jugular vein (UL-L ST), some parameters must be changed from the basal value assigned before. We decided to maintain these parameters to a minimum, to reduce the number of ad hoc assumptions. Hence, patients with LL-R ST were characterized by a reduction in conductance of the right J2 tract (obtained through a reduction in the parameter for the basal conductance of the middle segment of the right jugular vein [kjr2]), while patients with UL-L ST were characterized by a reduction in conductance of the left J3 tract (obtained through a reduction in parameter for the basal conductance of the upper segment of the left jugular vein [kjl3]). Both parameters were diminished by the same percentage variation, to fit the patient data. Finally, we assumed that the venous vascular bed compensates the chronic stenotic phenomena via an increase in the conductance of the vertebral path (parameter Gvv). This step-by-step optimization procedure (assumption of progressive pressure reduction, choice of proper conductances of large vessels to simulate supine NST flows, choice of proper conductances of anastomoses to simulate upright NST flows, variation of NST conductances to simulate vessel blockages and flows of stenotic cases) ensures that model solutions fit both healthy and stenotic flow outcomes with a unique set of parameters.
Finally, we are aware that the model has many parameters, so the solution may not be unique. However, we introduce some strong constraints to our model, such as physiologic values for pressure or change of conductances only in the vertebral segment and in the jugular segments affected by stenosis, to reduce the df in the parameter choice.
Results
Model Parameters
Table 1 reports the conductances that have been calculated to reproduce experimental flow data. Conductances that must be changed to reproduce differences among normal and stenotic subjects are listed in Table 1 part A, while unchanged conductances are listed in Table 1, part B.
To properly simulate LL-R ST average flow data, we needed to decrease the conductance of the right J2 segment with respect to the NST case (−86%). The same percentage variation is needed in the left J3 segment to reach good simulations of the UL-L ST cases. In both situations, we also needed to considerably increase the conductance of the upper part of the vertebral system (Gvv1).
Comparison between Supine MR Imaging Data and Model Outcomes
Table 2 summarizes the calculated average blood flows Q, Qex, Qjr3, Qjl3, Qjr2, Qjl2, and Qvv for every subgroup.
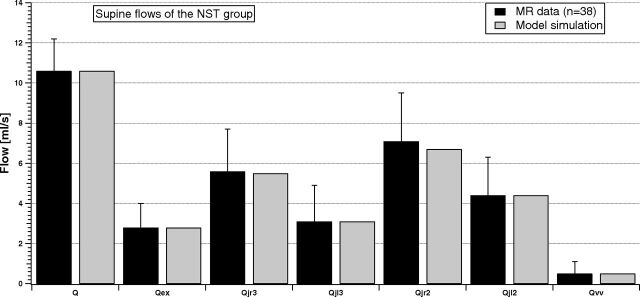
Figure 2 shows how the model simulates these flows at the equilibrium for the NST group.
Fig 2.
Comparison between supine MR imaging data (dark columns) and model simulation (light columns) of the NST group.
Every jugular segment carries more flow than VV. In addition, average blood flow in the right IJV is greater than in the left one, for both C2/C3 and C5/C6 levels (Qjr3 > Qjl3 and Qjr2 > Qjl2). Finally, average jugular flow increases from the upper to lower levels (Qjr2 > Qjr3 and Qjl2 > Qjl3). The model (light columns) properly reproduces the behavior of experimental flow. Indeed, all the simulations match the average values of the dataset.
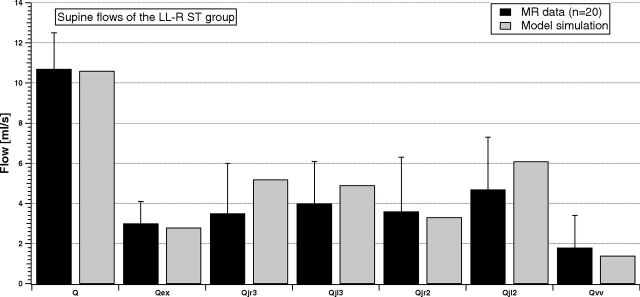
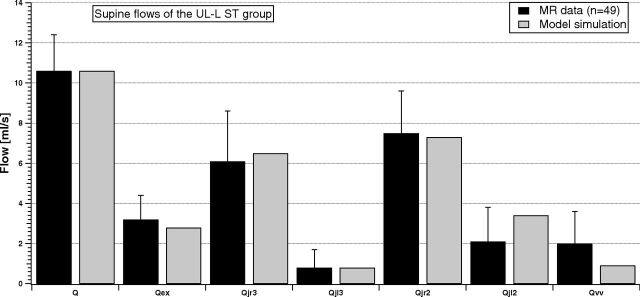
Figures 3 and 4 compare the same flow for the LL-R ST and UL-L ST groups.
Fig 3.
Comparison between supine MR imaging data (dark columns) and model simulation (light columns) of the LL-R ST group.
Fig 4.
Comparison between supine MR imaging data (dark columns) and model simulation (light columns) of the UL-L ST group.
Average inflows of the 2 stenotic groups (Q and Qex) are similar to the NST inflows. Conversely, the average outflow behavior described in Fig 2 is now modified due to the presence of stenosis. Qvv is increased with respect to the NST case, being also sometimes greater or comparable with the flow in the IJV segments. The right-left IJV dominance is impaired, being the difference between average flows lost for the LL-R ST group (Qjr3 ≈ Qjl3 and Qjr2 < Qjl2) or markedly increased for the UL-L ST group (Qjr3 ≫ Qjl3 and Qjr2 ≫ Qjl2). The light columns in Figs 3 and 4 show that the model outcomes can also reproduce these situations.
Comparison between ECD Data and Model Outcomes
Average blood flows Q, Qj3, Qj2, Qj1, and Qvv of 10 NST volunteers, measured by using the ECD technique, are reported in Table 3 with corresponding SDs. Table 3 also shows the percentage variations between the upright and supine flows. The absolute values reported in Table 3 may be affected by a proportional error, typical of the ECD technique, when moving from one tract to the next. Hence, we focused attention only on the percentage variations within each column.
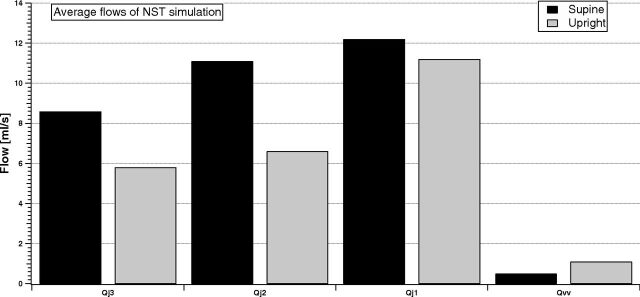
Figure 5 compares jugular (sum of left and right) and vertebral flows for the simulation of an NST subject, to point out the variation between supine and upright posture in the 2 brain drainage routes.
Fig 5.
Comparison between supine and upright simulated total jugular (sum of left and right) and vertebral average flows of the NST group. The percentage changes are −32.6%, −40.5%, −8.1%, and +120%, which fit those in Table 3 very well.
IJVs are the dominant drainage pathway of the brain, and jugular flow increases from J3 to J1, independent of the posture. When passing to upright, the model simulates a flow decrease in every tract of the IJVs, with increase of the vertebral flow. These results match the experimental evidence of percentage flow variation due to posture change summarized in Table 2.
Comparison between Supine and Upright Model Outcomes
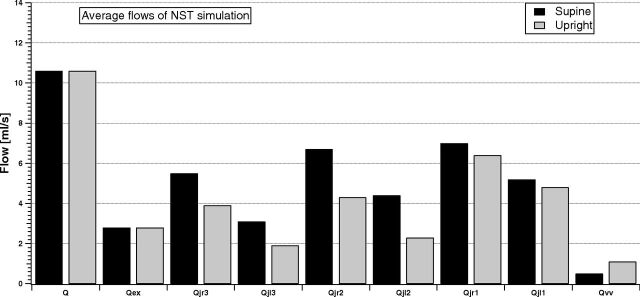
Figure 6 shows the model outcomes of the cerebral, external, jugular (left and right), and vertebral average flow in the supine and upright conditions for the NST group.
Fig 6.
Model simulation of the cerebral, external, jugular (left and right), and vertebral average flows in supine and upright conditions for the NST group.
All jugular flows are reduced when the simulated NST subject is sitting, while the vertebral flow increases. Because this was a simulation of an NST condition, our aim was to reproduce the left-right dominance of the IJVs (Qjr3 > Qjl3, Qjr2 > Qjl2, and Qjr1 > Qjl1), the prevalence of the IJV pathways with respect to the VV, and the increase of jugular flow from J3 to J1 (Qjr1 > Qjr2 > Qjr3 and Qjl1 > Qjl2 > Qjl3). Figure 6 shows that simulation results satisfy all these requirements.
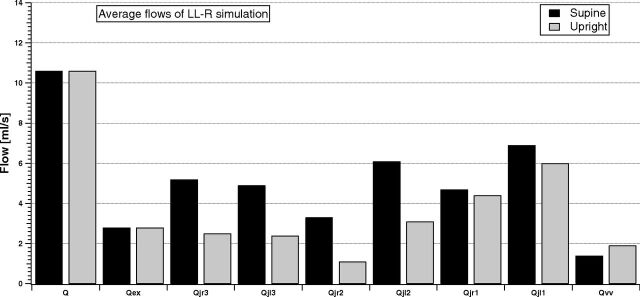
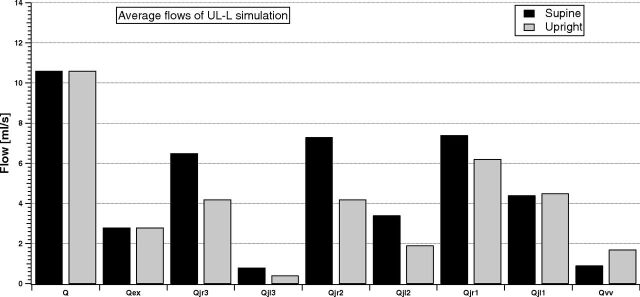
Figures 7 and 8 compare the same simulated average flows for the LL-R ST and UL-L ST cases.
Fig 7.
Model simulation of the cerebral, external, jugular (left and right), and vertebral average flows in the supine and upright condition for the LL-R ST group.
Fig 8.
Model simulation of the cerebral, external, jugular (left and right), and vertebral average flows in the supine and upright condition for the UL-L ST group.
Q and Qex are not affected by the presence of stenosis. Thus, the cerebral autoregulatory mechanisms properly overcome the nonphysiologic conditions occurring downstream from the brain. Conversely, both LL-R ST and UL-L ST affect the outflow pathways. The VV carries more blood than in the NST simulation, also being comparable with some jugular segments. The left-right dominance is highlighted during simulation of the UL-L ST condition, while it is lost during simulation of the LL-R ST condition. The increase in the IJV average blood flow from J3 to J1 is now lost in the right IJV for a LL-R ST condition, with Qjr2 lower than Qjr1 and Qjr3, both for supine and upright simulations.
Preliminary Results of Pressure Simulations
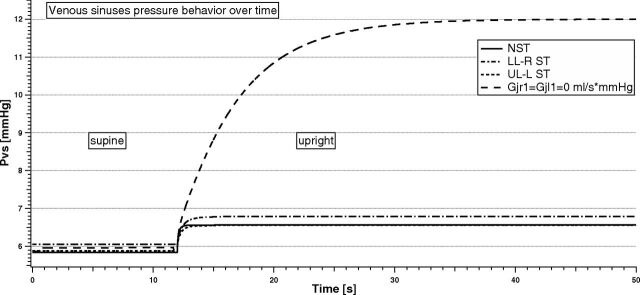
The model can simulate the variation of pressure as a function of time in every node of the hemodynamic circuit. One of the main consequences of a stenotic pattern on the intracranial equilibrium is a variation of pressure at the venous sinuses (Pvs),1 the link between the extracranial and intracranial circulation. Changes in this quantity can affect other intracranial parameters and thus the overall brain physiology.
Clinical evidence supports the results of increased pressure due to the occurrence of extracranial stenosis.26
Figure 9 shows the temporal variation of Pvs due to the change of postural condition in different situations (NST, LL-R ST, UL-L ST, and total occlusion of IJVs at the J1 level, respectively).
Fig 9.
Venous sinuses pressure behavior with time in the supine and upright simulations for different stenotic patterns.
There is no particular difference in Pvs values when a supine simulation is performed (range from 5.8 to 6.1 mm Hg). When they pass to upright, there is a slight increase of Pvs for the simulated NST, LL-R ST, and UL-L ST subjects (+0.7 mm Hg). Conversely, Pvs markedly increases (from 5.9 to 12.0 mm Hg) when a bilateral total obstruction occurs. The settling time for Pvs to reach a new equilibrium can be quite different depending on the type of stenosis. In particular, it is shorter for the NST simulation (0.5 seconds), while it is delayed in case of stenosis (1.5 seconds for UL-L ST, 2 seconds for LL-R ST, and 30 seconds for the bilateral total occlusion case simulated).
Discussion
It is difficult to have a complete and detailed overview of the blood flows circulating to and from the braincase. Several researchers have studied the cerebral hemodynamics and its relationship with extracranial anatomic and posture changes.27,28 First, average absolute values of blood flow could be considerably different among subjects because of physiologic variability. Second, due to the complex network of vessels and their variable interconnections, it is difficult to have a map of the circulation able to describe any specific case in detail. Third, there is insufficient knowledge of the relationships between flow alterations and the degree of occurrence of events such as postural changes or stenosis. Finally, even in a situation that does not have variability factors, the assessment of blood flow values can be difficult for several reasons.
The model presented here is tuned by using large datasets of subjects, to be more confident about the average hemodynamic condition of a given type of stenotic pattern.
We benefited from the use of MR imaging techniques to have a detailed map of the vessels and of the blood circulating in them. The drawback of MR imaging for this work is that only supine data are available, whereas ECD allows both supine and upright assessment. However, ECD does not allow the evaluation of minor vessels, and it has a bias related to the operator dependence that can lead to incorrect evaluations.
This model is an attempt to summarize a complex system in a simple picture, taking into account all the available data for obtaining information not directly achievable with experimental noninvasive measurements, such as Pvs or intracranial pressure, very important for checking the status of the intracranial environment and, hopefully, for preventing neurologic diseases.
The model is built by using lumped elements, to summarize the different segments of the vascular system and reproduce experimental flows with a finite and easily tunable number of parameters. Such flows are the average of experimental measurements on several subjects (Tables 2 and 3), so we are confident that the model parameters reproduce a statistically significant circulatory behavior, including different clinical conditions (NST or a given stenotic pattern). The convergence of the model presented in this work has been investigated with all the experimental flows reported in Tables 2 and 3—that is, we checked that average flows reported in such tables are the mean value of Gaussian-like datasets. Therefore, we are confident that the model simulates the average condition of normal distributions of flow.
A fundamental model assumption is the existence of anastomotic connections between the left and right IJVs. These vessels are not measured, but they are necessary to explain the increase of flow along every nonstenotic IJV (Tables 2 and 3).
The model outcomes, after parameter tuning, are in excellent agreement with experimental supine average flow of the NST group (Fig 2). Indeed, all the main arterial and venous flows supplying the brain that we modeled fall inside the standard error from the corresponding experimental value. Moreover, model results satisfactorily match the supine/upright percentage variation in jugular and extrajugular pathways observed in a second group of 10 healthy controls (Fig 5). Therefore, we achieved the objective of tuning the model to reproduce an average healthy subject, from the point of view of the circulation.
Starting from the NST-tuned model, it is easy to reproduce pathologic conditions like the situations reported in Table 1. Such new simulations are obtained by changing some of the conductances to reproduce the MR imaging experimental flow data (Table 2). Results show that conductances are greatly reduced in the jugular stenotic area and increased in the vertebral pathway. This aspect could be an index of how the whole venous pattern is affected by the presence of a jugular stenosis. Indeed, the increase in the vertebral conductance may represent a chronic compensatory change performed to maintain adequate brain drainage to prevent cranial hypertension. This aspect is highlighted in Fig 9, where the temporal behavior of simulated Pvs with time is reported for different stenotic conditions. Intracranial autoregulatory mechanisms maintain cerebral blood flow at a physiologic value, both in supine and upright conditions (Figs 6–8). Pvs achieves a new equilibrium in a few seconds after the posture change. The situation is very different when IJVs are totally occluded, for example, at the lower part.
This model takes into account intracerebral mechanisms such as CSF circulation and the onset of IJV obstacles. Furthermore, a peculiar aspect of the model is the description of intracranial blood flow autoregulatory mechanisms that play a pivotal role in maintaining an adequate cerebral perfusion in the different simulated conditions. The study of venous blood flow changes in patients with partial or total impairment in cerebral autoregulation may be the subject of future model applications.
The model allows simulating the change of posture from supine to upright, and, as in the work of Gisolf et al,28 IJVs are divided into different segments to properly simulate the differences measured along the jugular length. In particular, we chose to divide IJVs into the 3 segments recently established in an international scientific consensus,21 to make the model easily comparable with the most recent and validated experimental results.
We modeled intra- and extracranial circulation, so that the whole system can predict whether and how the occurrence of extracerebral stenotic patterns affect the pressure equilibrium in the braincase during most of the human lifetime (sitting or standing), potentially leading to long-term diseases due to pressure imbalance.
A limitation of the model is related to the assessment of venous compliances. We need experimental measurements to properly assess vessel compliances and give more effectiveness to the time-dependence results of pressures (Fig 9).
In addition, a future development will be the analysis of other types of stenotic patterns, such as lower-level left and upper-level right IJV obstructions.
Conclusions
We have tuned a mathematic model for the brain-drainage simulation to predict the average cerebral drainage properties of a healthy (NST) human and of subjects affected by 2 different types of vascular diseases. The structure of the equations makes it possible to simulate the effects of changes in posture from the supine to upright position. Model outcomes can help relate blood flow redistributions to the type and degree of stenosis and evaluate quantitative assessment of the renewed intracranial pressure equilibrium.
ABBREVIATIONS:
- C2/C3
acquisition plane at the level of the disc between second and third vertebrae
- C5/C6
acquisition plane at the level of the disc between fifth and sixth vertebrae
- ECD
echo-color Doppler
- IJV
internal jugular vein
- LL-R ST
stenosis at the lower level of the right internal jugular vein
- NST
nonstenotic
- Pvs
venous sinuses pressure
- Q
cerebral blood flow
- Qex
extracranial blood flow from the head and face, measured at the level of the disc between second and third vertebrae
- UL-L ST
stenosis at the upper level of the left internal jugular vein
- VV
vertebral system
Footnotes
Disclosures: Sean Sethi—UNRELATED: Employment: Magnetic Resonance Innovations, Comments: MRI-related data processing, software testing and research. David T. Utriainen—UNRELATED: Consultancy: AbbVie*; Employment: Magnetic Resonance Innovations. *Money paid to the institution.
This study was partially supported by the Italian Ministry of Education, University and Research (MIUR Programme PRIN 2010–2011), grant No. 2010XE5L2R.
The rationale for this work was previously presented at: Annual International Conference of the IEEE Engineering in Medicine and Biology Society, August 25–29, 2015; Milan, Italy.
References
- 1. Beggs CB. Venous hemodynamics in neurological disorders: an analytical review with hydrodynamic analysis. BMC Med 2013;11:142 10.1186/1741-7015-11-142 [DOI] [PMC free article] [PubMed] [Google Scholar]
- 2. Schaller B. Physiology of cerebral venous blood flow: from experimental data in animals to normal function in humans. Brain Res Brain Res Rev 2004;46:243–60 [DOI] [PubMed] [Google Scholar]
- 3. Werner JD, Siskin GP, Mandato K, et al. Review of venous anatomy for venographic interpretation in chronic cerebrospinal venous insufficiency. J Vasc Interv Radiol 2011;22:1681–90; quiz 1691 10.1016/j.jvir.2011.08.018 [DOI] [PubMed] [Google Scholar]
- 4. Fung YC. Biomechanics: Circulation. New York: Springer-Verlag; 1997:206–43 [Google Scholar]
- 5. Kozlovsky P, Zaretsky U, Jaffa AJ, et al. General tube law for collapsible thin and thick-wall tubes. J Biomech 2014;47:2378–84 10.1016/j.jbiomech.2014.04.033 [DOI] [PubMed] [Google Scholar]
- 6. Cirovic S, Walsh C, Fraser WD, et al. The effect of posture and positive pressure breathing on the hemodynamics of the internal jugular vein. Aviat Space Environ Med 2003;74:125–31 [PubMed] [Google Scholar]
- 7. Alperin N, Lee SH, Sivaramakrishnan A, et al. Quantifying the effect of posture on intracranial physiology in humans by MRI flow studies. J Magn Reson Imaging 2005;22:591–96 [DOI] [PubMed] [Google Scholar]
- 8. Gadda G, Taibi A, Sisini F, et al. A new hemodynamic model for the study of cerebral venous outflow. Am J Physiol Heart Circ Physiol 2015;308:H217–31 10.1152/ajpheart.00469.2014 [DOI] [PubMed] [Google Scholar]
- 9. Zamboni P, Galeotti R, Menegatti E, et al. Chronic cerebrospinal venous insufficiency in patients with multiple sclerosis. J Neurol Neurosurg Psychiatry 2009;80:392–99 [DOI] [PMC free article] [PubMed] [Google Scholar]
- 10. Zaniewski M, Simka M. Biophysics of venous return from the brain from the perspective of the pathophysiology of chronic cerebrospinal venous insufficiency. Rev Recent Clin Trials 2012;7:88–92 [DOI] [PubMed] [Google Scholar]
- 11. Anderson CM, Edelman RR, Turski PA. Clinical Magnetic Resonance Angiography. New York: Raven Press; 1993 [Google Scholar]
- 12. Potchen EJ, Haacke EM, Siebert JE, et al. Magnetic Resonance Angiography: Concepts & Applications. St. Louis: Mosby-Year Book; 1993 [Google Scholar]
- 13. Haacke EM, Sethi SK, Jiang J, et al. The role of magnetic resonance imaging in assessing venous vascular abnormalities in the head and neck: a demonstration of cerebrospinal venous insufficiency in a subset of multiple sclerosis patients. Veins Lymphatics 2015;4:5012–20 [Google Scholar]
- 14. Novario R, Goddi A, Tanzi F, et al. Physics and technology of medical diagnostic ultrasound. La Rivista del Nuovo Cimento 2003;26:1–64 [Google Scholar]
- 15. Sorek S, Bear J, Karni Z. Resistances and compliances of a compartmental model of the cerebrovascular system. Ann Biomed Eng 1989;17:1–12 [DOI] [PubMed] [Google Scholar]
- 16. Ursino M, Lodi CA. A simple mathematical model of the interaction between intracranial pressure and cerebral hemodynamics. J Appl Physiol 1997;82:1256–69 [DOI] [PubMed] [Google Scholar]
- 17. Zamboni P, Sisini F, Menegatti E, et al. An ultrasound model to calculate the brain blood outflow through collateral vessels: a pilot study. BMC Neurol 2013;13:81–90 10.1186/1471-2377-13-81 [DOI] [PMC free article] [PubMed] [Google Scholar]
- 18. Kresch E. Compliance of flexible tubes. J Biomech 1979;12:825–39 [DOI] [PubMed] [Google Scholar]
- 19. Press WH, Teukolsky SA, Vetterling WT, et al. Numerical Recipes in C. New York: Cambridge University Press; 1992 [Google Scholar]
- 20. Berkeley Madonna: Modeling and Analysis of Dynamic Systems. http://www.berkeleymadonna.com. Accessed August 3, 2013.
- 21. Zamboni P, Morovic S, Menegatti E, et al. Screening for chronic cerebrospinal venous insufficiency (CCSVI) using ultrasound: recommendations for a protocol. Int Angiol 2011;30:571–97 [PubMed] [Google Scholar]
- 22. Chambers B, Chambers J, Churilov L, et al. Internal jugular and vertebral vein volume flow in patients with clinically isolated syndrome or mild multiple sclerosis and healthy controls: results from a prospective sonographer blinded study. Phlebology 2014;29:528–35 10.1177/0268355513505505 [DOI] [PubMed] [Google Scholar]
- 23. Jiang J, Kokeny P, Ying W, et al. Quantifying errors in flow measurement using phase contrast magnetic resonance imaging: comparison of several boundary detection methods. Magn Reson Imaging 2015;33:185–93 10.1016/j.mri.2014.10.009 [DOI] [PMC free article] [PubMed] [Google Scholar]
- 24. Kokeny P, Jiang J, Haacke EM. Assessing the effects of vessel segmentation boundary size on flow quantification error and comparing multiple automatic segmentation algorithms. In: Proceedings of the International Society for Magnetic Resonance in Medicine, Salt Lake City, Utah. April 20–26, 2013 [Google Scholar]
- 25. The Magnetic Resonance Institute for Biomedical Reasearch. http://www.mrimaging.com/category.103.html. Accessed January 11, 2016.
- 26. Zamboni P, Galeotti R. The chronic cerebrospinal venous insufficiency syndrome. Phlebology 2010;25:269–79 10.1258/phleb.2010.009083 [DOI] [PubMed] [Google Scholar]
- 27. Marcotti S, Marchetti L, Cecconi P, et al. An anatomy-based lumped parameter model of cerebrospinal venous circulation: can an extracranial anatomical change impact intracranial hemodynamics? BMC Neurol 2015;15:95 10.1186/s12883-015-0352-y [DOI] [PMC free article] [PubMed] [Google Scholar]
- 28. Gisolf J, van Lieshout JJ, van Heusden K, et al. Human cerebral venous outflow pathway depends on posture and central venous pressure. J Physiol 2004;560(pt 1):317–27 10.1113/jphysiol.2004.070409 [DOI] [PMC free article] [PubMed] [Google Scholar]


