

Abstract
BACKGROUND AND PURPOSE:
rtPA is an effective treatment for AIS, yet it is substantially underused due to the increased risk of HT. Recent work suggests that permeability-related information can be extracted from routine T2*-based perfusion images by measuring the rR of the contrast agent. Given that other T2*-based measures have recently been proposed, the purpose of this study was to evaluate 4 such permeability measures in identifying patients with AIS who will proceed to HT.
MATERIALS AND METHODS:
Eighteen patients with AIS were examined within a mean of 3.3 ± 1.4 hours postonset. Dynamic T2*-weighted imaging consisted of a single-shot EPI following a bolus of gadodiamide. HT was determined on follow-up CT or MR imaging at 24–72 hours. Mean values of rR, Peak Height, Recovery, as well as Slope were calculated and analyzed on the basis of follow-up HT status.
RESULTS:
Eight patients proceeded to HT. The mean rR for patients with HT was significantly greater than that for patients without HT (0.22 ± 0.06 versus 0.14 ± 0.06, P = .006), while there was a trend toward decreased %Recovery in patients with HT (76 ± 6 versus 82 ± 11%, P = .092). There was a significant negative correlation between %Recovery and rR (r = −0.88, P < .001). No significant differences or trends were detected with respect to Peak Height or Slope.
CONCLUSIONS:
Both rR and %Recovery can be readily extracted from a routine perfusion MR imaging dataset and show potential for identifying HT during the acute phase poststroke.
rtPA activator is an effective yet vastly underused treatment for AIS. A recent comprehensive audit of hospitals in Ontario, Canada revealed that <4% of patients with AIS received rtPA.1 The apprehension to administer rtPA is largely due to the increased risk of HT.2 Improving the safety of rtPA depends on finding a prospective means of identifying patients at high risk for this potentially fatal complication. Techniques capable of characterizing BBB integrity may prove particularly valuable in this regard, because there is a credible association between BBB disruption and HT.3,4 Studies performed both in rats5–7 and in patients with AIS8,9 have indicated that permeability imaging with T1-weighted DCE-MR imaging may offer a viable strategy for detecting BBB disruption in the early hours following stroke onset, with significant increases in permeability estimates corresponding to areas of subsequent HT.
Although the acute stroke MR imaging protocol at our institution currently includes a T1-weighted DCE-MR imaging sequence, this is considered an optional sequence, requiring a separate injection of contrast agent and pharmacokinetic modeling to obtain quantitative permeability estimates. Perfusion imaging with T2*-weighted MR imaging, however, is already a mainstay of most acute stroke protocols. This has encouraged some investigators to propose semiquantitative alternative measures that can be extracted from routine perfusion MR imaging data.10–16 The strategy common to most, if not all, of the T2*-based metrics considered to date (eg, in gliomas11,17 and, more recently, in AIS14–16) has been to isolate the recirculation phase of the ΔR2* versus time curve from the first-pass or intravascular phase. When BBB integrity becomes compromised, both the peak and recirculation phases of the associated ΔR2* versus time curves are effectively blunted by contrast-agent extravasation and the attendant T1 shortening. In fact, this was the rationale offered by Lupo et al11 when they proposed that the degree of contrast leakage should be reflected in both the maximum ΔR2* (Peak Height) and the extent of ΔR2* recovery (%Recovery), though these metrics have yet to be investigated in the AIS setting. A similar measure, rR,17 attempts to uncouple the intravascular and recirculation phases by fitting a theoretic first-pass curve to the ΔR2* versus time data and measuring the difference in area encompassed by the 2 curves. A study performed in patients with AIS within 4 hours of stroke onset suggested that rR may be a sensitive and specific predictor of HT and was strongly correlated with DCE-MR imaging estimates of BBB permeability in this setting.16 To the best of our knowledge, the only other published T2*-based measure of permeability in AIS is the so-called “negative slope” metric,14 in which the rate of change in ΔR2* during the terminal 10 seconds of a 60-second perfusion examination is used as a surrogate measure of BBB permeability. A retrospective analysis of 82 pretreatment scans showed that evidence of a negative slope was a highly specific predictor of HT.15
Given the growing interest in T2*-based permeability imaging in AIS, the primary goal of this study was to evaluate 4 candidate T2*-based measures simultaneously and to compare their relative performance in identifying patients with AIS who will proceed to HT. Second, we believe there is also a need to better elucidate the extent to which any of these putative metrics reflect microvascular permeability. To this end, we compared each of the 4 candidate T2*-based measures with the T1-based DCE-MR imaging permeability estimates obtained in the same group of patients with AIS.
Materials and Methods
Patient Population
This was a retrospective study of 18 patients (10 men, 8 women; 27–89 years of age; average age, 68.0 ± 17.5 years) with a working diagnosis of AIS and an NIHSS score of >3 who underwent MR imaging within a mean of 3 hours 18 minutes ± 1 hour 26 minutes from documented symptom onset (range, 1–7 hours). Diagnosis was based on clinical assessment and CT findings. All examinations described herein were conducted in accordance with our institution's guidelines for human research, and written informed consent was obtained from all participating subjects (or their substitute decision makers). Patients with a history of uncontrolled hypertension, seizure at onset of AIS, known bleeding diathesis, or abnormal glucose levels were excluded from the study, as were patients with evidence of intracranial hemorrhage or nonstroke lesions on initial CT. Eight patients received intravenous rtPA within a mean of 2 hours 26 minutes ± 57 minutes from symptom onset. The decision to initiate rtPA treatment occurred after the admission CT and before MR imaging. In 2 patients, the rtPA infusion was completed as early as 30 minutes before the MR imaging examination. In 6 patients, the rtPA infusion continued to be administered during the MR imaging examination. The time from stroke-onset to MR imaging for rtPA-treated patients was 2 hours 50 minutes ± 1 hour 17 minutes. The presence of HT was determined by follow-up CT and/or MR imaging 24–72 hours after initial imaging and was assessed by using the ECASS II grading system.18 These follow-up imaging sessions did not include angiography; therefore, recanalization rates were not available.
MR Imaging Protocol
MR imaging consisted of a comprehensive protocol designed for AIS, which included anatomic imaging, DWI, permeability assessment with T1-weighted DCE-MR imaging, perfusion assessment with dynamic T2*-weighted MR imaging, and, finally, contrast-enhanced MR angiography. DWI was performed with the following parameters: TR, 8000 ms; TE, 93.7 ms; FOV, 300 mm; matrix size, 128 × 96; section thickness, 5 mm; number of sections, 25–32; and b-values, 0 s/mm2 and 1000 s/mm2. Each patient received a total of 3 × 15 mL doses of gadodiamide (Omniscan formulation; GE Healthcare, Milwaukee, Wisconsin). Note that the current study describes data that were collected before the 2006 US Food and Drug Administration public health advisory statement regarding nephrogenic systemic fibrosis.19 Hence, this high-dose protocol is no longer used in patients with poor or uncertain renal status at our institution.
All examinations were performed on a clinical 1.5T MR imaging scanner (Signa Excite, GE Healthcare) equipped with EchoSpeed gradients and an 8-channel head coil. Before each imaging session, an intravenous line was introduced to accommodate the injection of MR imaging contrast media. Dynamic T2* imaging was always performed immediately on completion of the T1-weighted DCE scanning and consisted of a single-shot EPI acquisition with the following parameters: TR, 1725 ms; TE, 31.5 ms; FOV, 240 mm; matrix size, 96 × 64; flip angle, 90°; section thickness, 5 mm; and number of sections, 17. The total acquisition time for 50 dynamic scans was 86 seconds. Gadodiamide was injected as a bolus (15 mL) at a rate of 5 mL/s by using an MR power-injector (Spectris Solaris; Medrad, Pittsburgh, Pennsylvania) and was administered immediately following initiation of the EPI acquisition. T1-weighted DCE imaging was performed as described by Kassner et al.9 The bolus of gadodiamide that was administered for T1-weighted DCE imaging (ie, the first bolus) was injected at the same dose and rate of injection as those for dynamic T2* imaging, except that it was injected with a delay of 30 seconds after the start of the DCE acquisition.
Image Analysis
All image data were transferred to an independent workstation and analyzed off-line by using in-house software (MR Analyst, Version 4.0) developed in Matlab, Version 7.3 (MathWorks, Natick, Massachusetts). Each dynamic T2*- and T1-weighted data series was coregistered to its first dynamic phase. DWIs with b = 0, 1000 s/mm2 were converted to ADC maps, and areas of ischemia were identified by visual inspection as regions of reduced diffusion relative to normal cortex on ADC maps. We defined the first of 2 regions of interest within the core region of reduced ADC (infarct) and the second region of interest within the homologous location in the contralateral hemisphere. No thresholding was involved in the selection of regions of interest. Infarct regions of interest were selected so that each encapsulated most of the area of reduced ADC while simultaneously avoiding partial volume contamination from adjacent ventricles or blood vessels. The regions of interest were subsequently copied to the equivalent DWI b = 0 s/mm2 image (for better visualization) and to the corresponding dynamic T2*- and T1-based datasets (Fig 1). For T1-based DCE datasets, a third region of interest was positioned within the sagittal sinus for the estimation of the blood plasma contrast concentration.
Fig 1.

A, A 40-year old male patient with AIS, visible as hyperintensity on DWI obtained at 4 hours 6 minutes post-symptom onset. rtPA was not administered in this case. B, A region of interest was placed within the infarct, defined as the core area of reduced diffusion, and then copied to the equivalent T2*-weighted single-shot EPI sections. C, The equivalent follow-up gradient recalled-echo MR image obtained 24 hours later indicates an area of HT (HI1, arrowhead). D and E, Four T2*-based measures (rR, Peak Height, %Recovery, and Slope) were extracted from the ΔR2*measured versus time curves for both contralateral (D) and infarct (E) regions of interest and are provided on the inset of each plot.
T2*-Based Permeability Calculations
For each region of interest and each image in the dynamic T2* series, the T2* relaxation rate was determined by evaluating the change in SI from baseline and assuming20:
In-house software (MR Analyst) was used to extract 4 T2*-based permeability surrogates (rR, Peak Height,%Recovery, and Slope) from the ΔR2*measured versus time curve for each region (Fig 2). To derive rR, we fitted the ΔR2*measured versus time curve to a γ-variate function to produce a theoretic first-pass ΔR2*theoretical curve. The rR was calculated as described by Kassner et al17:
 |
Fig 2.

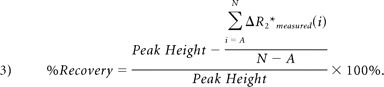
A schematic representing a typical ΔR2* versus time curve (ΔR2*measured), as well as its γ-variate fit (ΔR2*theoretical), where ΔR2*max is the maximum of ΔR2*theoretical, A is the dynamic phase corresponding to the onset of the recirculation phase measured at half height of the descending aspect of the ΔR2*theoretical curve, and N is the final dynamic phase. The difference in area encompassed by the ΔR2*measured and ΔR2*theoretical curves is indicated by C. Four DSC parameters were calculated for each region of interest: rR = [C/ΔR2*max], Peak Height, %Recovery = [100% × (Peak Height − mean postbolus ΔR2*measured)/Peak Height], and Slope = slope of ΔR2*measured (t) between 50 and 60 seconds postinjection. Note that for %Recovery, the mean postbolus ΔR2*measured, was the average ΔR2*measured from phases A through N, inclusive.
where ΔR2*max is the maximum of ΔR2*theoretical, A is the dynamic phase corresponding to the onset of the recirculation phase measured at half height of the descending aspect of the ΔR2* curve, and N is the final dynamic phase (Fig 2). The Peak Height of each curve was determined by finding the maximum value of the ΔR2*measured versus time curve and subtracting the mean precontrast ΔR2*measured.11 The %Recovery was computed by determining the difference between the Peak Height and the average postbolus ΔR2*measured (Fig 2)11:
 |
Finally, the Slope was defined as the slope of the ΔR2*measured versus time curve between 50 and 60 seconds postbolus.14 Mean values for all T2*-based metrics and for both infarct and contralateral regions of interest were calculated for each section in which the lesion was present. Patient-level means for infarct and contralateral regions were then determined by computing the weighted mean of each measure over all sections—that is, the sum of rRregion of interest · nregion of interest over all sections normalized by the sum of nregion of interest over all sections, where nregion of interest is the number of voxels per region of interest.
T1-Based DCE Permeability Estimates
Permeability (KPS) maps were derived from DCE image datasets by using MR Analyst. A graphic “Patlak” model21 was implemented by using linear regression, as previously described6,9,22:
where Ct is the concentration of contrast agent in the tissue region of interest, Cp is the concentration in the vessel, and vp is the fractional blood volume. Plotting the ratio Ct(t)/Cp(t) versus ∫Cp(τ)dτ/Cp(t) yields a linear relationship, where KPS is the slope of best fit and the backflow (efflux) of contrast into the intravascular space was assumed to be negligible. As with the T2*-based measures, patient-level means for infarct and contralateral KPS were then determined by computing the weighted mean value over all sections.
Statistical Analysis
Patient-level means for every infarct and contralateral measure (rR, Peak Height, %Recovery, Slope, and KPS) were grouped according to HT status at follow-up and whether the patient received rtPA. For each measure, differences between infarct and contralateral regions of interest were assessed for significance by using Wilcoxon signed rank tests. Kruskal-Wallis analysis of variance by ranks was initially performed to identify any differences in the infarct region of interest means among the 4 groups (ie, among rtPA-treated/HT, rtPA-treated/non-HT, rtPA-untreated/HT, rtPA-untreated/non-HT infarct means). Infarct means for each measure were subsequently collapsed according to HT status and treatment, and differences were assessed for significance by using Mann-Whitney U tests. The relationships between KPS and each T2*-based measure, as well as between rR and each of Peak Height, %Recovery, and Slope, were investigated by using linear regression. Finally, infarct KPS and rR data were grouped according to whether the value of the Slope measure was negative or positive. The occurrence rates of HT for patients with negative- and positive-valued Slope were compared by using the Fisher exact test. The distributions of KPS and rR values for patients with negative and positive Slope values were examined by using box-and-whisker plots, and the 2 Slope groups were compared by using Mann-Whitney U tests. All statistical analyses were performed by using OpenStat, Version 7.30.08 (W.G. Miller, MD; Iowa State University, Ames, Iowa), and all data are depicted as mean ± SD. Two-sided P values for both the Wilcoxon signed rank and the Mann-Whitney U tests are as follows: if the P1-sided = <.5, then P2-sided = 2 × (P1-sided); if P1-sided = >.5, then P2-sided = 2 × (1 − P1-sided). Thus, all P values stated herein are 2-sided, and a value of .05 was considered statistically significant.
Results
Eight of 18 patients proceeded to HT, including 3 who were treated with rtPA. Among the 8 patients with HT, 3 were categorized as HI1, 1 as HI2, 2 as PH1, and 2 as PH2. The total infarct size (the area of reduced ADC) ranged from 18 to 23,243 mm2 (median, 257 ± 5537 mm2). The mean values for each of the 4 DSC measures are provided for both infarct and contralateral regions of interest in Fig 3. With the exception of Slope, Wilcoxon signed rank tests revealed significant differences between infarct and contralateral regions of interest for every T2*-based measure (rR: 0.18 ± 0.07 versus 0.08 ± 0.02, P < .0001; Peak Height: 7.65 ± 2.77 versus 9.76 ± 3.54, P = .028; %Recovery: 79 ± 9 versus 91 ± 3%, P < .0001; Slope: −0.02 ± 0.06 versus 0.02 ± 0.05, P = .84). For 7 of the 18 infarct regions of interest, the descending aspect of the ΔR2*measured versus time curve had yet to reach a stable postbolus ΔR2* by the 50 seconds' dynamic. The mean KPS estimate for infarct regions of interest was significantly greater than that for contralateral regions of interest (0.84 ± 0.48 versus 0.39 ± 0.30, P = .002).
Fig 3.

Mean values for the 4 candidate T2*-based surrogate measures (rR, Peak Height, %Recovery, and Slope) are displayed for both infarct and contralateral regions of interest. Wilcoxon signed rank tests revealed that Slope was the only T2*-based metric unable to delineate infarct from contralateral regions of interest (P = .84). The mean infarct rR was significantly elevated (P < .0001), while both Peak Height and %Recovery were significantly reduced, relative to contralateral regions of interest (P = .028 and P < .0001, respectively).
Among the 4 patient groups, Kruskal-Wallis testing identified significant differences in rR and KPS (P = .01 and P = .04, respectively), but not in either Peak Height, %Recovery, or Slope (P = .73, P = .11, and P = .48, respectively). When the groups were collapsed according to HT status (Fig 4), Mann-Whitney U tests determined that both rR and KPS were significantly greater in patients with HT compared with those who did not experience hemorrhagic complications (0.22 ± 0.06 versus 0.14 ± 0.06, P = .006; 1.15 ± 0.53 versus 0.59 ± 0.25 mL/100 g/min, P = .020). Conversely, there was a trend toward decreased %Recovery in patients with HT (76 ± 6 versus 82 ± 11%, P = .092). Neither Peak Height nor Slope demonstrated significant differences between HT and non-HT groups (7.95 ± 2.2 versus 7.41 ± 3.2, P = .66 and −0.02 ± 0.07 versus −0.02 ± 0.06, P = 1.00, respectively). While the mean Peak Height, %Recovery, and Slope were all lower in rtPA-treated versus untreated patients, Mann-Whitney U tests indicated that none of these differences were significant (P = .28, P = .18, and P = .32, respectively). On the other hand, both rR and KPS were greater among rtPA-treated patients, though this was only found to be significant for rR (rR: 0.21 ± 0.07 versus 0.15 ± 0.05, P = .02; KPS: 0.97 ± 0.39 versus 0.74 ± 0.54, P = .16).
Fig 4.

Mean values for the 4 candidate T2*-based surrogate measures (rR, Peak Height, %Recovery, and Slope) are displayed for infarct regions of interest corresponding to patients who subsequently hemorrhaged (HT) and those who did not (non-HT). Mann-Whitney U testing indicated that rR was capable of discriminating between HT and non-HT infarcts. While the mean rR for patients with HT was significantly elevated (P = .006 versus non-HT infarcts), there was a trend toward decreased %Recovery (P = .092 versus non-HT infarcts).
The relationship between KPS and each T2*-based measure is depicted in Fig 5. Of the 4 T2*-based measures investigated, only rR was significantly correlated with KPS (r = 0.64, P = .004). There was a modest negative correlation between %Recovery and KPS, but this did not reach significance (r = −0.44, P = .07). Figure 6 depicts the relationship between rR and each of the other 3 T2*-based measures and reveals a significant negative correlation between %Recovery and rR (r = −0.88, P < .001). Neither Peak Height nor Slope was significantly correlated with rR (r = −0.19, P = .46 and r = −0.18, P = .48, respectively). The occurrence rates of HT for patients with negative- and positive-valued Slope were not significantly different (40% versus 50%, respectively; P = .52). Box-and-whisker plots depicting the distributions of KPS and rR values for patients with negative and positive Slope values are provided in Fig 7 . Although both KPS and rR were greater in the negative Slope group, these differences were not significant (P = .15 and P = .27, for KPS and rR, respectively).
Fig 5.

Scatterplots depict the relationship between KPS and each T2*-based measure: rR (A), Peak Height (B), %Recovery (C), and Slope (D). Of the 4 T2*-based measures investigated, only rR was significantly correlated with KPS (r = 0.64, P = .004). No significant correlations were identified between KPS and any of the other 3 T2*-based measures (%Recovery: r = −0.44, P = .07; Peak Height: r = 0.11, P = .65; Slope: r = −0.31, P = .22).
Fig 6.

Scatterplots depict the relationship between rR and each of the other 3 candidate T2*-based measures: Peak Height (A), %Recovery (B), and Slope (C). Linear regression revealed a significant negative correlation between %Recovery and rR (r = −0.88, P < .001). No significant correlations were determined for either Peak Height or Slope with rR (r = −0.19, P = .46 and r = −0.18, P = .48, respectively).
Fig 7.

Box-and-whisker plots display the distributions of infarct KPS (A) and rR (B) for patients with negative and positive Slope values (dotted-line indicates mean; dashed-line, median; box range, 25th–75th percentile; whiskers, 10th and 90th percentiles). While the mean and median KPS values appear greater in the negative Slope group, these differences were not significant (P = .15). The rR values measured in the negative Slope group were not significantly different from those in the positive Slope group (P = .27).
Discussion
The results presented here suggest that at least 2 T2*-based measures of contrast recirculation show the potential for the prediction of hemorrhagic complications in acute ischemic stroke. While only significant for rR, this small retrospective analysis of patients with AIS scanned in the critical early hours following stroke onset suggests that both rR and %Recovery appear capable of discriminating between HT and non-HT infarcts. Additionally, rR was closely correlated to DCE estimates of KPS in the same patients; this correlation supports the application of this measure as a semiquantitative surrogate for BBB permeability coefficients in the investigation of AIS.
Although the rR results obtained in the current study are consistent with a previously published report,16 to the best of our knowledge, this is the first time that the %Recovery metric has been evaluated in an AIS population. The rR metric was previously introduced as a promising tool for elucidating microvascular abnormalities in high-grade gliomas because significant elevations in rR were isolated to the tumor periphery of high-grade tumors (ie, regions typified by hyperpermeability and a high-degree of vascular tortuosity).17,23 As with rR, the %Recovery metric was first proposed for the characterization of brain tumor microvasculature,11 in which the %Recovery measured in grade IV gliomas was found to be significantly depressed compared with grade III tumors. In fact, %Recovery has since been used to monitor postradiotherapy changes in tumor microvasculature,12 identifying significant reductions in %Recovery in brain tumor voxels corresponding to regions receiving the highest dose.
Consistent with the current study, Wu et al16 detected significant increases in the rR and KPS of stroke lesions that proceeded to HT, as well as a strong and significant correlation between the 2 measures. When considered together with the early findings in gliomas, we notice that they are consistent with the negative correlation between %Recovery and rR described in the current study of AIS, with reductions in 1 metric (%Recovery) corresponding to increases in the other (rR). This quasicomplementary relationship can be explained, at least in part, by revisiting the derivation of each metric: Whereas %Recovery increases with Peak Height and decreases with mean postbolus ΔR2*measured, the converse is generally true for rR, if we assume that the area bounded by the ΔR2*measured and ΔR2*theoretical curves increases commensurate with the mean postbolus ΔR2*measured. In fact, it can be shown that the faster the ΔR2*theoretical curve descends toward baseline, the closer rR will approximate [(1-%Recovery)/N-A]. In the case of ΔR2* data collected after a single dose of contrast, for example, we would expect the descent of the γ-variate fit to be appreciably more abrupt than we observed in the current study, in which residual contrast agent from the DCE scan may have partially saturated parenchymal T1 before the arrival of the second contrast bolus and reduced the extent of contrast leakage apparent in the ΔR2* recirculation phase.17,24
Others have previously investigated the stability of susceptibility-induced signal-intensity changes with sequential bolus injections of gadolinium-based contrast and reported that the second injection of contrast resulted in a relatively protracted recovery toward baseline.25,26 Additionally, Levin et al25 observed increases in both the Peak Height and the postbolus ΔR2* following a second injection of gadoteridol administered 10 minutes after the previous dose. Whereas the delayed ΔR2* recovery to baseline and increased postbolus ΔR2* would both be expected to result in blunted %Recovery and increased rR, we would expect an increased Peak Height to manifest in the opposite effects.
The impact of pre-enhancement on T2*-based metrics warrants more explicit quantification in the setting of AIS, particularly with respect to its effect on the diagnostic accuracy of these measures for the prediction of HT. Neither Peak Height nor Slope successfully identified HT in the small group of patients examined for this study. We did, however, observe a significant reduction in the Peak Height measured in infarct regions of interest relative to the contralateral hemisphere. While this result would be consistent with BBB disruption, it is not clear why there was no difference in Peak Height between HT and non-HT infarcts specifically. It is also possible that the scanning duration typical of clinical perfusion imaging may be insufficient for capturing BBB leakage information, particularly in cases of slowly evolving BBB breakdown. The time scale of contrast extravasation before HT has not been fully elucidated in human AIS and could be potentially influenced by myriad intra- and intersubject differences. As such, the reproducibility of T2*-based permeability measures remains an important consideration when planning for future clinical application, particularly in the acute setting.
At the same time, if the underlying pathology itself is not readily characterized by the metric, the application of standardized or inflexible measurements can potentially compromise sensitivity. When computed in the manner initially proposed,14 the Slope measure is “hard-coded” to consider the interval between 50 and 60 seconds of the ΔR2* curve. While this presents the investigator or clinician with a simple alternative to calculating KPS or rR, it is unclear to us why this particular period of the recirculation phase would best reflect BBB permeability (eg, versus measures that incorporate more or all of the recirculation phase). Given a standard perfusion MR imaging TR of approximately 2 seconds (1.7 seconds in the current study), a slope calculated during a 10-second interval will only consider 5 dynamic phases in the noisiest aspect of the ΔR2* curve. Furthermore, it is unlikely that the 50- to 60-second period postinjection will always encompass the same aspect of the contrast recirculation curve. For example, when wash-in is delayed and the bolus is greatly dispersed due to a proximal stenosis, a distal clot, or insufficient collateral circulation, the terminal aspect of the second pass can actually fall within the 50- to 60-second interval, as we noted in 7 infarct regions of interest. When considered together with the fact that we did not ascertain the success of recanalization, all of these potential factors serve to confound our interpretation of the 50- to 60-second Slope value in these patients. Conversely, the onset of recirculation is defined in a flexible manner for both rR and %Recovery calculations (ie, A, the time corresponding to the half-height of the descending part of the ΔR2* curve). Unlike Bang et al,14,15 we were unable to distinguish between HT and non-HT infarcts by using the Slope metric. Taken together with the weak correlation between Slope and KPS, the relationship between Slope and microvascular permeability may not be as strong as first proposed.
If a T2*-based measure is to assist in risk stratification for rtPA therapy, it is our contention that the measure of choice should truly reflect permeability. Thrombolytic therapy is known to cause or exacerbate BBB leakage by degrading the basal lamina and tight interendothelial cell junctions,27 increasing transendothelial permeability even when contrast extravasation is too slow to manifest in visual evidence of postgadolinium enhancement.9 Thus, an early indication of enhanced BBB permeability in or around the stroke lesion might caution against administering rtPA, while evidence of a stable BBB might indicate that HT secondary to rtPA is unlikely and argues in favor of the treatment. It is also possible that T2*-based measures of contrast extravasation may differ between symptomatic and asymptomatic HT. Despite impressive specificity (98%), Bang et al15 reported that the negative slope metric predicted HT of all types with a sensitivity of only 29% (15 false-negatives of a total of 21 patients with HT), yet sensitivity improved to 75% if the outcome was parenchymal hematoma. With such a small number of symptomatic patients with HT included in this study, we clearly lacked the power to detect differences in T2*-based measures between HT subtypes. If symptomatic HT is the outcome that is most salient to rtPA decision making, then we need to re-evaluate these DSC measures in larger prospectively designed studies with an adequate number of symptomatic patients with HT to properly assess the diagnostic accuracy of each measure.
Conclusions
This work revealed that at least 2 T2*-based measures of BBB permeability, rR and %Recovery, show potential for delineating HT in patients with AIS imaged within 7 hours of symptom onset. Conversely, neither Peak Height nor Slope was capable of discriminating between patients who proceeded to HT and those who did not. Of the 4 candidate T2*-based measures evaluated in this study, only rR was strongly correlated with the T1-based DCE-MR imaging permeability estimates obtained in the same patients with AIS, lending particular support to the use of this T2*-based measure as a reflection of BBB disruption. With further validation of our findings in a larger prospective analysis, we believe that T2*-based permeability imaging could assist with treatment decision making in AIS.
Acknowledgments
We thank Nataly Kogan, MD, who helped with patient recruitment, and both Shengping Wu, MD, and Tiffany Liu, who helped develop the software tool used for this project. We are also grateful for the statistical support and review provided by George A. Tomlinson, MD, (Department of Public Health Sciences, University of Toronto).
Abbreviations
- ADC
apparent diffusion coefficient
- AIS
acute ischemic stroke
- BBB
blood-brain barrier
- DCE
dynamic contrast-enhanced
- ΔR2*
delta
- DWI
diffusion-weighted imaging
- ECASS
European Cooperative Acute Stroke Study
- EPI
echo-planar imaging
- HI
hemorrhagic infarction
- HT
hemorrhagic transformation
- KPS
BBB permeability coefficient
- max
maximum
- NIHSS
National Institutes of Health Stroke Scale
- PH
parenchymal hematoma
- rR
relative recirculation
- rtPA
recombinant tissue plasminogen activator
- SI
signal intensity
- Slope
slope of the ΔR2* versus time curve between 50 and 60 seconds postinjection
- T2*
relaxation rate
Footnotes
This work was funded by the Canadian Stroke Network, the Canadian Institutes of Health Research, and the Canada Research Chair Program.
Paper previously presented in part at: Annual Meeting of the American Society of Neuroradiology, May 16–21, 2009; Vancouver, British Columbia, Canada; and Annual Scientific Meeting of the International Society for Magnetic Resonance in Medicine, April 18–24, 2009; Honolulu, Hawaii.
References
- 1. Kapral MK, Hall RE, Silver FL, et al. Registry of the Canadian Stroke Network: Report on the 2004/05 Ontario Stroke Audit. Toronto, Ontario, Canada: Institute for Clinical Evaluative Sciences; 2009 [Google Scholar]
- 2. Albers GW, Olivot JM. Intravenous alteplase for ischaemic stroke. Lancet 2007;369:249–50 [DOI] [PubMed] [Google Scholar]
- 3. Hamann GF, del Zoppo GJ, von Kummer R. Hemorrhagic transformation of cerebral infarction: possible mechanisms. Thromb Haemost 1999;82 (suppl 1):92–94 [PubMed] [Google Scholar]
- 4. Latour LL, Kang DW, Ezzeddine MA, et al. Early blood-brain barrier disruption in human focal brain ischemia. Ann Neurol 2004;56:468–77 [DOI] [PubMed] [Google Scholar]
- 5. Knight RA, Barker PB, Fagan SC, et al. Prediction of impending hemorrhagic transformation in ischemic stroke using magnetic resonance imaging in rats. Stroke 1998;29:144–51 [DOI] [PubMed] [Google Scholar]
- 6. Ewing JR, Knight RA, Nagaraja TN, et al. Patlak plots of Gd-DTPA MRI data yield blood-brain transfer constants concordant with those of 14C-sucrose in areas of blood-brain opening. Magn Reson Med 2003;50:283–92 [DOI] [PubMed] [Google Scholar]
- 7. Knight RA, Karki K, Ewing JR, et al. Estimating blood and brain concentrations and blood-to-brain influx by magnetic resonance imaging with step-down infusion of Gd-DTPA in focal transient cerebral ischemia and confirmation by quantitative autoradiography with Gd-[(14)C]DTPA. J Cereb Blood Flow Metab 2009;29:1048–58. Epub 2009 Mar 25 [DOI] [PMC free article] [PubMed] [Google Scholar]
- 8. Kassner A, Roberts T, Taylor K, et al. Prediction of hemorrhage in acute ischemic stroke using permeability MR imaging. AJNR Am J Neuroradiol 2005;26:2213–17 [PMC free article] [PubMed] [Google Scholar]
- 9. Kassner A, Roberts TPL, Moran B, et al. Recombinant tissue plasminogen activator increases blood-brain barrier disruption in acute ischemic stroke: an MRI permeability study. AJNR Am J Neuroradiol 2009;30:1864–69 [DOI] [PMC free article] [PubMed] [Google Scholar]
- 10. Johnson G, Wetzel SG, Cha S, et al. Measuring blood volume and vascular transfer constant from dynamic, T2*-weighted contrast-enhanced MRI. Magn Reson Med 2004;51:961–68 [DOI] [PubMed] [Google Scholar]
- 11. Lupo JM, Cha S, Chang SM, et al. Dynamic susceptibility-weighted perfusion imaging of high-grade gliomas: characterization of spatial heterogeneity. AJNR Am J Neuroradiol 2005;26:1446–54 [PMC free article] [PubMed] [Google Scholar]
- 12. Lee MC, Cha S, Chang SM, et al. Dynamic susceptibility contrast perfusion imaging of radiation effects in normal-appearing brain tissue: changes in the first-pass and recirculation phases. J Magn Reson Imaging 2005;21:683–93 [DOI] [PubMed] [Google Scholar]
- 13. Cao Y, Shen Z, Chenevert TL, et al. Estimate of vascular permeability and cerebral blood volume using Gd-DTPA contrast enhancement and dynamic T2*-weighted MRI. J Magn Reson Imaging 2006;24:288–96 [DOI] [PubMed] [Google Scholar]
- 14. Bang OY, Buck BH, Saver JL, et al. Prediction of hemorrhagic transformation after recanalization therapy using T2*-permeability magnetic resonance imaging. Ann Neurol 2007;62:170–76 [DOI] [PubMed] [Google Scholar]
- 15. Bang OY, Saver JL, Alger JR, et al. Patterns and predictors of blood-brain barrier permeability derangements in acute ischemic stroke. Stroke 2009;40:454–61 [DOI] [PubMed] [Google Scholar]
- 16. Wu S-P, Thornhill RE, Chen S, et al. Relative recirculation: a fast, model-free surrogate for the measurement of blood-brain barrier permeability and the prediction of hemorrhagic transformation in acute ischemic stroke. Invest Radiol 2009;44:662–68 [DOI] [PubMed] [Google Scholar]
- 17. Kassner A, Annesley DJ, Zhu X-P, et al. Abnormalities of the contrast re-circulation phase in cerebral tumors demonstrated using dynamic susceptibility contrast-enhanced imaging: a possible marker of vascular tortuosity. J Magn Reson Imaging 2000;11:103–13 [DOI] [PubMed] [Google Scholar]
- 18. Hacke W, Kaste M, Fieschi C, et al. Randomised double-blind placebo-controlled trial of thrombolytic therapy with intravenous alteplase in acute ischaemic stroke (ECASS II). Lancet 1998;352:1245–51 [DOI] [PubMed] [Google Scholar]
- 19. Information for Healthcare Professionals Gadolinium-Based Contrast Agents for Magnetic Resonance Imaging (marketed as Magnevist, MultiHance, Omniscan, OptiMARK, ProHance). US Food and Drug Administration Website. http://www.fda.gov/Drugs/DrugSafety/PostmarketDrugSafetyInformationforPatientsandProviders/ucm142884.htm. Accessed June 18, 2009.
- 20. Rosen BR, Belliveau JW, Vevea JM, et al. Perfusion imaging with NMR contrast agents. Magn Reson Med 1990;14:249–65 [DOI] [PubMed] [Google Scholar]
- 21. Patlak CS, Blasberg RG, Fenstermacher JD. Graphical evaluation of blood-to-brain transfer constants from multiple-time uptake data. J Cereb Blood Flow Metab 1983;3:1–7 [DOI] [PubMed] [Google Scholar]
- 22. Roberts HC, Roberts TPL, Brasch RC, et al. Quantitative measurement of microvascular permeability in human brain tumors achieved using dynamic contrast-enhanced MR imaging: correlation with histologic grade. AJNR Am J Neuroradiol 2000;21:891–99 [PMC free article] [PubMed] [Google Scholar]
- 23. Jackson A, Kassner A, Annesley-Williams D, et al. Abnormalities in the recirculation phase of contrast agent bolus passage in cerebral gliomas: comparison with relative blood volume and tumor grade. AJNR Am J Neuroradiol 2002;23:7–14 [PMC free article] [PubMed] [Google Scholar]
- 24. Quarles CC, Ward BD, Schmainda KM. Improving the reliability of obtaining tumor hemodynamic parameters in the presence of contrast agent extravasation. Magn Reson Med 2005;53:1307–16 [DOI] [PubMed] [Google Scholar]
- 25. Levin JM, Kaufman MJ, Ross MH, et al. Sequential dynamic susceptibility contrast MR experiments in human brain: residual contrast agent effect, steady state, and hemodynamic perturbation. Magn Reson Med 1995;34:655–63 [DOI] [PubMed] [Google Scholar]
- 26. Runge VM, Kirsch JE, Wells JW, et al. Repeat cerebral blood volume assessment with first-pass MR imaging. J Magn Reson Imaging 1994;4:457–61 [DOI] [PubMed] [Google Scholar]
- 27. Wang X, Lo EH. Triggers and mediators of hemorrhagic transformation. Mol Neurobiol 2003;28:229–44 [DOI] [PubMed] [Google Scholar]