Abstract
BACKGROUND AND PURPOSE:
How CSF flow varies with the anatomy of the subarachnoid space has not been sufficiently well studied. The goal of this study was to develop an idealized 3D computational model of the subarachnoid space and then to use this model to study the detailed spatiotemporal effects of anatomic variations on CSF pressures and velocities.
MATERIALS AND METHODS:
We created a geometric model with a computer-assisted design program. The model contained a central structure for the brain and spinal cord axis and a second surrounding structure for the peripheral borders of the subarachnoid space. Model dimensions were adjusted to capture the main characteristics of the normal human posterior fossa and cervical spinal anatomy. CSF flow was modeled as water with a sinusoidal flow pattern in time. Velocities and pressures during craniocaudal and caudocranial flow were calculated with computational fluid dynamics (CFD) software. Simulated flow was compared with published phase-contrast MR imaging measurements of CSF flow in healthy human subjects.
RESULTS:
The model contained geometric characteristics of the posterior fossa and spinal canal. Flow velocities varied with the time in the cycle and location in space. Flow velocities had spatial variations that resembled those in healthy human subjects. Reynolds numbers were moderate, showing a laminar flow regime. Pressure varied uniformly along the long axis of the model during craniocaudal and caudocranial flow.
CONCLUSIONS:
In an idealized geometric approximation of the human subarachnoid space, CSF velocities and pressures can be studied in spatiotemporal detail with mathematic models.
CSF flow patterns have a relationship to the anatomy of the subarachnoid space and hypothetically to the pathogenesis of syringomyelia and neurologic consequences of the Chiari I malformation, characterized by the descent of the cerebellar tonsils into the upper cervical spinal subarachnoid space. CSF flow measurements with phase-contrast MR imaging (PCMR) suggest that the obstruction of the subarachnoid space in the Chiari I malformation results in hyperdynamic CSF flow. Relationships between CSF flow and subarachnoid space dimensions have not been adequately characterized because of the great interindividual variations in subarachnoid space anatomy and great spatial variation in CSF velocities through the subarachnoid space. Only a limited number of CSF velocity measurements are made in clinical studies because of the limited number of sections possible in a suitable examination time. Furthermore, pressure measurements are not obtained in the usual PCMR studies. The subarachnoid space dimensions that result in hyperdynamic flow and abnormal CSF pressures have not been determined.
Computational fluid dynamics (CFD) provides a well established tool to calculate flow velocity and pressure fields in moving fluids with high spatial and temporal resolution. CFD has been applied with patient-specific 3D anatomic models of the subarachnoid space.1 It has also been used to study flow characteristics in simpler models of the full-length spinal canal.2,3 It has not been applied, to our knowledge, with a simplified geometric model of the craniocervical subarachnoid space. Such idealized geometric models have the advantage vs patient specific models in that they can be changed freely to investigate the impact of, for example, different geometries on the CSF flow. These model changes can then represent typical interindividual anatomic variations observed among patients. Specifically, the effect of longer or wider tonsils, smaller posterior fossa dimensions, or craniovertebral decompression on CSF flow might be determined with the aid of such a model.
The goal of this study was to develop a 3D mathematic model of an idealized normal human subarachnoid space, use this model to calculate the detailed spatiotemporal distributions of CSF pressures and velocities, and, finally, to test the validity of the results by comparison to conventional flow velocity data in the normal human subarachnoid space.
Materials and Methods
Geometric Model of the Subarachnoid Space
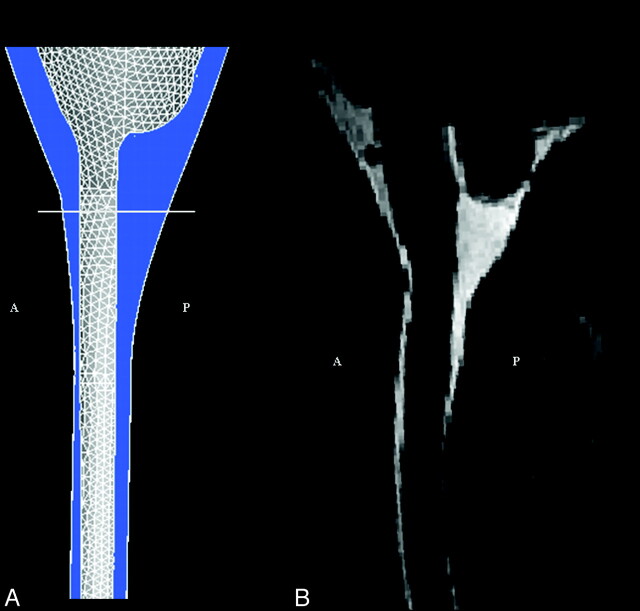
The geometric model of the posterior fossa and cervical spinal canal was designed with the commercial software package STAR-CD (CD-adapco, Melville, New York).4 Axial and sagittal MR images of the posterior fossa and cervical spinal canal were reviewed initially. One shape similar to a funnel was defined to model the cerebellum, the brain stem, and the spinal cord. Another shape was defined to model the peripheral boundary of the subarachnoid space. These 2 shapes, both specified as immobile and rigid, made up the inner and outer walls, respectively, of the flow space (Fig 1). The shapes and dimensions of the 2 structures were adjusted to capture the main characteristics found in anatomic models, such as the data from the Visible Human project.5 The spinal cord diameter, for example, was set to 1 cm, and the width of the surrounding space to approximately 4 mm. The dimensions of the brain and subarachnoid space of the posterior fossa were adjusted so that the space in axial sections, at intervals of 2.5 cm, approximated those of the subarachnoid space in the Visible Human project (Fig 1). The model had a height of 20 cm, with the craniovertebral junction approximately halfway between the ends. Because the exact shape of the flow in our geometry is not known, we prescribed a simple plug-shaped velocity profile at the boundaries and let the model itself develop the correct profile. This was achieved by extending each end of the model a few centimeters (beyond red lines in Fig 1), so that a natural profile was developed before flow reached the regions of interest.
Fig 1.
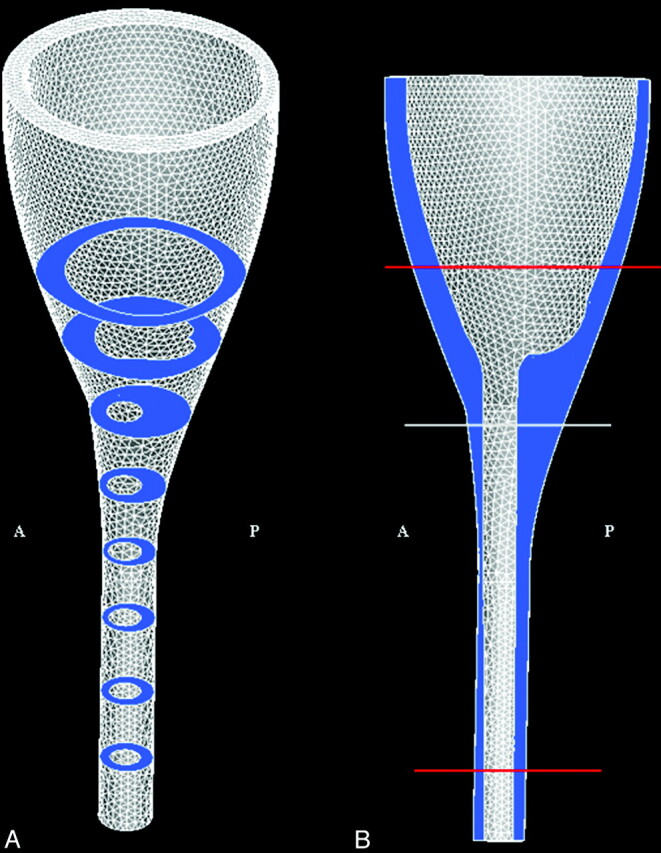
The model of the craniocervical region (between red lines) shown with the computational mesh in the (A) 3D view and in the (B) sagittal plane view. Model extensions beyond the red lines are introduced to simplify specification of boundary conditions (see text). The subarachnoid space is colored in blue, and the illustrated axial sections are 2.5 cm apart. The height of the model is 20 cm; cord diameter is set to 1 cm, and the space between the cord and the exterior of the spinal canal is approximately 4 mm. Anterior and posterior are indicated by A and P, respectively.
Flow and Pressure Calculations
Fluid flow through the geometric model was simulated by conventional CFD methods available in STAR-CD. The geometric model was converted in STAR-CD to a tetrahedral computational mesh with 60,000 computational nodes. Each cell had a smallest distance between nodes that ranged from 0.1 to 5.0 mm. The higher resolutions were used in regions with higher spatial complexity. Next to the wall, a layered mesh structure was used to increase the accuracy of the calculations. The chosen spatial resolution was tested by reproducing the same CSF flow characteristics with a finer mesh having more than twice as many nodes. Peak CSF velocities from the 2 meshes differed by no more than 1 mm/s. The simultaneous flow of fluid in and out of the geometry (ie, at the top and bottom ends) was assumed to have a plug-shaped velocity profile with sinusoidal variation in time (a period of 1 s) and was oriented in parallel to the boundary walls. The fluid was assumed to have the hydrodynamic characteristics of water with a kinematic viscosity of 0.700 × 10⁻⁶ m2/s (water, 37° C), and flow was assumed to be laminar. The amplitude of the sine wave was chosen so that maximal caudal flow velocity at the craniovertebral junction was in the range of 2 to 3 cm/s, reported to be normal for healthy volunteers.6 This selected amplitude determined only that the caudad peak velocity at the foramen magnum would be in the range of 2 to 3 cm/s but nothing about the spatial distribution of the velocity.
The flow was started from rest, resulting in an unphysiologic transient phase. However, the physiologically relevant steady-state pulsating flow was reached already in the second cycle, with negligible changes during the next cycles. Therefore, we based our investigations on the results from the second flow cycle and defined this cycle to cover the interval t = 0.00 s to t = 1.00 s. No-slip (zero velocity) conditions were specified at the walls. For each millisecond of the 2 sinusoidal periods, the Navier-Stokes equations were solved numerically by the finite volume method in STAR-CD, resulting in a flow velocity vector and a pressure scalar in each point of the computational mesh. All pressures were computed relative to a constant reference pressure at the top of the geometry, corresponding to the pressure from a 20-cm water column (because the pressure is only defined up to a constant because of the boundary conditions). The simulations were run on an ASUS VX1 (ASUS Computer International, Fremont, California) with a 2.16-GHz processor and 2.0-GB RAM. All postprocessing of data was done in STAR-CD and Matlab.7 We verified the calculation procedure in STAR-CD by comparing STAR-CD simulations of pulsating water flow in a straight tube with an analytical solution8 with a maximal Reynolds number of 570. The theoretic flow profile was reproduced by STAR-CD.
Assessment of Pressures and Velocities
We reviewed pressures and velocity vector components in sagittal sections and axial sections for the entire second cycle. The distributions of raw pressure and velocity data from STAR-CD within each of the sections were determined by inspection. Pressure, in particular, was plotted and evaluated for 19 axial sections down along the spine. The sections were placed 1 cm apart, with section 8 at the craniovertebral junction and section 19 located 11 cm below. An upper limit for the Reynolds numbers (Re) was estimated from
where us is the mean fluid velocity in meters per second, L is the characteristic length (hydraulic diameter) in meters, and υ is the kinematic fluid viscosity in meters squared per second. The upper limit was used to check whether numbers were low enough to support the assumption of laminar flow.
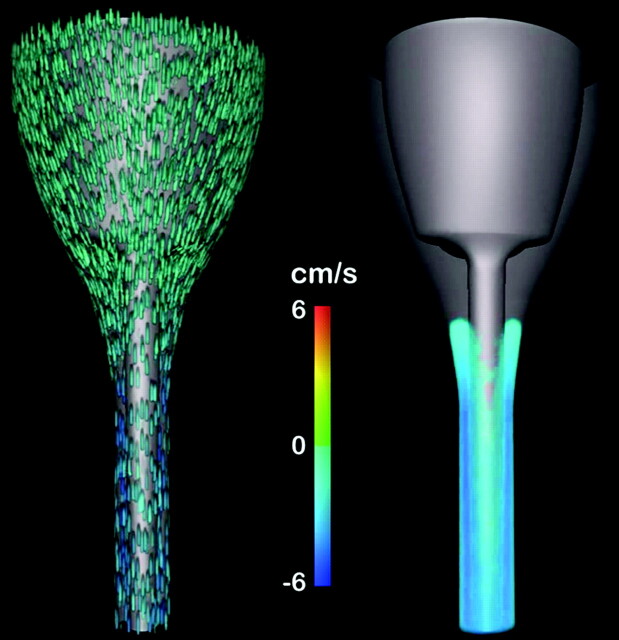
We also generated flow velocity animations using VoluViz9 for simulated pulsating flow through the craniovertebral junction, as well as for the whole 3D subarachnoid space. In the 3D animation, fluid flow velocity was demonstrated in 2 slightly different ways, one with “particles” inserted in the fluid, and one without. Velocities were shown on a color scale ranging from −6 cm/s to 6 cm/s, even if true velocities spanned twice this range. Velocities outside this chosen range were mapped to the corresponding maximal value of the scale. In this way, flow patterns were found easier to assess. For the 3D animation without “particles,” velocities lower than 2 cm/s were not shown.
Validation
To assess the anatomic validity of the model, axial and sagittal sections of the model were compared with corresponding MR images from a healthy subject. For velocities, a neuroradiologist familiar with PC MR flow imaging (the second author) compared the velocity distributions at the craniovertebral junction in the model with velocities in an axial PCMR image set from a healthy subject. The model was considered validated if visual inspection revealed similar geometry and velocity characteristics in the model and in the healthy subject.
Results
Geometric Model of the Subarachnoid Space
The geometric model had a space similar to the subarachnoid space of a human subject, when viewed in the sagittal section (Fig 2 ) or in selected axial sections (Fig 3 ). The model did not have spaces or communications corresponding to the fourth ventricle or its foramina. The model did not include a structure corresponding to the tentorium.
Fig 2.
Sagittal plane views of the craniocervical region in our idealized geometric model, (A) and in a T2-weighted sagittal MR image (VIPR) (B). The craniocervical junction is indicated by a white line, whereas anterior and posterior are indicated by A and P, respectively. The high signal intensity CSF seen in the MR imaging corresponds to the blue-colored region in the model.
Fig 3.
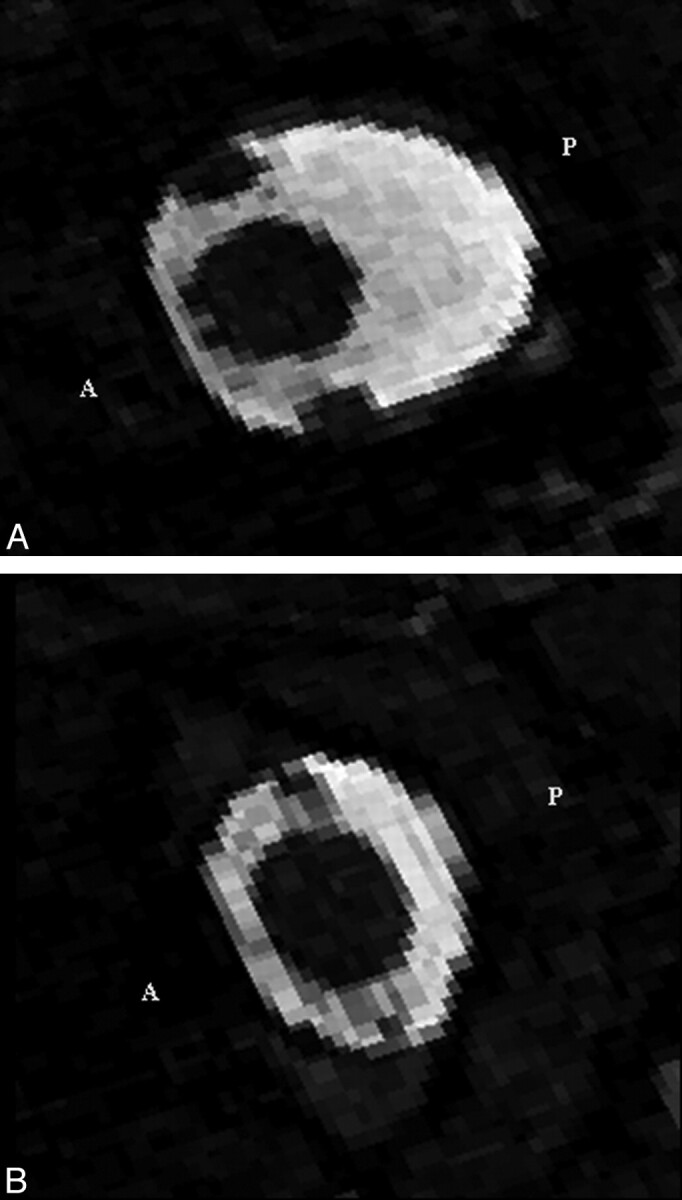
Axial MR imaging sections at (A) the craniovertebral junction and (B) at 2 cm below. They show the CSF as high signal intensity and the spinal cord, vertebral arteries, and tissues outside the spinal canal as low signal intensity. Anterior and posterior are indicated by A and P, respectively.
Assessment of Pressures and Velocities
Flow patterns were illustrated effectively with axial and sagittal images, as well as with flow animations. (http://home.simula.no/∼sveinlin/CSFanimation.mpg shows 2D simulated pulsating flow through the craniovertebral junction; http://home.simula.no/∼sveinlin/CSFnormal.mpg shows simulated pulsating flow for the whole 3D subarachnoid space.) At 0.25 s, flow velocity in the caudad direction peaked, and at 0.75 s, it peaked in the craniad direction. At 0.50 and 1.00 s, low-velocity flow and bidirectional flow were evident in axial images. At all times in the cycle, the velocity vectors generally had much larger components in the craniad or caudad directions (z-direction in MR imaging terminology) than in perpendicular directions (x- or y-direction in MR imaging terminology). Therefore, in the following descriptions, the x and y components of the vectors are disregarded.
The axial and sagittal sections showed that the fluid velocity varied between axial sections and varied through the subarachnoid space within each axial section. Sagittal plane images showed velocities during maximal caudad and craniad flow of approximately 1 to 2 cm/s in the posterior subarachnoid space at the craniovertebral junction. Velocities above the craniovertebral junction were smaller (Fig 4 A, -B). Two to 3 cm below the craniovertebral junction in the model, velocities reached 8 cm/s posterior to the spinal cord. Parasagittal images, lateral to the spinal cord, showed higher velocities at the craniovertebral junction than in the posterior fossa, and the peak velocities were lower in the spinal canal (Fig 4C, -D). The field of peak velocities extended longer vertically in the parasagittal images than in the sagittal plane and showed a similar pattern to each side of the cord.
Fig 4.
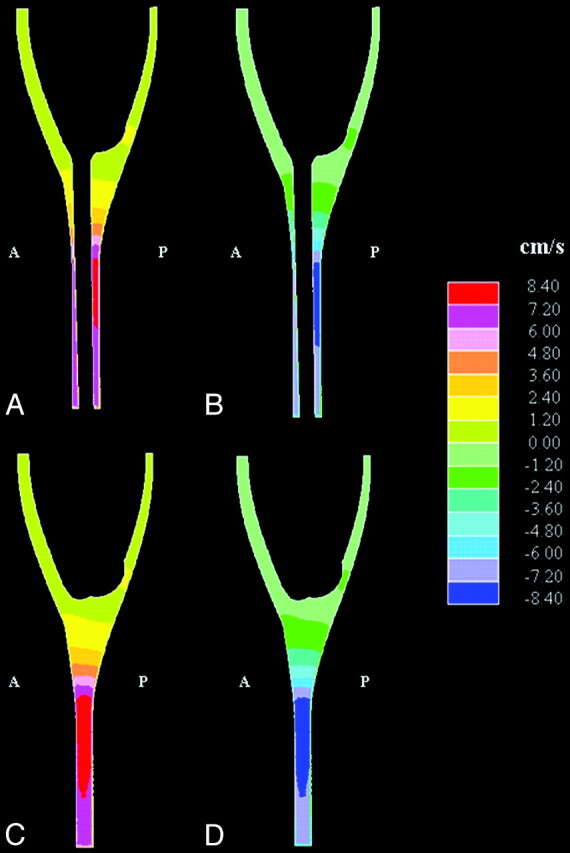
Simulated sagittal plane flow velocities at the time when peak velocity occurred in (A) the cranial direction and (B) the caudad direction. Corresponding parasagittal sections, lateral to the spinal cord, are shown in (C) and (D), respectively. Anterior and posterior are indicated by A and P, respectively. Note that velocities are in the range of 1 to 2 cm/s near the craniovertebral junction and 8 cm/s lower in the spinal canal. (Note also that each color represents an interval of velocities, as specified in the scale to the right in the figure.)
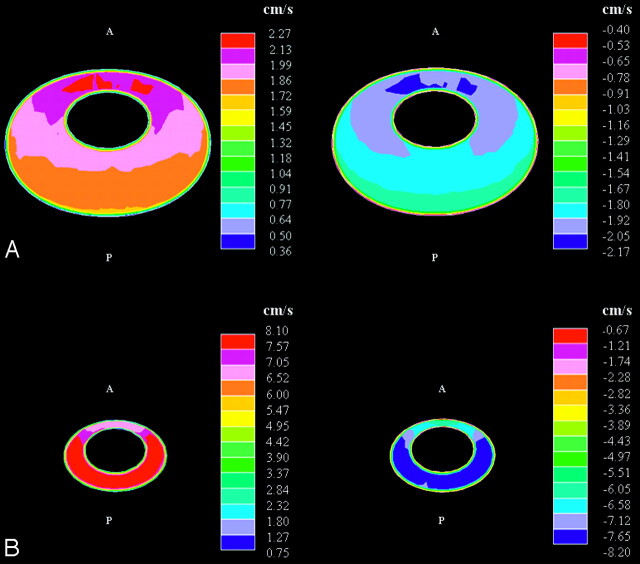
Axial images showed spatial variations in the fluid velocities at each level (Fig 5 ). At the craniovertebral junction during peak flow in either direction, velocities were greater anterior than posterior to the spinal cord and were greatest anterolateral to the cord. The peak velocities in the axial images at this level were 2 to 3 cm/s. At a level approximately 6 cm below the craniovertebral junction, velocity reached 8 cm/s. The peak velocities were posterior to the cord for flow in both directions. Above the craniovertebral junction, velocities had relatively low magnitudes for flow in either direction.
Fig 5.
Simulated cephalad-caudal flow velocities in axial sections at the craniovertebral junction (A) and at 6 cm below (B) at the time in the cycle of maximal cephalad (left) and of maximal caudal flow (right). The orientation of each section is as in Fig 3, that is, with the anterior (‘A’) side being upwards, the posterior (‘P’) side being downwards, and the caudal direction being into the page. Note the difference in scale for the 2 section levels. (Note that each color represents an interval of velocities, as specified in the scales to the right in the figure.)
The 3D animation (http://home.simula.no/∼sveinlin/CSFnormal.mpg) illustrated effectively how the velocity developed in different parts of the subarachnoid space over the flow cycle. Flow jet dynamics along the cord was evident for flow in both directions. Anterior to the cord, velocities were markedly lower than laterally and posteriorly, as seen in the frontal view (Fig 6 ).
Fig 6.
Frontal view of the geometry taken from the 3D animation14 of flow velocity near the time of peak caudad flow. In the animation, the flow velocities during 1 cycle (repeated) are shown simultaneously in 2 different ways. The leftmost view has “particles” included in the flow, whereas the rightmost has no particles. In the rightmost view, velocities lower than 2 cm/s are not shown. For both views, flow velocities are shown on a color scale from −6 cm/s to 6 cm/s. To simplify the view, velocities outside this chosen range are just shown as maximal scale values. Flow is seen predominantly in a caudad or a cephalad direction, depending on the cardiac cycle. The time at which flow reverses differs in different parts of the subarachnoid space.
Halfway through the cycle, and at the end of the cycle, flow in the cephalad or in the caudad direction was minimal. Flow at low velocities was evident in both directions at these times in the cycle (Fig 7 ), and the distributions depended on whether flow direction shifted from caudal to cranial or from cranial to caudal. When flow direction shifted from caudal to cranial (t = 0.5 s), cranial flow was observed anteromedially, whereas maximal caudal flow velocities were observed posterolaterally. As flow directions shifted in the opposite direction (t = 1.0 s), a similar distribution was seen but with oppositely directed flows. At both t = 0.5 s and t = 1.0 s, peak flows were approximately equal in the 2 directions.
Fig 7.
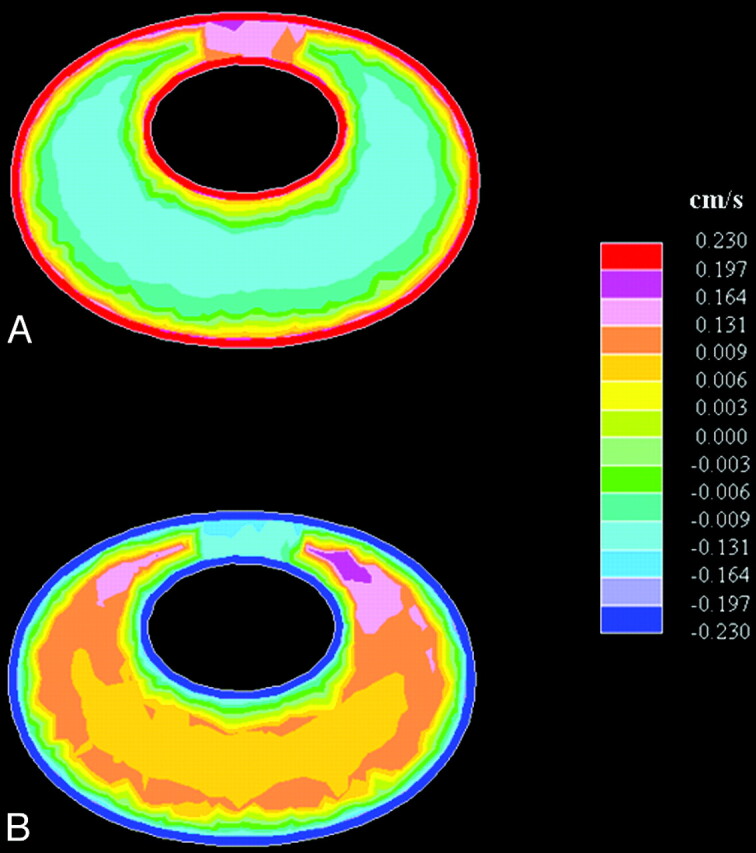
Axial images showing bidirectional flow at the craniovertebral junction as flow direction turns from (A) caudal to cranial (ie, from negative to positive at t = 0.5 s) and from (B) cranial to caudal (ie, from positive to negative at t = 1.0 s). (Note that each color represents an interval of velocities, as specified in the scales to the right in the figure.)
The Reynolds numbers were highest below the craniovertebral junction. We estimated an upper limit of approximately 780 at the time of peak flow 6 cm below the foramen magnum. Higher up, at the foramen magnum and 1 cm above, corresponding numbers were approximately 30% less.
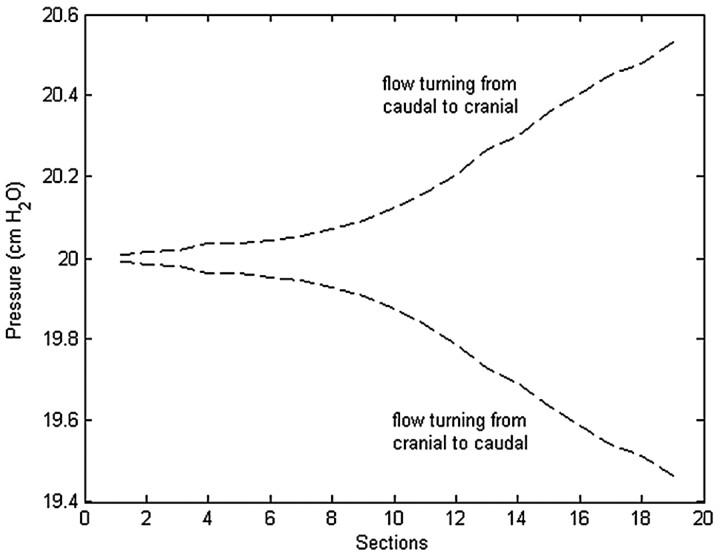
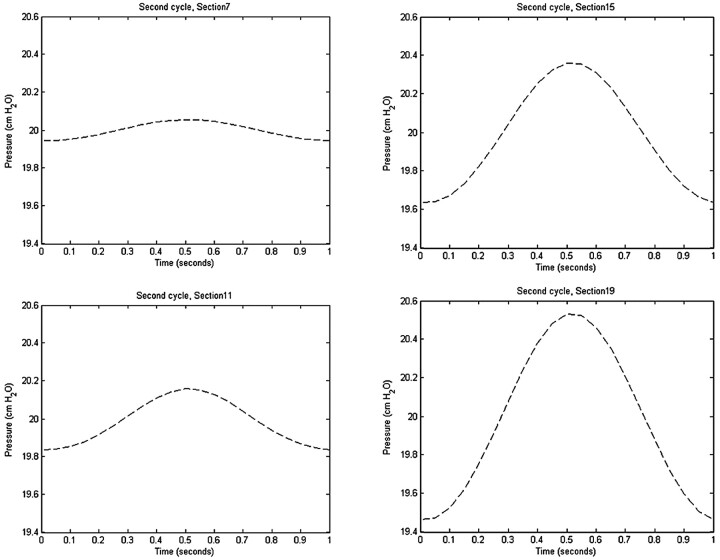
Through the cycle, pressure varied about the reference mean pressure at each spinal level. Pressure generally varied between axial sections but was approximately constant within each of the 19 sections. A relatively uniform pressure gradient along the cord was evident at each time during the cycle. The pressure gradient maximized at those times in the cardiac cycle when flow direction changed (Fig 8 ) and approached zero at the times of maximal flow. The largest pressure fluctuations with time were seen in the lowest sections (Fig 9 ), where the pulse pressure was 1 cm H2O.
Fig 8.
Simulated pressures in axial sections at the times when flow direction changed from caudal to cranial (t = 0.5 s) and when flow direction changed from cranial to caudal (t = 1.0 s).
Fig 9.
Pressure changes during the second cycle in axial sections 7, 11, 15, and 19 at 4 cm apart and progressively lower in the spinal canal. Section 7 is approximately 1 cm above the craniovertebral junction. The cyclic pressure changes are minimal near the craniovertebral junction (section 7) and are progressively greater with distance along the spinal canal (sections 11–19).
Validation
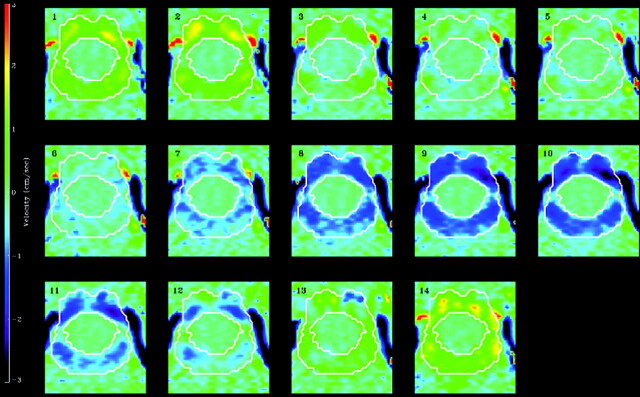
At the craniocervical junction, axial flow images from the model (Fig 5A) showed heterogeneity both during craniocaudal and caudocranial flow, characterized by 2 high-velocity regions anteriorly, one to each side of the sagittal plane. These regions correspond to the high-velocity regions seen in PCMR imaging measurements (Fig 10) in healthy subjects.6,10,11
Fig 10.
Phase-contrast MR images of CSF flow at the craniovertebral junction in a healthy volunteer demonstrate flow velocities at 14 evenly spaced phases of the cardiac cycle.6 The subarachnoid space is outlined by the white lines. CSF flow in the subarachnoid space is indicated by color coding, with positive values for cephalad flow and negative values for caudad flow. The scale is positive 3 cm/s to negative 3 cm/s (vertical bar on the left). Each of the 14 sections is oriented with the anterior side up.
Discussion
In this study, we have shown that in an idealized 3D simulation model of the craniocervical region, computational flow analysis demonstrates variations in fluid velocities between axial sections and within each axial section of the model. The flow simulation in the model shows a pattern of velocities seen in typical PCMR imaging in healthy subjects, as reported in studies in which axial PCMR images are obtained.6,11,12 In the model, fluid velocities were higher in the craniovertebral junction region than in the posterior fossa and greater below the craniovertebral junction than in it. The computed pulse pressure of 1 cm H2O compared favorably with the cervical pulse pressure of 1 to 2 mm Hg (1.3–2.7 cm H2O) measured in healthy individuals by Heiss et al10 in 1999. The heterogeneity of flow velocities around the cord generates a complicated force interaction between CSF and the spinal cord that needs further investigation. Another finding that requires more study is the synchronous bidirectional flow found in our model. This observation raises the question of whether synchronous bidirectional flow is a normal or abnormal phenomenon. The answer might be important for diagnosing pathologic cases.
This initial study, intended to illustrate and validate CFD methodology for the study of CSF flow, had limitations. The geometric model was not designed to represent any single patient or an average person. It was designed to investigate in spatiotemporal detail the effect of anatomic variation on CSF flow. The model had no fourth ventricle, fourth ventricular outlets, or tentorium, structures that for this simulation were assumed to have minor significance. The assumption seems acceptable because the model without them yielded flows similar to those in healthy subjects. The model did not reproduce exactly the anatomy of the subject with which it is compared in Fig 2. Specifically, the location of the cord in the subarachnoid space below C2 appears more anterior in the model than in the healthy subject. The position of the cord in MR images varies from one subject to another and varies with the amount of neck flexion and extension. With additional simulation studies, the effect of the spinal cord position can be calculated. In our preliminary studies, we observed changes in velocities but no loss of the typical pattern of velocities as the cord position is changed. For simplicity, the boundaries of the fluid space are assumed to have no elasticity or movement. This assumption seemed justified because movements and deformations of the human cord, brain, and dura are small relative to the geometric dimensions of the subarachnoid space. Levy13 found movement on the order of a millimeter, whereas other authors have reported movements of less than 1 mm.14,15 In the right-left direction, motion is even smaller.15 Oldfield et al16 found larger tonsillar motions in patients who were undergoing cranio-occipital decompression. Stiffness modulus values of 0.001 to 1.88 MPa have been found to be typical for the spinal cord tissue,17,18 whereas for the more robust dura mater at the outer boundary, a modulus of 10 MPa has been suggested.3 The validation, on the basis of limited PCMR imaging data, does not prove that the model will predict accurately in human subjects but suggests it will be useful to predict changes in flow and pressure resulting from anatomic variations. We assumed a straight spinal canal, but we can also model a normal cervical lordosis or changes in the spinal canal because of changes in neck position and calculate their effects on velocities and sheer forces. A heart rate of 60 beats/min was assumed, but we can also vary the sine wave to model different heart rates. We have assumed a plug-shaped inflow/outflow velocity profile with sinusoidal variation in time, but we intend to investigate the impact of other velocity inflow/outflow conditions. The specification of flow velocity at the inflow and outflow boundaries as homogeneous was compensated by elongating the model. This allows the flow to become fully developed and, realistically, more heterogeneous by the time it reaches the axial border sections of the relevant region (red lines, Fig 1). The estimated upper limit of Reynolds numbers (≈ 780) indicates a laminar flow regime, as also was reported by Loth et al.2
We noted simultaneous bidirectional flow in the model, a finding not yet observed among healthy subjects.6 The low-velocity bidirectional flow might not be detected with conventional PCMR imaging, given its limited temporal and spatial resolution. Bidirectional flow was observed in the model at reversal of fluid flow, as it has been in patients with the Chiari I malformation.6
Our study has shown that it is possible to perform realistic 3D simulations of flow variables within the craniocervical region during a period of several cardiac cycles. With 3D flow simulations in a simplified geometric model, such as the one used here, cyclic CSF flow dynamics may be better understood. It is important to note that by changing the geometry and the flow parameters of the mathematic model, new simulations will advance our understanding of how flow characteristics are related to these parameters. Such an understanding has thus far been hard to reach for the craniocervical region because MR imaging and related techniques still do not allow sufficiently detailed measurements to be collected. Computer simulations hold the promise of defining the CSF flow abnormalities that cause syringomyelia or require surgical treatment.
Conclusions
CSF velocity and pressure variations during the cardiac cycle can be studied in spatiotemporal detail by use of a simplified geometric approximation of the human subarachnoid space with computational software that solves the equations governing incompressible viscous fluid flow.
Acknowledgment
The authors thank Dr. Anders Helgeland for his excellent production of the animations.
Footnotes
Supported by a Center of Excellence grant from the Norwegian Research Council to the Center for Biomedical Computing at Simula Research Laboratory.
References
- 1. Roldan A, Wieben O, Haughton V, et al. Characterization of CSF hydrodynamics in the presence and absence of tonsillar ectopia by means of computational flow analysis. AJNR Am J Neuroradiol 2009; 30: 941–46 [DOI] [PMC free article] [PubMed] [Google Scholar]
- 2. Loth F, Yardimci MA, Alperin N. Hydrodynamic modeling of cerebrospinal fluid motion within the spinal cavity. J Biomech Eng 2001; 123: 71–79 [DOI] [PubMed] [Google Scholar]
- 3. Bertram CD, Brodbelt AR, Stoodley MA. The origins of syringomyelia: numerical models of fluid/structure interactions in the spinal cord. J Biomech Eng 2005; 127: 1099–109 [DOI] [PubMed] [Google Scholar]
- 4. Star-CD, Star-CD User Guide and Methodology, version 3.26. Computational Dynamics Ltd, London; 2007 [Google Scholar]
- 5. The Visible Human Project. Available at: www.nlm.nih.gov/research/visible/visible_human.html. Accessed May 2007
- 6. Quigley MF, Iskandar B, Quigley MA, et al. Cerebrospinal fluid flow in foramen magnum: temporal and spatial patterns at MR imaging in volunteers and in patients with Chiari I malformation. Radiology 2004; 232: 229–36 [DOI] [PubMed] [Google Scholar]
- 7. The MathWorks Inc, Matlab for Microsoft Windows [Version 5.3.0.10183 (R11)]; 1999 [Google Scholar]
- 8. Womersley JR. Method for the calculation of velocity, rate flow, and viscous drag in arteries when the pressure gradient is known. J Physiol 1955; 127: 553–63 [DOI] [PMC free article] [PubMed] [Google Scholar]
- 9. VoluViz. Available at: http://brage.unik.no/personer/andershe/papers/voluviz/voluviz.html. Accessed April 2009
- 10. Heiss JD, Patronas N, DeVroom HL, et al. Elucidating the pathophysiology of syringomyelia. J Neurosurg 1999; 91: 553–62 [DOI] [PubMed] [Google Scholar]
- 11. Hofmann E, Warmuth-Metz M, Bendszus M, et al. Phase-contrast MR imaging of the cervical CSF and spinal cord: volumetric motion analysis in patients with Chiari I malformation. AJNR Am J Neuroradiol 2000; 21: 151–58 [PMC free article] [PubMed] [Google Scholar]
- 12. Hofkes SK, Iskandar BJ, Turski PA, et al. Differentiation between symptomatic Chiari I malformation and asymptomatic tonsilar ectopia by using cerebrospinal fluid flow imaging: initial estimate of imaging accuracy. Radiology 2007; 245: 532–40 [DOI] [PubMed] [Google Scholar]
- 13. Levy LM. Toward an understanding of syringomyelia: MR imaging of CSF flow and neuraxis motion. AJNR Am J Neuroradiol 2000; 21: 45–46 [PMC free article] [PubMed] [Google Scholar]
- 14. Mikulis DJ, Wood ML, Zerdoner OA, et al. Oscillatory motion of the normal cervical spinal cord. Radiology 1994; 192: 117–21 [DOI] [PubMed] [Google Scholar]
- 15. Figley CR, Stroman PW. Investigation of human cervical and upper thoracic spinal cord motion: implications for imaging spinal cord structure and function. Magn Reson Med 2007; 58: 185–89 [DOI] [PubMed] [Google Scholar]
- 16. Oldfield EH, Muraszko K, Shawker TH, et al. Pathophysiology of syringomyelia associated with Chiari I malformation of the cerebellar tonsils. J Neurosurg 1994; 80: 3–15 [DOI] [PubMed] [Google Scholar]
- 17. Hung TK, Lin HS, Bunegin L, et al. Mechanical and neurological response of cat spinal cord under static loading. Surg Neurol 1982; 17: 213–17 [DOI] [PubMed] [Google Scholar]
- 18. Bilston LE, Thibault LE. The mechanical properties of the human cervical spinal cord in vitro. Ann Biomed Eng 1996; 24: 67–74 [DOI] [PubMed] [Google Scholar]


