Abstract
BACKGROUND AND PURPOSE:
Knowing the normal imaging appearance of the pituitary stalk is important for the diagnosis of pituitary infundibular lesions, and more accurate assessment of the stalk may be possible at 3T than at 1.5T. Our purpose was to evaluate the normal pituitary stalk by use of high-resolution MR imaging at 3T.
MATERIALS AND METHODS:
Sagittal MPRAGE images and high-resolution oblique-axial T2-weighted images of the pituitary stalk were acquired in 29 healthy volunteers (16 men and 13 women; mean age, 28 years; age range, 21–43 years) at 3T. The diameter and length of the pituitary stalk and the depth of the infundibular recess were measured. Signal intensity of the stalk was visually evaluated on T2-weighted images.
RESULTS:
The AP and transverse diameters of the pituitary stalk were 2.32 ± 0.39 mm and 2.16 ± 0.37 mm at the pituitary insertion, respectively, and 3.25 ± 0.43 mm and 3.35 ± 0.44 mm at the level of the optic chiasm. No significant differences were observed between the AP and transverse diameters at each level. The length of the stalk was 5.91 ± 1.24 mm, and the depth of the infundibular recess was 4.69 ± 0.87 mm. The stalk showed central hyperintensity with a peripheral rim of isointensity in 20 subjects (69%) and homogeneous isointensity in 9 subjects (31%).
CONCLUSIONS:
The data of the current study can serve as standard measurements of the normal pituitary stalk. The central hyperintensity and peripheral rim may represent the infundibular stem and pars tuberalis, respectively.
The pituitary stalk is a funnel-like structure connecting the median eminence of the hypothalamus to the pituitary gland. A wide spectrum of neoplastic, inflammatory, and infectious disorders, such as germinoma, Langerhans cell histiocytosis, lymphocytic infundibuloneurohypophysitis, and sarcoidosis affect the pituitary stalk and cause stalk thickening.1–5 Thus, knowledge of the normal imaging appearance of the pituitary stalk is important for the accurate diagnosis of pituitary infundibular lesions.
There are several CT and MR imaging studies regarding the normal pituitary stalk. Peyster et al6 measured the diameter of the normal pituitary stalk on CT, whereas Simmons et al7 assessed the transverse dimension, shape, signal intensity on T1-weighted images, and enhancement pattern of the pituitary stalk on 1.5T MR images. Araki et al8 evaluated the signal intensity of the normal pituitary stalk on FLAIR images. However, direct signal intensity evaluation of the normal pituitary stalk on T2-weighted images has not been published yet because CSF in the suprasellar cistern may easily mask the pituitary stalk because of insufficient spatial resolution. To the best of our knowledge, the measurements of the length of the normal pituitary stalk and the depth of the infundibular recess of the third ventricle have not been reported.
3T MR imaging has a significantly improved SNR compared with 1.5T MR imaging, and the increase in the SNR may, in turn, be applied to improve spatial resolution.9,10 More accurate assessment of the pituitary stalk may be possible with high-resolution images at 3T, including direct signal intensity evaluation on T2-weighted images and measurement of the length of the stalk and the depth of the infundibular recess. The purpose of this study was to evaluate the normal pituitary stalk with use of high-resolution MR imaging at 3T.
Materials and Methods
Subjects
From May to September 2008, a total of 29 healthy adult volunteers (16 men and 13 women; mean age, 28 years; age range, 21–43 years) participated in this study. The volunteers underwent MR examination exclusively for this study. No subject had any neurologic signs or symptoms or a history of pituitary disorders. All subjects provided written informed consent before MR examination, and the study protocols were approved by the local medical ethics committee.
MR Imaging
We performed MR imaging using a 3T MR scanner (Magnetom Trio; Siemens, Erlangen, Germany) with an 8-channel phased-array head coil. Initially, 3D MPRAGE images of the whole brain, precisely positioned in the sagittal plane with reference to the localized scans, were obtained for the localization of the pituitary stalk. Imaging parameters were as follows: TR, 2000 ms; TE, 4.4 ms; TI, 990 ms; flip angle, 8°; FOV, 210 × 224 mm; matrix, 240 × 256; section thickness, 1 mm; sections, 208; averaging, 1; and acquisition time, 4 minutes 26 seconds. The GRAPPA algorithm was applied with a reduction factor of 2. The pituitary stalk was identified on the median MPRAGE image, and then high-resolution T2-weighted oblique-axial fast spin-echo images, perpendicular to the long axis of the pituitary stalk, were obtained to cover the entire pituitary stalk with the following parameters: TR, 6000 ms; TE, 104 ms; turbo factor, 11; FOV, 130 × 130 mm; matrix, 448 × 448; section thickness, 2 mm; no gap; sections, 10; averaging, 1; and acquisition time, 11 minutes 12 seconds. The GRAPPA algorithm was not applied.
Imaging Analysis
We performed all imaging assessments using OsiriX Imaging software, version 2.7.5 (http://www.osirix-viewer.com/).
Measurements
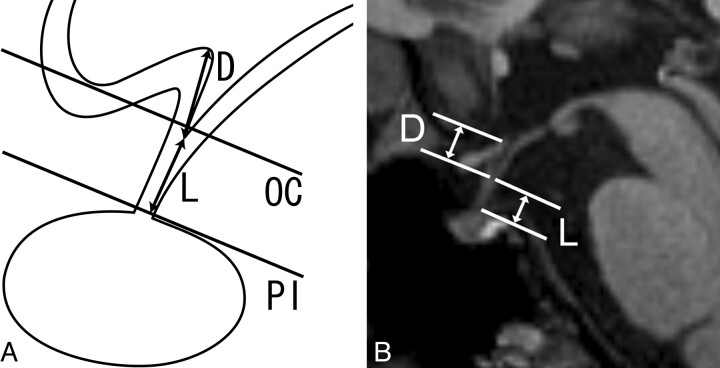
The diameter and the length of the pituitary stalk and the depth of the infundibular recess of the third ventricle were assessed for each subject (Fig 1). Both the AP and transverse diameters of the pituitary stalk were measured on T2-weighted oblique-axial images at 2 levels (at its insertion on the pituitary gland and at the level of the optic chiasm). These levels were chosen for measurement because Simmons et al7 measured the transverse diameter of the pituitary stalk on 1.5T MR imaging at these 2 levels. The length of the pituitary stalk and the depth of the infundibular recess were evaluated on the median sagittal MPRAGE image. The length of the pituitary stalk was defined and measured as the distance from the tip of the infundibular recess to the junction of the pituitary stalk and the pituitary gland along the course of the pituitary stalk. Six of 29 subjects (2 men and 4 women) had a convex superior margin of the pituitary gland in the current study, but there were no subjects in whom the superior gland margin protruded through the diaphragma sellae. Thus, the junction of the pituitary stalk and gland was angular and was identifiable in all subjects. The depth of the infundibular recess was defined and measured as the distance from the tip of the infundibular recess to the floor of the third ventricle at the anterior edge of the infundibular recess. Because the posterior wall of the infundibular recess often made a smooth transition to the floor of the third ventricle, or the tuber cinereum, the third ventricular floor at the posterior edge of the recess or at the midpoint of a line defined by the anterior and posterior margins was difficult to adopt as the superior extent of the infundibular recess. The ratio of the length of the stalk to the depth of the infundibular recess was also calculated for each subject.
Fig 1.
The method of measurement of the pituitary stalk and infundibular recess. A, Schematic illustration of the pituitary stalk in the midsagittal plane demonstrates the depth of the infundibular recess (D) and the length of the pituitary stalk (L). The 2 lines indicate the levels at which the diameters of the pituitary stalk were measured (PI = the pituitary insertion of the pituitary stalk, OC = the level of the optic chiasm). B, Median sagittal MPRAGE image shows the depth of the infundibular recess (D) and the length of the pituitary stalk (L).
Signal Intensity
We visually assessed the signal intensity of the pituitary stalk relative to the cerebral white matter at its insertion on the pituitary gland by using the T2-weighted oblique-axial image. The most inferior level of the pituitary stalk was selected for signal intensity evaluation because the infundibular recess of the third ventricle variably extends into the pituitary stalk, and CSF in the infundibular recess may cause a partial volume effect at a more superior level of the stalk. The level was cross-referenced with the midsagittal MPRAGE image and confirmed to lie below the tip of the infundibular recess.
Statistical Analysis
We conducted a comparison of the AP and transverse diameters at each level of the stalk by using the paired t test. A value of P < .05 was considered to show a statistically significant difference. We performed statistical analysis using SPSS software (version 12; SPSS, Chicago, Illinois).
Results
Measurements
The measurements are summarized in the accompanying Table. There was no significant difference between the AP and transverse diameters at each level of the stalk (at the pituitary insertion, P = .104; at the level of the optic chiasm, P = .316).
Measurements of the normal pituitary stalk
| Mean ± SD | Range | |
|---|---|---|
| Diameter at the pituitary insertion (mm) | ||
| Anteroposterior | 2.32 ± 0.39 | 1.65–3.17 |
| Transverse | 2.16 ± 0.37 | 1.56–3.04 |
| Diameter at the level of optic chiasm (mm) | ||
| Anteroposterior | 3.25 ± 0.43 | 2.25–4.08 |
| Transverse | 3.35 ± 0.44 | 2.39–4.21 |
| Length of the stalk (mm) | 5.91 ± 1.24 | 3.26–8.66 |
| Depth of the infundibular recess (mm) | 4.69 ± 0.87 | 3.28–6.52 |
| Ratio of the length of the stalk to the depth of the infundibular recess | 1.30 ± 0.39 | 0.70–2.19 |
Signal Intensity
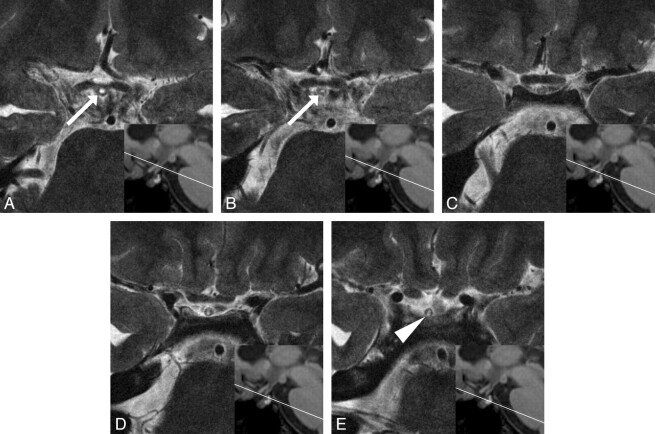
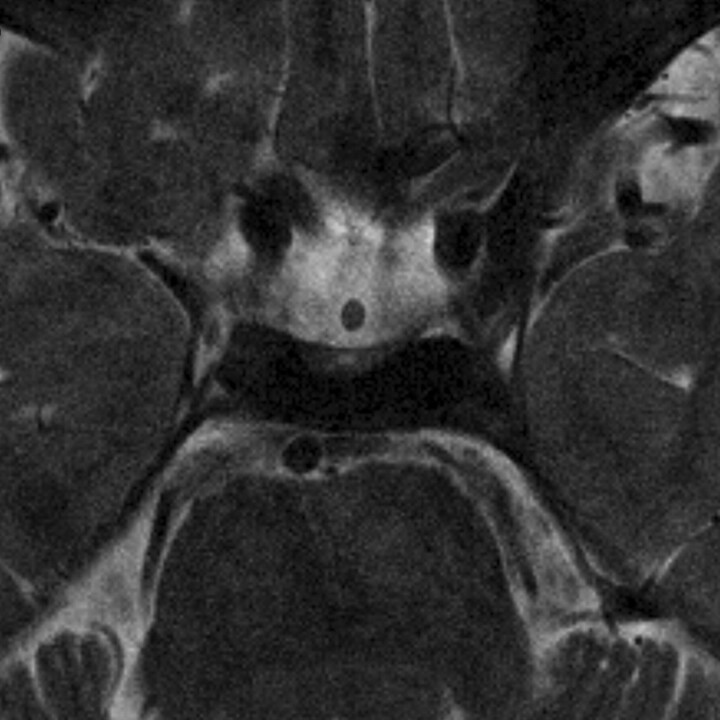
On T2-weighted oblique-axial images, the pituitary stalk showed central hyperintensity with a peripheral rim of isointensity compared with the cerebral white matter in 20 (69%) of 29 subjects (Fig 2). In the other 9 subjects (31%), the pituitary stalk showed homogeneous isointensity (Fig 3). CSF flow artifacts in the suprasellar cistern were variably observed on T2-weighted images, but these did not impair the evaluation of the signal intensity of the pituitary stalk.
Fig 2.
T2-weighted oblique-axial images of the pituitary stalk of a 34-year-old healthy woman. Consecutive images with 2-mm intervals are presented from superior (A) to inferior (E), along with a reference line of each imaged level on the midsagittal MPRAGE image. The infundibular recess (arrows) ends at the midstalk level. The parenchyma of the pituitary stalk at its insertion on the pituitary gland shows central hyperintensity with a peripheral rim of isointensity (arrowhead) compared with the cerebral white matter.
Fig 3.
T2-weighted oblique-axial image of the pituitary stalk of a 34-year-old healthy man. The pituitary stalk shows homogeneous isointensity with the cerebral white matter at its insertion on the pituitary gland.
Discussion
We assessed the normal pituitary stalk in detail by using high-resolution MR images at 3T. 3T MR imaging provides a higher SNR compared with 1.5T MR imaging, resulting in improved spatial resolution and image quality.9,10 3T MR imaging has previously been found to be superior to standard 1.5T imaging for the evaluation of sellar and parasellar anatomy, and improved surgical planning for sellar lesions.11,12 To the best of our knowledge, the length of the pituitary stalk, the depth of the infundibular recess, and the signal intensity of the pituitary stalk on T2-weighted images were evaluated on MR images for the first time in the current study.
The diameter of the normal pituitary stalk measured on oblique-axial images was 2.32 ± 0.39 mm for the AP diameter and 2.16 ± 0.37 mm for the transverse diameter at the pituitary insertion. The AP diameter was 3.25 ± 0.43 mm and the transverse diameter was 3.35 ± 0.44 mm, respectively, at the level of the optic chiasm. Peyster et al6 found that the upper size limit of the diameter of the normal pituitary stalk on axial CT images was 4.0 mm at the level of the dorsum sella and 4.5 mm at the suprasellar level. On 1.5T MR imaging, Tien et al3 reported that the upper limit of the width of the normal pituitary stalk was 2.8 mm at the midpoint and 3.5 mm near the median eminence, whereas the transverse diameter measured by Simmons et al7 on coronal images was 1.91 ± 0.40 mm near the insertion on the pituitary gland and 3.25 ± 0.56 mm near the optic chiasm. The optic chiasm results of the current study support the earlier observation. However, the current findings at the pituitary insertion are larger than those of Simmons et al,7 and this difference may be the result of the difference in spatial resolution between 1.5T and 3T MR imaging and/or the difference in the imaging plane. No significant differences were observed in the current study between the AP and transverse diameters at both levels, and we postulate that stalk thickening can be evaluated in any direction on the basis of our results.
We measured the length of the pituitary stalk and the depth of the infundibular recess and also calculated the ratio between these measurements, which showed considerable variability. The optic chiasm and the tuber cinereum form the infundibular recess in the anteroinferior floor of the third ventricle. Because the infundibular recess can vary greatly in shape and size, the degree of its extension inferiorly along the pituitary stalk may contribute to the size and contour of the pituitary stalk.7,13 Shibata and Maravilla14 reported a case of a third-ventricle infundibular diverticulum that mimicked stalk thickening. The knowledge of the normal size of the infundibular recess is important for the assessment of pituitary infundibular lesions.
Some authors have previously assessed the signal intensity of the normal pituitary stalk on MR images. Simmons et al7 reported that the stalk is typically hypointense relative to the posterior pituitary lobe and the optic chiasm on T1-weighted images. Araki et al8 reported that the normal pituitary stalk showed hyperintensity on FLAIR images in 73% of the cases, presumably related to a prolonged T2 value of the pituitary stalk. However, the precise evaluation of the pituitary stalk on T2-weighted images has been difficult on standard 1.5T MR imaging because of insufficient spatial resolution.
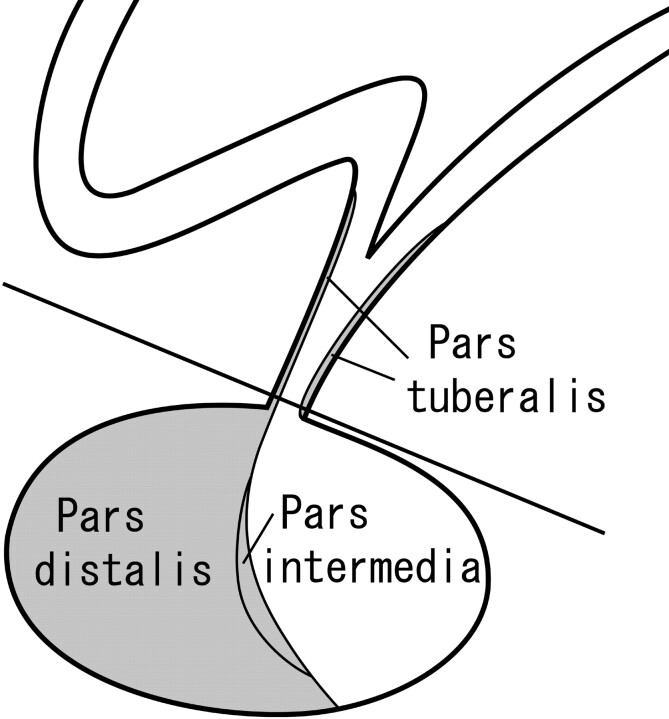
In the current study, high-resolution T2-weighted images revealed the pituitary stalk to have central hyperintensity with a peripheral rim of isointensity compared with the cerebral white matter in 69% of the subjects. It remains unclear why the pituitary stalk shows this concentric zonal structure. The pituitary stalk is composed of the infundibular stem of the neurohypophysis and the pars tuberalis of the adenohypophysis.1,15–17 The adenohypophysis is divided into 3 parts: the pars distalis, the pars intermedia, and the pars tuberalis (Fig 4). The pars distalis forms the intrasellar adenohypophysis, whereas the pars intermedia is vestigial in humans. The pars tuberalis, the continuation of the pars distalis, is a delicate layer of pituitary tissue permeated by numerous capillary loops of the hypophyseal-portal plexus, and though it encircles the infundibular stem, its extent is variable.18 On the other hand, the infundibular stem is the pathway of oxytocin and vasopressin, which are produced in the supraoptic and paraventricular nuclei of the hypothalamus, to the posterior pituitary lobe. The central hyperintensity and peripheral isointense rim of the pituitary stalk may represent the infundibular stem and pars tuberalis, respectively. Although the reason for a prolonged T2 value of the infundibular stem is still unclear, Araki et al8 presumed that the fluid-rich components of the pituitary stalk, such as pituitary portal veins and hypothalamic hormones, may cause the prolongation of the T2 value of the stalk. The hyperintensity of the infundibular stem may reflect histologic characteristics such as the axonal diameter or the thickness of the myelin sheath, similar to the hyperintensity of the normal corticospinal tract in the internal capsule.19 The hypophyseal portal system is unlikely to influence the signal intensity of the central pituitary stalk because it predominantly encircles the pituitary stalk and permeates the pars tuberalis.
Fig 4.
Schematic sagittal illustration of the pituitary stalk and gland demonstrating its components. The adenohypophysis is shaded in gray. The line indicates the level of the pituitary insertion at which the signal intensity of the pituitary stalk was assessed.
The data of the current study on the normal pituitary stalk can serve as a standard in the diagnosis of stalk thickening, which is clinically important for proper diagnosis and treatment of various infundibular pathologic conditions. High-resolution T2-weighted images may contribute to the diagnosis of some pituitary infundibular diseases, though there have been no documented accounts referring to any specific disorders that decrease the signal intensity of the pituitary stalk on FLAIR images. The concentric zonal anatomy of the pituitary stalk visualized on high-resolution T2-weighted images may allow speculation of the site of origin of some suprasellar tumors, such as supradiaphragmatic pituitary adenoma and pituicytoma.
There were several limitations to our study. First, histopathologic correlation of the pituitary stalk was absent. We could not obtain specimens of the imaged pituitary stalk because all subjects were healthy volunteers. Second, the effect of age on the appearance of the pituitary stalk was not evaluated. Children and elderly people were not included in our subjects. The size, shape, and signal intensity of the normal pituitary gland changes dramatically depending on age or physiologic status,20–22 and the pituitary stalk may show similar changes. This will be a subject for future investigation.
Conclusions
In conclusion, we have evaluated the normal pituitary stalk in detail by using 3T MR imaging, thereby providing a standard for the size of the normal pituitary stalk. The pituitary stalk frequently shows central hyperintensity with a peripheral rim of isointensity on high-resolution T2-weighted images, which may represent the infundibular stem and pars tuberalis, respectively.
Abbreviations
- AP
anteroposterior
- FLAIR
fluid-attenuated inversion recovery
- GRAPPA
generalized autocalibrating partially parallel acquisitions
- MPRAGE
magnetization-prepared rapid acquisition gradient echo
- SNR
signal-to-noise ratio.
References
- 1. Hamilton BE, Salzman KL, Osborn AG. Anatomic and pathologic spectrum of pituitary infundibulum lesions. AJR Am J Roentgenol 2007;188:W223–32 [DOI] [PubMed] [Google Scholar]
- 2. Kanagaki M, Miki Y, Takahashi JA, et al. MRI and CT findings of neurohypophyseal germinoma. Eur J Radiol 2004;49:204–11 [DOI] [PubMed] [Google Scholar]
- 3. Tien RD, Newton TH, McDermott MW, et al. Thickened pituitary stalk on MR images in patients with diabetes insipidus and Langerhans cell histiocytosis. AJNR Am J Neuroradiol 1990;11:703–08 [PMC free article] [PubMed] [Google Scholar]
- 4. Sato N, Sze G, Endo K. Hypophysitis: endocrinologic and dynamic MR findings. AJNR Am J Neuroradiol 1998;19:439–44 [PMC free article] [PubMed] [Google Scholar]
- 5. Bihan H, Christozova V, Dumas JL, et al. Sarcoidosis: clinical, hormonal, and magnetic resonance imaging (MRI) manifestations of hypothalamic-pituitary disease in 9 patients and review of the literature. Medicine (Baltimore) 2007;86:259–68 [DOI] [PubMed] [Google Scholar]
- 6. Peyster RG, Hoover ED, Adler LP. CT of the normal pituitary stalk. AJNR Am J Neuroradiol 1984;5:45–47 [PMC free article] [PubMed] [Google Scholar]
- 7. Simmons GE, Suchnicki JE, Rak KM, et al. MR imaging of the pituitary stalk: size, shape, and enhancement pattern. AJR Am J Roentgenol 1992;159:375–77 [DOI] [PubMed] [Google Scholar]
- 8. Araki Y, Ashikaga R, Takahashi S, et al. High signal intensity of the infundibular stalk on fluid-attenuated inversion recovery MR. AJNR Am J Neuroradiol 1997;18:89–93 [PMC free article] [PubMed] [Google Scholar]
- 9. Schmitz BL, Aschoff AJ, Hoffmann MH, et al. Advantages and pitfalls in 3T MR brain imaging: a pictorial review. AJNR Am J Neuroradiol 2005;26:2229–37 [PMC free article] [PubMed] [Google Scholar]
- 10. Kuhl CK, Traber F, Schild HH. Whole-body high-field-strength (3.0-T) MR imaging in clinical practice. Part I. Technical considerations and clinical applications. Radiology 2008;246:675–96 [DOI] [PubMed] [Google Scholar]
- 11. Wolfsberger S, Ba-Ssalamah A, Pinker K, et al. Application of three-Tesla magnetic resonance imaging for diagnosis and surgery of sellar lesions. J Neurosurg 2004;100:278–86 [DOI] [PubMed] [Google Scholar]
- 12. Pinker K, Ba-Ssalamah A, Wolfsberger S, et al. The value of high-field MRI (3T) in the assessment of sellar lesions. Eur J Radiol 2005;54:327–34 [DOI] [PubMed] [Google Scholar]
- 13. Greitz T, Lofstedt S. The relationship between the third ventricle and the basilar artery. Acta Radiol 1954;42:85–100 [DOI] [PubMed] [Google Scholar]
- 14. Shibata DK, Maravilla KR. Diverticulum of the third-ventricle infundibulum: a normal variant simulating an abnormality of the pituitary stalk on MR images. AJR Am J Roentgenol 1994;163:423–24 [DOI] [PubMed] [Google Scholar]
- 15. Elster AD. Modern imaging of the pituitary. Radiology 1993;187:1–14 [DOI] [PubMed] [Google Scholar]
- 16. Elster AD. Imaging of the sella: anatomy and pathology. Semin Ultrasound CT MR 1993;14:182–94 [DOI] [PubMed] [Google Scholar]
- 17. Castillo M. Pituitary gland: development, normal appearances, and magnetic resonance imaging protocols. Top Magn Reson Imaging 2005;16:259–68 [DOI] [PubMed] [Google Scholar]
- 18. Rasmussen AT. The proportions of the various subdivisons of the normal adult human hypophysis cerebri and the relative number of the different types of cells in pars distalis, with biometric evaluation of age and sex differences and special consideration of basophilic invasion into the infundibular process. In: Timme W, Frantz AM, Hare CC. eds. The Pituitary Gland: An Investigation of the Most Recent Advances. Baltimore: Williams & Wilkins; 1938:118–50 [Google Scholar]
- 19. Yagishita A, Nakano I, Oda M, et al. Location of the corticospinal tract in the internal capsule at MR imaging. Radiology 1994;191:455–60 [DOI] [PubMed] [Google Scholar]
- 20. Tien RD, Kucharczyk J, Bessette J, et al. MR imaging of the pituitary gland in infants and children: changes in size, shape, and MR signal with growth and development. AJR Am J Roentgenol 1992;158:1151–54 [DOI] [PubMed] [Google Scholar]
- 21. Miki Y, Asato R, Okumura R, et al. Anterior pituitary gland in pregnancy: hyperintensity at MR. Radiology 1993;187:229–31 [DOI] [PubMed] [Google Scholar]
- 22. Miki Y, Kataoka ML, Shibata T, et al. The pituitary gland: changes on MR images during the 1st year after delivery. Radiology 2005;235:999–1004 [DOI] [PubMed] [Google Scholar]


