Abstract
BACKGROUND AND PURPOSE:
Elevated OEF is a surrogate for misery perfusion. Our aim was to detect misery perfusion in patients with unilateral steno-occlusive disease of the ICA or MCA by using T2*-based MR imaging and to determine the relationship between brain ischemia and OEF.
MATERIALS AND METHODS:
Twenty-three patients with unilateral steno-occlusive disease of the ICA or MCA and 8 healthy volunteers were included in this study. Hemodynamic information was obtained in all subjects by MR imaging. Three regions of interest were placed in the anterior, middle, and posterior parts of the brain bilaterally to measure the OEF and CBF values. The OEFs of the regions of interest in the hemispheres ipsilateral and contralateral to the vascular lesions were compared. Brain regions with OEF greater than that in controls were determined as misery perfusion in patients. The association of vascular lesions, rCBF, and the presence of territory infarction with elevated OEF was investigated.
RESULTS:
There was a statistically significant difference in OEF between the ipsilateral and contralateral hemispheres in the patients (t = 3.632, P = .001). Fourteen regions of interest with misery perfusion were determined in the ipsilateral hemispheres, while 3 regions with elevated OEFs were found in the contralateral hemispheres. In the ipsilateral hemispheres, decreased rCBF was associated with elevated OEF (r = −0.451, P < .001). Patients with territory infarction had more regions of interest with misery perfusion than patients without territory infarction (χ2 = 3.889, P = .049).
CONCLUSIONS:
By using the MR imaging technique, misery perfusion demonstrated as elevated OEF was detected in patients with severe atherosclerotic ICA or MCA disease. Identification of misery perfusion with MR imaging may be helpful in the evaluation of brain ischemia.
Occlusion or severe stenosis of the carotid artery and its major branches is the leading cause of cerebral ischemia. These vascular lesions may lead to reduced pressure in the distal arterial system, depending on the degree of stenosis and the adequacy of collateral channels. The first reflex of the cerebral vasculature to a fall in arterial perfusion pressure is autoregulatory vasodilation. As vessels become maximally dilated and cerebral blood flow continues to decline, the brain increases the fraction of oxygen it extracts from the blood (OEF) to maintain normal oxygen metabolism and neuronal function. This is known as misery perfusion or stage 2 hemodynamic compromise.1–3 The presence of increased OEF distal to an occluded carotid artery has been proved to be a powerful and independent risk factor for subsequent stroke.4,5 Patients in this situation are at a higher risk for stroke and can be candidates for surgical intervention.
In recent years, advances in imaging technology has enabled researchers to access cerebral hemodynamic status and the capacity to compensate for ischemia with vasodilation and collateral circulation. The techniques involve xenon-enhanced CT, transcranial Doppler, single-photon emission tomography,6–8 and MR imaging9–11 to measure cerebral blood flow before and after the administration of acetazolamide or inhaled CO2. However, these techniques can only detect the decreased dilation of vasculature or “steal effect,” termed “stage I hemodynamic compromise.” PET measurement of OEF remains the only way to determine misery perfusion. However, the high cost and limited availability restricts its clinical use.
Therefore, an additional parameter reflecting the cerebral metabolic state would improve our ability to identify the threatened brain tissue. One candidate is deoxyhemoglobin in the cerebral capillaries and veins as an indicator of the OEF, which can be visualized by T2*-based BOLD imaging. Some researchers were able to provide a better estimation of the real penumbra with the changes in signal intensity from deoxyhemoglobin.12 With the current understanding of the underlying mechanism of BOLD contrast, an absolute quantification of cerebral oxygenation is possible by measuring the signal-intensity alteration induced by deoxyhemoglobin. On the basis of an analytic model, An and Lin13 proposed some specifically designed sequences to obtain quantitative measures of the OEF; results consistent with those of PET studies were obtained in humans during both normocapnia and hypercapnia. In this study, we applied this promising method to investigate the oxygenation metabolism in patients with unilateral atherosclerotic steno-occlusive disease of the ICA and its major branches.
Materials and Methods
In total, 8 healthy volunteers and 23 patients were studied, after written informed consent was obtained. The ethics committee at Beijing University approved all the protocols used in this study. All patients were prospectively selected from patients who had been referred to our MR imaging unit for evaluation of cerebral ischemic disease. Inclusion criteria were the following: 1) unilateral occlusion or stenosis of the ICA (>70% diameter reduction) or MCA (>50% diameter reduction) documented by DSA or MRA, and 2) a history of transient ischemic attack or stroke in an appropriate ICA or MCA distribution. Exclusion criteria were the following: 1) patients with a history of transient ischemic attack or stroke in the hemisphere contralateral to arterial disease, 2) patients with occlusion or severe stenosis of vertebrobasilar artery, 3) patients who had undergone extracranial-to-intracranial bypass, and 4) patients with potential sources of cardiogenic embolism. All studies were performed at least 2 weeks after the last ischemic episode. Healthy volunteers were recruited from the relatives of the hospital staff.
MR imaging studies were performed by using a 3T MR imaging HD scanner (General Electric, Milwaukee, Wisconsin) and an 8-channel head coil. Initially, all patients had routine clinical pulse sequences, including axial T1-weighted FLAIR, axial T2-weighted FLAIR, and diffusion-weighted imaging. Then ASL and GESSE sequences were performed to obtain the hemodynamic information. CBF can be measured with ASL by using intravascular water as an endogenous contrast agent.11,14 The parameters for ASL were the following: TR = 3000 ms, TE = 3.4 ms, flip angle = 20°, matrix = 128 × 128, NEX = 1, section thickness = 8.0 mm, gap = 2 mm. GESSE is a multiecho gradient and spin-echo MR imaging sequence reported previously.13 The imaging parameters used in this study were as follows: TR = 1.5 seconds, TE = 56 ms, bandwidth = 62.5 kHz, matrix = 128 × 128, FOV = 240 × 240 mm, section thickness = 7.5 mm, NEX = 4, scanning time = 12 minutes 55 seconds. In total, 32 echoes with an echo spacing of 1.5 ms were acquired, and 32 images were obtained to be used as raw data for calculation of the OEF. Only 1 axial section just above the corpus callosum was acquired in this study so that the potential cross-talk, signal intensity interference between 2 adjacent sections, and bone-gas interface artifacts could be minimized.
A theoretic signal-intensity model, which describes the signal-intensity dephasing phenomena in the presence of deoxyhemoglobin, was used for postprocessing of the acquired images and obtaining a quantitative measurement of the OEF.15 This was achieved with software built in-house. Estimation of OEF can be summarized into the following steps: 1) First, R2 mapping was obtained, and then the effect of R2 was removed from the original signals. 2) Second, the signals from the spin echoes and the gradient echoes were divided into 2 parts, signals of short and long scale. R2′ mapping was obtained with a linear least-squares curve fitting of the MR imaging signals of the gradient echoes of the long scale. 3) Third, signals from the short scale were fitted to a second-order polynomial function for estimate of λ, which represents venous blood volume. 4) Last, after obtaining R2′ and λ, one can determine OEF from the following equation:
 |
where γ is the gyromagnetic ratio, Hct is the fractional hematocrit, B0 is the main magnetic field strength, and ▵χ0 is the susceptibility difference between fully oxygenated and fully deoxygenated blood that has been measured as 0.18 ppm per unit hematocrit.
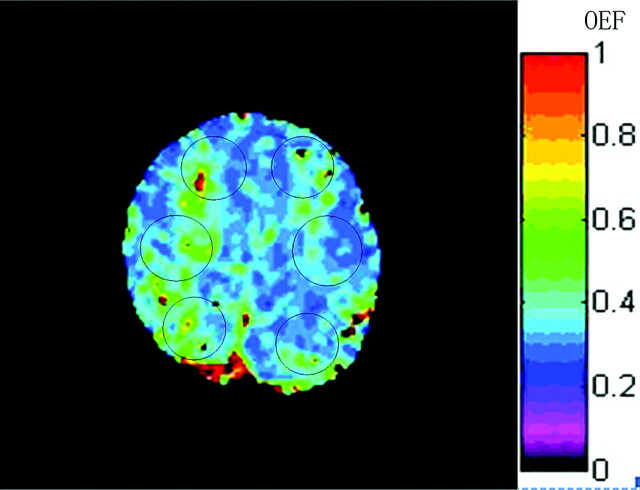
After OEF mapping was generated, 6 regions of interest were placed in the anterior, middle, and posterior parts of the bilateral hemispheres, which corresponded to the territory of the ACA, MCA, and borderzone of the MCA and posterior cerebral artery respectively (Fig 1). To minimize effects of large background magnetic field inhomogeneities, which usually resulted in geometric distortion in the spin-echo images and severe signal-intensity loss in the gradient-echo images, software in the analysis automatically excluded voxels with low signal intensity–to-noise ratios resulting from artifacts. To better match the region of interest and ischemic region, a radiologist slightly adjusted the location and size of some regions of interest. The size of regions of interest ranged from 390 to 630 mm2. OEF values of controls (mean ± SD) were obtained from healthy volunteers. The upper limit of the normal OEF range was defined as mean +2SDs of the controls. If the OEF value of the region of interest in the patient's brain was more than the upper limit, it was considered to be elevated and the region was assumed to have misery perfusion. CBF maps were also generated by using the software built in-house. To determine cerebral perfusion impairment, we calculated the ratios of the CBF (rCBF) in each region of interest of the ischemic side to that of contralateral side. If the ratio was <50%, it was defined as decreased.16
Fig 1.
Representative region-of-interest placement for OEF measurement in the study, shown on the OEF map from a patient. Each region of interest was placed in the anterior, middle, and posterior parts of bilateral hemispheres, which correspond to the territory of the ACA, MCA, and borderzone of the MCA and posterior cerebral artery, respectively. CBF was measured in the same way.
All data were expressed as mean ± SD. Comparison between the ipsilateral and contralateral sides was evaluated with a paired t test. A Student t test was used for the difference of the OEF between the regions of interest with and without decreased rCBF in the ipsilateral hemisphere, and a Pearson correlation was used to identify the relationship between the rCBF and OEF. P < .05 was considered to be statistically significant. Intrarater and interrater reliability were assessed by using interclass correlation coefficients of the OEF measured by 1 investigator twice and by 2 investigators. The coefficients of the OEF were 0.899 and 0.773 for intra- and interrater reliability, respectively.
Results
Clinical Features of the Subjects
Among the 23 patients selected, 13 were men and 10 were women, with ages from 42 to 72 years (mean age, 58.2 years). Demographic characteristics and clinical features of these patients are shown in the Table
Patient characteristics
| Characteristic | No. |
|---|---|
| Age (mean, yr) | 58.2 ± 8.5 |
| Male/female ratio | 13:10 |
| Vascular risk factors | |
| Hypertension (No.) (%) | 13 (57) |
| Hypercholesterolemia (No.) (%) | 9 (39) |
| Diabetes mellitus (No.) (%) | 8 (35) |
| Smoker (No.) (%) | 9 (39) |
There were 7 patients with occlusion of the ICA, 7 patients with severe stenosis of the ICA, and 9 patients with MCA stenosis or occlusion. Five male and 3 female healthy volunteers, who served as controls, were matched with patients for age (mean age, 57 years). They were confirmed to be free of cerebrovascular disease by conventional MR imaging and MRA.
Comparison of Ipsilateral and Contralateral Values
The cerebral OEF of healthy volunteers was 0.318 ± 0.023, and no significant difference was found among regions (F = 1.019, P = .366). The upper limit for normal OEF was defined as mean + 2 SDs, which was 0.364.
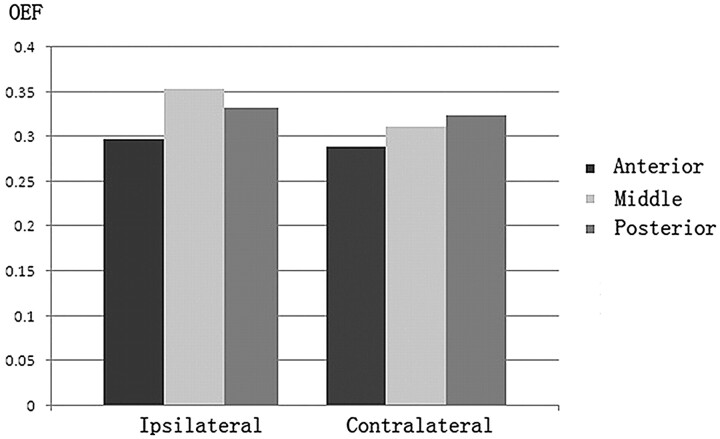
In the hemispheres ipsilateral to the vascular lesions, 22 of 69 regions of interest had a decreased regional CBF of <50% compared with the contralateral regions. Of these, 10 regions of interest were located in the middle and 7 were in the posterior parts. In the regions of interest of the ipsilateral side, OEF values were significantly increased relative to those of the contralateral side (0.328 ± 0.045 versus 0.308 ± 0.036, t = 3.632, P = .001). Of the anterior, middle, and posterior parts, OEF in the middle regions of interest was the highest (Fig 2).
Fig 2.
OEF of anterior, middle, and posterior regions of interest in the ipsilateral and contralateral hemispheres. Compared with the contralateral hemisphere, OEF was increased in the hemisphere ipsilateral to the vascular lesion.
Topographic Distribution of Misery Perfusion
Fourteen regions of interest with elevated OEF were determined in 9 patients in the ipsilateral hemispheres. Of these, 8 patients had ICA lesions and 1 patient had severe MCA stenosis. OEF was elevated in 9 regions of interest of the middle parts and 4 regions of interest of posterior parts. Only 1 region of interest in the anterior part showed an elevated OEF. In the contralateral hemispheres, 3 patients with ICA stenosis showed elevated OEF in 1 middle region of interest and 2 posterior regions of interest.
The Relationship of Cerebral Ischemia and OEF
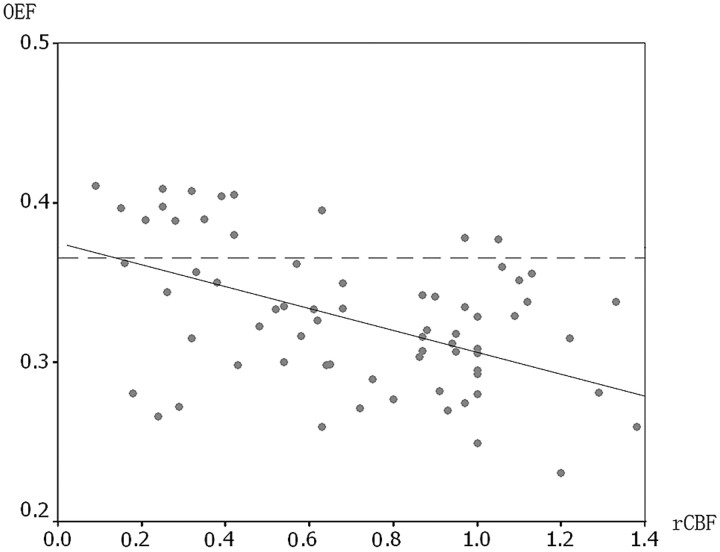
In the ipsilateral hemispheres, regions of interest with decreased rCBF had increased OEF (0.358 ± 0.048), which was significantly higher than that in other regions of interest (0.314 ± 0.035) (t = 3.887, P < .001). Significant correlation was detected between the rCBF and OEF in the ipsilateral hemisphere (r = −0.451, P < .001). Figure 3 illustrates the relationship between the 2 parameters. However, not all regions of interest with decreased rCBF were correspondent to regions with elevated OEF. Of 22 regions of interest with decreased rCBF, 11 (50%) exhibited normal OEF. On the other hand, 3 regions of interest without decreased rCBF had elevated OEF.
Fig 3.
Correlation between rCBF and OEF in the regions of interest of the hemisphere ipsilateral to the vascular lesion. The more the rCBF decreased, the more the OEF increased. The solid line is a reference reflecting the correlation coefficiency between rCBF and OEF. The dashed line in the graph represents the upper limit of the normal OEF. There are 14 regions of interest with elevated OEF in the ipsilateral hemispheres.
In the 14 patients with a unilateral ICA lesion, 6 had territory chronic infarction that could be detected on conventional MR imaging. Eight regions of interest with elevated OEF were found in the ipsilateral hemispheres of the 6 patients. A patient with MCA stenosis and territory infarction had no regions with misery perfusion. The other 8 patients without territory chronic infarction showed unremarkable findings or small lacunar infarctions in the semiovale center. Four regions of interest with elevated OEF were found in their ipsilateral hemispheres. χ2 testing revealed a significant effect of territory infarction on OEF increase in these patients (χ2 = 3.889, P = .049).
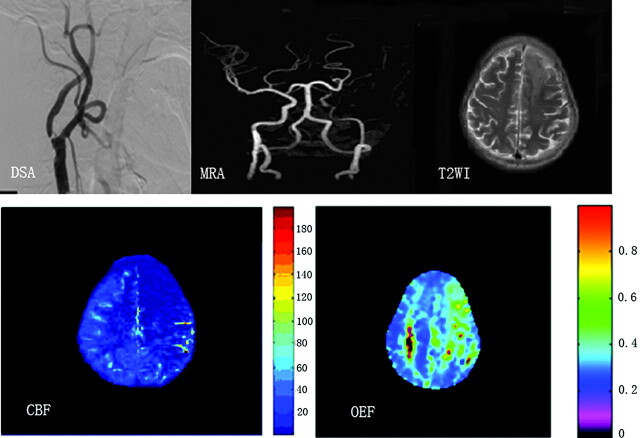
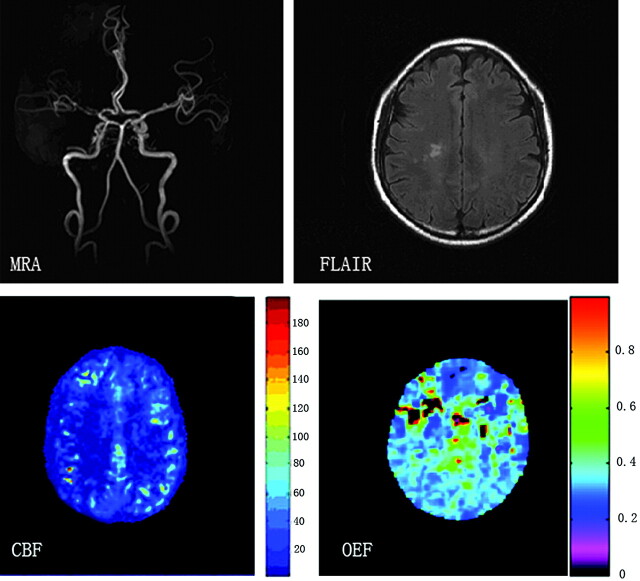
Figure 4 displays hemodynamic changes shown on CBF and OEF maps in a patient with left ICA stenosis. The patient had cerebral infarction 2 weeks before MR imaging. As we expected, prominent OEF increase can be detected in the ischemic brain region. Figure 5 shows mild hemodynamic impairment in a patient with severe stenosis of the right MCA.
Fig 4.
A patient with territory infarction 2 weeks earlier due to left ICA severe stenosis. DSA and MRA show severe stenosis of the left ICA and no visualization of the bilateral ACAs and left MCA. T2-weighted MR image shows a left frontal infarction (top right). Severe reduction of CBF is noted in the anterior and middle parts of the left hemisphere (bottom left), which shows a markedly elevated OEF (bottom right).
Fig 5.
A patient with severe MCA stenosis on MRA (top left). FLAIR image shows small ischemic foci in the right semiovale center (top right). Although severe CBF reduction is detected in the right MCA territory on the CBF map (bottom left), OEF is only slightly increased (0.350) in the corresponding region (bottom right).
Discussion
Estimate of the OEF by using BOLD MR imaging is now feasible by establishing an appropriate analytic model. As far as we know, this is the first report that investigates the OEF in patients with cerebral vascular disease by using an MR imaging technique. We found that OEF was significantly elevated in the hemisphere ipsilateral to the stenotic or occluded artery compared with the contralateral hemisphere, consistent with previous studies.4,5,17–19 This finding suggested the hemodynamic impairment in the hemisphere ipsilateral to the vascular lesion.
Furthermore, in the vulnerable hemisphere, regions with marked blood flow decrease showed significant increase of OEF in comparison with regions with relatively preserved flow. This indicated that MR imaging measurement of the OEF reflected metabolic change in cerebral ischemic tissue. When autoregulatory capacity is exceeded, blood flow decreases and OEF increases to maintain normal oxygen metabolism and function. In atherosclerotic carotid artery occlusion, OEF, CBF, and the regional cerebral metabolic rate for oxygen can change with time, depending on the collateral circulation. Among the anterior, middle, and posterior parts of the ipsilateral hemispheres, the hemodynamic impairment was most severe in the middle parts. It is likely due to improved flow in the anterior and posterior parts through the collateral channels. A flow-territory map in patients with symptomatic unilateral ICA occlusion showed that the nonoccluded contralateral ICA supplied the ACA and the vertebrobasilar arteries supplied the MCA flow territory on the side of the ICA occlusion, but the ipsilateral MCA flow territory was supplied to a lesser extent.20
In the present study, the hemodynamic impairment was not uniform in the patients with vascular disease. Patients with ICA lesions were at higher risk of having hemodynamic compromise than those with MCA lesions. It was reported that patients with chronic MCA occlusion tended to show increased OEF when other vascular lesions in the collateral pathways were present.18 Even in patients with ICA lesions, almost half can maintain the hemodynamic balance through collateral circulation. However, the presence of an open anterior communicating artery is essential in this situation. Besides, the contralateral arteries should be able to maintain enough blood flow. In unilateral ischemia, the contralateral brain could also have hemodynamic compromise due to the stealing effect. This was inferred in our results, which showed 3 regions of interest with elevated OEF contralateral to the sides of ICA lesion. Some authors also found elevated OEF in the contralateral side when they measured OEF by using PET in patients with a unilateral occlusive ICA or MCA.21
Our results indicated that chronic territory infarction had a significant effect on the OEF, because persistent hemodynamic impairment existed in these regions. In a previous study, a nearly significant increase of regional OEF with lowered rCBF and regional cerebral metabolic rate for oxygen was observed in the peri-infarct zone of patients with territorial infarcts, while no change in rCBF and relative OEF was detected in patients with borderzone infarcts.22 Ischemic brain tissues may undergo different pathophysiologic changes. According to previous studies, moderate and chronic cerebral ischemia due to occlusive carotid artery disease may lead to selective neuronal loss and subsequent down-regulation of oxygen metabolism, re-establishing a flow—metabolism balance at a lower level than the normal condition in the area with a reduced CBF and normal cerebrovascular reactivity.23 Besides, once infarction has occurred, the metabolic needs of the tissue are reduced. Because blood flow and tissue metabolism are closely matched, less blood flow will be required and oxygen metabolism will be down-regulated in response to reduced perfusion pressure and tissue damage.24 In contrast, patients who have an increased regional OEF in the cerebral hemisphere ipsilateral to the carotid artery occlusion are at a high risk of recurrent stroke.25 While a hemodynamic mechanism was clearly implicated in the infarction, Caplan and Hennerici26 emphasized the interaction of hypoperfusion and embolization—that is, decreased perfusion reduces the washout and clearance of emboli that enter the vascular bed of hypoperfused regions.
ASL was used to provide the information about CBF in our study. Although this technique can be used to measure CBF quantitatively without administration of contrast agent, its accuracy is highly affected by many factors, such as signal intensity–to-noise ratio and transit time.27–29 ASL does not allow reliable detection of white matter perfusion signal intensity,29 so we calculated rCBF to minimize the measurement error. However, the delayed arrival of blood flow to the ischemic region may lead to underestimation of the ipsilateral side. Therefore, the severity of ischemia was overestimated in our study, even if rCBF was used. On the other hand, rCBF may be overestimated if contralateral brain ischemia was present.
The main limitation of this study is that though MR imaging measurement of OEF was successfully conducted in patients with brain ischemia, its accuracy had not been tested with PET measurement of oxygen metabolism. The values of OEF in our study were relatively lower than those of PET studies reported, which were mostly around 0.4–0.5. Perhaps the incoherence was induced by the analytic model. To obtain a quantitative measurement of cerebral blood oxygen saturation, one must have a known hematocrit. In the analytic model, a constant hematocrit of 0.42 was used. Consequently, errors induced by the inaccuracy of hematocrit will contribute directly to the estimates of OEF. Under the pathologic conditions of brain ischemia, the error may cause underestimation of OEF in the ischemic brain tissue because hematocrit in the local small vessel would decrease to some extent.30 Another potential error comes from paramagnetic sources other than deoxyhemoglobin, which can induce an additional signal-intensity loss in MR images. Therefore, the presence of hemosiderin may lead to an unavoidable error in the measurement of OEF in the local brain. In our study, the voxels with microbleeding in the regions of interest were excluded from measurement automatically in the analysis process.
Conclusions
In patients with severe atherosclerotic ICA or MCA disease, hemodynamic compromise demonstrated as an elevated OEF was detected by using an MR imaging technique. The GESSE sequence provided us reasonable results in patients with unilateral steno-occlusive ICA or MCA disease. Identification of misery perfusion with MR imaging may be promising in the treatment of atherosclerotic ICA or MCA disease. It will be helpful in the selection of patients undergoing vascular reconstruction surgery. OEF MR imaging may become a tool for quantitatively evaluating the success of future therapeutic interventions for brain ischemia. Future work is needed to validate the MR imaging measurement of OEF in the various brain ischemic conditions.
Acknowledgments
We thank An HongYu, MD, for providing technical assistance in this study, and Zhang Yong, MD, from Global Applied Science Laboratory, GE Healthcare China, for his assistance in the revision.
Abbreviations
- ACA
anterior cerebral artery
- ASL
arterial spin-labeling
- BOLD
blood oxygen level–dependent
- CBF
cerebral blood flow
- DSA
digital subtraction angiography
- FLAIR
fluid-attenuated inversion recovery
- GESSE
gradient-echo sampling spin-echo
- ICA
internal carotid artery
- MCA
middle cerebral artery
- MRA
MR angiography
- OEF
oxygen extraction fraction
- PET
positron-emission tomography
- rCBF
relative cerebral blood flow
Footnotes
Disclosures: Qing Peng, Other Financial Interests: Pfizer.
References
- 1. Baron JC, Bousser MG, Rey A, et al. Reversal of focal “misery perfusion syndrome” by extraintracranial artery bypass in hemodynamic cerebral ischemia: a case study with O15 positron emission tomography. Stroke 1981;12:454–59 [DOI] [PubMed] [Google Scholar]
- 2. Derdeyn CP, Videen TO, Yundt KD, et al. Variability of cerebral blood volume and oxygen extraction: stages of cerebral haemodynamic impairment revisited. Brain 2002;125 (pt 3):595–607 [DOI] [PubMed] [Google Scholar]
- 3. Powers WJ, Press GA, Grubb RL, Jr, et al. The effect of hemodynamically significant carotid artery disease on the hemodynamic status of the cerebral circulation. Ann Intern Med 1987;106:27–35 [DOI] [PubMed] [Google Scholar]
- 4. Yamauchi H, Fukuyama H, Nagahama Y, et al. Significance of increased oxygen extraction fraction in five-year prognosis of major cerebral arterial occlusive diseases. J Nucl Med 1999;40:1992–98 [PubMed] [Google Scholar]
- 5. Grubb RL, Jr, Derdeyn CP, Fritsch SM, et al. The importance of hemodynamic factors in the prognosis of symptomatic carotid occlusion. JAMA 1998;280:1055–60 [DOI] [PubMed] [Google Scholar]
- 6. Hasegawa Y, Yamaguchi T, Tsuchiya T, et al. Sequential change of hemodynamic reserve in patients with major cerebral artery occlusion or severe stenosis. Neuroradiology 1992;34:15–21 [DOI] [PubMed] [Google Scholar]
- 7. Yokota C, Hasegawa Y, Minematsu K, et al. Effect of acetazolamide reactivity on [corrected] long-term outcome in patients with major cerebral artery occlusive diseases. Stroke 1998;29:640–44 [DOI] [PubMed] [Google Scholar]
- 8. Klijn CJ, Kappelle LJ, van Huffelen AC, et al. Recurrent ischemia in symptomatic carotid occlusion: prognostic value of hemodynamic factors. Neurology 2000;55:1806–12 [DOI] [PubMed] [Google Scholar]
- 9. Fisher M, Sotak CH, Minematsu K, et al. New magnetic resonance techniques for evaluating cerebrovascular disease. Ann Neurol 1992;32:115–22 [DOI] [PubMed] [Google Scholar]
- 10. Brown MM, Wade JP, Bishop CC, et al. Reactivity of the cerebral circulation in patients with carotid occlusion. J Neurol Neurosurg Psychiatry 1986;49:899–904 [DOI] [PMC free article] [PubMed] [Google Scholar]
- 11. Nöth U, Kotajima F, Deichmann R, et al. Mapping of the cerebral vascular response to hypoxia and hypercapnia using quantitative perfusion MRI at 3 T. NMR Biomed 2008;21:464–72 [DOI] [PubMed] [Google Scholar]
- 12. Geisler BS, Brandhoff F, Fiehler J, et al. Blood oxygen level–dependent MRI allows metabolic description of tissue at risk in acute stroke patients. Stroke 2006;37:1778–84 [DOI] [PubMed] [Google Scholar]
- 13. An H, Lin W. Impact of intravascular signal on quantitative measures of cerebral oxygen extraction and blood volume under normo- and hypercapnic conditions using an asymmetric spin echo approach. Magn Reson Med 2003;50:708–16 [DOI] [PubMed] [Google Scholar]
- 14. Petersen ET, Zimine I, Ho YC, et al. Non-invasive measurement of perfusion: a critical review of arterial spin labelling techniques. Br J Radiol 2006;79:688–701 [DOI] [PubMed] [Google Scholar]
- 15. An H, Lin W. Quantitative measurements of cerebral blood oxygen saturation using magnetic resonance imaging. J Cereb Blood Flow Metab 2000;20:1225–36 [DOI] [PMC free article] [PubMed] [Google Scholar]
- 16. Astrup J, Seisjo BK, Symon L. Thresholds in cerebral ischemia: the ischemic penumbra. Stroke 1981;12:723–25 [DOI] [PubMed] [Google Scholar]
- 17. Derdeyn CP, Grubb RL, Jr, Powers WJ. Cerebral hemodynamic impairment: methods of measurement and association with stroke risk. Neurology 1999;53:251–59 [DOI] [PubMed] [Google Scholar]
- 18. Tanaka M, Shimosegawa E, Kajimoto K, et al. Chronic middle cerebral artery occlusion: a hemodynamic and metabolic study with positron-emission tomography. AJNR Am J Neuroradiol 2008;29:1841–46 [DOI] [PMC free article] [PubMed] [Google Scholar]
- 19. Hokari M, Kuroda S, Shiga T, et al. Combination of a mean transit time measurement with an acetazolamide test increases predictive power to identify elevated oxygen extraction fraction in occlusive carotid artery diseases. J Nucl Med 2008;49:1922–27 [DOI] [PubMed] [Google Scholar]
- 20. van Laar PJ, Hendrikse J, Klijn CJ, et al. Symptomatic carotid artery occlusion: flow territories of major brain-feeding arteries. Radiology 2007;242:526–34 [DOI] [PubMed] [Google Scholar]
- 21. Arakawa S, Minematsu K, Hirano T, et al. Topographic distribution of misery perfusion in relation to internal and superficial borderzones. AJNR Am J Neuroradiol 2003;24:427–35 [PMC free article] [PubMed] [Google Scholar]
- 22. De Reucka J, Paemeleire K, Decoo D, et al. Cerebral blood flow and oxygen metabolism in borderzone and territorial infarcts due to symptomatic carotid artery occlusion. Euro J Neurol 2004;11:225–30 [DOI] [PubMed] [Google Scholar]
- 23. Kuroda S, Shiga T, Ishikawa T, et al. Reduced blood flow and preserved vasoreactivity characterize oxygen hypometabolism due to incomplete infarction in occlusive carotid artery diseases. J Nucl Med 2004;45:943–49 [PubMed] [Google Scholar]
- 24. van der Grond J, Eikelboom BC, Mali WP. Flow-related anaerobic metabolic changes in patients with severe stenosis of the internal carotid artery. Stroke 1996;27:2026–32 [DOI] [PubMed] [Google Scholar]
- 25. Derdeyn CP, Khosla A, Videen TO, et al. Severe hemodynamic impairment and borderzone-region infarction. Radiology 2001;220:195–201 [DOI] [PubMed] [Google Scholar]
- 26. Caplan LR, Hennerici M. Impaired clearance of emboli (washout) is an important link between hypoperfusion, embolism, and ischemic stroke. Arch Neurol 1988;55:1475–82 [DOI] [PubMed] [Google Scholar]
- 27. Carroll TJ, Teneggi V, Jobin M, et al. Absolute quantification of cerebral blood flow with magnetic resonance, reproducibility of the method, and comparison with H215O positron emission tomography. J Cereb Blood Flow Metab 2002;22:1149–56 [DOI] [PubMed] [Google Scholar]
- 28. Qiu M, Paul Maguire R, Arora J, et al. Arterial transit time effects in pulsed arterial spin labeling CBF mapping: insight from a PET and MR study in normal human subjects. Magn Reson Med 2010;63:374–84 [DOI] [PMC free article] [PubMed] [Google Scholar]
- 29. Van Osch MJ, Teeuwisse WM, Van Walderveen MA, et al. Can arterial spin labeling detect white matter perfusion signal? Magn Reson Med 2009;62:165–73 [DOI] [PubMed] [Google Scholar]
- 30. Yamauchi H, Fukuyama H, Nagahama Y, et al. Cerebral hematocrit decreases with hemodynamic compromise in carotid artery occlusion: a PET study. Stroke 1998;29:98–103 [DOI] [PubMed] [Google Scholar]


